Abstract
Vegetation, as a fundamental component of terrestrial ecosystems, plays a pivotal role in the flux of water, heat, and nutrients between the lithosphere, biosphere, and atmosphere. Assessing the impacts of climate change and human activities on vegetation dynamics is essential for maintaining the health and stability of fragile ecosystems, such as the Yarlung Zangbo River (YZR) basin of the Tibetan Plateau, the highest-elevation river basin in the world. Vegetation responses to climate change are inherently asymmetric, characterized by distinct temporal effects. However, these temporal effects remain poorly understood, particularly in high-altitude ecosystems. Here, we examine the spatiotemporal changes in leaf area index (LAI) and four climatic factors—air temperature, precipitation, potential evapotranspiration, and solar radiation—in the YZR basin over the period 2000–2019. We further explore the time-lag and time-accumulation impacts of these climatic factors on LAI dynamics and apply an enhanced residual trend analysis to disentangle the relative contributions of climate change and human activities. Results indicated that (1) a modest increase in annual LAI at a rate of 0.02 m2 m−2 dec−1 was detected across the YZR basin. Spatially, LAI increased in 66% of vegetated areas, with significant increases (p < 0.05) in 10% of the basin. (2) Temperature, precipitation, and potential evapotranspiration exhibited minimal time-lag (<0.5 months) but pronounced notable time-accumulation effects on LAI variations, with accumulation periods ranging from 1 to 2 months. In contrast, solar radiation demonstrated significant time-lag impacts, with an average lag period of 2.4 months, while its accumulation effects were relatively weaker. (3) Climate change and human activities contributed 0.023 ± 0.092 and –0.005 ± 0.109 m2 m−2 dec−1 to LAI changes, respectively, accounting for 60% and 40% on the observed variability. Spatially, climate change accounted for 85% of the changes in LAI in the upper YZR basin, while vegetation dynamics in the lower basin was primarily driven by human activities, contributing 63%. In the middle basin, vegetation dynamics were influenced by the combined effects of climate change and human activities. Our findings deepen insights into the drivers of vegetation dynamics and provide critical guidance for formulating adaptive management strategies in alpine ecosystems.
1. Introduction
Vegetation is a crucial component of terrestrial ecosystems, regulating biogeochemical and hydrological cycles by influencing water, heat, and nutrient exchanges between the lithosphere, biosphere, and atmosphere [1,2,3]. Recent satellite observations have documented a sustained vegetation greening at regional and global scales, primarily driven by CO2 fertilization, climate warming, and extensive ecological restoration efforts [4,5,6]. This widespread vegetation greening has profoundly impacted terrestrial hydrological cycles [7,8,9], leading to increased evapotranspiration [9,10], reduced soil moisture [11], decreased runoff [12], and significantly shifts in regional albedo and surface temperatures [13,14,15]. Climate change (CC) and human activities (HAs) jointly influence vegetation dynamics. Quantifying the relative contributions of CC and HAs on vegetation growth is crucial for predicting ecosystem behavior under changing environmental conditions and formulating sustainable water and land management strategies.
Temperature (TEM) and precipitation (PRE), solar radiation (SRD), and potential evapotranspiration (PET) have been regarded as key climatic drivers of vegetation dynamics [16,17,18,19]. The responses of vegetation growth to CC exhibit temporal effect [20,21,22]. The lag and accumulation effects of CC are crucial for understanding vegetation dynamics. Time-lag effects arise because vegetation typically responds to climatic changes with a delay, as physiological processes in plants require time to adapt to variations in PRE, TEM, and other factors [21]. For instance, anomalies in PRE or TEM can induce vegetation stress that manifests several months later, demonstrating that CC impacts vegetation growth with a delayed response over a lag period [23,24]. On the other hand, the time-accumulation effect represents the cumulative influence of climatic conditions on vegetation over time [20]. This effect suggests that vegetation responds not only to current climatic conditions but also to those from previous months, emphasizing the critical role of accumulated water availability and prolonged heat stress in shaping vegetation health [25]. A growing body of studies have focused on the temporal effects of CC on vegetation dynamics from regional [22,24,26] to global scales [20,27]. For example, Wu et al. (2015) found that incorporating time-lag effects resulted in climatic factors accounting for 64% of the variation in global vegetation, representing an 11% relative increase compared to analyses that excluded these effects [27]. Ding et al. (2020) reported that accounting for time-lag, time-accumulation, and their combined effects enhanced the explanatory power of CC for global NDVI variability by 17%, 15%, and 19%, respectively [20]. However, the temporal effects of dominant climatic factors on vegetation growth varies across different vegetation types and growth stages [22,26,28]. Accounting for temporal effects provides a comprehensive perspective on vegetation responses, capturing the delayed and cumulative impacts of climatic variability on vegetation productivity, resilience, and ecosystem dynamics.
HAs have significantly shaped vegetation dynamics through processes such as increased carbon dioxide (CO2) emissions and changes in land use patterns. Elevated atmospheric CO2 concentrations, driven by industrial activities and fossil fuel combustion, enhance vegetation growth by increasing photosynthetic rates, particularly in C3 plants, thereby boosting biomass and primary productivity [29]. However, the fertilization effect is complex and often constrained by limiting factors such as nutrient availability and water stress [30]. Simultaneously, land use changes—including deforestation, urbanization, and agricultural expansion—alter vegetation by replacing natural ecosystems with anthropogenic landscapes [31,32]. These changes often result in habitat fragmentation, biodiversity loss, and reduced carbon storage capacity, profoundly reshaping local and regional vegetation patterns [33]. On the other hand, ecological restoration efforts, such as reforestation and habitat recovery, enhance biodiversity and restore ecosystem services, thereby mitigating some of the negative impacts of land-use changes [34,35,36].
The Tibetan Plateau (TP), often referred to as the “Roof of the World”, the “Third Pole”, and the “Asian Water Tower” [37,38], plays a critical role in ensuring water security for billions of downstream populations [39]. The TP’s ecosystem is highly fragile, characterized by its harsh climate, low temperatures, and limited soil fertility, making it particularly susceptible to disturbances. Its sensitivity to CC stems from its alpine environment, where even slight changes in temperature or precipitation can induce substantial ecological impacts [40,41,42]. The TP has experienced pronounced warming, with temperatures rising approximately twice the global average over the past several decades [38,43]. Simultaneously, precipitation patterns have shifted, with increases observed in the northwest and declines in the south [44,45]. Satellite-based estimates reveal a general increase in the normalized difference vegetation index (NDVI) across the TP since the 1980s, with an overall rate of approximately 0.001 yr−1 from 1981 to 2020 [46]. Numerous studies demonstrate that CC directly influences vegetation dynamics across the TP. Over recent decades, vegetation in the high altitudes of the Central TP and the Southwestern TP has increased, driven by a warm–humid climatic trend [47]. Increased PRE promoted vegetation greening in the northwest TP, while rising TEM facilitated vegetation growth in the southeast TP [48,49]. Vegetation dynamics’ response to TEM and PRE often exhibit time-lag and time-accumulation impacts spanning 1 to 3 months on the TP [26,50,51]. In recent decades, HAs have exerted an increasingly significant influence on vegetation dynamics across the TP. For example, Liu et al. (2023) reported that HAs accounted for 41% of the total NDVI variations on the TP, contributing 0.0003 yr−1 to its variations [52]. Degraded vegetation is predominantly distributed in the Eastern TP and the Northern TP, where livestock and human population densities are high [47]. Additionally, ecological restoration efforts have resulted in vegetation greening across 13.1% to 23.1% of the TP [53]. However, the temporal effects vary significantly across sub-regions of the TP [54]. Therefore, a systematic investigation of the lag and cumulative effects of climate change on vegetation dynamics in representative sub-regions of the TP remains essential. The Yarlung Zangbo River (YZR) basin, situated in the south-central TP, is the world’s highest-altitude river basin, providing a unique case study for understanding climate–vegetation–hydrology interactions, owing to its complex terrain, diverse vegetation, and notable human activities. Studying vegetation changes and their driving factors in this representative basin provides critical insights for the adaptive management of fragile alpine ecosystems. Despite its significance, comprehensive studies on vegetation dynamics and their responses to CC incorporated with temporal effects and HAs remain scarce in this basin. The study aims to: (1) investigate the spatiotemporal variations in vegetation leaf area index (LAI) and climatic factors (PRE, TEM, PET, and SRD) in the YZR basin from 2000 to 2019; (2) reveal the temporal (lagged and cumulative) impacts of climatic factors on LAI changes; (3) disentangle the relative contributions of CC and HAs to vegetation dynamics in the YZR basin.
2. Data and Methods
2.1. Study Area
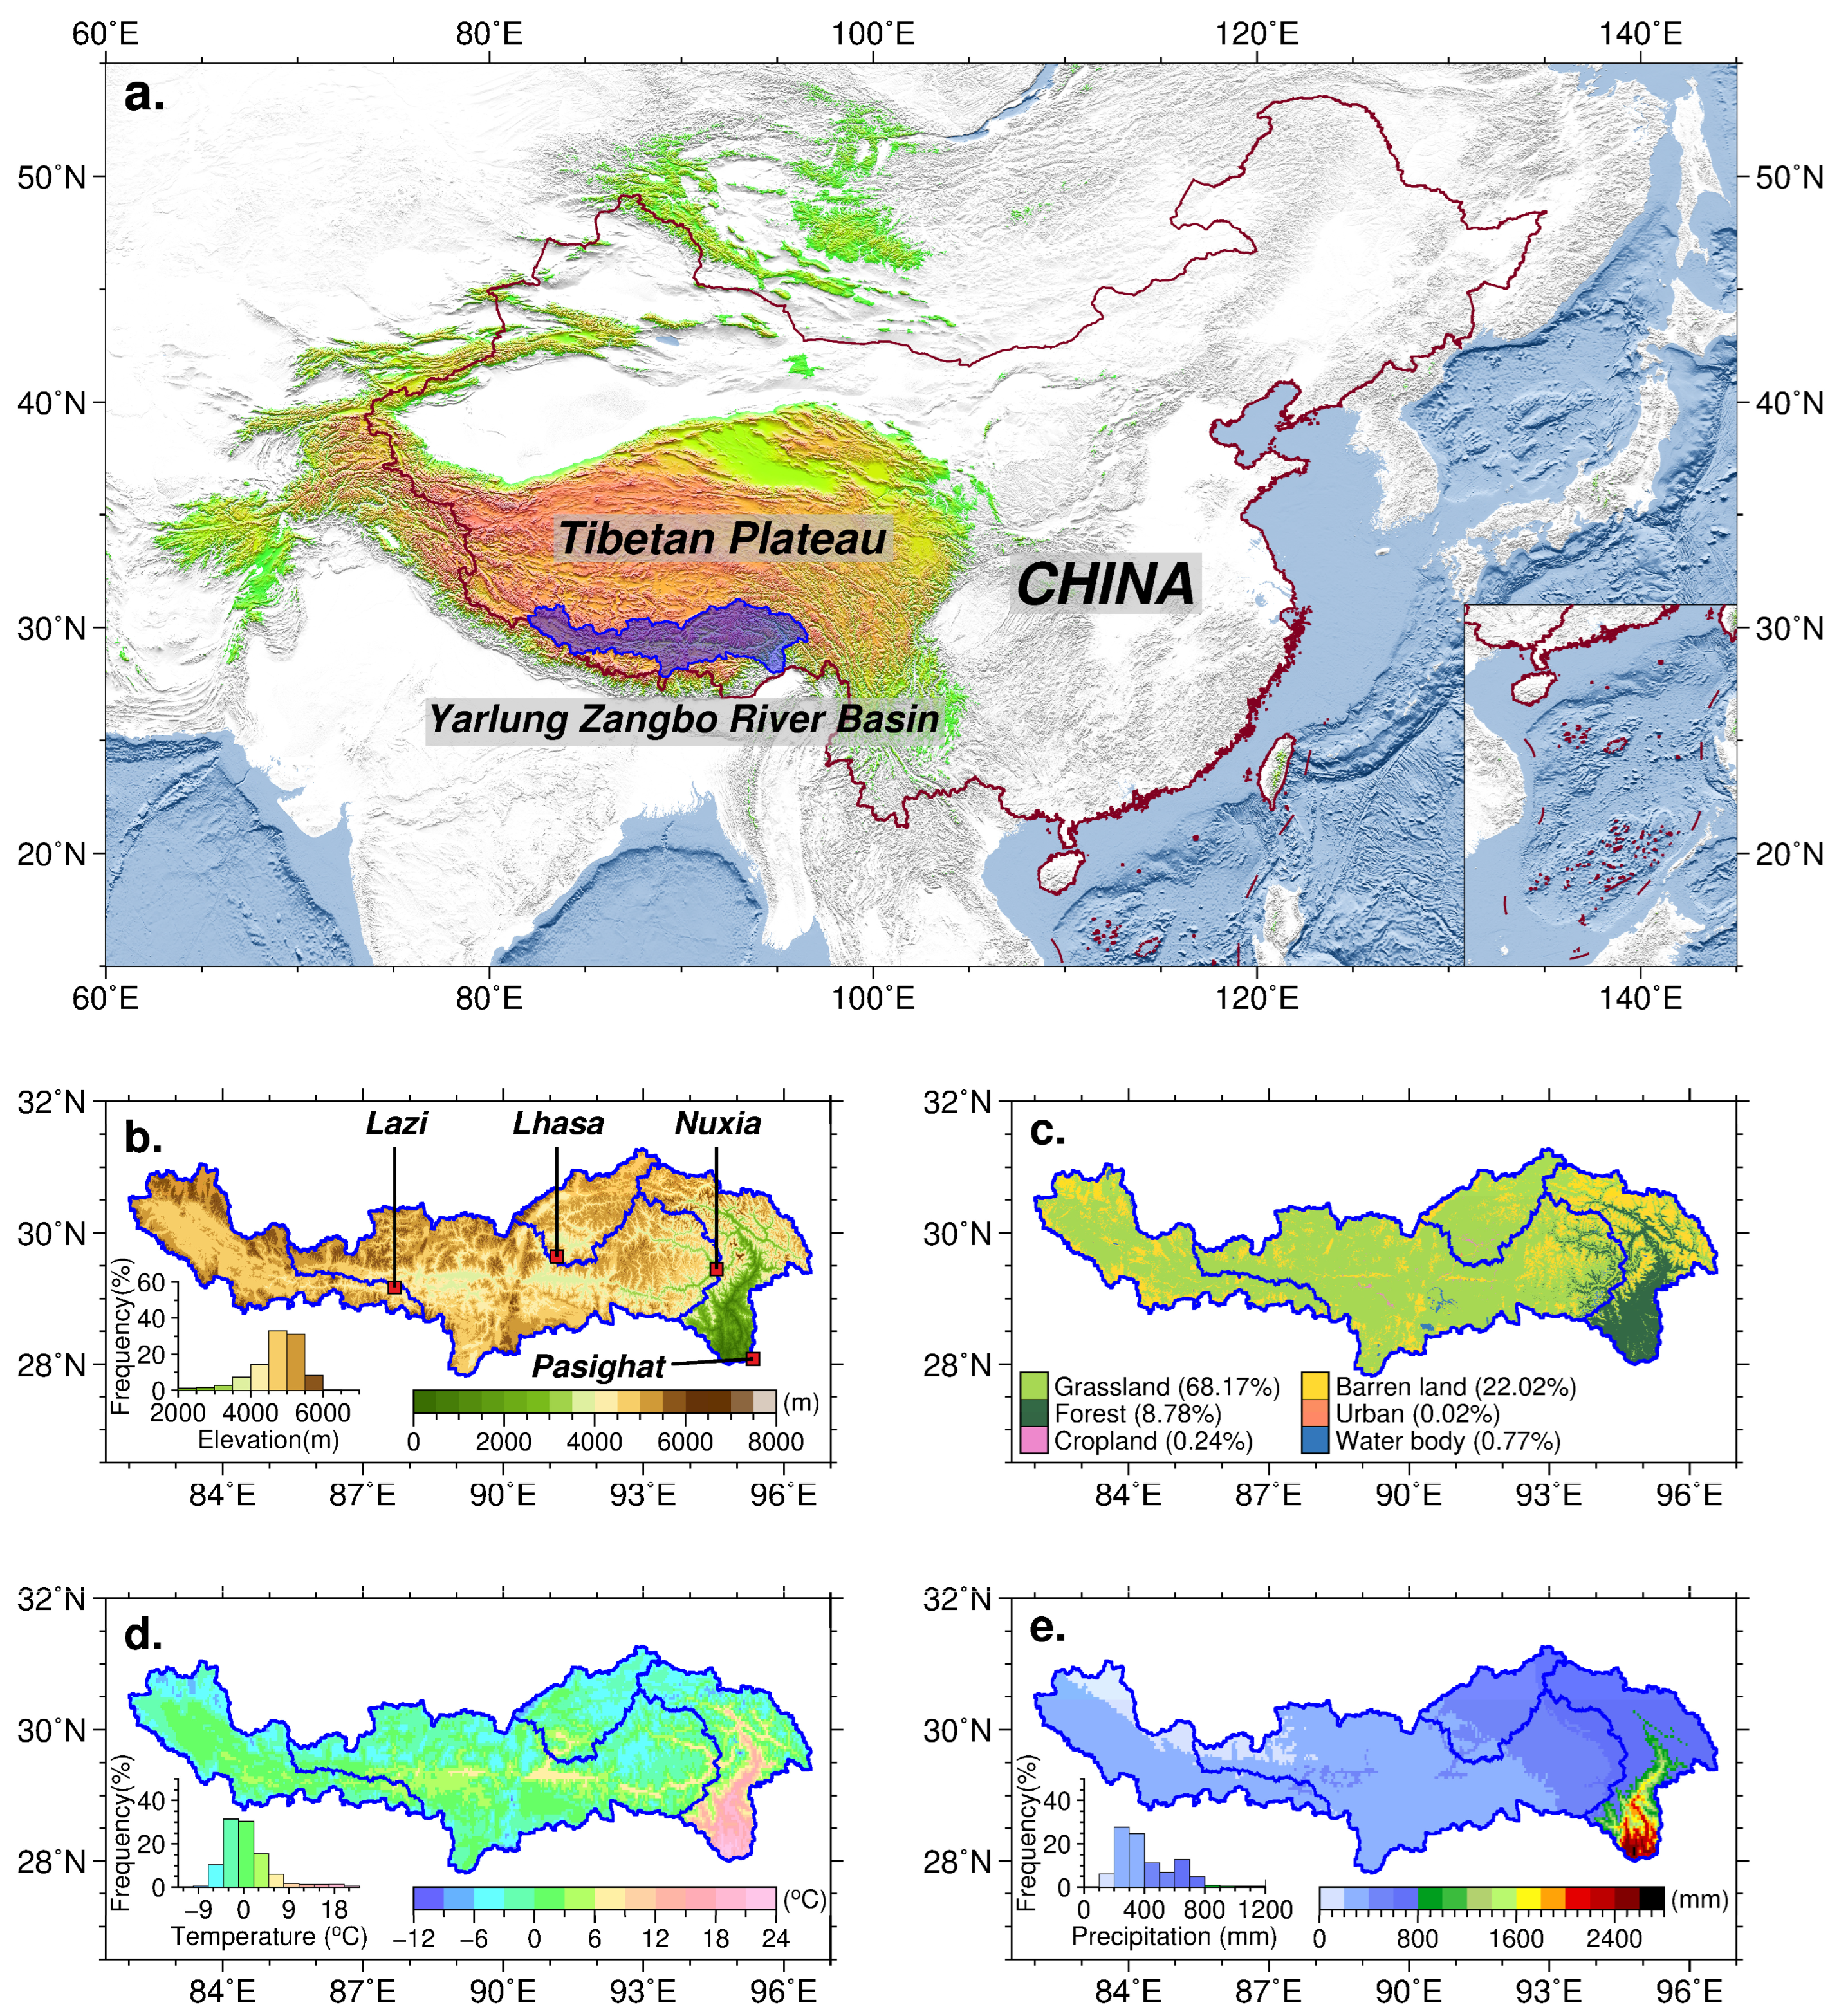
The YZR basin, located in the south-central TP (27–32°N, 81–98°E), covers a drainage area of ~240,000 km2. As the highest river basin on the TP, the YZR features an average elevation of over 4500 m (Figure 1a,b). The YZR’s climate is primarily influenced by and the westerlies in winter and the Indian monsoon in summer. Annual mean air temperatures vary from −11.0 °C to 21.1 °C, averaging −2.3 °C across the basin (Figure 1d). Precipitation exhibits a distinct northwest–southeast gradient, ranging from ~4000 mm in the humid southeast to ~300 mm in the arid northwest, with a basin-wide average of ~428 mm (Figure 1e). The basin’s varied climate and intricate topography sustain diverse ecosystems, including rainforests, coniferous forests, broadleaf forests, shrublands, grasslands, and meadows, transitioning from southeast to northwest (Figure 1c). To facilitate detailed analyses of vegetation dynamics and their drivers, the YZR is divided into four subbasins: Lazi (LZ), Lhasa (LS), Lazi-Nuxia (NX), and Nuxia-Pasighat (PS) (Figure 1b), organized from west to east based on differences in precipitation and ecosystems.

Figure 1.
Overview of the study area and its environmental characteristics. (a) Location of the YZR basin on the TP. (b) Elevation distribution across the basin. (c) Land use/cover composition. (d) Mean annual temperature distribution and (e) mean annual precipitation distribution derived from WorldClim Historical Monthly Weather Data (1980–2019) at a spatial resolution of 2.5 min (https://worldclim.org/data/monthlywth.html (accessed on 26 November 2024)).
2.2. Datasets
2.2.1. Vegetation Datasets
Vegetation datasets include LAI and vegetation classification, derived from Moderate Resolution Imaging Spectroradiometer (MODIS) products, which were primarily designed and developed by NASA’s Goddard Space Flight Center in Greenbelt of the United States. The 500 m LAI data, derived from MCD15A2H.006 (https://lpdaac.usgs.gov/products/mcd15a2hv006/ (accessed on 26 November 2024)), covers the period from 18 February 2000 to 31 December 2019, with an 8-day temporal resolution, and was used to analyze the spatiotemporal dynamics of vegetation across the YZR basin. This 20-year period aligns with the availability of MODIS data, which began in 2000. A minimum of 20 years is generally required to reliably detect linear trends and minimize the influence of short-term variability [55]. Vegetation classification data, sourced from the MCD12Q1.006 product (https://lpdaac.usgs.gov/products/mcd12q1v006/ (accessed on 26 November 2024)), offer annual land-use/cover classifications at a 500 m resolution for the period 2001 to 2019. These data were used to assess land-use transitions in the YZR basin from 2001 to 2019.
2.2.2. Meteorological Datasets
Monthly meteorological variables (PRE, TEM, PET, and SRD) were obtained from the ERA5-Land reanalysis dataset, covering the period from 2000 to 2019 at a 0.1° spatial resolution (https://cds.climate.copernicus.eu/datasets/reanalysis-era5-land-monthly-means?tab=overview (accessed on 26 November 2024)). This period was selected to align with the MODIS LAI data, ensuring consistency between the climatic variables and vegetation data. These ERA5-Land data were used to analyze climate change in the YZR basin, assess time-lag and time-accumulation impacts of climate factors on LAI changes, and determine the relative importance of CC and HAs to vegetation dynamic.
2.2.3. Data Preprocessing
The 500 m resolution LAI data were resampled to the 0.1° spatial resolution of ERA5-Land climatic variables using a bilinear interpolation method. The 8-day LAI data were aggregated into monthly values using the maximum value composite approach [56]. At a monthly scale, we examined the time-lag and time-accumulation effects of PRE, TEM, PET, and SRD on vegetation LAI in the YZR basin. A residual trend analysis model incorporating temporal effects was then developed at the monthly scale to quantify the relative contributions of climate change and human activities to vegetation dynamics within the basin.
2.3. Methods
2.3.1. Analysis of Temporal Trend
The temporal changes in LAI and four climatic variables in the YZR from 2000 to 2019 were analyzed using linear regression method. The linear trend for each variable was determined by the least squares model, as described in Equation (1). Annual values of TEM and SRD were derived by averaging monthly values, while annual PRE and PET were calculated by summing monthly totals for each year. Finally, grid-by-grid trend analyses were conducted for both LAI and the four climatic factors across the YZR basin.
where represents the linear slope of factor ; is the value of factor in the i-th year; denotes the sequential year index; and is the total number of years. A negative slope indicates a decreasing trend, while a positive slope reflects an increasing trend. The statistical significance of the slope was evaluated using the F-test.
2.3.2. Analysis of Temporal Effects of Climatic Factors on Vegetation Dynamics
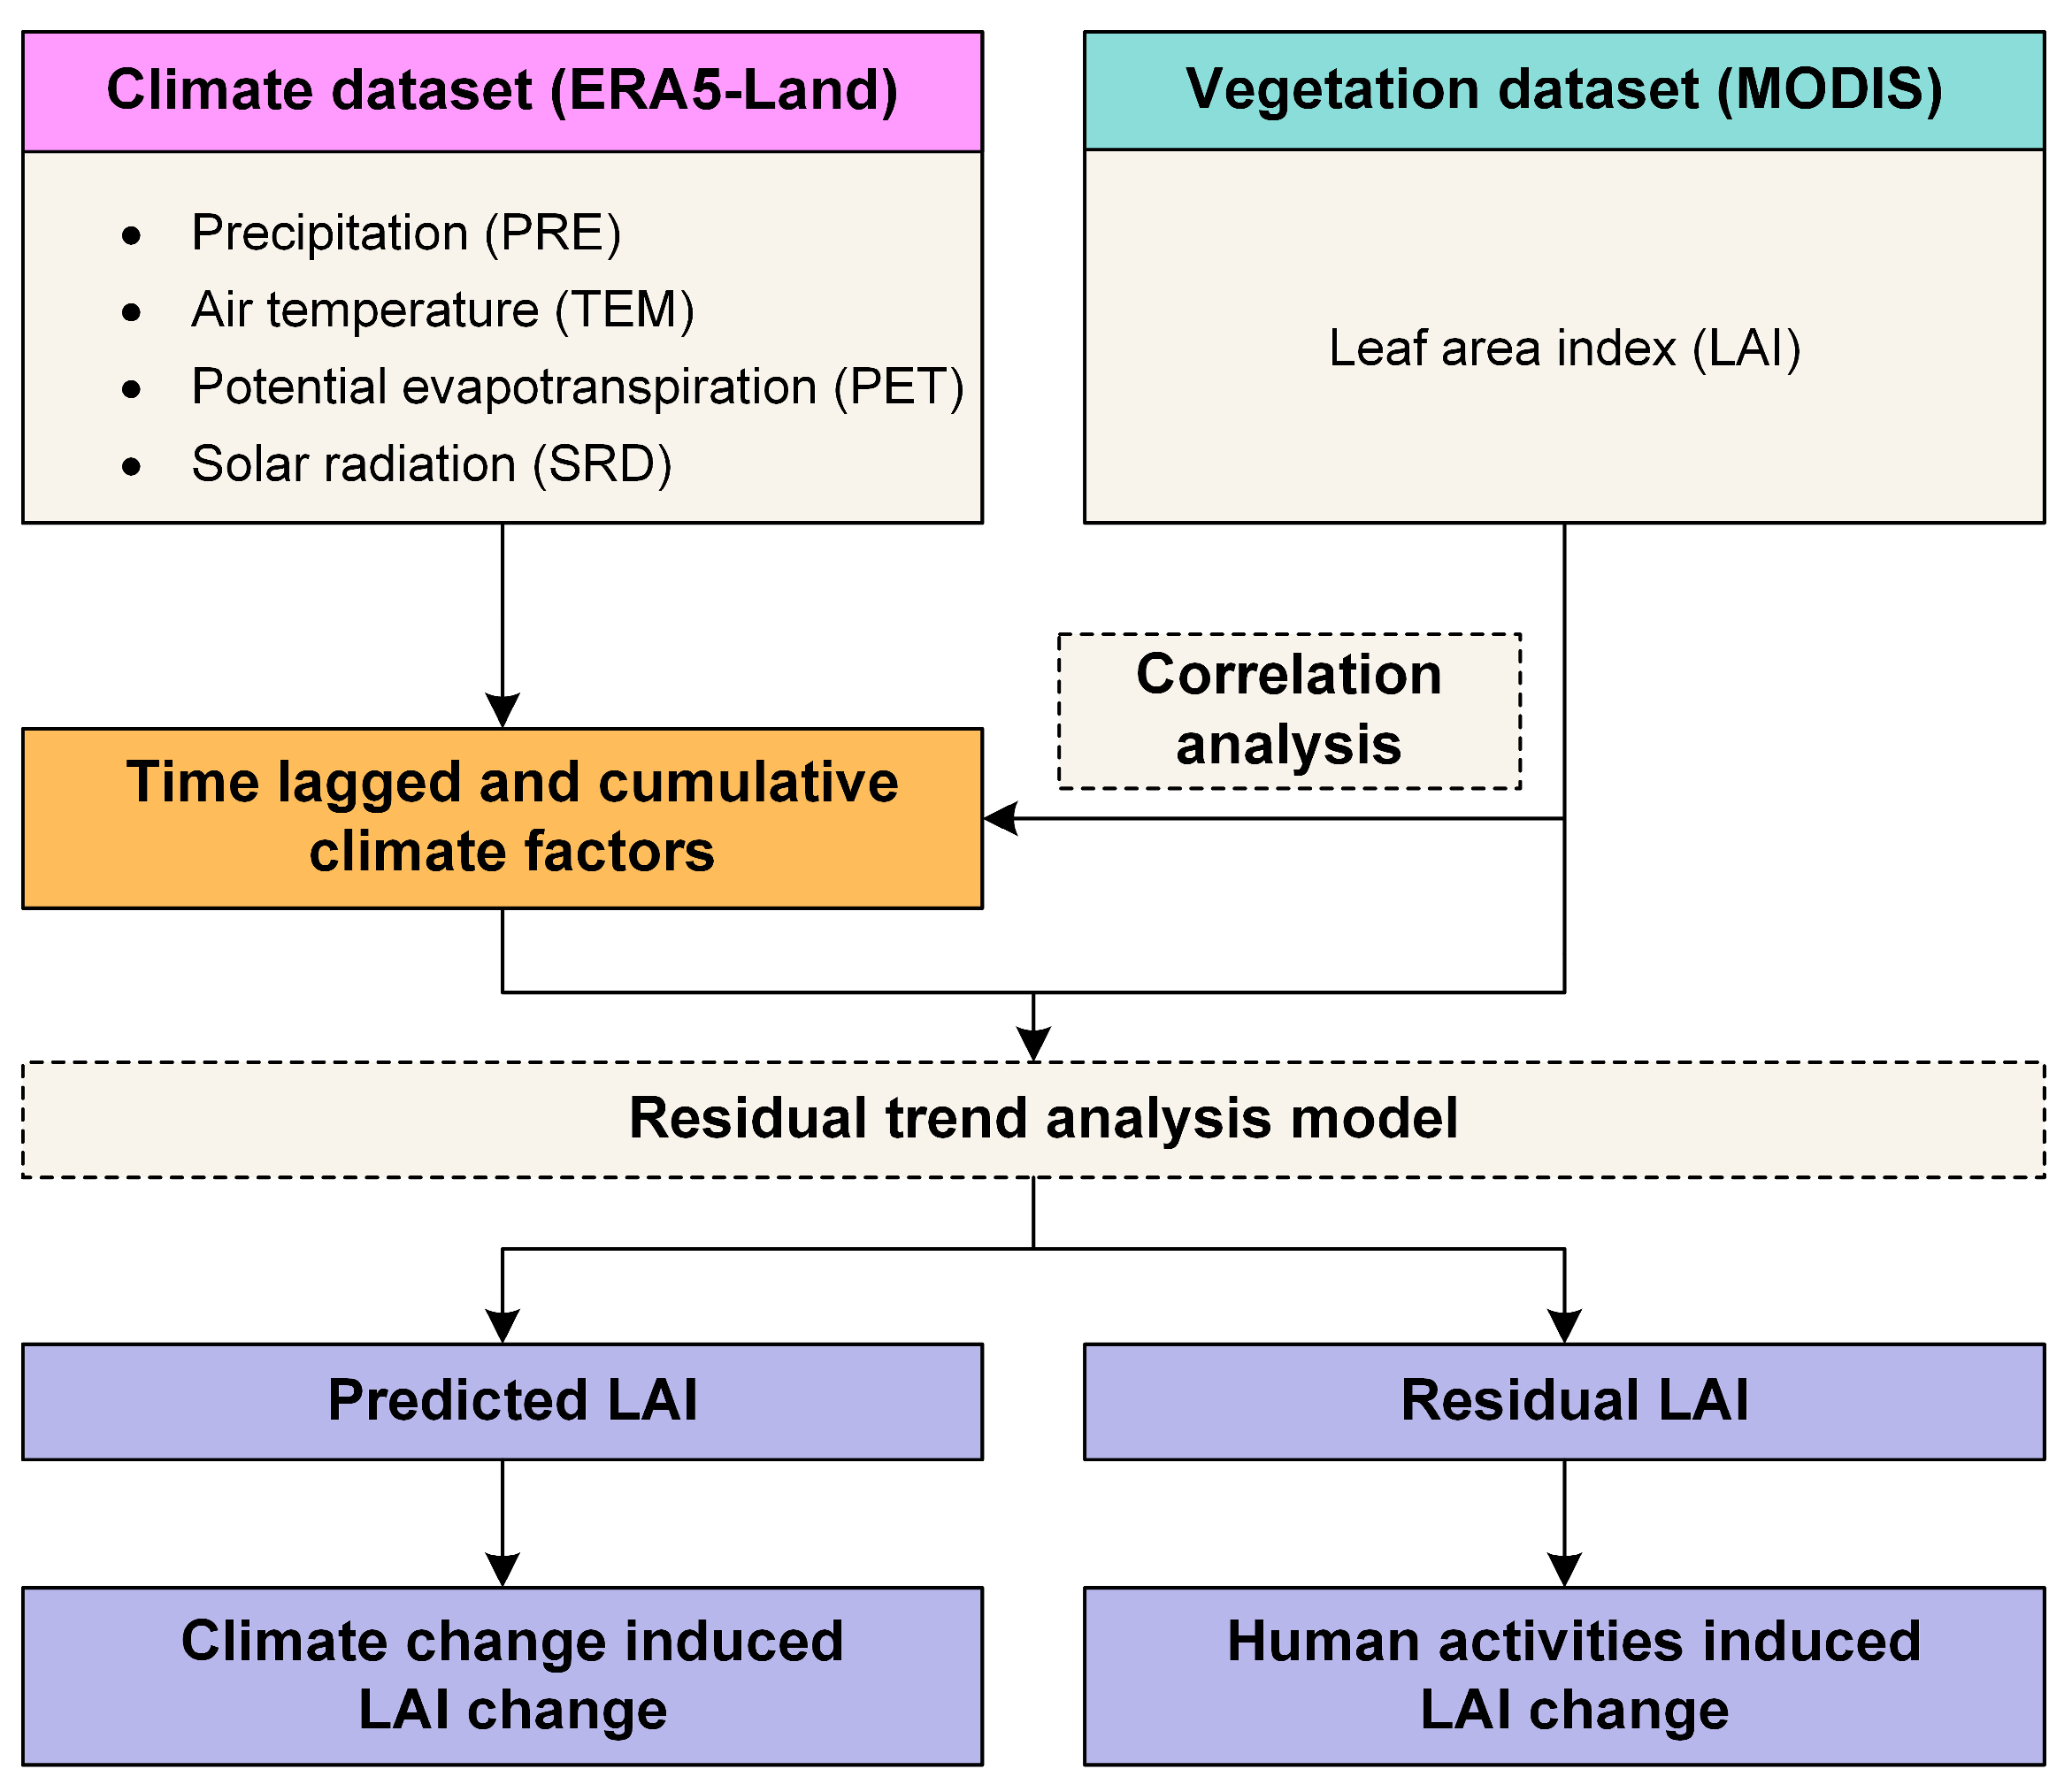
Figure 2 shows the main analytical framework of this study. First, lagged and accumulated climatic factors were given as per Equations (2)–(5). At the monthly scale, the delayed and cumulative impacts of climatic factors on vegetation dynamics typically persist for less than a quarter [20,22]. Consequently, the analysis of lagged and cumulative effects was confined to a maximum duration of 4 months.
for example, in Equation (2), represents the average PRE for the t-th month, incorporating an m-month delay and n-month cumulative effects. denotes the PRE in months before the t-th month. Here, m and n denote the number of lagged and cumulative months, respectively, both of which range from 0 to 3 [20]. A value of 0 indicates no temporal effect, while values from 1 to 3 indicate a lag or accumulation period of one to three months for and , respectively. Based on Equation (2), four distinct scenarios emerge: (1) and , indicating no temporal effects; (1) and ranging from 0 to 3, representing only time-accumulation effects; (3) ranges from 0 to 3 and , only the lagged influences were taken into account; and (4) both and ranges from 0 to 3, both lagged and cumulative effects, along with their interaction, were incorporated.

Figure 2.
Flowchart of this study. Dotted-box indicates tools/methods used in the analysis.
Exploring various combinations of (lag months) and (accumulation months) enables a comprehensive evaluation of the full range of temporal effects on vegetation dynamics. Due to the construction of temporal effects of climatic factors (Equations (2)–(5)), the data from the initial months of the study period (2000–2019) were lost. Therefore, these data were excluded from the analysis. Then, Pearson correlation coefficients were calculated to evaluate linear relationships, including time-lag and time-accumulation effects, with optimal periods determined by maximizing absolute correlation values (Figure 2). For example, if the precipitation series assigned with a 2-month delay and 3-month cumulative information has the largest absolute correlation coefficient with the LAI series, it means that precipitation has a 2-month lag effect and a 3-month cumulative effect on vegetation. In this scenario, for a specific grid, the LAI in August is most strongly influenced by the average precipitation from March to June. Here, June reflects the 2-month lag effect. Meanwhile, the cumulative precipitation from March to May represents the 3-month cumulative effect.
2.3.3. Residual Trend Analysis
Residual trend analysis was applied to quantify the contributions of CC and HAs to vegetation dynamics, with a specific focus on LAI (Figure 2). This method is widely recognized for partitioning variations in vegetation into components attributable to CC and HAs [57,58]. Residual trend analysis requires the establishment of a multiple linear regression model that relates the vegetation index to climatic variables. The key assumption is that the influence of HAs on vegetation is captured by the model’s unexplained variance. Vegetation responses to climatic variables are often nonlinear, with effects that may reverse under varying conditions. However, nonlinear models require detailed statistical analysis and often yield results that are challenging to interpret. In contrast, multiple linear regression models can provide satisfactory results while maintaining strong interpretability.
This study examined four climatic variables, incorporating temporal (lagged and cumulative) effects, to establish the linear relationships between LAI and these indices on a monthly basis as follows:
where , , , and are the reconstructed time series of climate factors with n-month lag and n-month cumulative effects determined in Section 2.3.2; , , , and represent the regression coefficients of the corresponding climatic variables; is the intercept; represents the observed LAI, while denotes the predicted LAI based on climatic factors, reflecting the impact of CC on vegetation growth. The difference between the simulated and observed LAI, termed , represents the residual, which captures the impacts of HAs on LAI changes.
Monthly , and in Equation (7) were aggregated into annual series to detect the trend by Equation (1). Then, the relative importance of CC and HAs to vegetation changes were obtained by the method given in Table 1 [59]. All statistical analyses mentioned above were conducted under the R4.2.1 programming environment.

Table 1.
Methods for quantifying the relative contribution of climate change (CC) and human activities (HAs) to LAI change.
3. Results
3.1. Spatiotemporal Variability of Climate Factors
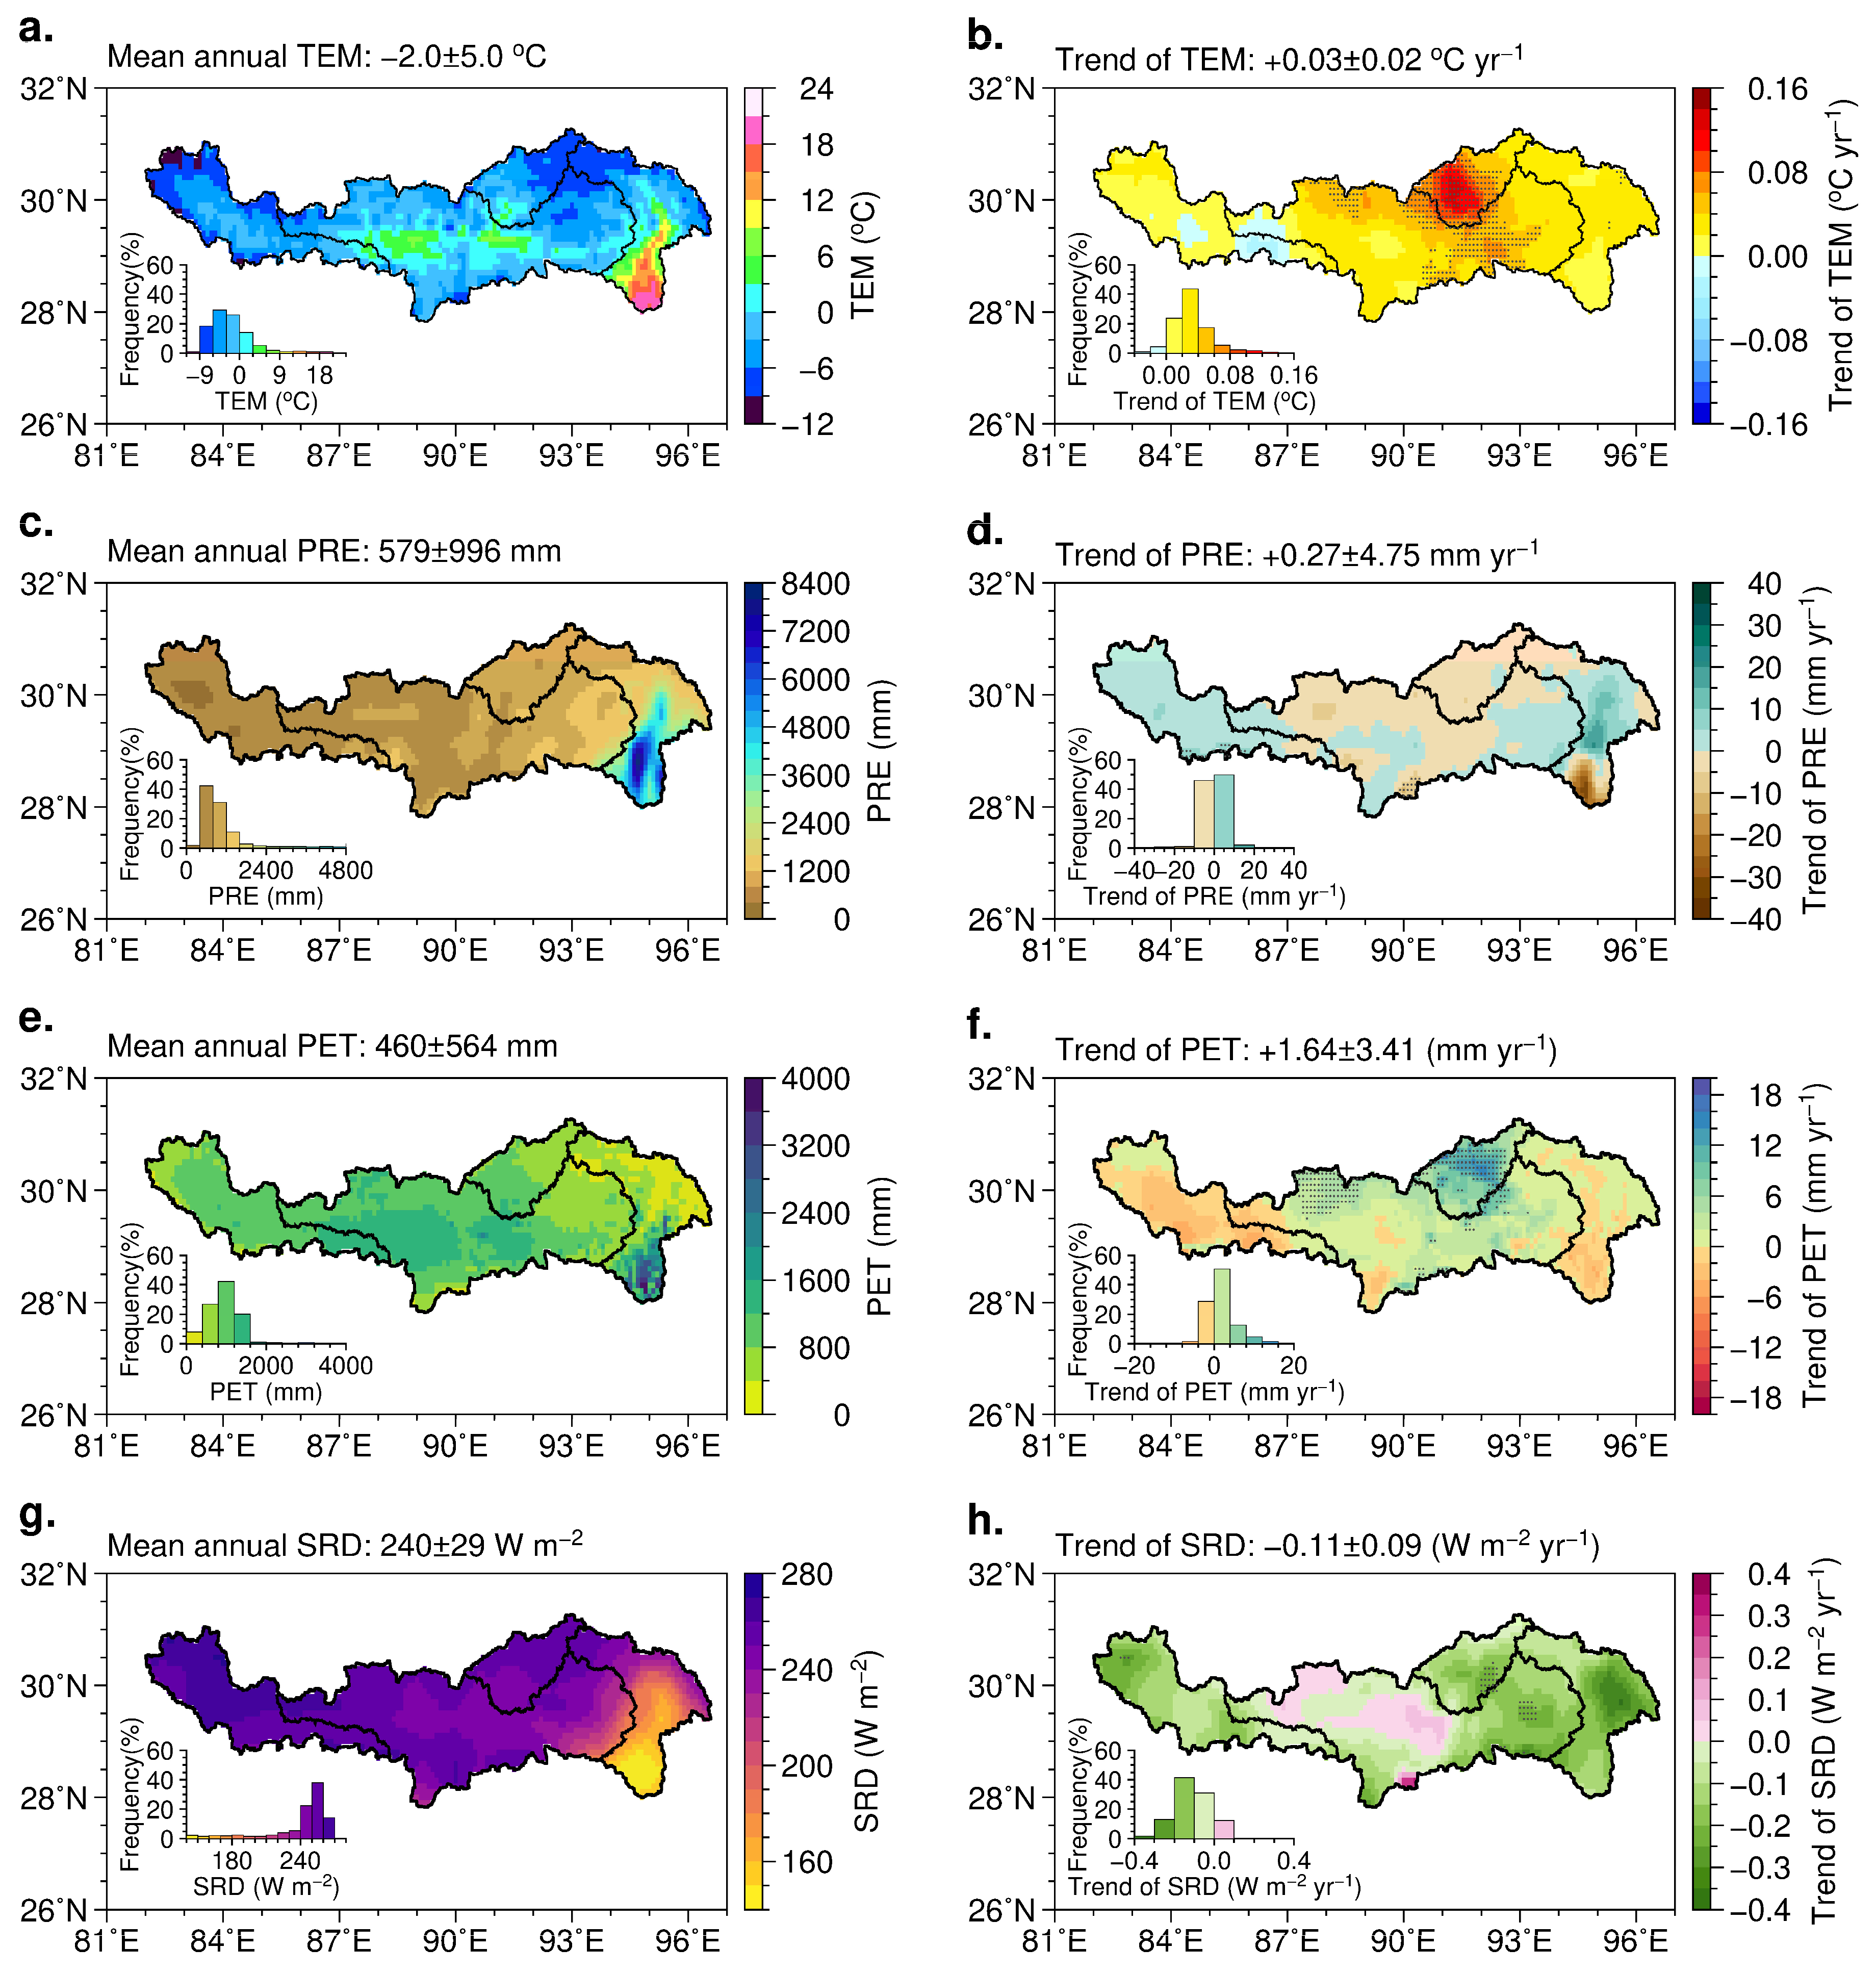
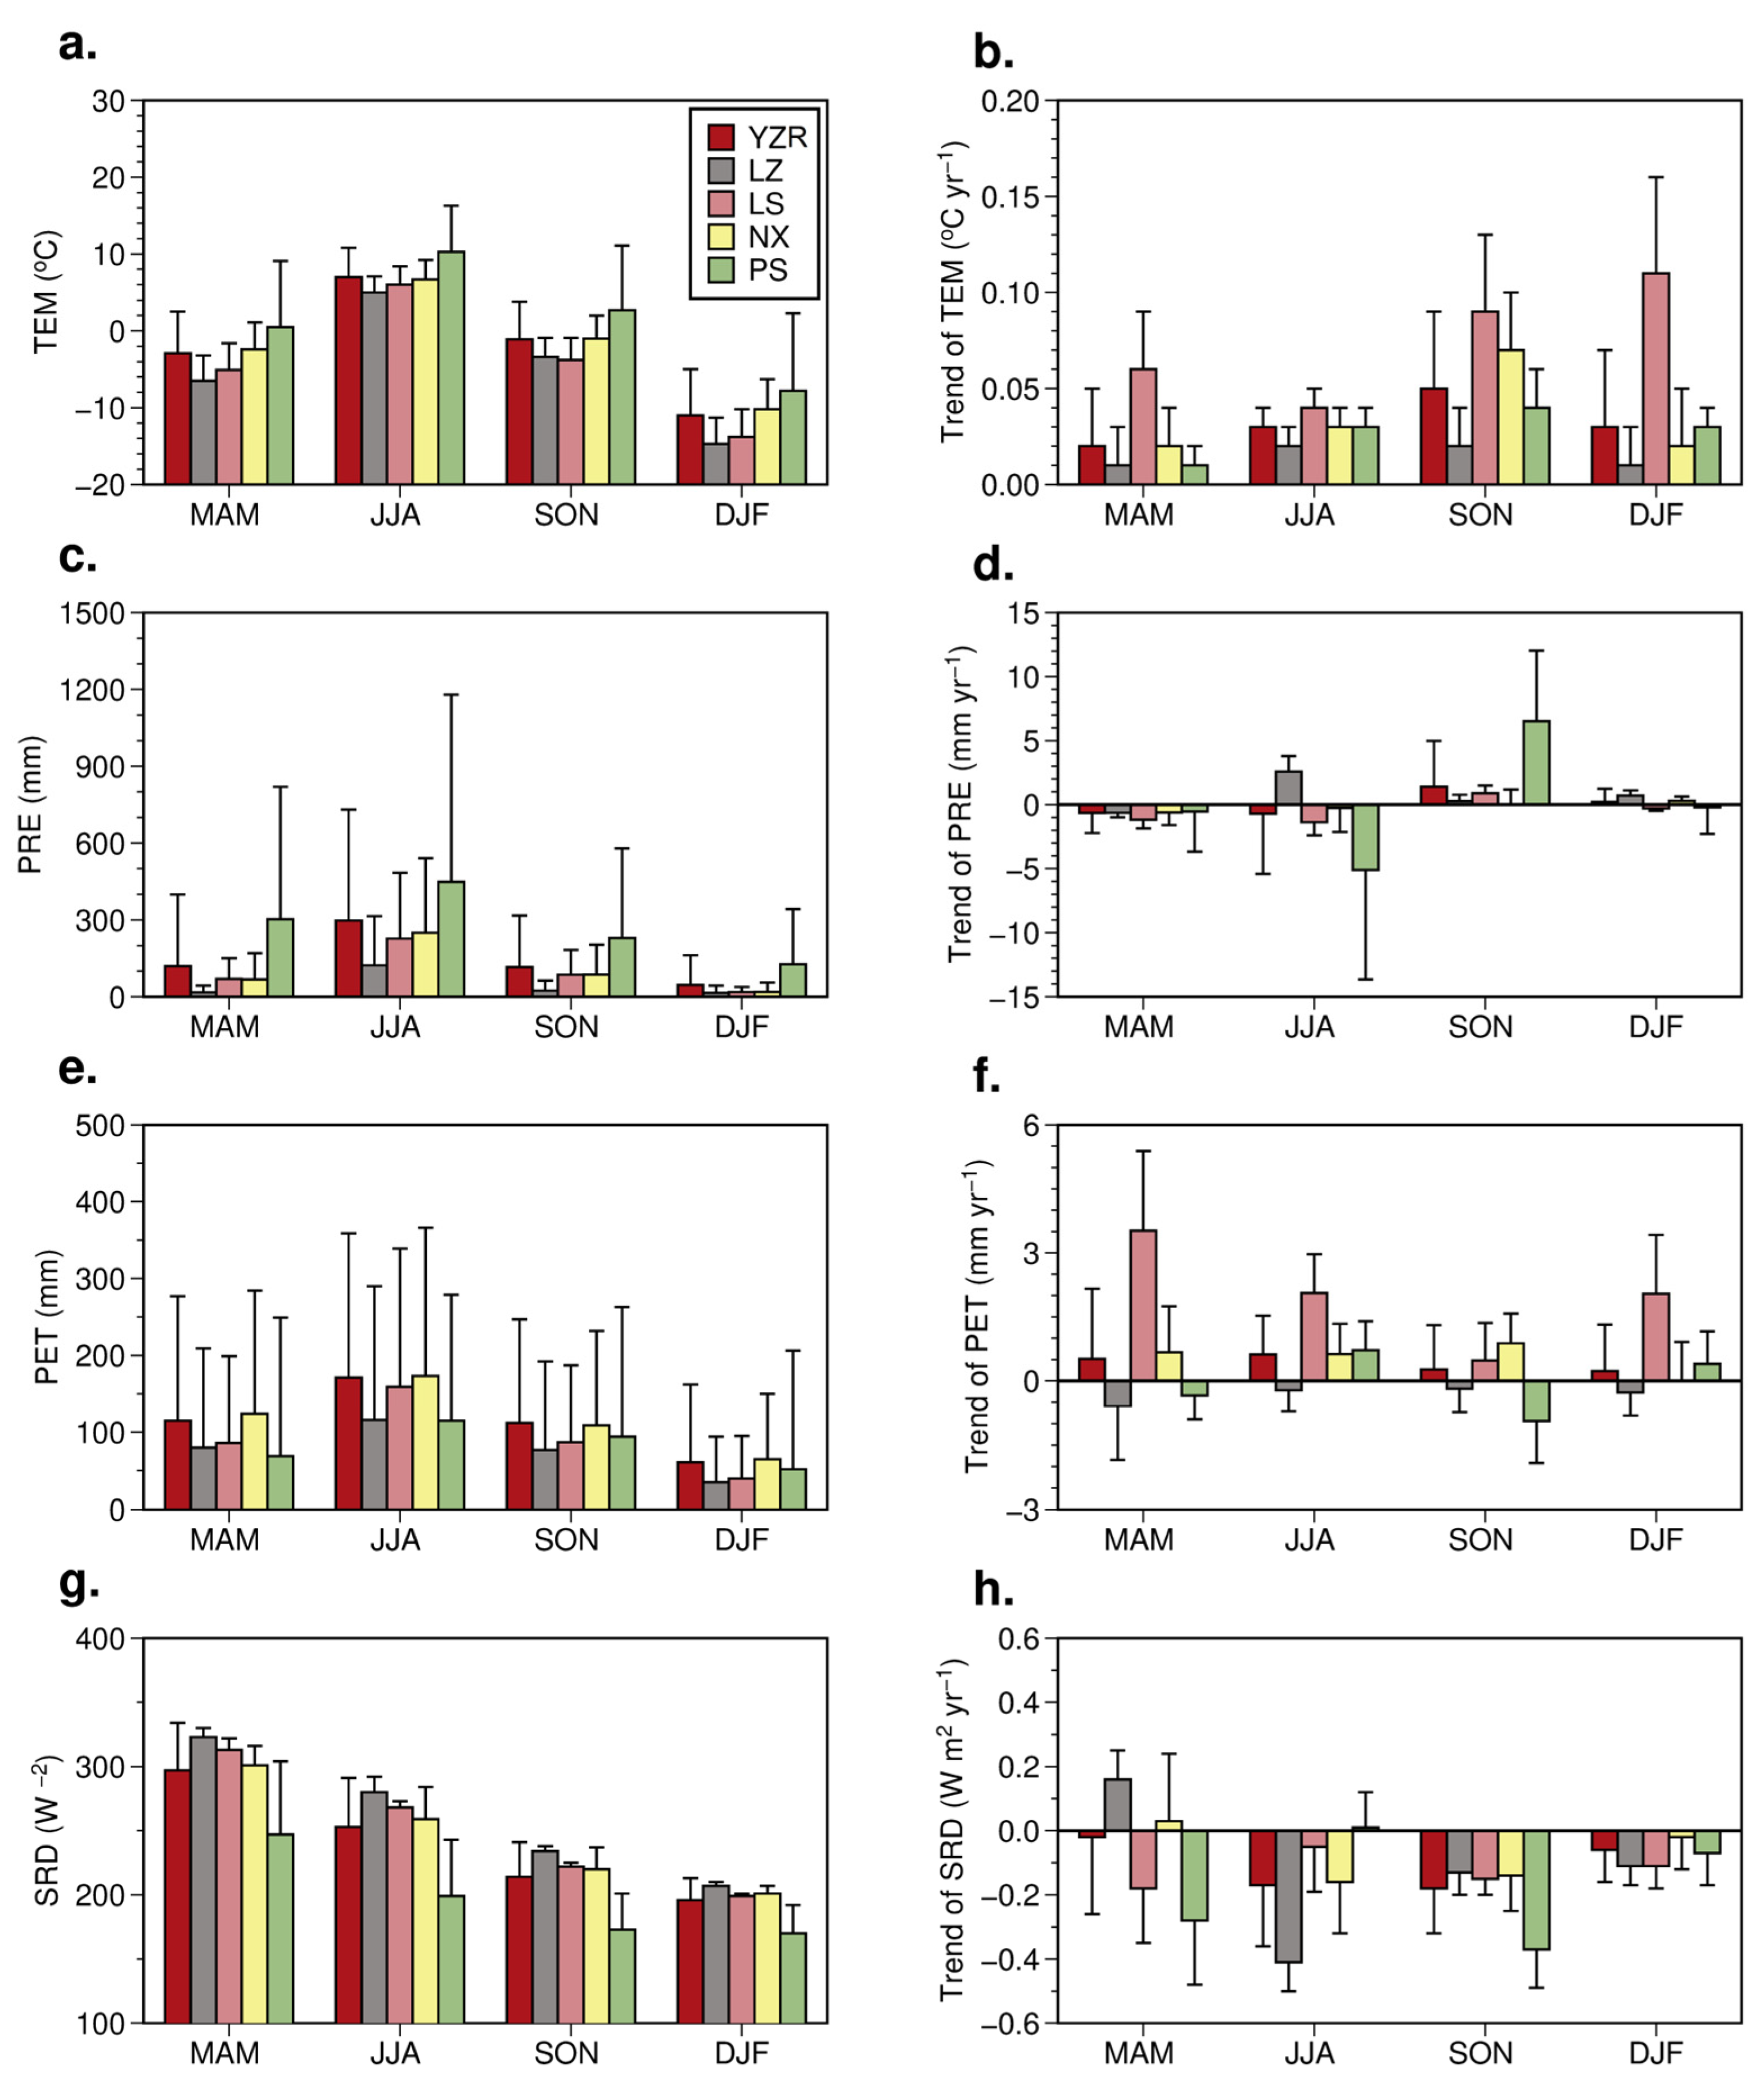
From 2000 to 2019, the YZR basin exhibited distinct spatial and temporal variability in its climate factors. The mean annual TEM of the YZR basin was −2.0 ± 5.0 °C (mean ± 1 standard deviation), with a clear west-to-east gradient ranging from below −6 °C in the high-altitude western regions to 24 °C in the southeastern areas (Figure 3a). From 2000 to 2019, TEM in the YZR basin has increased at a rate of 0.03 ± 0.02 °C yr−1 (Figure 3b). Across the entire basin and within each sub-basin, autumn displayed the most significant warming (Figure 4b and Table S1). The mean annual PRE averaged 579 ± 996 mm (Figure 3c), with over 50% occurring in summer (JJA) (Figure 4c). PRE exhibited a slight increasing trend of 0.27 ± 4.75 mm yr−1 (Figure 3d), but with spatial contrasts: significant increases in the LZ sub-basin (2.94 ± 1.64 mm yr−1) and decreases in the LS and NX sub-basins (Figure 4d). The mean annual PET averaged 460 ± 564 mm (Figure 3e), increasing at 1.64 ± 3.41 mm yr−1 (Figure 3f), with the LS sub-basin showing a notable trend of 8.09 ± 3.36 mm yr−1, particularly in spring (3.52 ± 1.87 mm yr−1) (Figure 4f). The mean annual SRD in the YZR basin averaged 240 ± 29 W m−2 (Figure 3g). Mean SRD in the basin decreased progressively from spring (297 ± 37 W m−2) to summer (253 ± 38 W m−2), autumn (214 ± 27 W m−2), and winter (196 ± 17 W m−2) (Figure 4g). Across the YZR basin, SRD exhibited a decrease from 2000 to 2019, with a rate of 0.11 ± 0.09 W m−2 yr−1 (Figure 3h). Spatially, SRD showed a slight increase only in parts of the central-west NX sub-basin. Across the remainder of the YZR basin, SRD consistently declined, with the PS sub-basin experiencing the most notable reduction (−0.18 ± 0.07 W m−2 yr−1) (Figure 4h and Table S1).
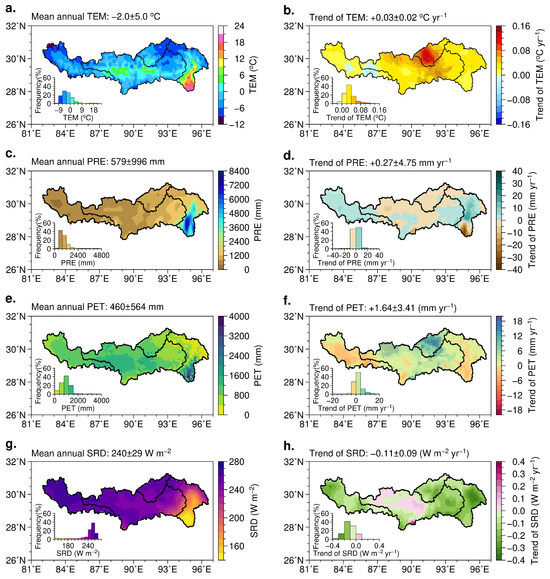
Figure 3.
Spatial patterns and temporal trends of climatic factors in the YZR basin during 2000–2019. (a,c,e,g) Mean annual values of air temperature (TEM), precipitation (PRE), potential evapotranspiration (PET), and solar radiation (SRD). (b,d,f,h) Spatial distributions of the trends in TEM, PRE, PET, and SRD). Insets illustrate the frequency distribution of trends across the basin.

Figure 4.
Seasonal variations and trends of climatic factors in the YZR basin and its sub-basins from 2000 to 2019. (a,c,e,g) Seasonal mean values of air temperature (TEM), precipitation (PRE), potential evapotranspiration (PET), and solar radiation (SRD) for spring (MAM), summer (JJA), autumn (SON), and winter (DJF). (b,d,f,h) Seasonal trends of the respective climatic factors. Error bars represent the standard deviations.
3.2. Vegetation Change
In the growing season (May–September), LAI exhibited a pronounced southeast-to-northwest decreasing gradient across the YZR basin, with a basin-wide average of 0.87 ± 1.04 m2 m−2 (Figure 5a). Growing season LAI decreased sequentially from PS (2.09 ± 1.73 m2 m−2) to LS (0.83 ± 0.37 m2 m−2), NX (0.65 ± 0.53 m2 m−2), and LZ (0.32 ± 0.13 m2 m−2) sub-basins (Figure 5a and Table S2). This gradient reflects that southeastern areas with abundant precipitation, higher temperatures, and lower elevations support denser vegetation, while the drier, cooler, high-altitude northwestern regions exhibit lower LAI (Figure 1).
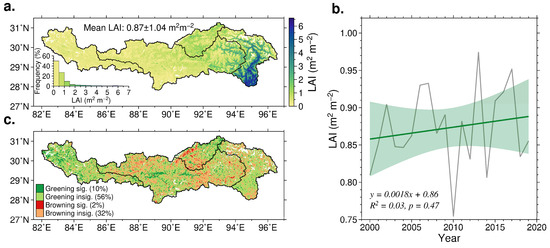
Figure 5.
Spatiotemporal variations in LAI across the YZR basin during 2000–2019. (a) Spatial patterns of the growing season (May–September) mean LAI with an inset showing the frequency distribution of LAI values across the basin. (b) Temporal trend of basin-wide mean LAI, with a regression line and 95% confidence interval. (c) Distribution of significant (p < 0.05) and insignificant greening and browning trends.
Over the past two decades, growing season LAI exhibited a negligible increasing trend of 0.018 m2 m−2 dec−1 (R2 = 0.03, p = 0.47) (Figure 5b). Spatially, approximately 66% of the YZR basin exhibited greening trends in LAI from 2000 to 2019, with 10% of areas exhibiting statistically significant increases (p < 0.05), distributed relatively evenly across the basin. Conversely, LAI decreased in 34% of the YZR, with statistically significant decreases (p < 0.05) observed in 2% of basin (Figure 5c). At the sub-basin scale, all four sub-basins of the YZR basin exhibited increasing LAI trends from 2000 to 2019 (Table S2).
3.3. Temporal Inflences of Climatic Factors on LAI Variability
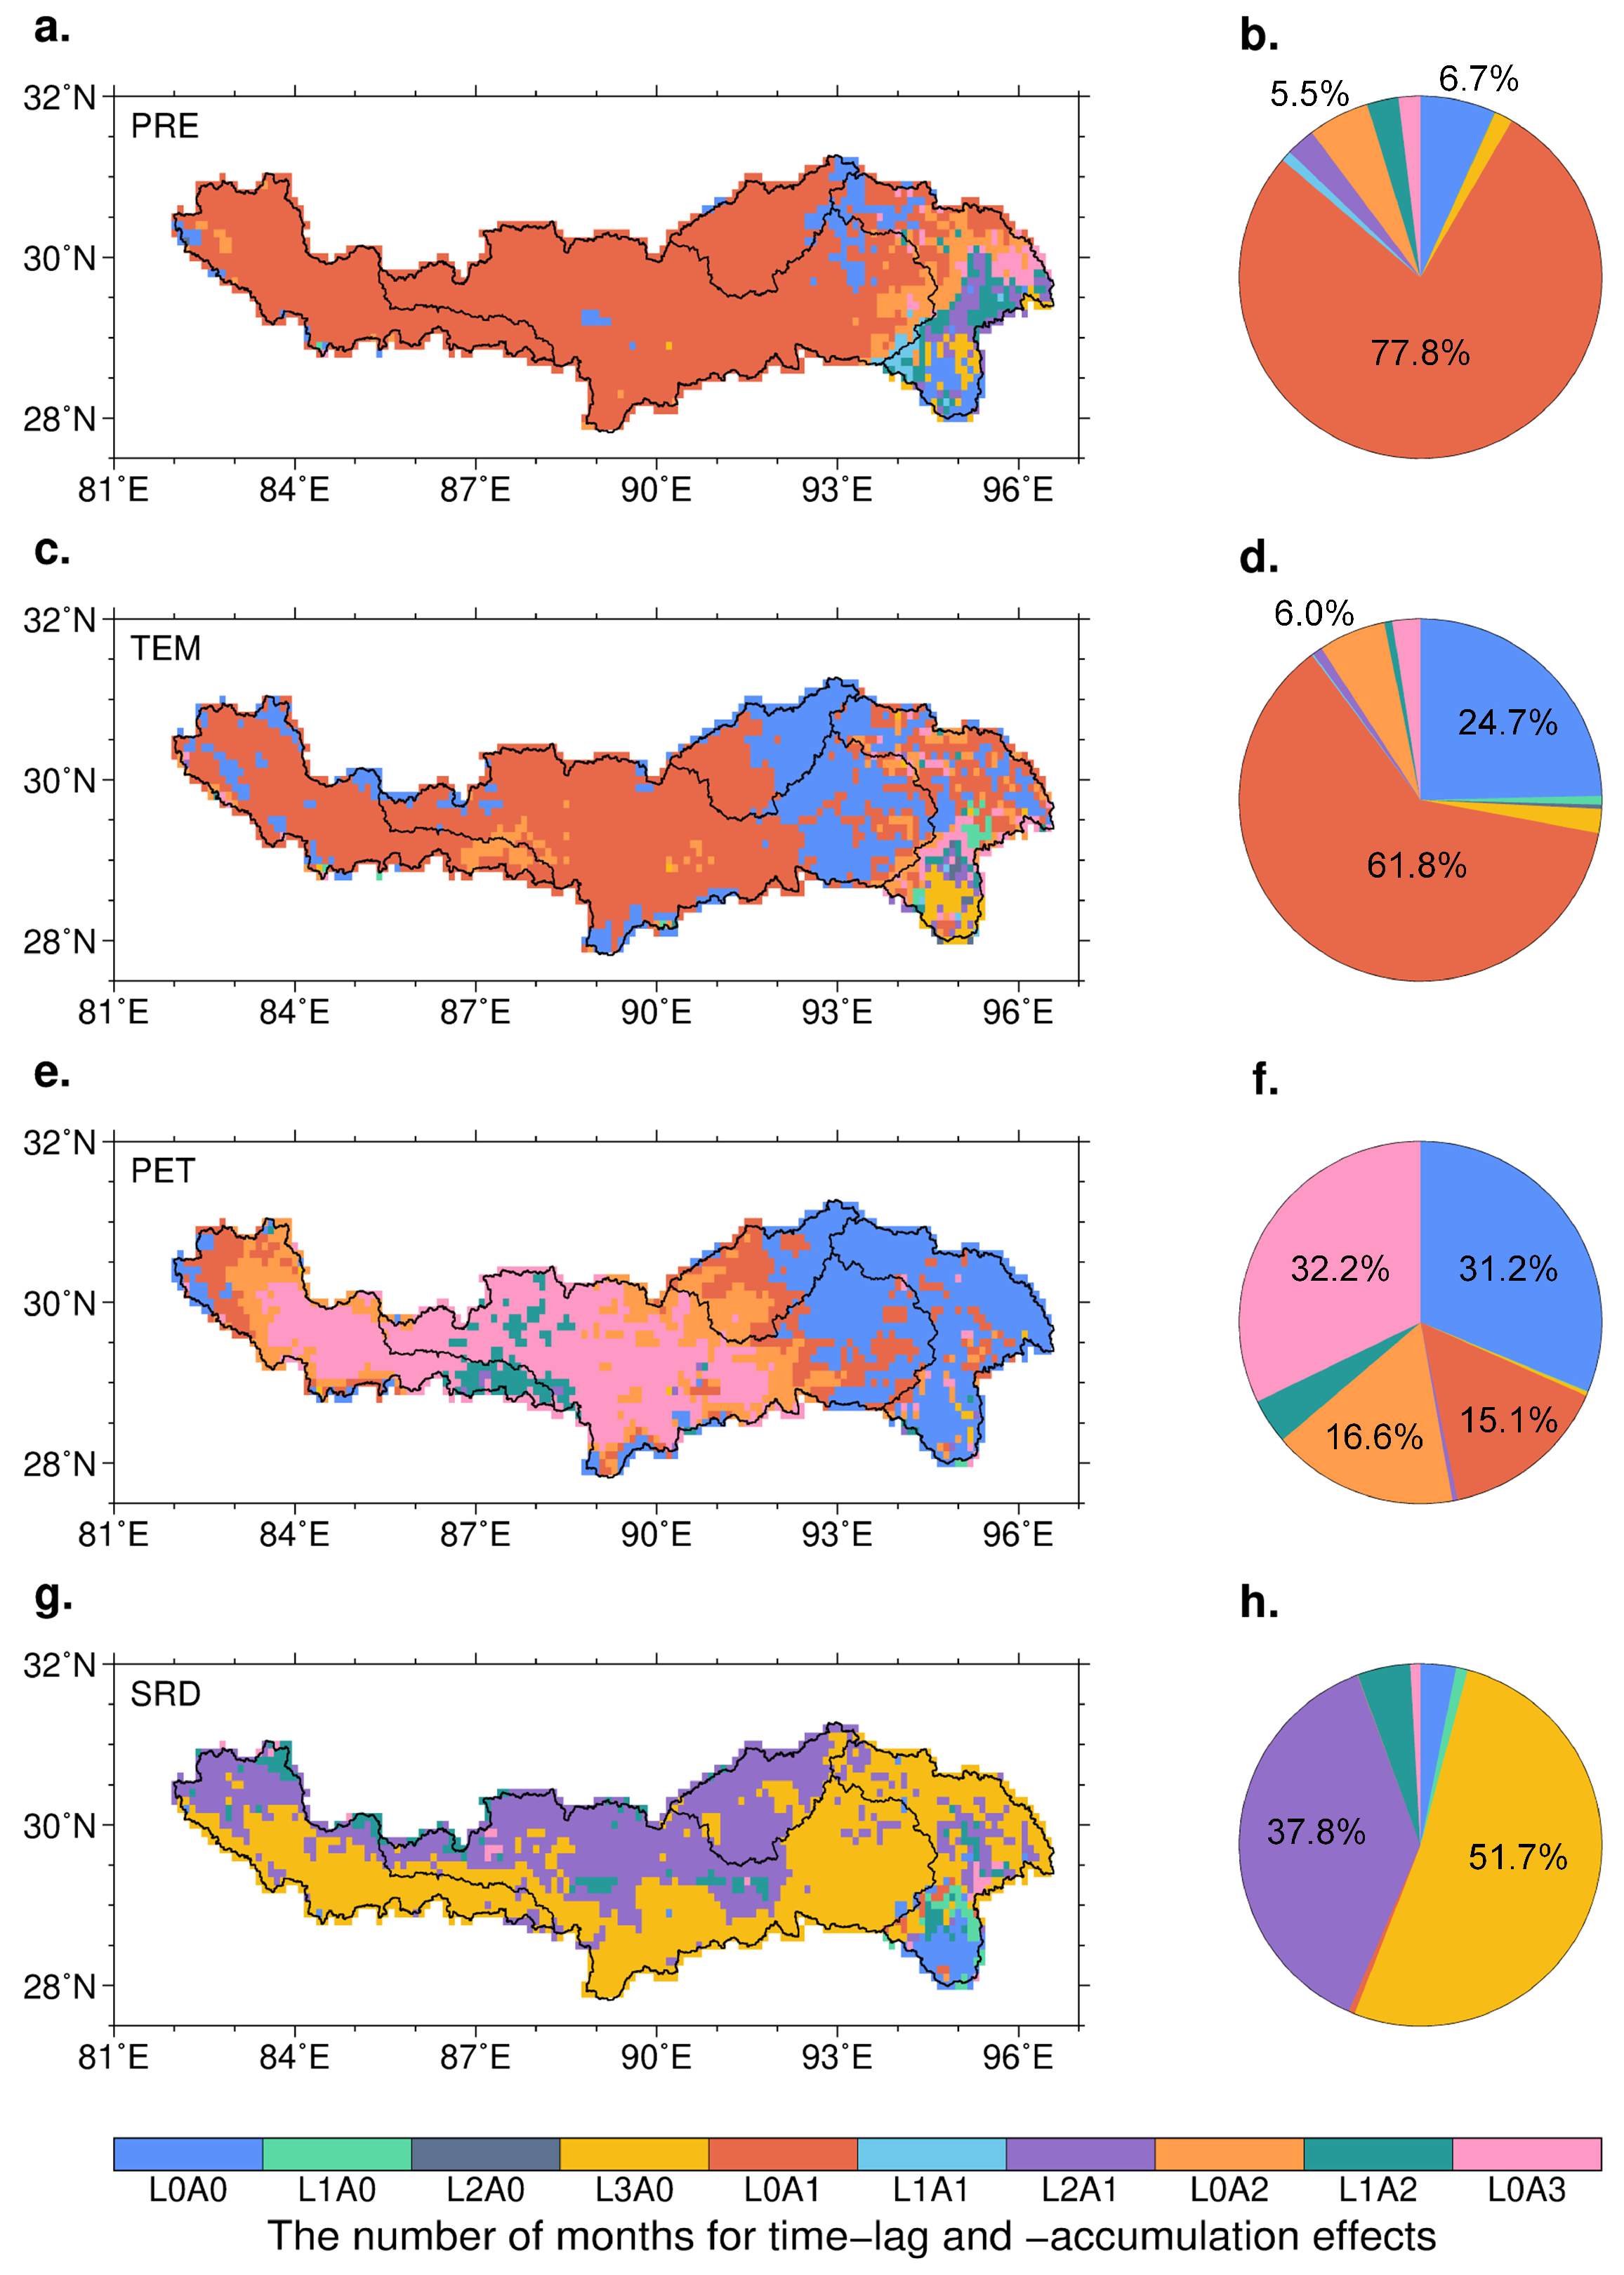
Our results reveal that, in the YZR basin, climatic factors influence LAI variability through both lagged and cumulative effects. However, the magnitude and nature of these temporal effects differ among climatic factors and across sub-basins. PRE showed minimal time-lag but pronounced time-accumulation impacts on LAI dynamics throughout the YZR basin (Figure 6a). Specifically, the mean time-lag effect of PRE was 0.14 ± 0.52 months, while the mean time-accumulation effect was 1.04 ± 0.49 months (Table 2). Areas exhibiting a precipitation time-lag with a one-month accumulation effect (L0A1) accounted for 77.8% of the total basin area (Figure 6b and Table S3). These areas were predominantly located in most parts of the LZ, LS, and NX sub-basins. In contrast, the spatial patterns of the time-lag and time-accumulation impacts of PRE exhibited substantial heterogeneity within the PS sub-basin, especially in its southern forested regions (Figure 6a).
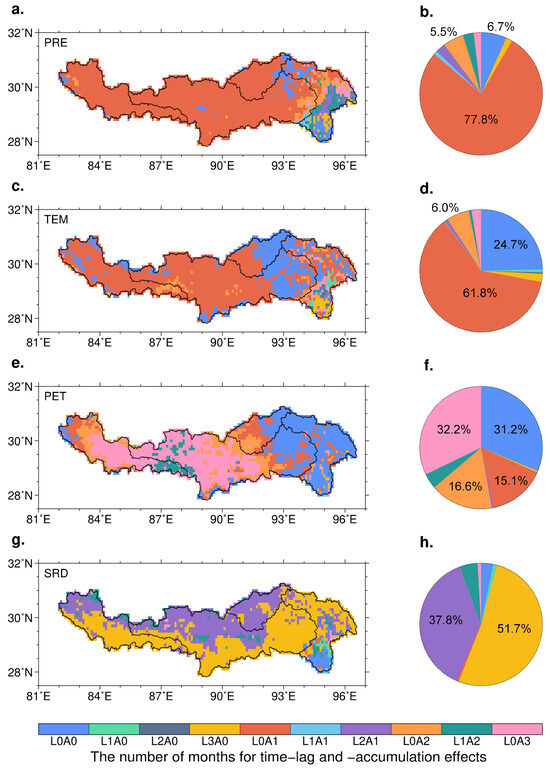
Figure 6.
Spatial patterns and proportions of optimal time-lag and time-accumulation periods for climatic factors affecting LAI dynamics in the YZR basin. (a,c,e,g) Spatial distribution of the optimal number of months for time-lag (L) and time-accumulation (A) effects for four climatic factors. (b,d,f,h) Corresponding pie charts illustrating the proportions of different time-lag and time-accumulation combinations across the basin. Color codes represent specific lag-accumulation combinations (e.g., L0A0 indicates no lag and accumulation effects, and L3A0 indicates a three-month lag with no accumulation effects).
Table 2.
The number of months for time-lag and time-accumulation effects in the YZR and its sub-basins.
TEM influenced vegetation dynamics with an average accumulation duration of 0.84 ± 0.65 months and a lag of 0.11 ± 0.50 months across the YZR basin from 2000 to 2019 (Table 2). At the sub-basin level, TEM exhibited a notable time-lag impact of 0.49 ± 0.99 months in the PS sub-basin, while a minimal lag effect was observed in the LZ, LS, and NX sub-basins. The accumulation effect of temperature declined from 1.02 ± 0.99 months in the PS sub-basin to 0.94 ± 0.50 months in the LZ, 0.82 ± 0.53 months in the NX, and 0.45 ± 0.50 months in the LS sub-basin. L0A1 was the dominant temporal impact of TEM in the YZR basin, covering 61.8% of the area, mainly concentrated in the central-western regions (Figure 6c,d). Additionally, 24.7% of the YZR lacked temporal effects of TEM (L0A0), primarily in the eastern parts of the LS and NX sub-basins (Table S3). In the high-temperature PS sub-basin, TEM demonstrated varied lag and accumulation impacts on vegetation dynamics (Figure 6c).
PET showed a negligible lag impact of 0.06 ± 0.29 months but a pronounced accumulation impact of 1.53 ± 1.24 months across the YZR basin from 2000 to 2019 (Table 2). The accumulation effect of PET increased progressively from 0.26 ± 0.65 months in the PS sub-basin to 0.93 ± 0.81 months in the LS, 1.92 ± 1.19 months in the NX, and 2.07 ± 0.95 months in the LZ sub-basin. Additionally, no temporal effects of PET were detected in the warm–humid eastern and southeastern YZR basin, covering 31.2% of the basin area (Figure 6e). The L0A3, L0A2, and L0A1 effects of PET predominated in the central and eastern YZR basin, covering 32.2%, 16.6%, and 15.1% of the total basin area, respectively (Table S3).
SRD exhibited a pronounced time-lag effect, averaging 2.37 ± 0.79 months across the basin, which was notably greater than its accumulation effect of 0.51 ± 0.63 months (Table 2). The temporal effects of SRD in the YZR basin were predominantly represented by the L3A0 and L2A0 effects, covering 51.7% and 37.8% of the total basin area, respectively (Figure 6g,h). At the sub-basin scale, the L3A0 effect of SRD dominated in LZ, while LS was mainly influenced by L2A0. Conversely, NX experienced combined impacts from both L3A0 and L2A0 effects. Notably, the southern forested regions of the PS sub-basin exhibited no detectable temporal effects of SRD (Figure 6g).
3.4. Relative Contributions of Climate Change and Human Activities to Vegetation Change
Figure 7a reveals that PRE positively influenced LAI changes across 48% of the basin, with contributions primarily concentrated in the central YZR. In contrast, 52% of the basin experienced negative contributions from PRE, predominantly in the western and eastern regions. From 2000 to 2019, PRE exhibited an overall negative impact on LAI changes, with a rate of –0.011 ± 0.056 m2 m−2 dec−1. TEM contributed positively to LAI changes at a rate of 0.002 ± 0.006 m2 m−2 dec−1 across the YZR basin, affecting 72% of the basin area (Figure 7b). PET emerged as the dominant climatic driver, exerting a positive influence on LAI changes at an overall rate of 0.033 ± 0.095 m2 m−2 dec−1. These areas encompassed 74% of the basin, predominantly within the LS sub-basin (Figure 7c). Conversely, areas where PET negatively contributed were mainly located in the southern PS sub-basin. SRD negatively contributed to LAI changes across the YZR basin. SRD contributions to LAI changes were negative across 70% of the basin area and positive in the remaining 30% (Figure 7d).
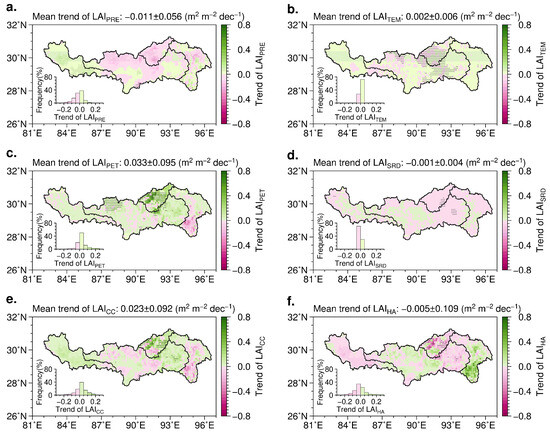
Figure 7.
Spatial distribution LAI trends attributed to different drivers in the YZR basin over the period 2000 to 2019. (a–d) Trends of LAI components attributed to precipitation (LAIPRE), air temperature (LAITEM), potential evapotranspiration (LAIPET), and solar radiation (LAISRD). (e,f) Trends of LAI components driven by climate change (LAICC) and human activities (LAIHA). Insets in each panel show the frequency distribution of trend values within the basin. Positive trends are shown in green, while negative trends are in magenta, with hatched areas indicating statistically significant trends at the p < 0.05 level.
The combined contribution of the four climatic factors to LAI changes was 0.023 ± 0.092 m2 m−2 dec−1 (Figure 7e). Spatially, positive contributions from CC dominated 68% of the basin, primarily concentrated in the LS, LZ, and eastern NX sub-basins. HAs had a negative contribution to LAI dynamics, with a rate of −0.005 ± 0.109 m2 m−2 dec−1. Areas where HAs contributed positively and negatively covered 41% and 59% of the basin area, respectively (Figure 7e). Notably, areas of negative contributions from HAs often coincided with regions of positive contributions from CC, while regions with positive human activity contributions overlapped with areas of negative climate impacts. This indicates that CC was the primary driver of LAI increases in the LZ and LS sub-basins, while HAs predominantly influenced vegetation growth in the PS sub-basin (Figure 7a,e,f).
Overall, CC and HAs accounted for 60% and 40% of the contributions to LAI changes, respectively, underscoring CC as the primary driver of LAI variations in the YZR basin from 2000 to 2019. Regions with CC dominance (relative contribution > 50%) covered approximately 60% of the basin area, primarily distributed across the LZ and LS sub-basins and parts of the NX sub-basin (Figure 8). Spatially, CC contributions to LAI changes decreased from upstream to downstream, while contributions from HAs increased correspondingly. Specifically, CC contributions decreased from 85% in the LZ sub-basin to 74% in the LS, 57% in the NX, and 37% in the PS sub-basin.
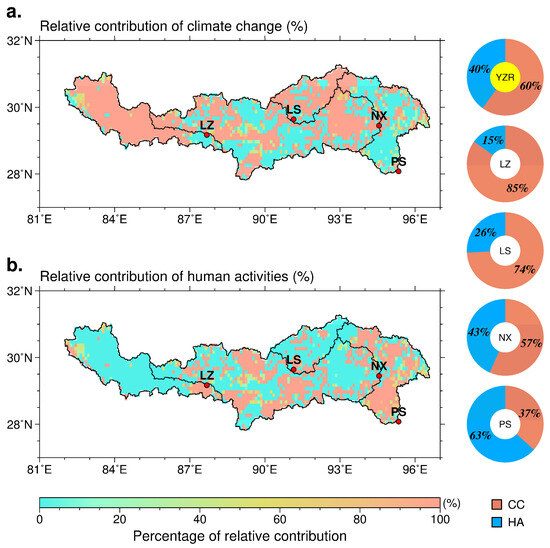
Figure 8.
Percentage contributions of climate change (CC) and human activities (HAs) to LAI changes across the YZR basin from 2000 to 2019. (a) Spatial distribution of the percentage contribution of CC (%), with pie charts summarizing the contributions across the entire basin (YZR) and its sub-basins (LZ, LS, NX, and PS). (b) Spatial distribution of the percentage contribution of HAs (%), with corresponding pie charts showing their relative impact in the YZR and its sub-basins.
4. Discussion
4.1. Advancements in the Enhanced Residual Trend Analysis
The asynchronous responses of vegetation growth to climate change have garnered increasing research attention, particularly regarding the temporal lag, cumulative effects, and their combined influence on vegetation dynamics [20,23,24]. Here, we present an enhanced residual trend analysis framework that integrate these temporal effects to disentangle the relative contributions of CC and HAs to LAI variations in the YZR basin. The coefficient of determination (R2) from multiple linear regression quantifies the proportion of LAI variability attributable to CC [60]. Without considering temporal effects of CC (e.g., using a regression model based solely on concurrent climatic factors and LAI), the mean R2 for the YZR basin was 0.81 (Figure 9a). Incorporating lagged and cumulative effects of climatic factors into the regression model increased the R2 to 0.87 (Figure 9b), indicating that temporal effects provide a more comprehensive explanation of LAI variations. Spatially, the explanatory power improved across all sub-basins: mean R2 increased from 0.81 to 0.89 in LZ, from 0.86 to 0.88 in LS, from 0.82 to 0.87 in NX, and from 0.62 to 0.63 in PS (Figure 9c,d). Additionally, accounting for temporal effects in analyzing linear relationships between climate factors and vegetation indices aligns with previous global and regional studies, which have shown that incorporating temporal effects enhanced the explanatory power of climatic factors for vegetation dynamics by 10–19% [20,22,27], thereby reinforcing the robustness of this methodology.
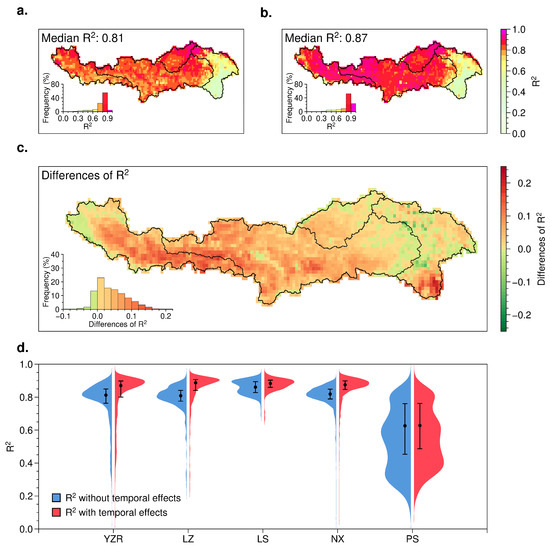
Figure 9.
Comparison of model performance for LAI simulation with and without temporal effects in the YZR basin. (a) Spatial distribution of R2 values for models without temporal effects, with a median R2 of 0.81. (b) Spatial distribution of R2 values for models with temporal effects, showing an improved median R2 of 0.87. (c) Spatial distribution of the differences in R2 between the two models. (d) Violin plots comparing R2 values across the entire basin (YZR) and sub-basins (LZ, LS, NX, and PS).
4.2. Impacts of Climate Change on Vegetation Dynamics
The contributions of the four climatic factors to LAI changes in the YZR basin were ranked as follows: PET (0.033 ± 0.095 m2 m−2 dec−1) > PRE (–0.011 ± 0.056 m2 m−2 dec−1) > TEM (0.002 ± 0.006 m2 m−2 dec−1) > SRD (–0.001 ± 0.004 m2 m−2 dec−1) (Figure 7). CC was identified as the dominant driver of vegetation dynamics in the basin, accounting for 60% of the LAI variability from 2000 to 2019 (Figure 8). Notably, the contributions of these climatic factors were strongly aligned with the spatial distribution of their respective trends. Previous studies found that PET, PRE, and TEM exhibited positive correlations with vegetation across the TP [22,26,61]. Although precipitation (PRE) increased across the YZR basin at a rate of 0.27 ± 4.75 mm yr−1 from 2000 to 2019, there was a significant decline in the middle reaches of the YZR (Figure 3d). Previous studies have highlighted that vegetation growth in these regions is primarily constrained by water availability, with a strong positive correlation between precipitation and NDVI [62]. This finding aligns with our results that the reduction in precipitation has a clearly negative impact on LAI (Figure 7a). In areas of vegetation degradation in the midstream YZR, a negative contribution of TEM to LAI was detected (Figure 7b). Warming temperatures significantly increased soil moisture evaporation, leading to soil water scarcity, which in turn constrained vegetation growth [63,64]. Also, PET increases in the LS and eastern NX sub-basins primarily drove PET’s overall positive contribution to LAI changes across the YZR basin (Figure 3f and Figure 7c). Elevated PET is associated with increased solar radiation and temperature, which enhance photosynthesis and thereby stimulate vegetation growth [17,65,66].
PRE, TEM, and PET exhibited negligible time-lag effects but significant accumulation impacts on LAI, with accumulation periods spanning 1–2 months. Conversely, SRD showed pronounced time-lag effects, averaging 2.4 months, but exhibited relatively weak accumulation effects (Figure 6). Previous studies indicate that the time-lag effects of TEM and PRE on vegetation dynamics within the YZR basin are generally confined to less than one month [26,61]. However, previous studies have largely neglected the cumulative impacts of climatic changes on vegetation growth. This study addresses this gap by providing a comprehensive analysis of temporal effects. Additionally, the stronger time-accumulation effect of SRD compared to its time-lag effect aligns with findings from previous studies [22,27]. These studies indicate that SRD’s cumulative effects are globally most pronounced within 0–6 months [67], emphasizing that the total solar energy received over time is more critical for vegetation dynamics than short-term fluctuations [28].
4.3. Impacts of Human Activities on Vegetation Dynamics
HAs influence vegetation through a variety of direct and indirect mechanisms. Land use changes, including deforestation, urbanization, and agricultural expansion [32,33]. Human-induced CC, driven by greenhouse gas emissions, modifies temperature regimes, alters precipitation distribution, and increases the occurrence extreme events, thereby impacting vegetation growth and spatial distribution [68,69]. Additionally, HAs, such as overgrazing, intensive farming, and deforestation, exacerbate soil degradation, causing erosion, nutrient depletion, and compaction, which collectively reduce soil suitability for plant growth [70,71,72]. Conversely, interventions like reforestation, conservation efforts, and sustainable land management positively influence vegetation recovery, enhance ecosystem health, promote biodiversity, and restore ecological balance [73].
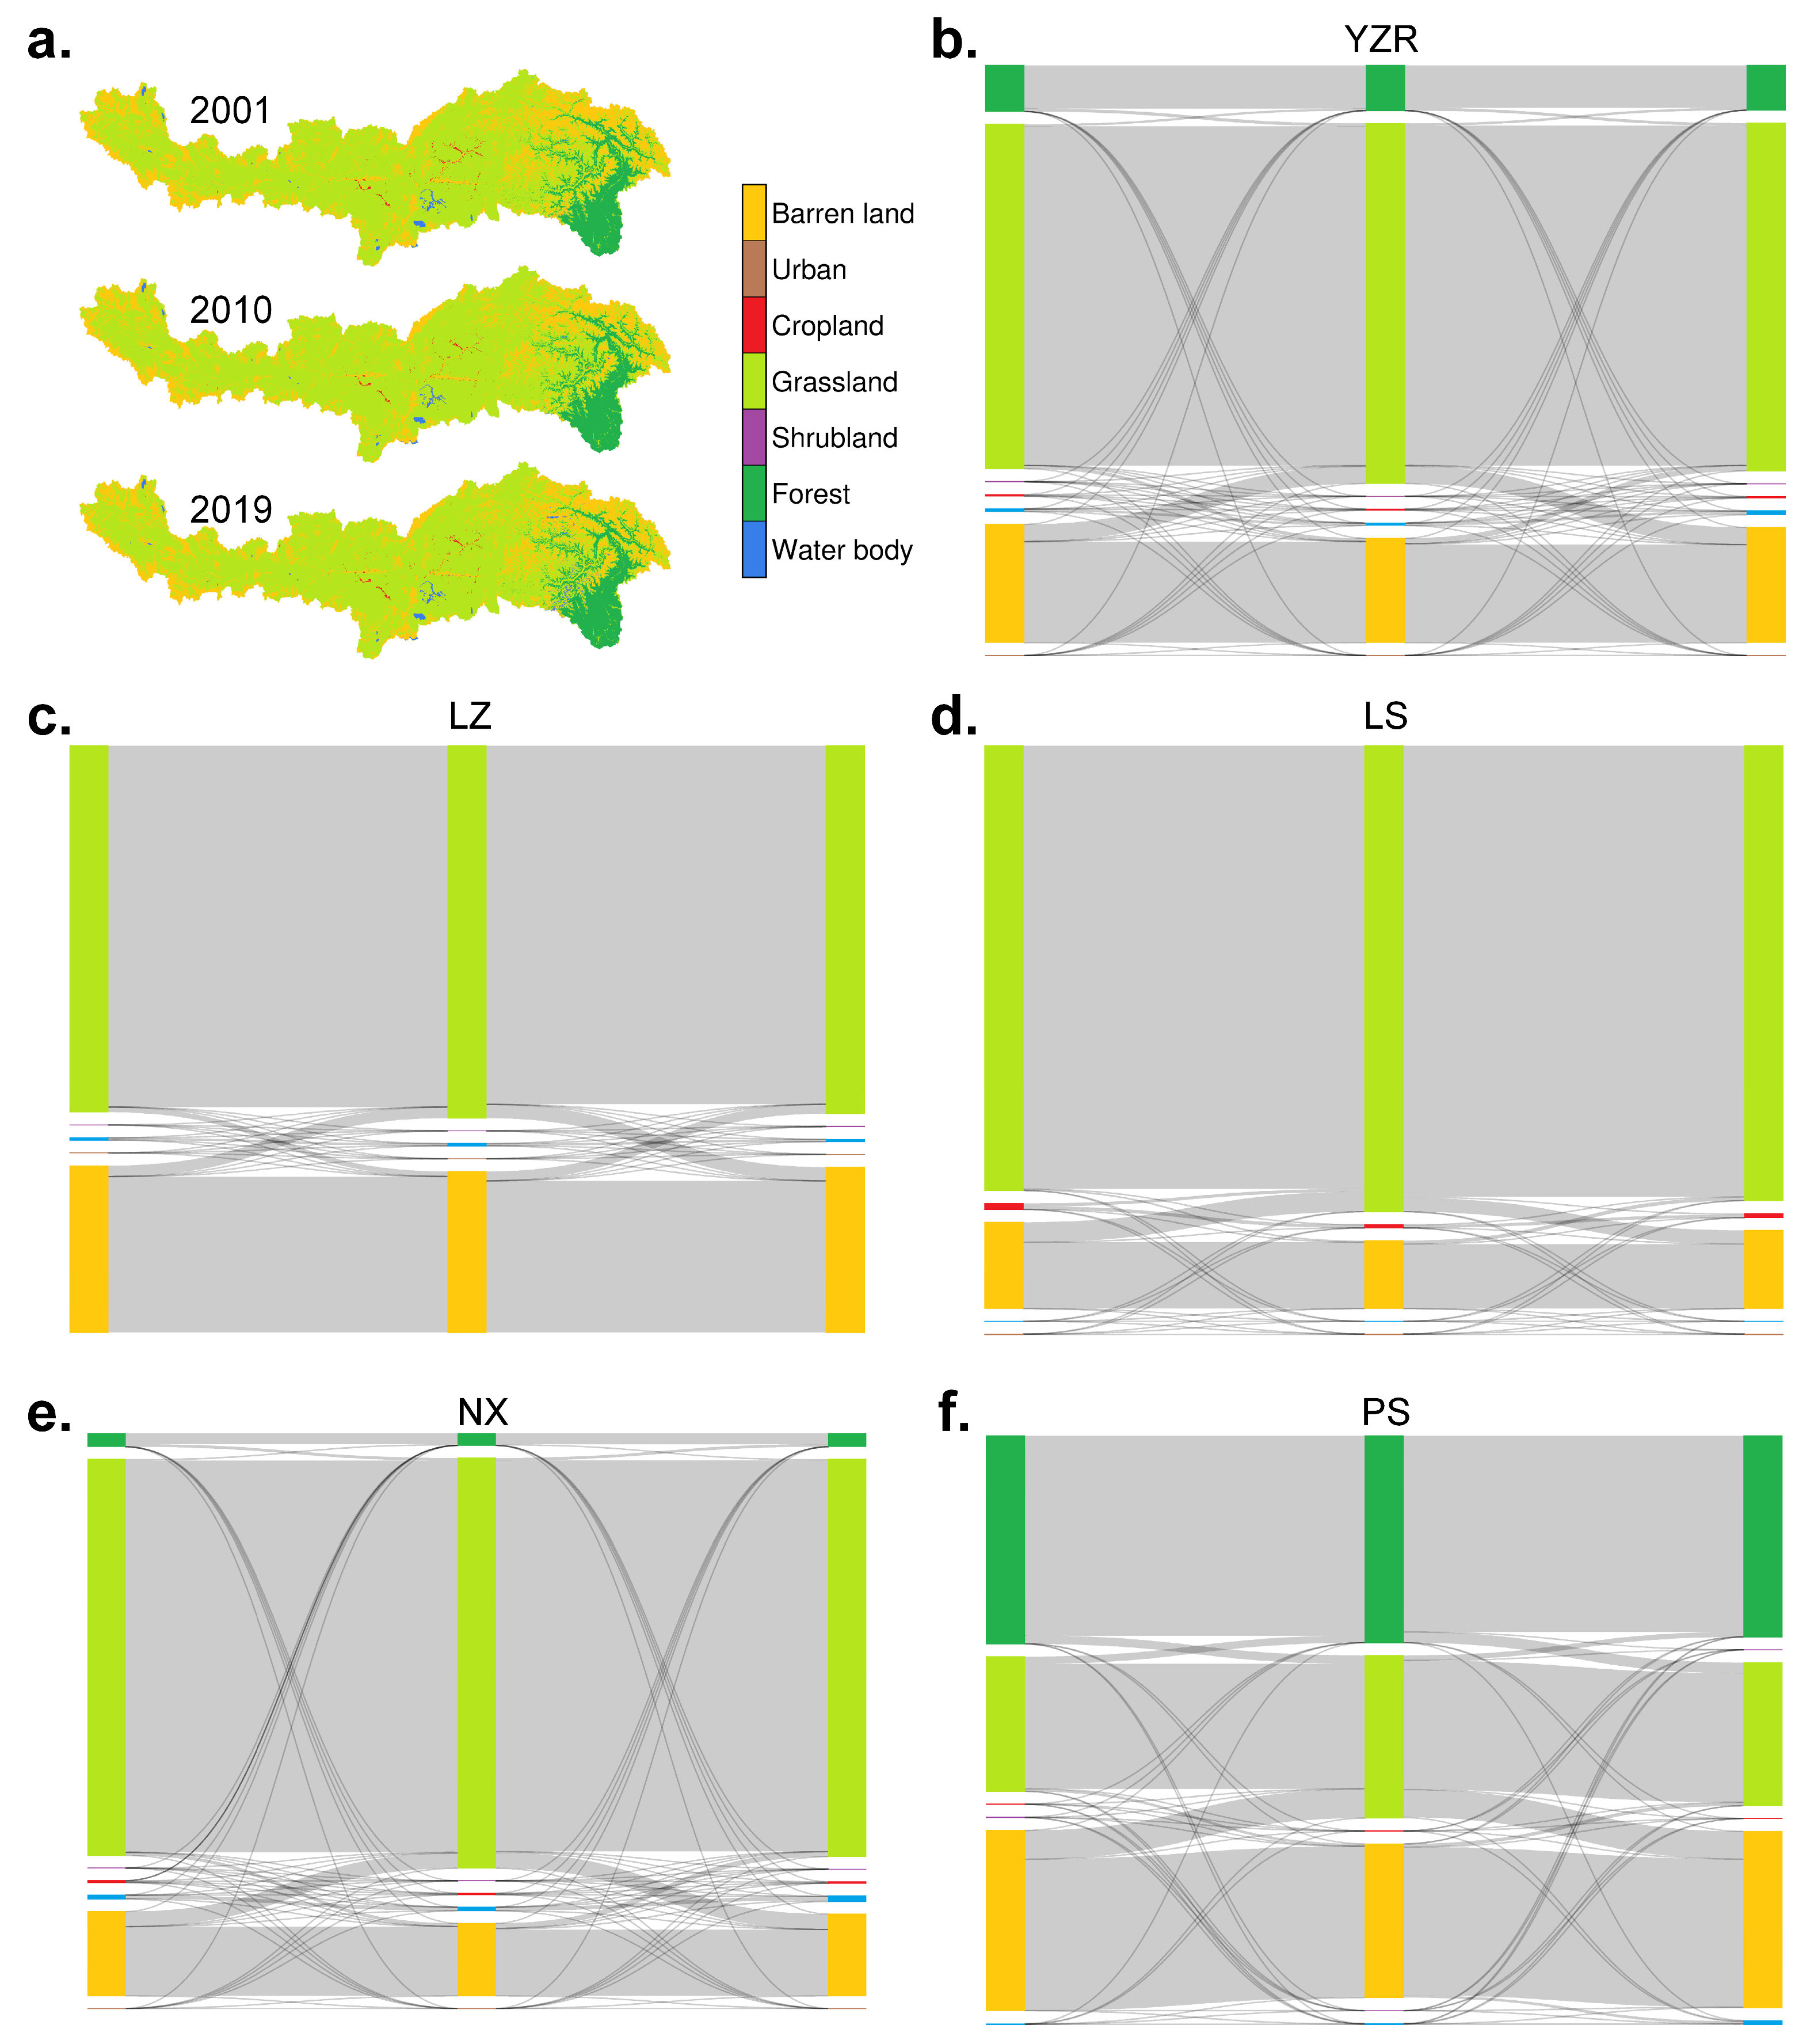
This study revealed that HAs explain 40% of the vegetation variability in the YZR basin (Figure 8). Vegetation changes influenced by climatic factors were primarily observed in the midstream and upstream regions, while changes driven by HAs were concentrated in the downstream areas. This distribution aligns with the spatial intensity of HAs across the TP [74]. In the YZR basin, HAs had negative effects on vegetation in the LZ, LS, and eastern NX sub-basins, while their impacts were positive in the PS sub-basin (Figure 7f). Land-use transition analyses for 2001, 2010, and 2019 revealed no significant changes in land-use types at the basin-wide scale or within sub-basins over the past two decades (Figure 10) [75,76]. Vegetation browning within the YZR basin has been predominantly detected in the midstream regions (Figure 5c), characterized by densely urbanized and crop areas (Figure 1c), where HAs have emerged as the primary driving force. These results suggest that urbanization, overgrazing, and agricultural activities are likely the primary drivers of the negative impacts of HAs on vegetation in upper and middle reaches of the YZR basin [77,78]. While the positive contribution of HAs in the PS sub-basin is likely associated with the fertilization effect of elevated greenhouse gas emissions, this hypothesis is based on the fact that land cover types did not show significant changes during the study period (Figure 10f).
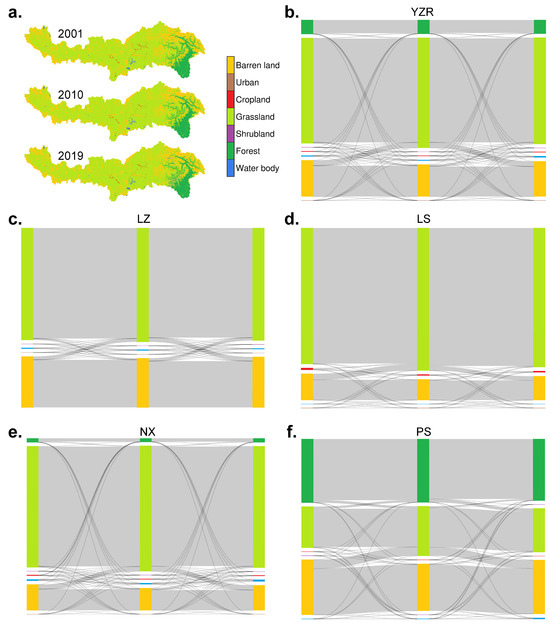
Figure 10.
Land-use transitions in the YZR basin from 2001 to 2019. (a) Land use/cover maps for 2001, 2010, and 2019. The land-use classes shown in the figure were reclassified based on the MOD-IGBP classification system (Table S4). (b) Sankey diagram depicting overall land-use transitions in the YZR basin. (c–f) Regional Sankey diagrams for the sub-basins: LZ (c), LS (d), NX (e), and PS (f), visualizing land-use changes within each sub-region over time.
4.4. Limitations and Future Prospects
This study enhances our understanding of the relative contributions of CC and HAs to vegetation dynamics through the application of a refined residual trend analysis. While this approach is practical and interpretable, it is constrained by its reliance on multiple linear regression, which cannot fully capture the nonlinear interactions among climatic factors and vegetation dynamics [79,80]. Future research should explore advanced statistical techniques, such as machine learning algorithms or process-based models, to better delineate the complex relationships driving vegetation changes.
Furthermore, while this study explores the influence of four key climatic variables (PRE, TEM, PET, and SRD) on vegetation dynamics, accounting for lag, accumulation, and their combined effects, it does not consider the rising frequency and intensity of extreme climatic events in a warming climate. Such events, including prolonged droughts and heatwaves, can profoundly affect vegetation dynamics and compromise ecosystem resilience [22,81]. To provide a more comprehensive understanding, future studies should integrate the effects of extreme climate events and consider their interactions with long-term climate trends and HAs.
5. Conclusions
We present a comprehensive analysis of vegetation dynamics and their drivers in the YZR basin from 2000 to 2019, emphasizing the disentanglement of CC and HAs contributions through an enhanced residual trend analysis. Climatic factors exhibited distinct spatiotemporal variability across the basin. TEM showed a consistent warming trend, with a basin-wide warming rate of 0.03 ± 0.02 °C yr−1. While PRE and SRD exhibited heterogeneous spatial patterns. PET increased basin-wide at a rate of 1.64 ± 3.41 mm yr−1, primarily driven by significant trends in the LS sub-basin. Collectively, PRE, TEM, and SRD showed weak lag effects (PRE: 0.14 ± 0.52 months; TEM: 0.11 ± 0.50 months; PET: 0.06 ± 0.29 months), but pronounced cumulative effects (PRE: 1.04 ± 0.49 months; TEM: 0.84 ± 0.65 months; PET: 1.53 ± 1.24 months). In contrast, SRD exhibited a significant lag effect (2.37 ± 0.79 months) and a weak cumulative effect (0.51 ± 0.63 months), highlighting the importance of incorporating temporal dynamics in vegetation–climate studies.
Vegetation dynamics, assessed via LAI, revealed a general greening trend of 0.018 m2 m−2 dec−1, with 66% of the basin exhibiting increases, of which only 10% were statistically significant (p < 0.05). Conversely, browning trends were observed in 34% of the basin, with statistical significance in 2%. CC contributed to 60% of the observed vegetation changes, particularly in the midstream and upstream of the YZR basin, while HAs accounted for 40%, with the greatest impact on the downstream PS sub-basin. Positive contributions from HAs in the PS sub-basin were primarily associated with the fertilization effect of increased greenhouse gas emissions. In contrast, negative impacts in the LZ and LS sub-basins were linked to overgrazing and agricultural activities, which likely hindered vegetation growth. This study highlighted the critical role of temporal effects of climate change on vegetation dynamics, emphasizing the need to consider both lag and cumulative effects in future vegetation and climate studies. The findings provide valuable insights for developing adaptive strategies in land management, climate change mitigation, and ecosystem conservation.
Supplementary Materials
The following supporting information can be downloaded at: https://www.mdpi.com/article/10.3390/rs17010160/s1. Table S1: Seasonal and annual means and trends of climatic factors (air temperature (TEM), precipitation (PRE), potential evapotranspiration (PET), and solar radiation (SRD)) across the Yarlung Zangbo River (YZR) basin and its sub-basins from 2000 to 2019. Table S2: Mean LAI and trends of LAI across the Yarlung Zangbo River (YZR) Basin and its sub-basins from 2000 to 2019. Table S3: Proportions (%) of dominant time-lag and time-accumulation effect combinations for precipitation (PRE), air temperature (TEM), potential evapotranspiration (PET), and solar radiation (SRD) across the Yarlung Zangbo River (YZR) basin and its sub-basins. Table S4: Reclassification of MOD-IGBP land cover types to the land cover classification used in this study.
Author Contributions
Conceptualization, N.L. and D.W.; methodology, N.L.; software, N.L.; validation, N.L. and D.W.; formal analysis, N.L.; investigation, N.L.; resources, N.L.; data curation, N.L.; writing—original draft preparation, N.L.; writing—review and editing, D.W.; visualization, N.L.; supervision, D.W.; project administration, D.W.; funding acquisition, D.W. All authors have read and agreed to the published version of the manuscript.
Funding
This research was funded by National Key Research and Development Program of China (2021YFB3900104), China Postdoctoral Science Foundation (2023M743631), and the Special Research Assistant Program of the Chinese Academy of Sciences (E3S30015Y5).
Data Availability Statement
The main data supporting the findings of this study are available through the websites provided in the article. Any other data used in this study are available from the corresponding author upon request.
Acknowledgments
We gratefully acknowledge the ERA5-Land and MODIS teams for their invaluable contributions in making the data freely available. Their efforts in providing high-quality, publicly accessible datasets have greatly facilitated this research and significantly enhanced the accuracy and reliability of our analyses.
Conflicts of Interest
The authors declare no conflicts of interest.
References
- Abera, T.A.; Heiskanen, J.; Pellikka, P.; Rautiainen, M.; Maeda, E.E. Clarifying the role of radiative mechanisms in the spatio-temporal changes of land surface temperature across the Horn of Africa. Remote Sens. Environ. 2019, 221, 210–224. [Google Scholar] [CrossRef]
- Bright, R.M.; Davin, E.; O’Halloran, T.; Pongratz, J.; Zhao, K.; Cescatti, A. Local temperature response to land cover and management change driven by non-radiative processes. Nat. Clim. Change 2017, 7, 296–302. [Google Scholar] [CrossRef]
- Zeng, Z.Z.; Piao, S.L.; Li, L.Z.X.; Zhou, L.M.; Ciais, P.; Wang, T.; Li, Y.; Lian, X.; Wood, E.F.; Friedlingstein, P.; et al. Climate mitigation from vegetation biophysical feedbacks during the past three decades. Nat. Clim. Change 2017, 7, 432–436. [Google Scholar] [CrossRef]
- Chen, C.; Park, T.; Wang, X.H.; Piao, S.L.; Xu, B.D.; Chaturvedi, R.K.; Fuchs, R.; Brovkin, V.; Ciais, P.; Fensholt, R.; et al. China and India lead in greening of the world through land-use management. Nat. Sustain. 2019, 2, 122–129. [Google Scholar] [CrossRef]
- Piao, S.; Wang, X.; Park, T.; Chen, C.; Lian, X.; He, Y.; Bjerke, J.W.; Chen, A.; Ciais, P.; Tommervik, H.; et al. Characteristics, drivers and feedbacks of global greening. Nat. Rev. Earth Environ. 2020, 1, 14–27. [Google Scholar] [CrossRef]
- Zhu, Z.C.; Piao, S.L.; Myneni, R.B.; Huang, M.T.; Zeng, Z.Z.; Canadell, J.G.; Ciais, P.; Sitch, S.; Friedlingstein, P.; Arneth, A.; et al. Greening of the Earth and its drivers. Nat. Clim. Change 2016, 6, 791–795. [Google Scholar] [CrossRef]
- D’Odorico, P.; Caylor, K.; Okin, G.S.; Scanlon, T.M. On soil moisture-vegetation feedbacks and their possible effects on the dynamics of dryland ecosystems. J. Geophys. Res.-Biogeosci. 2007, 112, G04010. [Google Scholar] [CrossRef]
- Li, Y.; Piao, S.; Li, L.Z.; Chen, A.; Wang, X.; Ciais, P.; Huang, L.; Lian, X.; Peng, S.; Zeng, Z. Divergent hydrological response to large-scale afforestation and vegetation greening in China. Sci. Adv. 2018, 4, eaar4182. [Google Scholar] [CrossRef]
- Zeng, Z.; Peng, L.; Piao, S. Response of terrestrial evapotranspiration to Earth’s greening. Curr. Opin. Environ. Sustain. 2018, 33, 9–25. [Google Scholar] [CrossRef]
- Yang, Y.; Roderick, M.L.; Guo, H.; Miralles, D.G.; Zhang, L.; Fatichi, S.; Luo, X.; Zhang, Y.; McVicar, T.R.; Tu, Z. Evapotranspiration on a greening Earth. Nat. Rev. Earth Environ. 2023, 4, 626–641. [Google Scholar] [CrossRef]
- Deng, Y.; Wang, S.; Bai, X.; Luo, G.; Wu, L.; Chen, F.; Wang, J.; Li, C.; Yang, Y.; Hu, Z.; et al. Vegetation greening intensified soil drying in some semi-arid and arid areas of the world. Agric. For. Meteorol. 2020, 292–293, 108103. [Google Scholar] [CrossRef]
- Liu, N.; Harper, R.J.; Smettem, K.R.J.; Dell, B.; Liu, S. Responses of streamflow to vegetation and climate change in southwestern Australia. J. Hydrol. 2019, 572, 761–770. [Google Scholar] [CrossRef]
- Li, N.; Wang, L.; Chen, D. Vegetation greening amplifies shallow soil temperature warming on the Tibetan Plateau. Npj Clim. Atmos. Sci. 2024, 7, 118. [Google Scholar] [CrossRef]
- Pang, G.; Chen, D.; Wang, X.; Lai, H.-W. Spatiotemporal variations of land surface albedo and associated influencing factors on the Tibetan Plateau. Sci. Total Environ. 2022, 804, 150100. [Google Scholar] [CrossRef]
- Tian, L.; Zhang, Y.; Zhu, J. Decreased surface albedo driven by denser vegetation on the Tibetan Plateau. Environ. Res. Lett. 2014, 9, 104001. [Google Scholar] [CrossRef]
- Fisher, J.B.; Whittaker, R.J.; Malhi, Y. ET come home: Potential evapotranspiration in geographical ecology. Glob. Ecol. Biogeogr. 2011, 20, 1–18. [Google Scholar] [CrossRef]
- Han, J.; Wang, J.; Zhao, Y.; Wang, Q.; Zhang, B.; Li, H.; Zhai, J. Spatio-temporal variation of potential evapotranspiration and climatic drivers in the Jing-Jin-Ji region, North China. Agric. For. Meteorol. 2018, 256, 75–83. [Google Scholar] [CrossRef]
- Rodriguez-Iturbe, I.; D’odorico, P.; Porporato, A.; Ridolfi, L. On the spatial and temporal links between vegetation, climate, and soil moisture. Water Resour. Res. 1999, 35, 3709–3722. [Google Scholar] [CrossRef]
- Woodward, F.; Lomas, M. Vegetation dynamics–simulating responses to climatic change. Biol. Rev. 2004, 79, 643–670. [Google Scholar] [CrossRef] [PubMed]
- Ding, Y.; Li, Z.; Peng, S. Global analysis of time-lag and -accumulation effects of climate on vegetation growth. Int. J. Appl. Earth Obs. Geoinf. 2020, 92, 102179. [Google Scholar] [CrossRef]
- Kuzyakov, Y.; Gavrichkova, O. Time lag between photosynthesis and carbon dioxide efflux from soil: A review of mechanisms and controls. Glob. Change Biol. 2010, 16, 3386–3406. [Google Scholar] [CrossRef]
- Ma, M.; Wang, Q.; Liu, R.; Zhao, Y.; Zhang, D. Effects of climate change and human activities on vegetation coverage change in northern China considering extreme climate and time-lag and -accumulation effects. Sci. Total Environ. 2023, 860, 160527. [Google Scholar] [CrossRef]
- Wen, Y.; Liu, X.; Pei, F.; Li, X.; Du, G. Non-uniform time-lag effects of terrestrial vegetation responses to asymmetric warming. Agric. For. Meteorol. 2018, 252, 130–143. [Google Scholar] [CrossRef]
- Xu, S.; Wang, Y.; Liu, Y.; Li, J.; Qian, K.; Yang, X.; Ma, X. Evaluating the cumulative and time-lag effects of vegetation response to drought in Central Asia under changing environments. J. Hydrol. 2023, 627, 130455. [Google Scholar] [CrossRef]
- Richardson, A.D.; Keenan, T.F.; Migliavacca, M.; Ryu, Y.; Sonnentag, O.; Toomey, M. Climate change, phenology, and phenological control of vegetation feedbacks to the climate system. Agric. For. Meteorol. 2013, 169, 156–173. [Google Scholar] [CrossRef]
- Zuo, D.P.; Han, Y.N.; Xu, Z.X.; Li, P.J.; Ban, C.G.; Sun, W.C.; Pang, B.; Peng, D.Z.; Kan, G.Y.; Zhang, R.; et al. Time-lag effects of climatic change and drought on vegetation dynamics in an alpine river basin of the Tibet Plateau, China. J. Hydrol. 2021, 600, 126532. [Google Scholar] [CrossRef]
- Wu, D.; Zhao, X.; Liang, S.; Zhou, T.; Huang, K.; Tang, B.; Zhao, W. Time-lag Effects of Global Vegetation Responses to Climate Change. Glob. Change Biol. 2015, 21, 3520–3531. [Google Scholar] [CrossRef]
- Wen, Y.; Liu, X.; Xin, Q.; Wu, J.; Xu, X.; Pei, F.; Li, X.; Du, G.; Cai, Y.; Lin, K. Cumulative effects of climatic factors on terrestrial vegetation growth. J. Geophys. Res. Biogeosc. 2019, 124, 789–806. [Google Scholar] [CrossRef]
- Piao, S.; Liu, Q.; Chen, A.; Janssens, I.A.; Fu, Y.; Dai, J.; Liu, L.; Lian, X.; Shen, M.; Zhu, X. Plant phenology and global climate change: Current progresses and challenges. Glob. Change Biol. 2019, 25, 1922–1940. [Google Scholar] [CrossRef] [PubMed]
- Lenka, N.K.; Lal, R. Soil-related constraints to the carbon dioxide fertilization effect. Crit. Rev. Plant Sci. 2012, 31, 342–357. [Google Scholar] [CrossRef]
- Foley, J.A.; DeFries, R.; Asner, G.P.; Barford, C.; Bonan, G.; Carpenter, S.R.; Chapin, F.S.; Coe, M.T.; Daily, G.C.; Gibbs, H.K. Global consequences of land use. Science 2005, 309, 570–574. [Google Scholar] [CrossRef]
- Song, X.-P.; Hansen, M.C.; Stehman, S.V.; Potapov, P.V.; Tyukavina, A.; Vermote, E.F.; Townshend, J.R. Global land change from 1982 to 2016. Nature 2018, 560, 639–643. [Google Scholar] [CrossRef] [PubMed]
- Marques, A.; Martins, I.S.; Kastner, T.; Plutzar, C.; Theurl, M.C.; Eisenmenger, N.; Huijbregts, M.A.; Wood, R.; Stadler, K.; Bruckner, M. Increasing impacts of land use on biodiversity and carbon sequestration driven by population and economic growth. Nat. Ecol. Evol. 2019, 3, 628–637. [Google Scholar] [CrossRef] [PubMed]
- Cao, S. Impact of China’s large-scale ecological restoration program on the environment and society in arid and semiarid areas of China: Achievements, problems, synthesis, and applications. Crit. Rev. Environ. Sci. Technol. 2011, 41, 317–335. [Google Scholar] [CrossRef]
- Sayer, J.; Chokkalingam, U.; Poulsen, J. The restoration of forest biodiversity and ecological values. For. Ecol. Manag. 2004, 201, 3–11. [Google Scholar] [CrossRef]
- Worlanyo, A.S.; Jiangfeng, L. Evaluating the environmental and economic impact of mining for post-mined land restoration and land-use: A review. J. Environ. Manag. 2021, 279, 111623. [Google Scholar] [CrossRef] [PubMed]
- Qiu, J. The third pole. Nature 2008, 454, 393–396. [Google Scholar] [CrossRef] [PubMed]
- Yao, T.; Xue, Y.; Chen, D.; Chen, F.; Thompson, L.; Cui, P.; Koike, T.; Lau, W.K.M.; Lettenmaier, D.; Mosbrugger, V.; et al. Recent Third Pole’s Rapid Warming Accompanies Cryospheric Melt and Water Cycle Intensification and Interactions between Monsoon and Environment: Multidisciplinary Approach with Observations, Modeling, and Analysis. Bull. Am. Meteorol. Soc. 2019, 100, 423–444. [Google Scholar] [CrossRef]
- Immerzeel, W.W.; Lutz, A.F.; Andrade, M.; Bahl, A.; Biemans, H.; Bolch, T.; Hyde, S.; Brumby, S.; Davies, B.J.; Elmore, A.C.; et al. Importance and vulnerability of the world’s water towers. Nature 2020, 577, 364–369. [Google Scholar] [CrossRef]
- Fu, B.; Ouyang, Z.; Shi, P.; Fan, J.; Wang, X.; Zheng, H.; Zhao, W.; Wu, F. Current Condition and Protection Strategies of Qinghai-Tibet Plateau Ecological Security Barrier. Bull. Chin. Acad. Sci. 2021, 36, 1298–1306. [Google Scholar]
- Yao, T.; Bolch, T.; Chen, D.; Gao, J.; Immerzeel, W.; Piao, S.; Su, F.; Thompson, L.; Wada, Y.; Wang, L.; et al. The imbalance of the Asian water tower. Nat. Rev. Earth Environ. 2022, 3, 618–632. [Google Scholar] [CrossRef]
- Zhang, X.; Yang, Y.; Piao, S.; Bao, W.; Wang, S.; Wang, G.; Sun, H.; Luo, T.; Zhang, Y.; Shi, P.; et al. Ecological change on the Tibetan Plateau. Chin. Sci. Bull. 2015, 60, 3048–3056. [Google Scholar]
- Chen, D.; Xu, B.; Yao, T.; Guo, Z.; Cui, P.; Chen, F.; Zhang, R.; Zhang, X.; Zhang, Y.; Fan, J.; et al. Assessment of past, present and future environmental changes on the Tibetan Plateau. Chin. Sci. Bull. 2015, 60, 3025–3035. [Google Scholar]
- Yang, K.; Wu, H.; Qin, J.; Lin, C.G.; Tang, W.J.; Chen, Y.Y. Recent climate changes over the Tibetan Plateau and their impacts on energy and water cycle: A review. Glob. Planet. Change 2014, 112, 79–91. [Google Scholar] [CrossRef]
- Yao, T.; Thompson, L.; Yang, W.; Yu, W.; Gao, Y.; Guo, X.; Yang, X.; Duan, K.; Zhao, H.; Xu, B.; et al. Different glacier status with atmospheric circulations in Tibetan Plateau and surroundings. Nat. Clim. Change 2012, 2, 663–667. [Google Scholar] [CrossRef]
- Wang, Y.; Lv, W.; Xue, K.; Wang, S.; Zhang, L.; Hu, R.; Zeng, H.; Xu, X.; Li, Y.; Jiang, L.; et al. Grassland changes and adaptive management on the Qinghai–Tibetan Plateau. Nat. Rev. Earth Environ. 2022, 3, 668–683. [Google Scholar] [CrossRef]
- Wei, Y.; Lu, H.; Wang, J.; Wang, X.; Sun, J. Dual influence of climate change and anthropogenic activities on the spatiotemporal vegetation dynamics over the Qinghai-Tibetan plateau from 1981 to 2015. Earth’s Future 2022, 10, e2021EF002566. [Google Scholar] [CrossRef]
- Hua, T.; Wang, X.M. Temporal and Spatial Variations in the Climate Controls of Vegetation Dynamics on the Tibetan Plateau during 1982–2011. Adv. Atmos. Sci. 2018, 35, 1337–1346. [Google Scholar] [CrossRef]
- Wang, Z.P.; Wu, J.S.; Niu, B.; He, Y.T.; Zu, J.X.; Li, M.; Zhang, X.Z. Vegetation Expansion on the Tibetan Plateau and Its Relationship with Climate Change. Remote Sens. 2020, 12, 4150. [Google Scholar] [CrossRef]
- Bai, T.; Liu, J.; Liu, H.; Ni, F.; Han, X.; Qiao, X.; Sun, X. Elevation-dependent patterns of temporally asymmetrical vegetation response to climate in an alpine basin on the Qinghai-Tibet Plateau. Ecol. Indic. 2024, 159, 111736. [Google Scholar] [CrossRef]
- He, X.H.; Liu, A.Q.; Tian, Z.H.; Wu, L.L.; Zhou, G.S. Response of Vegetation Phenology to Climate Change on the Tibetan Plateau Considering Time-Lag and Cumulative Effects. Remote Sens. 2024, 16, 49. [Google Scholar] [CrossRef]
- Liu, Y.; Xie, Y.; Guo, Z.; Xi, G. Effects of Climate Variability and Human Activities on Vegetation Dynamics across the Qinghai–Tibet Plateau from 1982 to 2020. Remote Sens. 2023, 15, 4988. [Google Scholar] [CrossRef]
- Liu, X.X.; Zhao, W.W.; Yao, Y.; Pereira, P. The rising human footprint in the Tibetan Plateau threatens the effectiveness of ecological restoration on vegetation growth. J. Environ. Manag. 2024, 351, 119963. [Google Scholar] [CrossRef] [PubMed]
- Hua, T.; Wang, X.; Ci, Z.; Lang, L.; Zhang, C. Responses of vegetation activity to climate variation on the Qinghai-Tibetan Plateau (China) from 1982 to 2011. Clim. Res. 2015, 66, 65–73. [Google Scholar] [CrossRef]
- Weatherhead, E.C.; Reinsel, G.C.; Tiao, G.C.; Meng, X.L.; Choi, D.; Cheang, W.K.; Keller, T.; DeLuisi, J.; Wuebbles, D.J.; Kerr, J.B. Factors affecting the detection of trends: Statistical considerations and applications to environmental data. J. Geophys. Res. Atmos. 1998, 103, 17149–17161. [Google Scholar] [CrossRef]
- Holben, B.N. Characteristics of maximum-value composite images from temporal AVHRR data. Int. J. Remote Sens. 1986, 7, 1417–1434. [Google Scholar] [CrossRef]
- Evans, J.; Geerken, R. Discrimination between climate and human-induced dryland degradation. J. Arid Environ. 2004, 57, 535–554. [Google Scholar] [CrossRef]
- Geerken, R.; Ilaiwi, M. Assessment of rangeland degradation and development of a strategy for rehabilitation. Remote Sens. Environ. 2004, 90, 490–504. [Google Scholar] [CrossRef]
- Sun, Y.; Yang, Y.; Zhang, L.; Wang, Z. The relative roles of climate variations and human activities in vegetation change in North China. Phys. Chem. Earth Parts A/B/C 2015, 87, 67–78. [Google Scholar] [CrossRef]
- Liu, J.; Pattey, E.; Jégo, G. Assessment of vegetation indices for regional crop green LAI estimation from Landsat images over multiple growing seasons. Remote Sens. Environ. 2012, 123, 347–358. [Google Scholar] [CrossRef]
- Zhe, M.; Zhang, X. Time-lag effects of NDVI responses to climate change in the Yamzhog Yumco Basin, South Tibet. Ecol. Indic. 2021, 124, 107431. [Google Scholar] [CrossRef]
- Sun, W.; Wang, Y.; Fu, Y.H.; Xue, B.; Wang, G.; Yu, J.; Zuo, D.; Xu, Z. Spatial heterogeneity of changes in vegetation growth and their driving forces based on satellite observations of the Yarlung Zangbo River Basin in the Tibetan Plateau. J. Hydrol. 2019, 574, 324–332. [Google Scholar] [CrossRef]
- Piao, S.; Mohammat, A.; Fang, J.; Cai, Q.; Feng, J. NDVI-based increase in growth of temperate grasslands and its responses to climate changes in China. Glob. Environ. Change 2006, 16, 340–348. [Google Scholar] [CrossRef]
- Zhong, L.; Ma, Y.; Fu, Y.; Pan, X.; Hu, W.; Su, Z.; Salama, M.S.; Feng, L. Assessment of soil water deficit for the middle reaches of Yarlung-Zangbo River from optical and passive microwave images. Remote Sens. Environ. 2014, 142, 1–8. [Google Scholar] [CrossRef]
- Gui, Y.; Wang, Q.; Zhao, Y.; Dong, Y.; Li, H.; Jiang, S.; He, X.; Liu, K. Attribution analyses of reference evapotranspiration changes in China incorporating surface resistance change response to elevated CO2. J. Hydrol. 2021, 599, 126387. [Google Scholar] [CrossRef]
- Li, G.; Chen, W.; Zhang, X.; Bi, P.; Yang, Z.; Shi, X.; Wang, Z. Spatiotemporal dynamics of vegetation in China from 1981 to 2100 from the perspective of hydrothermal factor analysis. Environ. Sci. Pollut. Res. 2022, 29, 14219–14230. [Google Scholar] [CrossRef] [PubMed]
- Du, G.; Yan, S.; Chen, H.; Yang, J.; Wen, Y. Intra-Annual Cumulative Effects and Mechanisms of Climatic Factors on Global Vegetation Biomes’ Growth. Remote Sens. 2024, 16, 779. [Google Scholar] [CrossRef]
- Roy, P.S.; Ramachandran, R.M.; Paul, O.; Thakur, P.K.; Ravan, S.; Behera, M.D.; Sarangi, C.; Kanawade, V.P. Anthropogenic land use and land cover changes—A review on its environmental consequences and climate change. J. Indian Soc. Remote Sens. 2022, 50, 1615–1640. [Google Scholar] [CrossRef]
- Seneviratne, S.I.; Zhang, X.; Adnan, M.; Badi, W.; Dereczynski, C.; Luca, A.D.; Ghosh, S.; Iskandar, I.; Kossin, J.; Lewis, S. Weather and climate extreme events in a changing climate. In Climate Change 2021: The Physical Science Basis: Working Group I Contribution to the Sixth Assessment Report of the Intergovernmental Panel on Climate Change; Masson-Delmotte, V.P., Zhai, A., Pirani, S.L., Connors, C., Eds.; Cambridge University Press: Cambridge, UK, 2021; pp. 1513–1766. [Google Scholar]
- D’Odorico, P.; Bhattachan, A.; Davis, K.F.; Ravi, S.; Runyan, C.W. Global desertification: Drivers and feedbacks. Adv. Water Resour. 2013, 51, 326–344. [Google Scholar] [CrossRef]
- Fayiah, M.; Dong, S.; Khomera, S.W.; Ur Rehman, S.A.; Yang, M.; Xiao, J. Status and challenges of Qinghai–Tibet Plateau’s grasslands: An analysis of causes, mitigation measures, and way forward. Sustainability 2020, 12, 1099. [Google Scholar] [CrossRef]
- Gomiero, T. Soil degradation, land scarcity and food security: Reviewing a complex challenge. Sustainability 2016, 8, 281. [Google Scholar] [CrossRef]
- Aradottir, A.L.; Hagen, D. Ecological restoration: Approaches and impacts on vegetation, soils and society. Adv. Agron. 2013, 120, 173–222. [Google Scholar]
- Li, M.; Zhang, X.; Wu, J.; Ding, Q.; Niu, B.; He, Y. Declining human activity intensity on alpine grasslands of the Tibetan Plateau. J. Environ. Manag. 2021, 296, 113198. [Google Scholar] [CrossRef] [PubMed]
- Cuo, L.; Li, N.; Liu, Z.; Ding, J.; Liang, L.Q.; Zhang, Y.X.; Gong, T.L. Warming and human activities induced changes in the Yarlung Tsangpo basin of the Tibetan plateau and their influences on streamflow. J. Hydrol.-Reg. Stud. 2019, 25, 100625. [Google Scholar] [CrossRef]
- Li, C.; Hao, J.; Zhang, G.; Fang, H.; Wang, Y.; Lu, H. Runoff variations affected by climate change and human activities in Yarlung Zangbo River, southeastern Tibetan Plateau. CATENA 2023, 230, 107184. [Google Scholar] [CrossRef]
- Li, H.; Liu, L.; Liu, X.; Li, X.; Xu, Z. Greening Implication Inferred from Vegetation Dynamics Interacted with Climate Change and Human Activities over the Southeast Qinghai–Tibet Plateau. Remote Sens. 2019, 11, 2421. [Google Scholar] [CrossRef]
- Li, Y.; Gong, J.; Zhang, Y.; Gao, B. NDVI-Based Greening of Alpine Steppe and Its Relationships with Climatic Change and Grazing Intensity in the Southwestern Tibetan Plateau. Land 2022, 11, 975. [Google Scholar] [CrossRef]
- Qi, X.; Jia, J.; Liu, H.; Lin, Z. Relative importance of climate change and human activities for vegetation changes on China’s silk road economic belt over multiple timescales. CATENA 2019, 180, 224–237. [Google Scholar] [CrossRef]
- Shi, S.; Yu, J.; Wang, F.; Wang, P.; Zhang, Y.; Jin, K. Quantitative contributions of climate change and human activities to vegetation changes over multiple time scales on the Loess Plateau. Sci. Total Environ. 2021, 755, 142419. [Google Scholar] [CrossRef]
- Zhang, Y.; Hong, S.; Liu, D.; Piao, S. Susceptibility of vegetation low-growth to climate extremes on Tibetan Plateau. Agric. For. Meteorol. 2023, 331, 109323. [Google Scholar] [CrossRef]


Disclaimer/Publisher’s Note: The statements, opinions and data contained in all publications are solely those of the individual author(s) and contributor(s) and not of MDPI and/or the editor(s). MDPI and/or the editor(s) disclaim responsibility for any injury to people or property resulting from any ideas, methods, instructions or products referred to in the content. |
© 2025 by the authors. Licensee MDPI, Basel, Switzerland. This article is an open access article distributed under the terms and conditions of the Creative Commons Attribution (CC BY) license (https://creativecommons.org/licenses/by/4.0/).