Article

Forest Fire Discrimination Based on Angle Slope Index and Himawari-8

1
College of Forestry, Soil and Water Conservation, Central South University of Forestry and Technology, Changsha 410004, China
2
College of Computer Science and Mathematics, Central South University of Forestry and Technology, Changsha 410004, China
*
Author to whom correspondence should be addressed.
Remote Sens. 2025, 17(1), 142; https://doi.org/10.3390/rs17010142
Submission received: 27 September 2024 / Revised: 17 November 2024 / Accepted: 31 December 2024 / Published: 3 January 2025

Abstract

:
In the background of high frequency and intensity forest fires driven by future warming and a drying climate, early detection and effective control of fires are extremely important to reduce losses. Meteorological satellite imagery is commonly used for near-real-time forest fire monitoring, thanks to its high temporal resolution. To address the misjudgments and omissions caused by solely relying on changes in infrared band brightness values and a single image in forest fire early discrimination, this paper constructs the angle slope indexes ANIR, AMIR, AMNIR, ∆ANIR, and ∆AMIR based on the reflectance of the red band and near-infrared band, the brightness temperature of the mid-infrared and far-infrared band, the difference between the AMIR and ANIR, and the index difference between time-series images. These indexes integrate the strong inter-band correlations and the reflectance characteristics of visible and short-wave infrared bands to simultaneously monitor smoke and fuel biomass changes in forest fires. We also used the decomposed three-dimensional OTSU (maximum inter-class variance method) algorithm to calculate the segmentation threshold of the sub-regions constructed from the AMNIR data to address the different discrimination thresholds caused by different time and space backgrounds. In this paper, the Himawari-8 satellite imagery was used to detect forest fires based on the angle slope indices thresholds algorithm (ASITR), and the fusion of the decomposed three-dimensional OTSU and ASITR algorithm (FDOA). Results show that, compared with ASITR, the accuracy of FDOA decreased by 3.41% (0.88 vs. 0.85), the omission error decreased by 52.94% (0.17 vs. 0.08), and the overall evaluation increased by 3.53% (0.85 vs. 0.88). The ASITR has higher accuracy, and the fusion of decomposed three-dimensional OTSU and angle slope indexes can reduce forest fire omission error and improve the overall evaluation.

1. Introduction

Forest fire has been listed by the United Nations as one of the biggest threats to social crises and ecological disasters [1]. It is one of the biggest threats to forest resources and ecological civilization construction and can destroy millions of acres of land at shockingly fast speeds. The duration of fire seasons globally has extended by 27% since 1979, and the severity has multiplied. It was reported that with global warming of 1.5 °C, the world would face inevitable multiple climate hazards, and even temporarily exceeding this warming level will cause additional severe impacts, some of which will be irreversible [2]. This means that the fire prevention situation is extremely serious in the coming years.
In the background of high-frequency and -intensity forest fires driven by future warming and a drying climate, early detection and effective control of fires are extremely important to reduce losses resulting from forest fires. Satellite remote sensing, which is characterized by a wide observation and strong repeat observation capability, has become an important means of rapidly monitoring forest fires, replacing traditional means such as manual measurement and aerial photography [3]. It has significant advantages over fires occurring in pristine forest areas that are difficult to access [4].
Many scholars have made use of remote sensing data to study forest fire identification [5,6,7,8,9,10,11,12,13,14,15,16,17,18,19,20]. The Cooperative Institute for Meteorological Satellite Studies developed the Visible Infrared Spin Scan Radiometer Atmospheric Sounder (VAS) automated biomass burning algorithm (ABBA). Prins et al. wrote the Algorithm Theory Document of COESRABI Fire Point Recognition (ATBD) based on the ABBA [12]. Dozier used the mid-infrared band for fire monitoring and proposed a sub-pixel fire point estimation model based on Planck’s law [9], which was improved by many subsequent algorithms [7,13,14]. Kaufman and others proposed the MODIS fire point detection algorithm based on the Advanced Very High-Resolution Radiometer (AVHRR) global fire point detection algorithm [15,16], which was further revised by Justice et al. [17]. Giglio et al. [7] further revised it in 2002, and devised a contextual active fire detection algorithm based on both the 4 µm brightness temperature and the 4 µm and 11 µm brightness temperature difference, which offered increased sensitivity to smaller, cooler fires as well as a lower false alarm rate. Qin et al. proposed a new detection index K ((T20 − T31)/T20) based on MODIS [18,19]. Gong et al. used the Breaks for Additive Segments and Trend (BFAST) algorithm to detect breakpoints of time-series data and identify potential fire points to address the deficiency associated with the fixed threshold discrimination method, which could not meet regional differences [20].
With the development of remote sensing technology, high temporal resolution new-generation geostationary meteorological satellites (such as Himawari-8) are gradually replacing older-generation polar orbiting and geostationary meteorological satellites (VIIRS [21], MODIS [7], GOES [22]), and are becoming mainstream in the Eastern Hemisphere [23,24,25,26,27,28,29]. Xiong et al. [27,28,30] used data from Himawari-8 and FY-4A to build various models for forest fire discrimination. Jang [29] developed a method for obtaining effective fire detection parameters based on the ratios of Himawari-8 bands. Feng et al. [31] used the ratio relationship between the value, mean value, and standard deviation of image pixels and developed a new index to distinguish potential fire points according to the brightness temperature changes of mid-infrared and thermal infrared when a fire occurred, and improved the discrimination accuracy.
Furthermore, to address the poor universality of thresholds, scholars have introduced machine learning algorithms, including the support vector machine (SVM), decision tree models, random forest (RF) classifiers, the maximum inter-class variance method (OTSU), and neural networks, into existing discrimination algorithms [30,32,33,34,35]. While random forest classifiers can generate good discrimination results, they require the input of different parameters for different research areas, and the volume of input parameters is large. One-dimensional OTSU [36] and two-dimensional OTSU [37] cannot differentiate noise in the image close to the target, and the three-dimensional OTSU [38] algorithm has not been effectively used in practical applications due to its high computational complexity and large amount of computation. Deep learning is limited by the size of the data for practical application.
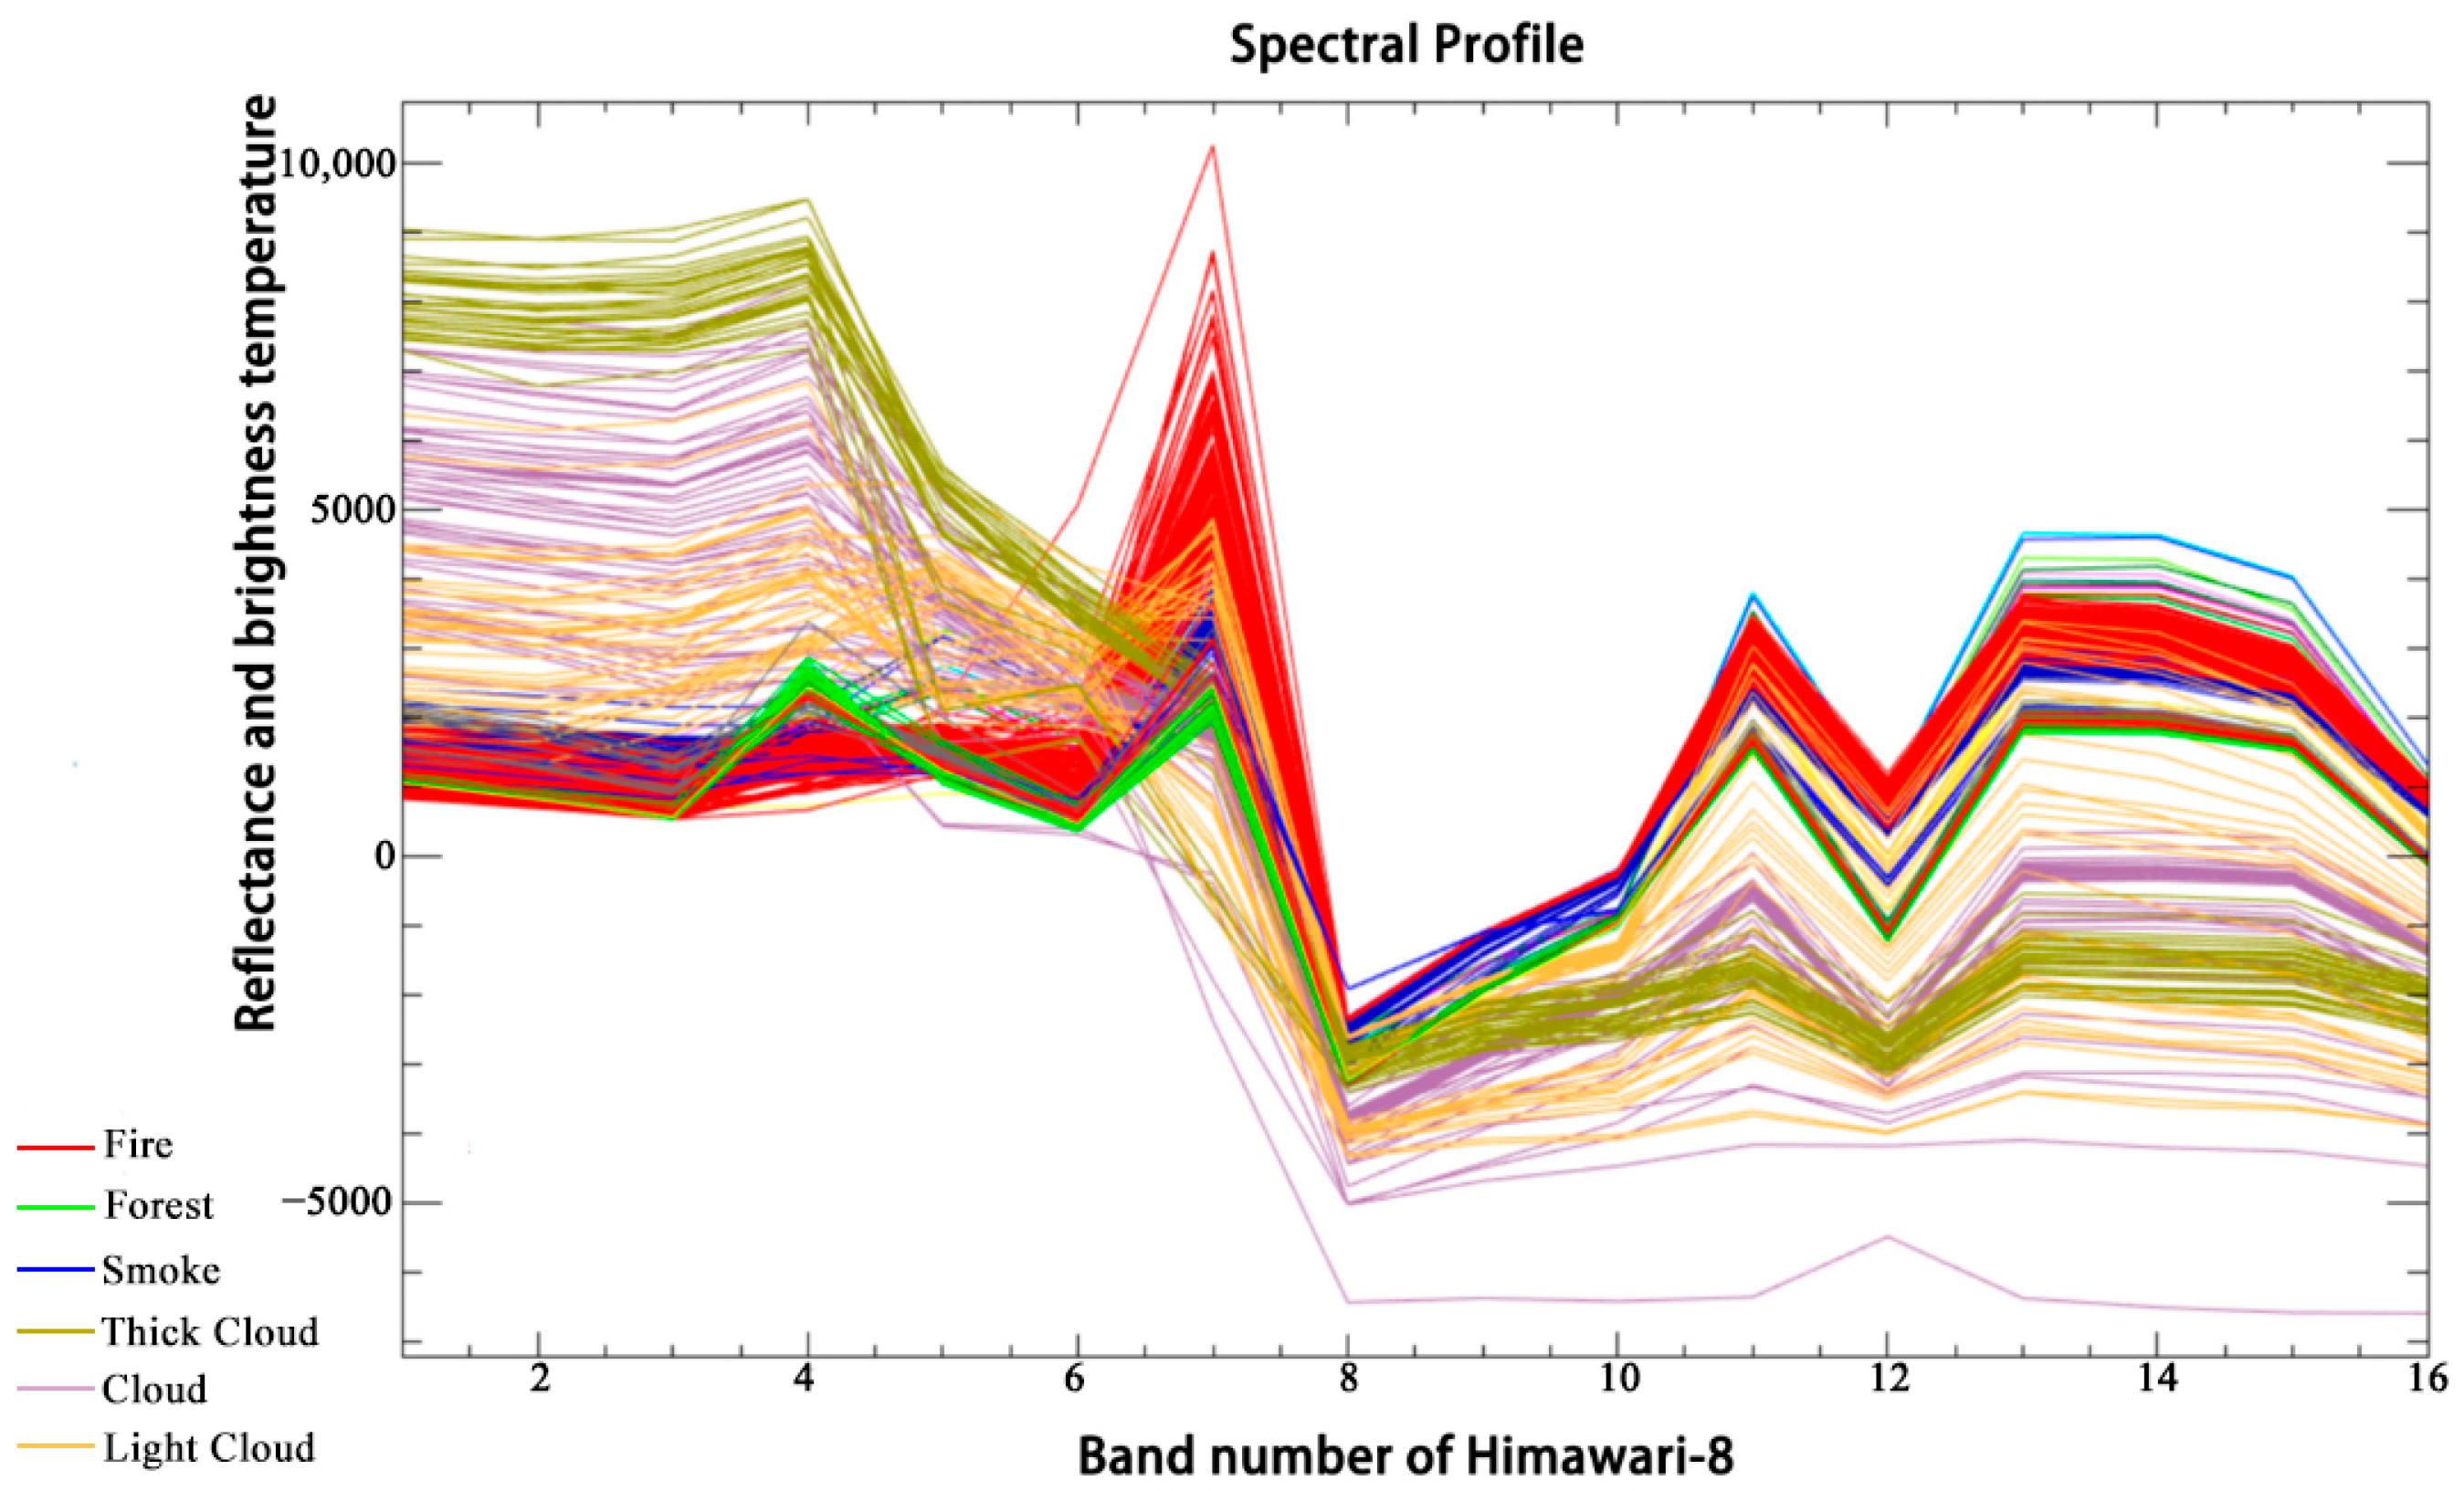
Most of the aforementioned forest fire monitoring methods are based on infrared band brightness values and the indices constructed from them, ignoring the changes of other bands during forest fires and the strong inter-band correlations. When forest fires occur, fire smoke, vegetation destruction, and thermal radiation changes can impact visible, near-infrared, and infrared bands, and there is a strong correlation between each independent band in the spectral imagery. The relationship between bands of different wavelengths in the spectral data is as important as the reflectance and brightness temperature values. Scholars have made some attempts in this area [32,39,40,41,42,43,44], proposing different methods such as the brightness temperature–vegetation index–aerosol optical depth method [39], the brightness temperature–smoke fusion method [32,40], and the solar zenith angle [41]. Wooster et al. constructed the fire point extraction index [42] of the LSA SAF Meteosat satellite based on the brightness temperature of IR 3.9 µm (MWIR), IR 10.8 µm (LWIR), and IR 12.0 µm (LWIR) channels and the spectral radians of IR 3.9 µm and VIS 0.6 µm (visible) channels based on the SEVIRI sensor of the European Meteosat satellite. This method uses a lower threshold to avoid the missed detection of fire points as much as possible, but the pixel parameter value in the area uniformly heated by the sun may also reach the detection limit, leading to a large error. Pan et al. [43] considered the effects of the atmosphere and sun on smaller surfaces in daytime images and devised a more practical spectral method, but the method still could not produce corresponding effects in complex real environments.
To address the above problems, this paper constructs new indexes for forest fire discriminant which make full use of the spectral bands of satellite remote sensing images and their strong correlation. The decomposed 3-dimensional OTSU adaptive threshold segmentation algorithm is adopted according to the background differences in different regions at the same time, with a goal to improve the accuracy of fire point recognition.

2. Data and Methods

2.1. Data

2.1.1. The Remote Sensing Satellite Sensors and Data Channels

Himawari-8 satellite was launched at 14:16 on October 7, 2014, equipped with the advanced imager AHI. The temporal resolution of the entire observation is 10 min once, and that of Japan and specific target areas can reach 2.5 min. The spatial resolution is divided into three sections: 0.5 km (channel 3), 1 km (channel 1,2,4), and 2 km (channel 5~16) [6]. The AHI has 16 detection channels: 3 visible light channels (red, green, and blue), 3 near-infrared channels, and 10 infrared channels, which can be used to detect various fields including surface vegetation, ocean water color, atmospheric environment, cloud parameters, and fire point identification. As the Himawari-8 satellite can accurately locate fire points within 1 pixel, it would meet the requirements in actual fire monitoring. The study data were full-scale observation data of Himawari-8 L1 NC (Network Common Data Format) downloaded from the Japan Meteorological Agency. The selected bands were processed first by band synthesis and then by data clipping. Band synthesis was performed using the MATLAB R2016a software for the NC bands 3, 4 and 5; bands 6, 7 and 8; and bands 7 and 14, with a Universal Transverse Mercator (UTM) projection based on WGS84. These data were saved in tif-format and named as the B345 dataset, B678 dataset, and B7_14 dataset, respectively. The B345 dataset and B678 dataset were used for constructing ASI (angle slope index based on angle slope values in the spectrum) to monitor fire, and the B7_14 dataset was used for cloud detection. Using the Subset Data from Shapefile Batch tool in ENVI 5.3 software, data clipping was performed on the B345 dataset, B678 dataset, and B7_14 dataset in conjunction with the study area.
This study also used sentinel-2A data to observe and verify forest fires. The Sentinel-2A satellite, part of the “Global Environment and Security Monitoring” initiative, was launched on 23 June 2015. Sentinel-2A is equipped with a multispectral imager capable of covering 13 spectral bands with a swath width of 290 km. It offers a spatial resolution of 10 m and a revisit cycle of 10 days. The satellite features different spatial resolutions across the visible, near-infrared, and short-wave infrared spectra, and is used for observing changes in land cover and forests, monitoring pollution in lakes and coastal waters, and imaging natural disasters such as floods, volcanic eruptions, and landslides. Sentinel-2 data were downloaded from the European Space Agency’s Copernicus Data Center (https://dataspace.copernicus.eu (accessed on 20 March 2023)). The pre-processing steps were as follows.
Firstly, the Level-1C product (raw data) was radiometrically corrected using Sen2Cor2.5.5 software [7] and converted to the Level-2A product.
Secondly, the Level-2A data were resampled to 10 m resolution and converted to ENVI format using ESA-SNAP 9.0 software.
Lastly, data were loaded into ENVI 5.3 software for band combination and clipping.
The remote sensing satellite sensors and data channels selected are shown in Table 1.

2.1.2. Sample Points Data for Angle Slope Index Threshold Statistics

Australia, located in the southern hemisphere’s hot zone, with a latitude and longitude range of 10°41′~43°39′, 112°~154° (see Figure 1), features a dry climate with little annual rainfall. It has extensive forest cover, primarily consisting of flammable tree species. The forest fires in Australia are among the most powerful disasters in recent years, characterized by long durations and wide areas, causing severe environmental, economic, and social impacts. The hot, dry, and cloudless weather in Australia provides a unique advantage for the collection of forest fire sample points. In this study, the sample data were taken from Australia and selected based on historical news records, research data, and Himawari-8 satellite forest fire product data (reliability = 5) as shown in Appendix A. Firstly, we selected the JAXAWLF (Wild Land Fire) 1-day product data (Level-3) launched by the Japan Meteorological Agency, for which reliability is 5, then excluded non-forest fire points based on global 30 m resolution land cover data, and verified the fire sample information by the fire smoke and burned area information on the satellite imagery combined with band 3, band 2, and band 1 of the Himawari-8 satellite, and band 4, band 3, band 2, band 12, band 11, and band 8A of Sentinel-2. The imagery combined with band 3, band 2, and band 1 of the Himawari-8 satellite and band 4, band 3, and band 2 of Sentinel-2 could capture the fire smoke, and the imagery combined with band 12, band 11, and band 8A of Sentinel-2 could clearly see the burning area of the fire, as shown in Figure 2.

2.1.3. Forest Fire Ground Actual Data and Land Cover Data

Hunan Province is located in central China, with a latitude and longitude range of 108°47′~114°15′, 24°38′~30°08′ (see Figure 3). It has a mountainous area of about 108,472 km2, accounting for 51.21% of the total land area of 211,829 km2 [45]. It has a subtropical monsoon climate with abundant light, heat, and precipitation, and its average annual temperature ranges between 16 °C and 18 °C. The favorable climatic conditions resulted in dense vegetation; as of 2022, the forest coverage rate in Hunan Province was 59.98% [46]. Due to its large mountainous area and high forest cover, fighting forest fires is challenging. From 2000 to 2018, a total of 25,977 forest disaster fires occurred in Hunan Province, with a total destroyed forest area of 1062.21 km2 and a total forest fire area of 1954.60 km2. Effective forest disaster fire monitoring and fire-fighting are of practical significance in maintaining ecological security.
Forest fire actual data were provided by the Hunan Forest Fire Prevention and Extinguish Command Center after video verification and manual verification, and contain information such as location, forest fire initiation time, forest fire extinguish time, affected area, weather, forest fire initiation reason, etc.
The Hunan Forest Fire Prevention and Extinguish Command Center sends professionals to confirm and report in detail on forest fire disasters that occur in Hunan Province. Professional utilize Global Position System (GPS), surveying equipment, and a CW-15 vertical take-off and landing fixed-wing drone (Zongheng, Chengdu, China, fuselage length 2.06 m, wingspan 3.54 m, endurance 180 min, cruise speed 61 km/h, horizontal positioning accuracy 1 cm + 1 ppm), with a CA-103 aerial camera (Jiuwu Intelligent Driving, Chengdu, China, sensor size 35.70 mm × 23.80 mm, effective pixels 61 megapixels, image resolution or pixels 9504 × 6336), to conduct an on-site survey, post-disaster assessment, and wide-area orthophoto or tilt data collection. Table 2 shows the information about a portion of the forest fire actual data.
Global Land Cover data with 30 m resolution for 2017 were downloaded from the Star Cloud Data Service Platform of Peng Cheng Laboratory (https://data-starcloud.pcl.ac.cn/zh (accessed on 25 January 2023)). The data include eleven categories: farmland, forest, grassland, shrubland, wetlands, water bodies, tundra, impervious surfaces, bare land, ice and snow, and clouds.
The 30 m Global Land Cover Fine Classification Product V1.0 for the year 2020 was downloaded from the Data Sharing Service System of the Aerospace Information Research Institute, Chinese Academy of Sciences. The land cover classification includes, but is not limited to, land use types (such as farmland, forests, urban areas), surface water bodies (such as lakes, rivers), rocks, and soils, encompassing a total of 29 categories. The forest areas within Hunan Province extracted from these data are shown in Figure 4.

2.2. Method

The forest fire discrimination method based on the angle slope index utilizes the unique characteristics of angles formed by reflectance values in visible, near-infrared, and short-wave infrared bands, as well as brightness temperatures in mid-infrared and far-infrared bands in the spectral images of forested areas and fire points. The method also leverages changes in these angles observed in spectral images during a fire event to construct a forest fire discrimination index. Additionally, a decomposed three-dimensional OTSU adaptive threshold segmentation algorithm was used to calculate the forest fire index thresholds against different backgrounds. The accuracy of this method was evaluated using actual forest fire data. Figure 5 illustrates the data processing and analysis flowchart, which will be elaborated in the subsequent sub-sections.

2.2.1. The Theoretical Basis of Satellite Remote Sensing Fire Point Identification

When forest fires occur, vegetation in the burning area is destroyed, and the decrease in chlorophyll content causes changes in the reflectance of visible, red-edge, and near-infrared (NIR) bands. These are specifically indicated as a decrease in the reflectance of the near-infrared band, an increase in the short-wave infrared reflectance, and a significant decrease in the normalized vegetation index ( N D V I = ( N I R R ) / ( N I R + R ) ). At the same time, according to the basic law of thermal radiation (Wien’s displacement law), the wavelength corresponding to the object’s radiation peak is inversely proportional to the temperature, and as the object’s temperature increases, the radiation peak moves to the shortwave direction. The main temperature range of forest burning is 600~1300 K, and the corresponding peak wavelength is in the mid-infrared (MIR, 3~5 μm) range, while the peak wavelength of the surface normal temperature (about 300 K) is about 11 μm. In the mid-infrared band, the difference between the radiation emitted by combustion and the background radiation can be up to four orders of magnitude. According to Planck’s law, the result of this difference in radiation brightness is that even if the fire area only accounts for 1/104–1/103 of the total area of the pixel, the brightness temperature value of the fire point pixel in the mid-infrared band will be significantly increased, and there will be a significant difference with the surrounding pixels. In the far-infrared band, the brightness temperature may also be different, but the difference is smaller. This characteristic of the bright temperature difference can be used as the main basis for fire point identification.

2.2.2. Forest Fire Discrimination

Cloud Detection

Clouds obscure the real information of ground objects when monitoring forest fires with remote sensing imagery, and reduce the quality of images and the accuracy of fire point discrimination. In this study, a multi-spectral comprehensive threshold cloud detection algorithm was adopted [22]. It uses the brightness temperature or reflectivity of clouds in infrared and visible spectra to identify the characteristics different from other ground objects, and the detection results were corrected by the clear sky repair algorithm. The specific algorithm is as follows:
Identify thick cloud conditions:
ρ 03 > 0.3   or   0.9 < ρ 04 ρ 03 < 1.1 ,
Identify high cloud conditions:
B T 16 < 236 K   or   ( 0.09 < ρ 03 ρ 05 ρ 03 + ρ 05 < 0.2   and   ρ 01 > 0.1 ) ,
Identify medium cloud conditions:
BT 14 < 278 K   or   B T 7 B T 14 > 20 K ,
Perform clear sky repair on the identified cloud pixels:
0.18 N D V I 0.2 ,
where ρ is the apparent reflectance of channels 3, 4, 5 of AHI; BT is the brightness temperature of channels 7, 14, 16 of AHI; and NDVI is the normalized difference vegetation index.

Forest Land Discrimination

Considering the dynamic changes in forest resources, the following comprehensive methods were adopted in woodland identification:
  • Use land cover data: the 30 m resolution product of Global Land Cover.
  • Use the normalized difference vegetation index (NDVI) [10] to confirm:
    N D V I = N I R R / N I R + R   and   N D V I > 0.45 ,
    where N I R represents the reflection value of the near infrared band and R represents the reflection value of the red band.

Forest Fire Point Discrimination

  • Construction of angle slope indices and forest fire discrimination.
    (1)
    The angle slope index, proposed by Palacios-Orueta and Khanna et al., describes the relationship between the three continuous bands by using the geometric shape of the spectra, so it detects not only the reflectance values of bands, but also the relationship between the bands. When forest fires break out, vegetation destruction and thermal radiation have a certain impact on visible, near-infrared, and infrared bands (see Figure 6). There is a strong correlation between each independent band in spectral images, and the relationship between bands in spectral data is as important as the reflectivity, radiation, and brightness temperature. Therefore, the angle slope index is more sensitive to the occurrence of forest fires and can better capture the information of forest fire points. In this study, new angle slope indexes were constructed to analyze the spectrum characteristics and changes in forest fire points.
    (2)
    As shown in the schematic diagram of the spectral curve in Figure 6, the x-axis in the coordinate system represents the identifiers for bands 1–16 of the Himawari-8 satellite, corresponding to integer values 1–16. The y-axis corresponds to reflectance values for bands 1–6, which cover the visible, near-infrared, and short-wave infrared regions, while for bands 7–16, it corresponds to the brightness temperature values in the infrared region.
    (3)
    Angle slope indices ANIR, AMIR, and AMNIR are defined as follows (refer to the law of cosine):
    A N I R = R R R N 2 + R N R S 2 R R R S 2 2 R R R N R N R S ,
    A M I R = R S B M 2 + B M B F 2 R S B F 2 2 R S B M B M B F ,
    (4)
    In Formula (6), R R , R N respectively represent the points corresponding to the reflectance values of the red band and near-infrared band on a coordinate system; R R R N represents the distance between these two points in the coordinate system and, similarly, R N R S represents the distance between the points corresponding to the reflectance values of the near-infrared band and short-wave infrared band in the coordinate system; and R R R S represents the distance between the points corresponding to the reflectance values of the near-infrared band and short-wave infrared band in the coordinate system. The calculation result is the cosine values corresponding to R R R N R S .
    (5)
    In Formula (7), R S represents the point corresponding to the reflectance value of the short-wave infrared band in the coordinate system and B M represents the point corresponding to the brightness temperature value of the mid-infrared band in the coordinate system. Similarly, | B M B F | represents the distance between the points corresponding to the brightness temperature values of the mid-infrared band and far-infrared band in the coordinate system, and | R S B F | represents the distance between the points corresponding to the reflectance value of the short-wave infrared band and the brightness temperature value of the far-infrared band in the coordinate system. The calculation result is the cosine values corresponding to R S B M B F .
    (6)
    Differences in the order of magnitude of the coordinate axes are relatively large and the setting of the same distance scale values on the coordinate axis directly affects the change in the angle slope index, thus generating different forest fire discrimination thresholds. When the ratio of the same distance scale values on the coordinate axis (y/x, ignoring units) increases, the angles R R R N R S and R S B M B F increase, the threshold decreases, and the threshold difference also decreases; when the y/x ratio decreases, the angles R R R N R S and R S B M B F decrease, the threshold increases, and the threshold difference also increases.
    (7)
    When a forest fire occurs, the pixel points in the fire area show an increase in the angle R R R N R S , the angle slope index ANIR decreases, R S B M B F decreases, the angle slope index AMIR increases, and the difference between AMIR and ANIR is used to construct the angle slope difference index, enhancing the sensitivity and accuracy of fire detection. AMNIR was defined as:
    A M N I R = A M I R A N I R ,
    Angle slope indices in Himawari-8 were defined as follows:
    A N I R = R 3 R 4 2 + R 4 R 5 2 R 3 R 5 2 2 R 3 R 4 R 4 R 5 ,
    A M I R = R 6 B 7 2 + B 7 B 8 2 R 6 B 8 2 2 R 6 B 7 B 7 B 8 ,
    In Formulas (9) and (10), the parameter meanings are the same as those in Formulas (6) and (7), and the subscript of parameters represents the band number of Himawari-8.
  • Construction of time-series angle slope difference index and forest fire discrimination;
    (8)
    The angle slope difference index was constructed based on the spectral differences between forested areas and fire points before and after a fire occurs. It was defined as follows:
    A N I R = A N I R t 1 A N I R t 2 ,
    A M I R = A M I R t 2 A M I R t 1 ,
    (9)
    A N I R t 1 and A M I R t 1 represent the angle indices of the forest before a fire, while A N I R t 2 and A M I R t 2 represent the angle indices of the forest after a fire. Δ A N I R and Δ A M I R represent the difference in the angle slope indices between the forested area and the fire point.
    (10)
    In actual monitoring, ANIRt1 and AMIRt1 represent the angle indices of the previous moment’s image in time-series remote sensing imagery, while ANIRt2 and AMIRt2 represent the angle indices of the next moment’s image in the time-series remote sensing imagery. Δ A N I R and Δ A M I R represent the difference in angle indices between the two scenes.
  • Decomposed 3D OTSU adaptive threshold segmentation algorithm.
    (11)
    To address the misjudgment of fire points in satellite imagery due to background variations in different regions, the decomposed three-dimensional OTSU algorithm [47] is employed for adaptive threshold segmentation. This algorithm not only considers the between-class variance and the clustering within classes, but also successfully decomposes the three-dimensional problem into three one-dimensional components. This reduction in dimensionality dramatically decreases the computational complexity from O ( L 3 ) to O ( L ) , significantly enhancing the computation speed and practical utility of the algorithm. It outperforms other segmentation algorithms in efficiency. The computation process for the decomposed three-dimensional OTSU algorithm is outlined as follows:
    (12)
    Let value s divide a set of discrete data into two categories (fire points target and background). For these two categories, define their inter-class distance as:
    s b s = | μ 1 s μ 0 s | ,
    (13)
    where μ 1 ( s ) , μ 0 ( s ) are the mean values of the elements corresponding to their respective categories. It can be seen the larger the value of s b ( s ) , the greater the inter-class distance, which means the target and background are more distinctly separated, resulting in better segmentation effects.
    (14)
    When values divide a set of discrete data into two categories, where P i is the probability of data i occurrence, W 0 ( s ) and W 1 ( s ) respectively represent the probabilities of the two categories, and μ 0 ( s ) and μ 1 ( s ) are the mean values of the corresponding categories, the intra-class distances for these categories are defined as:
    d 0 s = i = 0 s P i | i μ 0 ( s ) | W 0 ( s ) ,
    d 1 s = i = s + 1 L 1 P i | i μ 1 ( s ) | W 1 ( s ) ,
    (15)
    The overall intra-class distance for the two categories is:
    s w s = W 0 s d 0 s + W 1 s d 1 s ,
    (16)
    which indicates the cohesion within each class. The best segmentation effect is achieved when the value of s w ( s ) is minimized.
    (17)
    Thus, considering both the aforementioned factors, it is essential to ensure the maximum inter-class distance while also achieving the best possible cohesion within each class to obtain optimal segmentation results. Based on these requirements, upon analyzing OTSU, a new threshold determination function has been proposed, where the formula to find the threshold is:
    G s = W 0 ( s ) W 1 ( s ) s b ( s ) s w s ,
    (18)
    The gray level corresponding to the maximum value of G s is considered the optimal threshold S 0 , that is:
    s 0 = a r g m a x { G s } ,
    (19)
    For the single-channel imagery constructed using the angle slope difference index A M N I R , three-dimensional OTSU adaptive threshold segmentation was applied. For the segmented anomalous target points, forest fire discrimination was conducted based on the following principles:
    (20)
    If A M N I R > A M N I R t h r e s h o l d , the potential fire point is determined.

2.2.3. Flare Removal

(21)
When the fire points are identified, it is necessary to perform flare removal to filter false fire points. The removing principle is as follows: if the reflectivity of the visible light and infrared are both greater than 0.3, and the flare angle is less than 30°, then the pixels are identified as flare. The flare angle [13] is calculated as:
cos θ r = cos θ v cos θ s sin θ v sin θ s cos ψ ,
(22)
where θ r is the angle between the direction of the specular reflection and the vector pointing from the ground to the satellite, θ v is the observation zenith angle, θ s is the solar zenith angle, and ψ is the relative azimuth.

2.2.4. Precision Evaluation Method

(23)
The accuracy rate (P), missed rate (M), and overall evaluation (F) were used to carry out the evaluation in a unified way [31]. The specific formulas are as follows:
P = Y y Y y + Y n ,
M = N y Y y + N y ,
F = 2 P ( 1 M ) 1 + P M ,
(24)
where Y y is the number of real fire points detected, Y n is the number of falsely detected fire points, N y is the number of missed fire points, P and M are the accuracy rate and the omission error, respectively, and F is the comprehensive evaluation index of the accuracy rate and missed detection rate.

3. Results

3.1. Angle Slope Index Threshold Statistics

(25)
In the coordinate system, a y/x = 500 ratio was used for threshold calculation (y is the downloaded remote sensing dataset’s original values, where reflectance = true reflectance × 10000, and brightness temperature = true brightness temperature value × 10). The y/x ratio in spectral line setting was around 500 when retrieving and viewing sample points in the software library, therefore 500 is used in this paper. If a y/x = 1000 ratio is selected, the analysis result is not affected, but the angle difference is more obvious at 500.
The extraction of 257 fire points and 132 forest spectral curves is displayed in Figure 6. The statistical diagram shows that the spectral curves of fire point samples rise overall compared to forest samples, with a significant increase in the B7 band and a significant decrease in the B4 band, thus causing a significant increase in B 3 B 4 B 5 and a significant decrease in B 6 B 7 B 8 ; the brightness temperature values from B8 to B16 increase significantly, resulting in a separation from the forest spectral curves, but the degree of change is less significant than in the B7 band, and the angle change is not obvious; based on these characteristics, the mid-infrared angle slope index AMIR, near-infrared angle slope index ANIR, and near-mid angle slope difference index AMNIR are constructed to discriminate fire points in forest fires.
From the selected 257 fire points and 132 forest samples, the values of AMIR, ANIR, and AMNIR were calculated and statistically analyzed. As shown in Figure 7a,b, the ANIR index values of fire points fluctuate within a certain range due to the complex fire environment, but overall, they still show a decreasing trend compared with forest samples; meanwhile, the AMIR values of fire points generally increase compared with forest samples.
After removing outliers, the AMIR values for fire points are above 0.96 and ANIR values are mostly below −0.5; for forest samples, the AMIR values are below 0.95 and ANIR values are above 0.5. Considering the early stages of forest fires, when the area of forest destruction is small and thermal radiation heats up slowly, and the impact of forest fire smoke on the visible light region, the discrimination formula for potential fire points is derived as follows:
A M I R > 0.96 ,
A M I R > 0.95   and   A N I R < 0 ,
As shown in Figure 7c, all AMNIR values of forest samples are below 0.5 and AMNIR values of most fire points are above 1.0. Therefore, it is considered that when the regional segmentation threshold is less than 1.0, there is no fire occurrence.
According to the statistical results, AMIR, ANIR, and AMNIR all distinguished fire point from forest well. In contrast, the AMIR difference between fire point and forest was the smallest and the AMNIR difference was the largest. Therefore, in the method of FDOA (see Section 3.2.2 for details), the imagery used for adaptive segmentation was constructed with AMNIR data.
From the selected 132 sample points, the Δ A M I R and Δ A N I R index values for fire points and forest pixels were statistically analyzed. As shown in Figure 7d,e, after excluding outliers, the Δ A N I R values are all above 1 and the Δ A M I R values are all above 0.03. The relative formula for fire point discrimination is as follows:
A M I R > 0.03   and   A N I R > 1.0 ,
The statistical results for the maximum, minimum, and average values, and the variance in the angle slope index and the time-series angle slope difference index, are shown in Table 3.
It can be seen from Table 3 that the minimum value of Δ A N I R , Δ A M I R , and fire point AMNIR all deviate greatly from the mean value; the maximum value of fire point ANIR also deviates greatly from the mean value; the variance of Δ A M I R and fire point ANIR are both greater than 0.15; and the two index values have the highest dispersion. These extreme points with large deviations from the mean may be due to the low intensity and low temperature of the initial fire points, or the complex fire conditions caused by the smoke and other particles produced in the combustion process of biomass. The variance of fire point A M I R is 0, and index values are concentrated around the average value.
The variance of fire point A M N I R is 0.0097, the fluctuation of the index values is small, and the data are stable. This indicates that the obtained brightness temperature values of forest fire point are more accurate. The variance values of forest ANIR, AMIR, and AMNIR are all bellow 0.01, and the values are near the average and relatively stable. This shows that, without fire interference, the reflectance and brightness temperature values are obtained more accurately.
Overall, the stability of the fire point sample is less than that of the forest sample, and the sample is more stable in the middle-infrared than in the near-infrared and visible bands. Using AMIR and AMNIR for forest fire monitoring will be more accurate. By comparison, the statistical results in Table 3 are consistent with those shown in Figure 7.

3.2. Forest Fire Identification Precision of Application Case

Taking Hunan Province as the study area, nine moments from the Himawari-8 satellite imagery in recent years were randomly selected as the application cases presented in Section 3.2.1, for forest fire identification precision based on angle slope index threshold (ASITR), and Section 3.2.2 for forest fire identification precision based on the fusion of angle slope difference index ( A M N I R ) data using the decomposed three-dimensional OTSU adaptive threshold segmentation algorithm and ASITR (FDOA).

3.2.1. Forest Fire Identification Precision Based on Angle Slope Index Threshold (ASITR)

Table 4 shows the Himawari-8 satellite imagery from 2018 to 2021. These nine moments were identified as Moment 1, Moment 2, Moment 3, Moment 4, Moment 5, Moment 6, Moment 7, Moment 8, and Moment 9.
The ASITR method discriminates forest fires according to the angle slope indices threshold obtained from forest fire points statistics. Its flow chart is shown in the left branch of Figure 5, and the threshold determination rules follow Formulas (23)–(25). The method is based on the B3B4B4 and B6B7B8 dataset of Himawari-8, and evaluated by using forest fire actual data. The forest fire identification precision of the ASITR method is shown in Table 5.
As shown in Table 5, the difference between the maximum value and the minimum value of fire identification is 22.22%, and the smallest forest fire identification accuracy is 77.78% at Moment 3. The accuracy of forest fire identification is above 80% at Moments 1, 2, 4, 5, 6, 7, 8, and 9. The average value of forest fire identification accuracy is 88.25%, the average value of forest fire omission error is 17.07%, and the average comprehensive evaluation value is 85.71%. Compared to the infrared radiation-based monitoring results proposed by Feng et al. [31] (with an accuracy of 0.84, a missed detection rate of 0.24, and a comprehensive evaluation value of 0.8), the accuracy has increased by 9.25%, the missed detection rate has decreased by 3.07%, and the overall evaluation index has improved by 2.62%. Results show that the evaluation indexes P, M, and F were all better than the forest fire infrared radiation monitoring [31] by using the ASITR method based on the B3B4B5 and B6B7B8 dataset.

3.2.2. Forest Fire Identification Precision Based on the Fusion of Decomposed Three-Dimensional OTSU Adaptive Threshold Segmentation Algorithm and ASITR (FDOA)

The FDOA method discriminates forest fires by fusing angle slope difference index (AMNIR) data, the decomposed three-dimensional OUST adaptive threshold segmentation algorithm, and the ASITR method. Its flow chart is shown in the right branch of Figure 5.
First, windows are set to monitor potential forest fire points according to different regions and different environmental conditions. As shown in Figure 8, the selected study area Hunan Province was divided into 11 rows and 11 columns, which contains 121 sub-regions, including 18 blank windows. Then the sub-regions constructed from the angle slope difference index (AMNIR) data were segmented by the decomposed three-dimensional OTSU algorithm. The segmentation threshold data of each sub-region are partially shown in Figure 8. The correlation coefficient R2 between the segmentation threshold of potential fire points and latitude is 0.69. It can be seen that the threshold of potential forest fire points gradually decreases as the latitude increases; this is because, the closer to the equator, the higher the surface temperature. The algorithm makes full use of the information of neighboring pixels and can be flexibly applied to regions of different latitudes.
Based on the statistical result, the segmentation thresholds are mostly below 0.2, and the overall trend is that thresholds in lower latitude regions are slightly higher than those in higher latitude regions. Negative values may occur due to complex fire environments caused by smoke and heat.
According to the statistical result of Figure 7c in Section 3.1, if the segmentation threshold of sub-region is less than 1.0, it is considered that there is no fire occurrence.
After fusion of the decomposed three-dimensional OTSU adaptive threshold segmentation algorithm based on AMNIR data and the ASITR, the final precision evaluation is shown in Table 6. The result shows that the accuracy fluctuates significantly, with a maximum value of 100% and a minimum value of 71.43%, for a difference of 28.57%. The average accuracy is 84.92%, slightly lower than the results of the ASITR (88.25%), but the missed detection rate is consistently lower than that of the ASITR. The missed detection rates at Moment 1, Moment 2, Moment 3, Moment 4, Moment 5, Moment 6, Moment 7, Moment 8, and Moment 9, are, respectively, 8.34%, 0%, 0%, 20%, 11.11%, 7.14%, 12.50%, 14.29%, and 7.15%, with an average reduction in the missed rate of 8.95%. The overall evaluation indices are improved, except for Moment 7, compared to the ASITR method. The results indicate that using the FDOA method to integrate the discrimination results of the decomposed three-dimensional OTSU adaptive threshold segmentation algorithm with the discrimination results of the ASITR method reduces the average forest fire detection missed rate from 17.07% to 8.12%, and increases the average overall evaluation index from 85.33% to 87.85%, effectively enhancing the precision of forest fire detection.
Taking Moment 6 and Moment 7 as examples, the spatial distribution of forest fire discrimination results based on the FDOA method are shown in Figure 9. The green line represents the vector of Hunan Province and the red squares indicate actual data of forest fires. The yellow pentagrams represent the monitoring results based on the FDOA method.

4. Discussion

Forest fire monitoring has always been a hot research topic. Many scholars have made use of remote sensing data to study forest fire identification. In this paper, we took the high temporal resolution advantage of the Himawari-8 satellite and used a method based on angle slope indexes (ASIs) for forest fire monitoring. The results show that ASI can distinguish between the forest background and fire spots well, and is more accurate in detecting early fire. However, the performance of the visible spectral change and the correlation between bands in the spectral imagery are not as favorable compared to the forest fire infrared radiation monitoring, which are also important factors of forest fire monitoring. Determining how to further improve forest fire identification accuracy on this basis is what we have been studying. Recently, Xu et al. [32] combined the forest fire infrared radiation monitoring and forest fire smoke detection for forest fire monitoring, which reduced the phenomenon of forest fire omission error. However, the methods for detecting smoke from forest fire rely solely on the information provided by images, ignoring the biomass change information and the error caused by dense smoke. When smoke rises with hot air, the imagery often involves a mix of smoke and clouds, which makes the identification of fire smoke plumes extremely difficult.
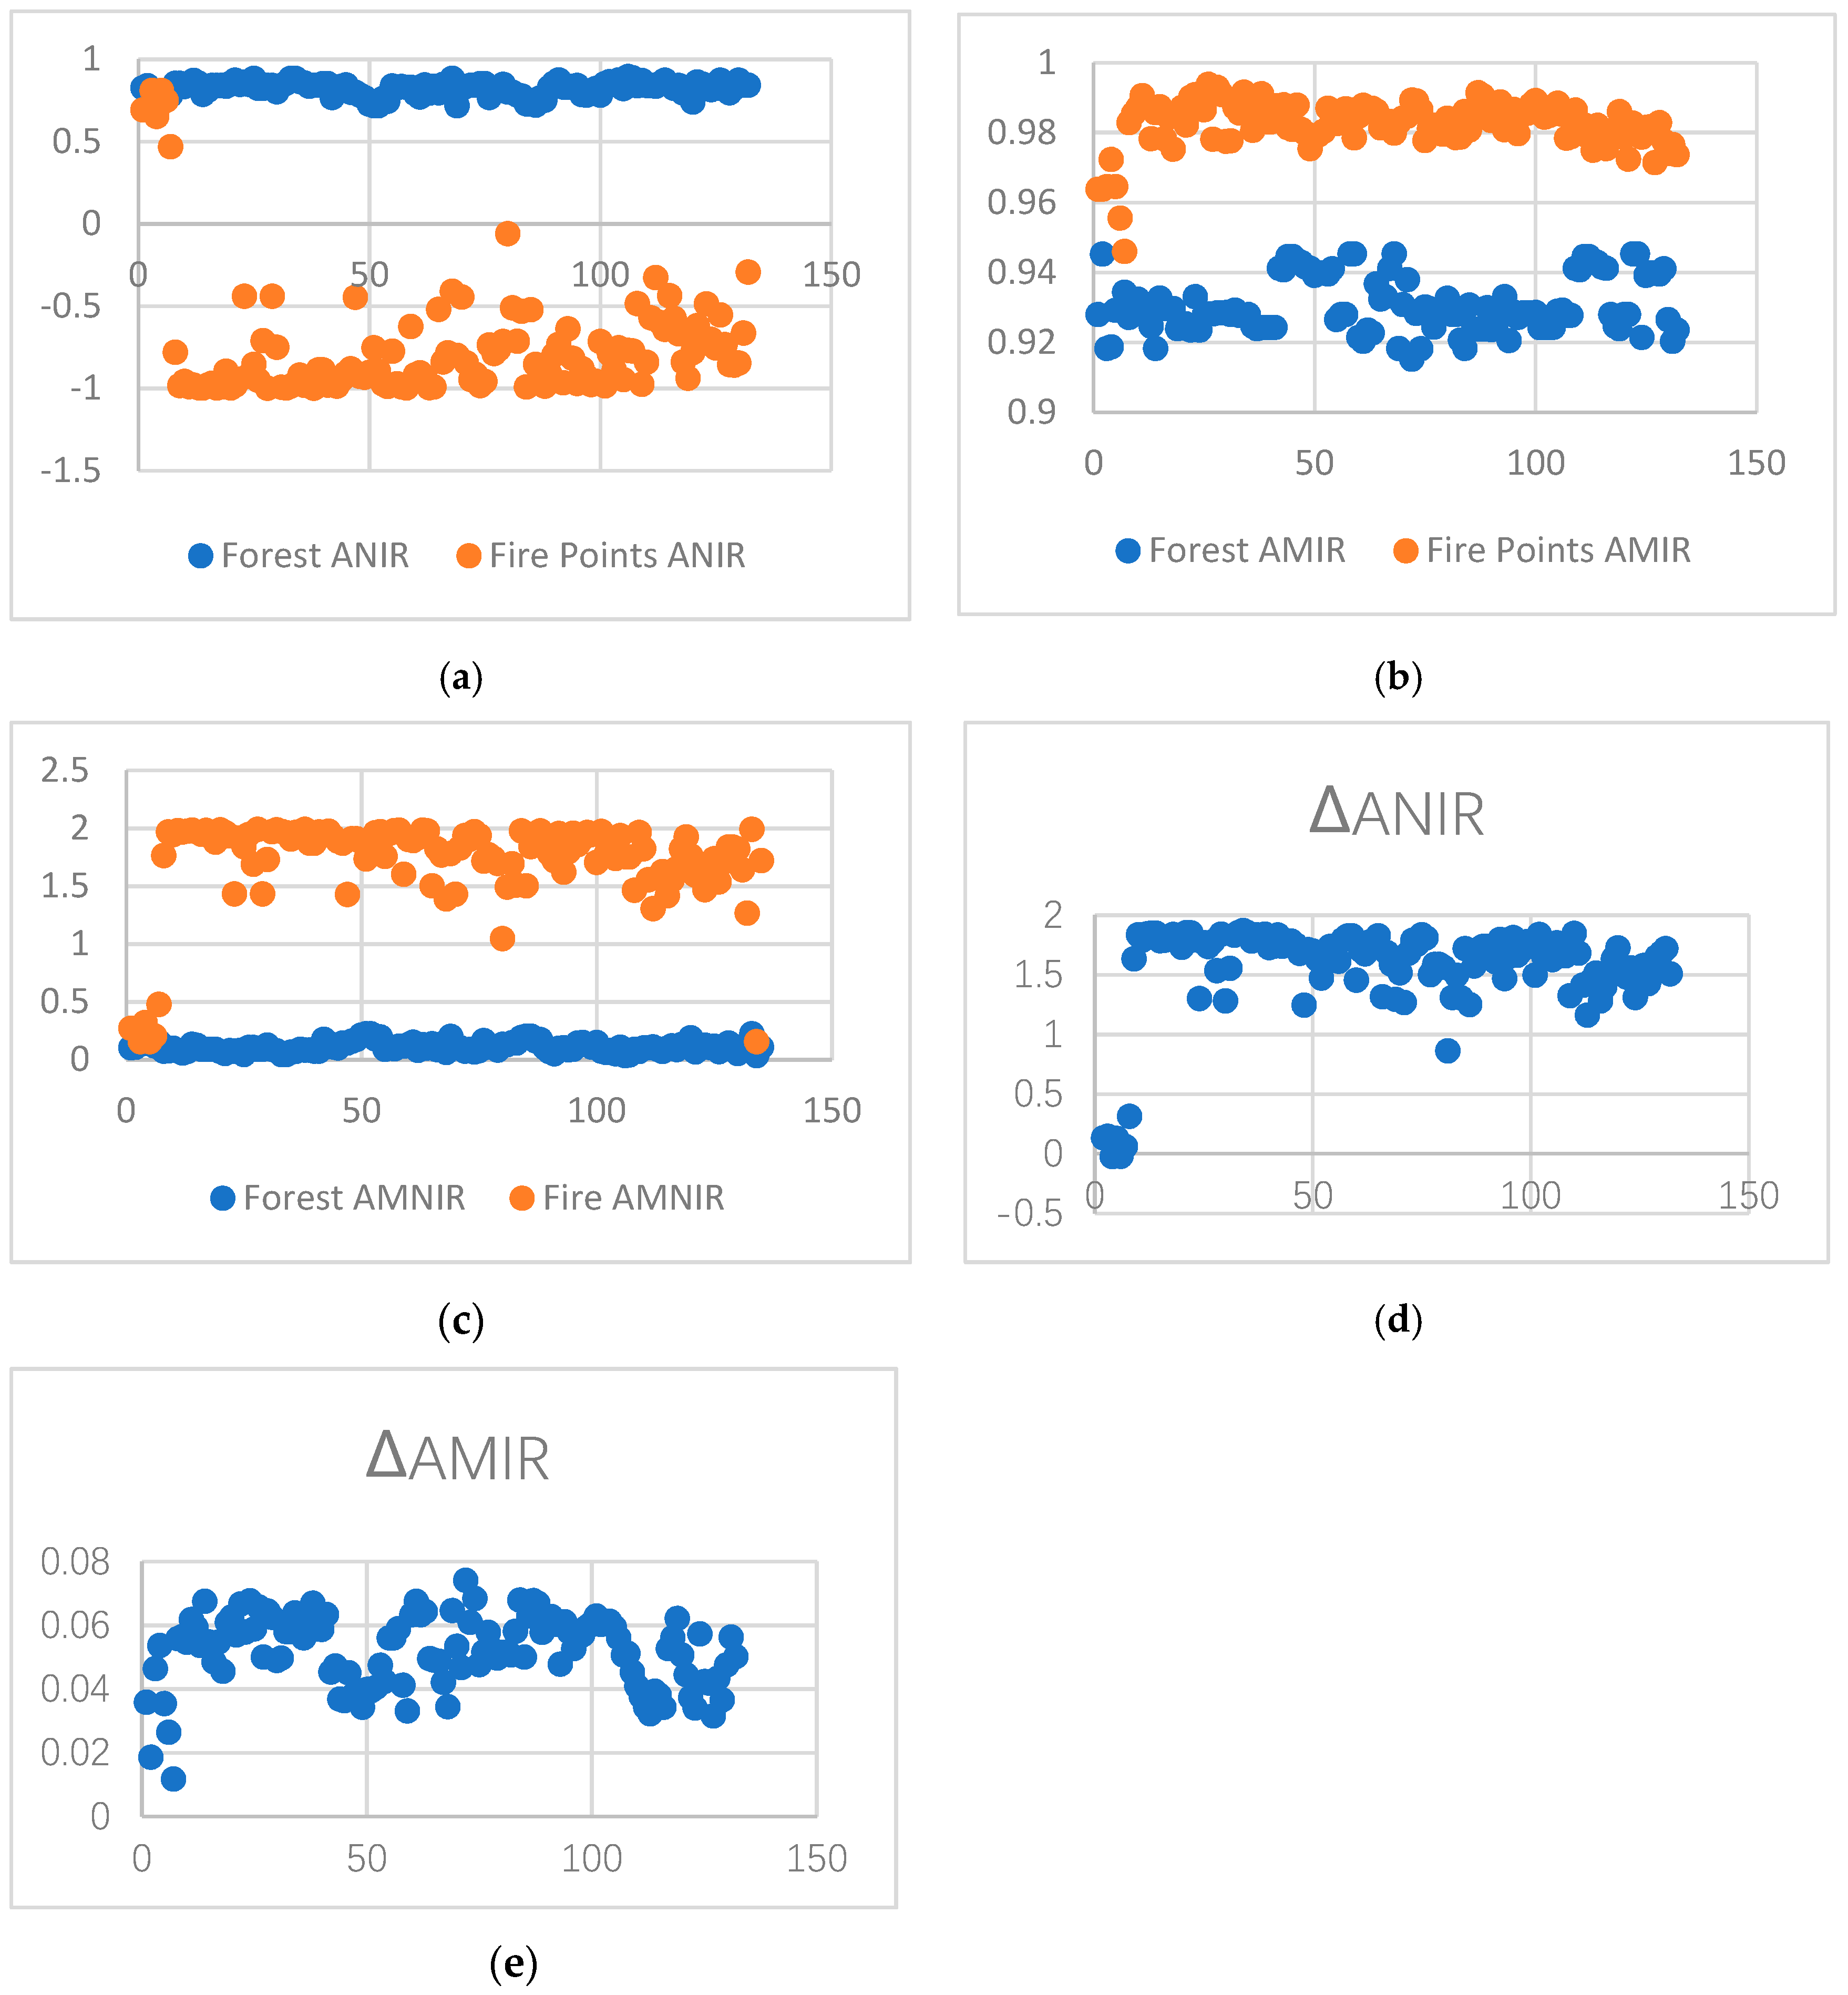
The ASI constructed in this paper combines the visible and infrared bands for biomass change and fire smoke, and also integrates the strong inter-band correlation, which is more sensitive to fire. Furthermore, in response to omission error, we constructed time-series angle slope difference indices ∆ANIR and ∆AMIR, and employed a decomposed three-dimensional OTSU algorithm to calculate the fire point discrimination thresholds for sub-regions of the study area. The proposed ASITR and FDOA were tested in Hunan Province, China. Results show that the evaluation indexes P, M, and F were all better than the forest fire infrared radiation monitoring [31]. Compared with ASITR, the accuracy of FDOA decreased by 3.41% (0.88 vs. 0.85), the omission error decreased by 52.94% (0.17 vs. 0.08), and the overall evaluation increased by 3.53% (0.85 vs. 0.88). The ASITR exhibits higher accuracy, and the FDOA can reduce the phenomenon of forest fire omission error and improve the overall evaluation. The likely reasons for the slightly lower accuracy of FDOA may be as follows: (1) the sample data for statistical analysis were from Australia, which is located in a tropical and subtropical region, and the statistical results were slightly higher than that of China, most of which lies north of the Tropic of Cancer, in the north temperate zone; (2) the cloud detection process did not take into account the dense smoke caused by forest fire, which is difficult to distinguish from clouds; (3) the outliers in the angle slope indexes, which are caused by the low intensity and temperature of the early stages of fire, or other particles generated during biomass combustion; and (4) the high temporal resolution of Himawari-8 remote sensing data allows for near-real-time observation of fires, which is beneficial for early detection; however, its lower spatial resolution imposes some restrictions on the identification of small-scale fires.
In future work, the following aspects deserve further in-depth study: (1) collect fire point samples from countries around the world to improve the applicability of statistical thresholds, and validate and conduct the proposed methods in different regions; (2) further study of the change rule in visible light reflectance and ANIR, especially when the fire smoke becomes dense; (3) integration of multi-source remote sensing data and sub-pixel techniques to improve spatial resolution; and (4) incorporation of cutting-edge technologies like neural networks and deep learning with spectrograms.

5. Conclusions

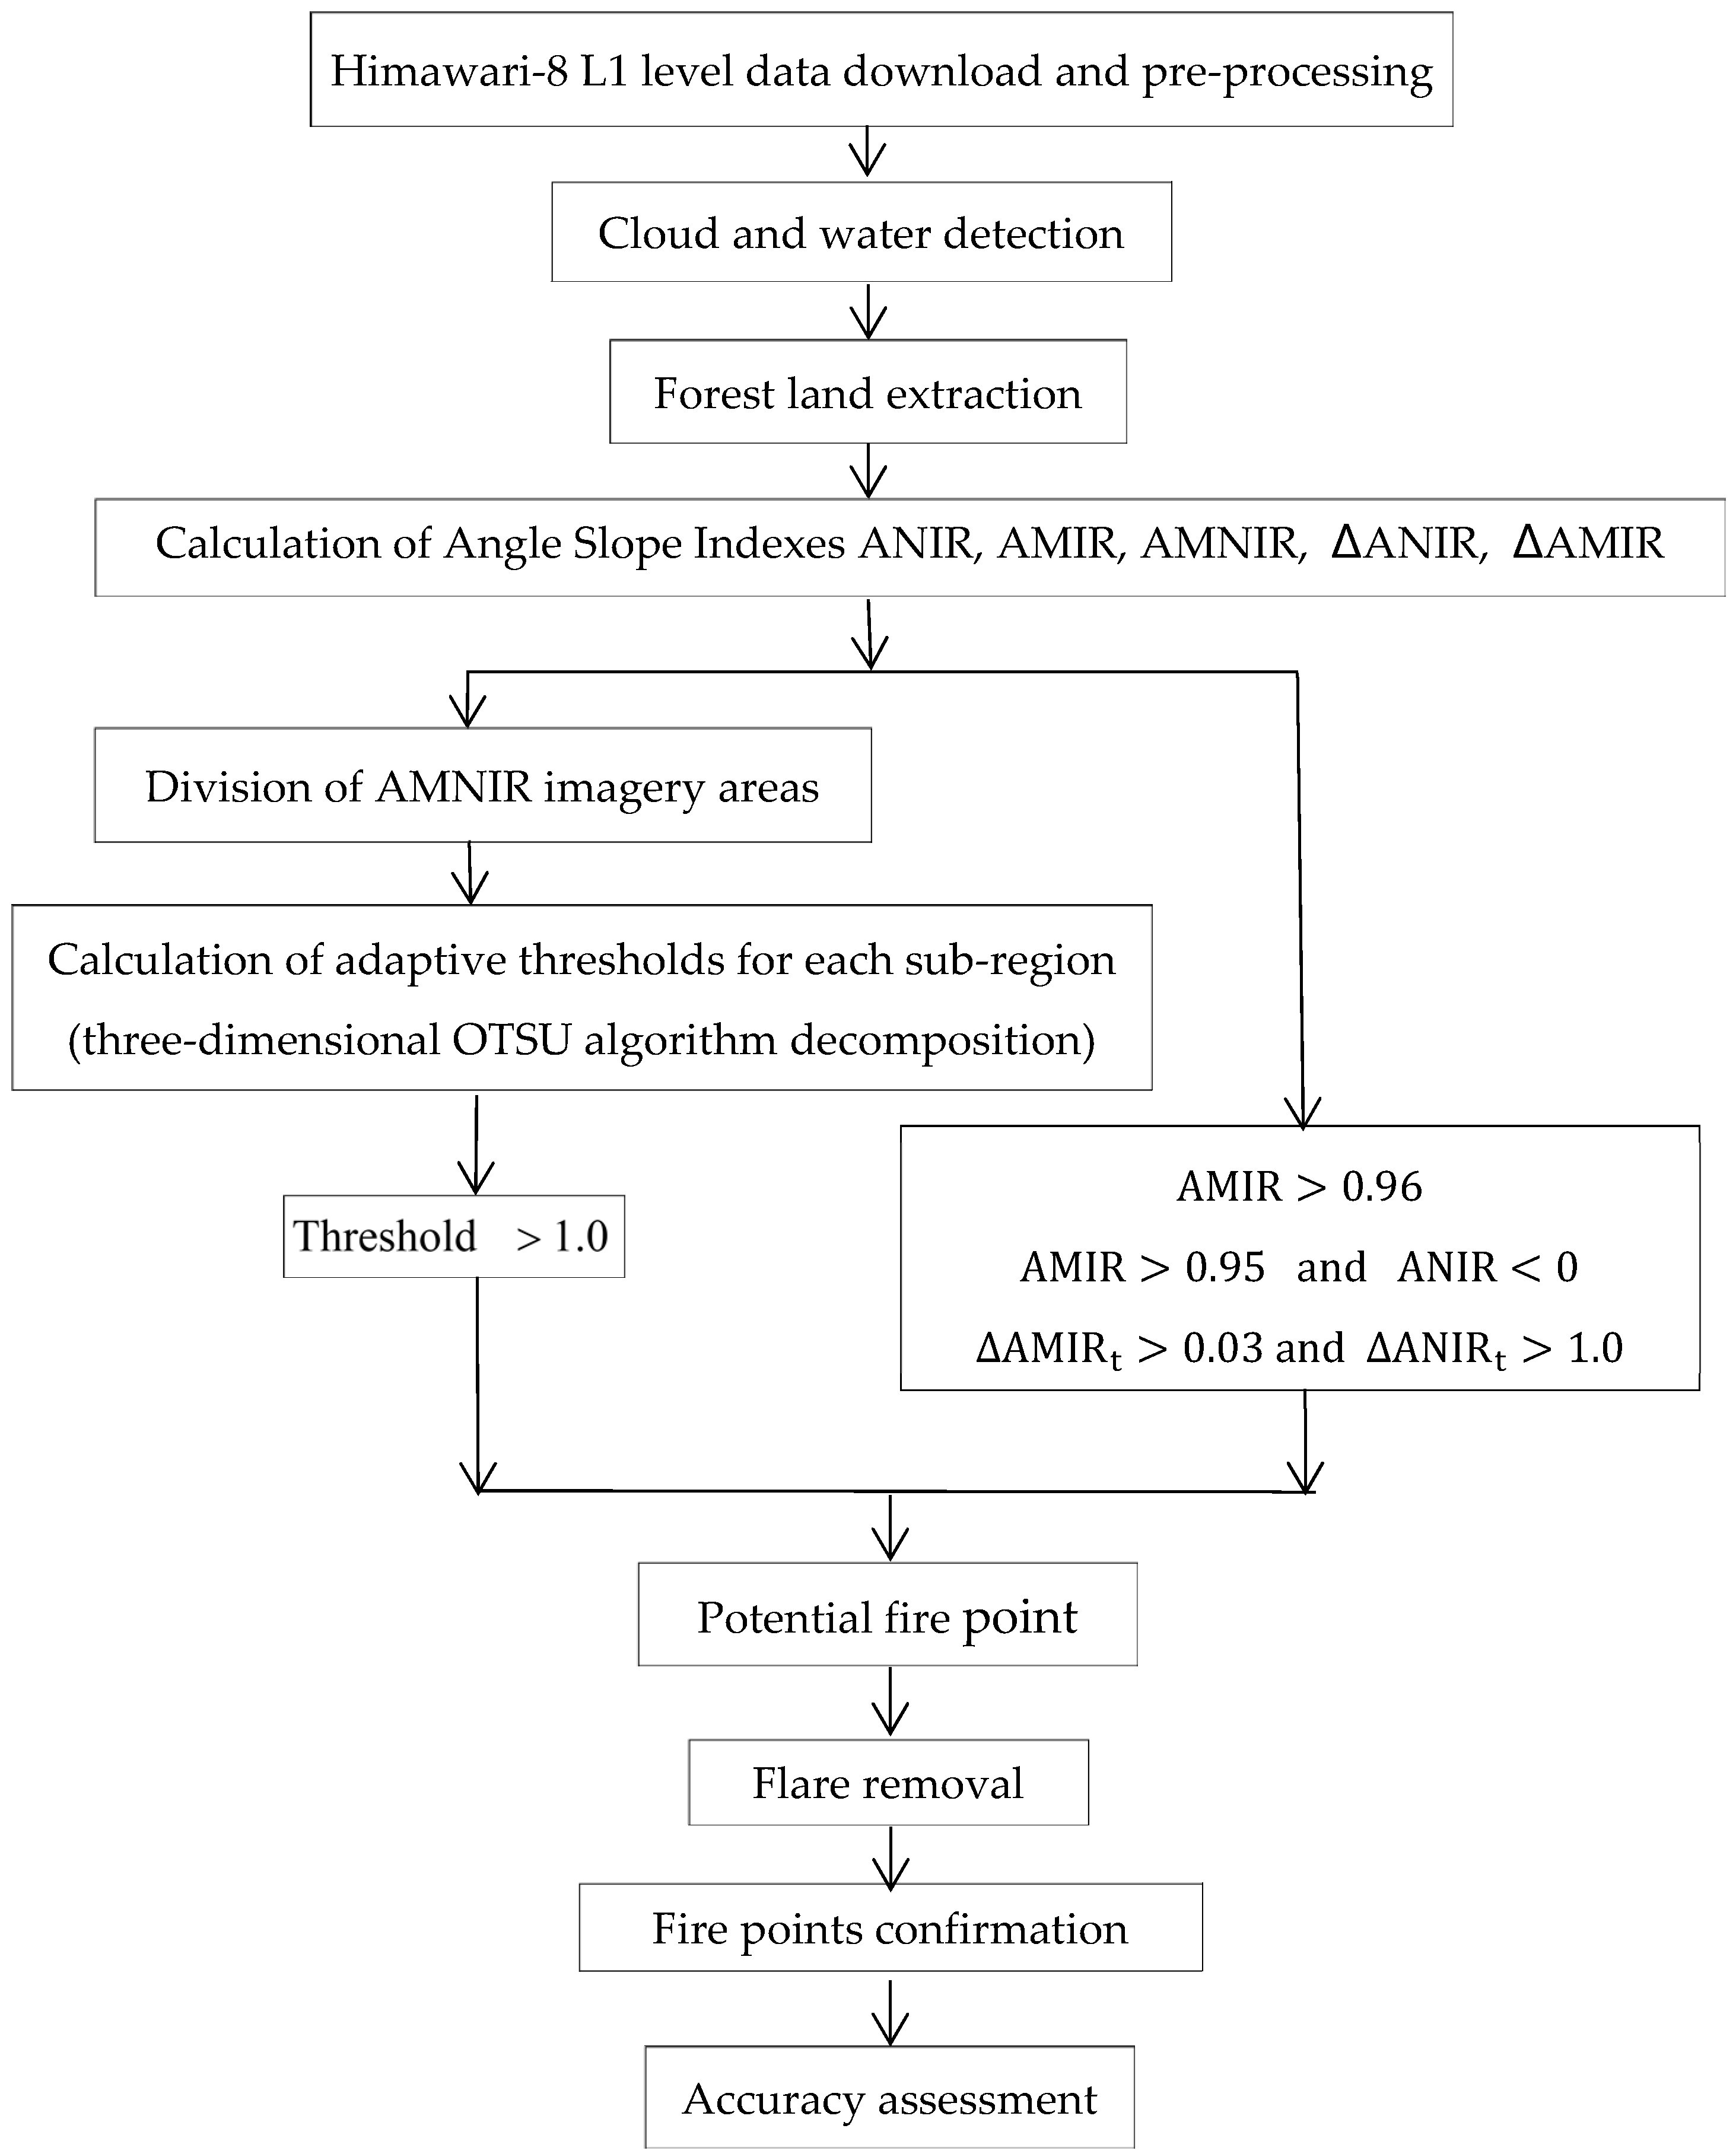
Using the strong correlation between spectral bands and the changes in spectral graphs caused by forest fires, new forest fire monitoring indices, the angle slope indices, have been developed. Forest fire point discrimination based on the angle slope indices AMIR, ANIR, Δ A M I R , and Δ A N I R (ASITR) shows high accuracy but also reveals some instances of missed fires. The decomposed three-dimensional OTSU algorithm is applied for adaptive threshold segmentation on sub-regions constructed from AMNIR data, combined with the angle slope index threshold method for fire discrimination. This monitoring approach not only improves the accuracy of fire identification but also reduces the miss rate. The research findings have significant practical implications for early detection and control of forest fires, with the main discoveries summarized as follows:
The occurrence of forest fires causes changes in both the reflectance of the visible light bands and the brightness temperatures of the infrared bands. Monitoring these changes simultaneously enhances sensitivity and accuracy in fire detection. The angle slope indices are constructed based on changes in the spectral graphs of visible light reflectance and infrared brightness temperatures. Using historical data, Himawari-8 fire products (reliability = 5), visually interpreted data, 257 cloud-free fire point samples, and 132 pre-disaster forest land samples in Australia were collected. The angle slope indices values of fire points were calculated and statistically analyzed, setting threshold values for potential fire points at 0.96 or 0.95 for AMIR, 0 for ANIR, 0.03 for Δ A M I R , and 1.0 for Δ A N I R .
The method based on the ASITR was used to monitor 88 forest fires that occurred at nine different times during 2018–2021 in Hunan Province, China. As compared to the method proposed by Feng et al. (accuracy 0.84, miss rate 0.24, overall evaluation 0.8), accuracy increased by 9.25%, the miss rate decreased by 3.07%, and the overall evaluation index rose by 2.62%. Results show that the evaluation indexes P, M, and F were all better than the forest fire infrared radiation monitoring.
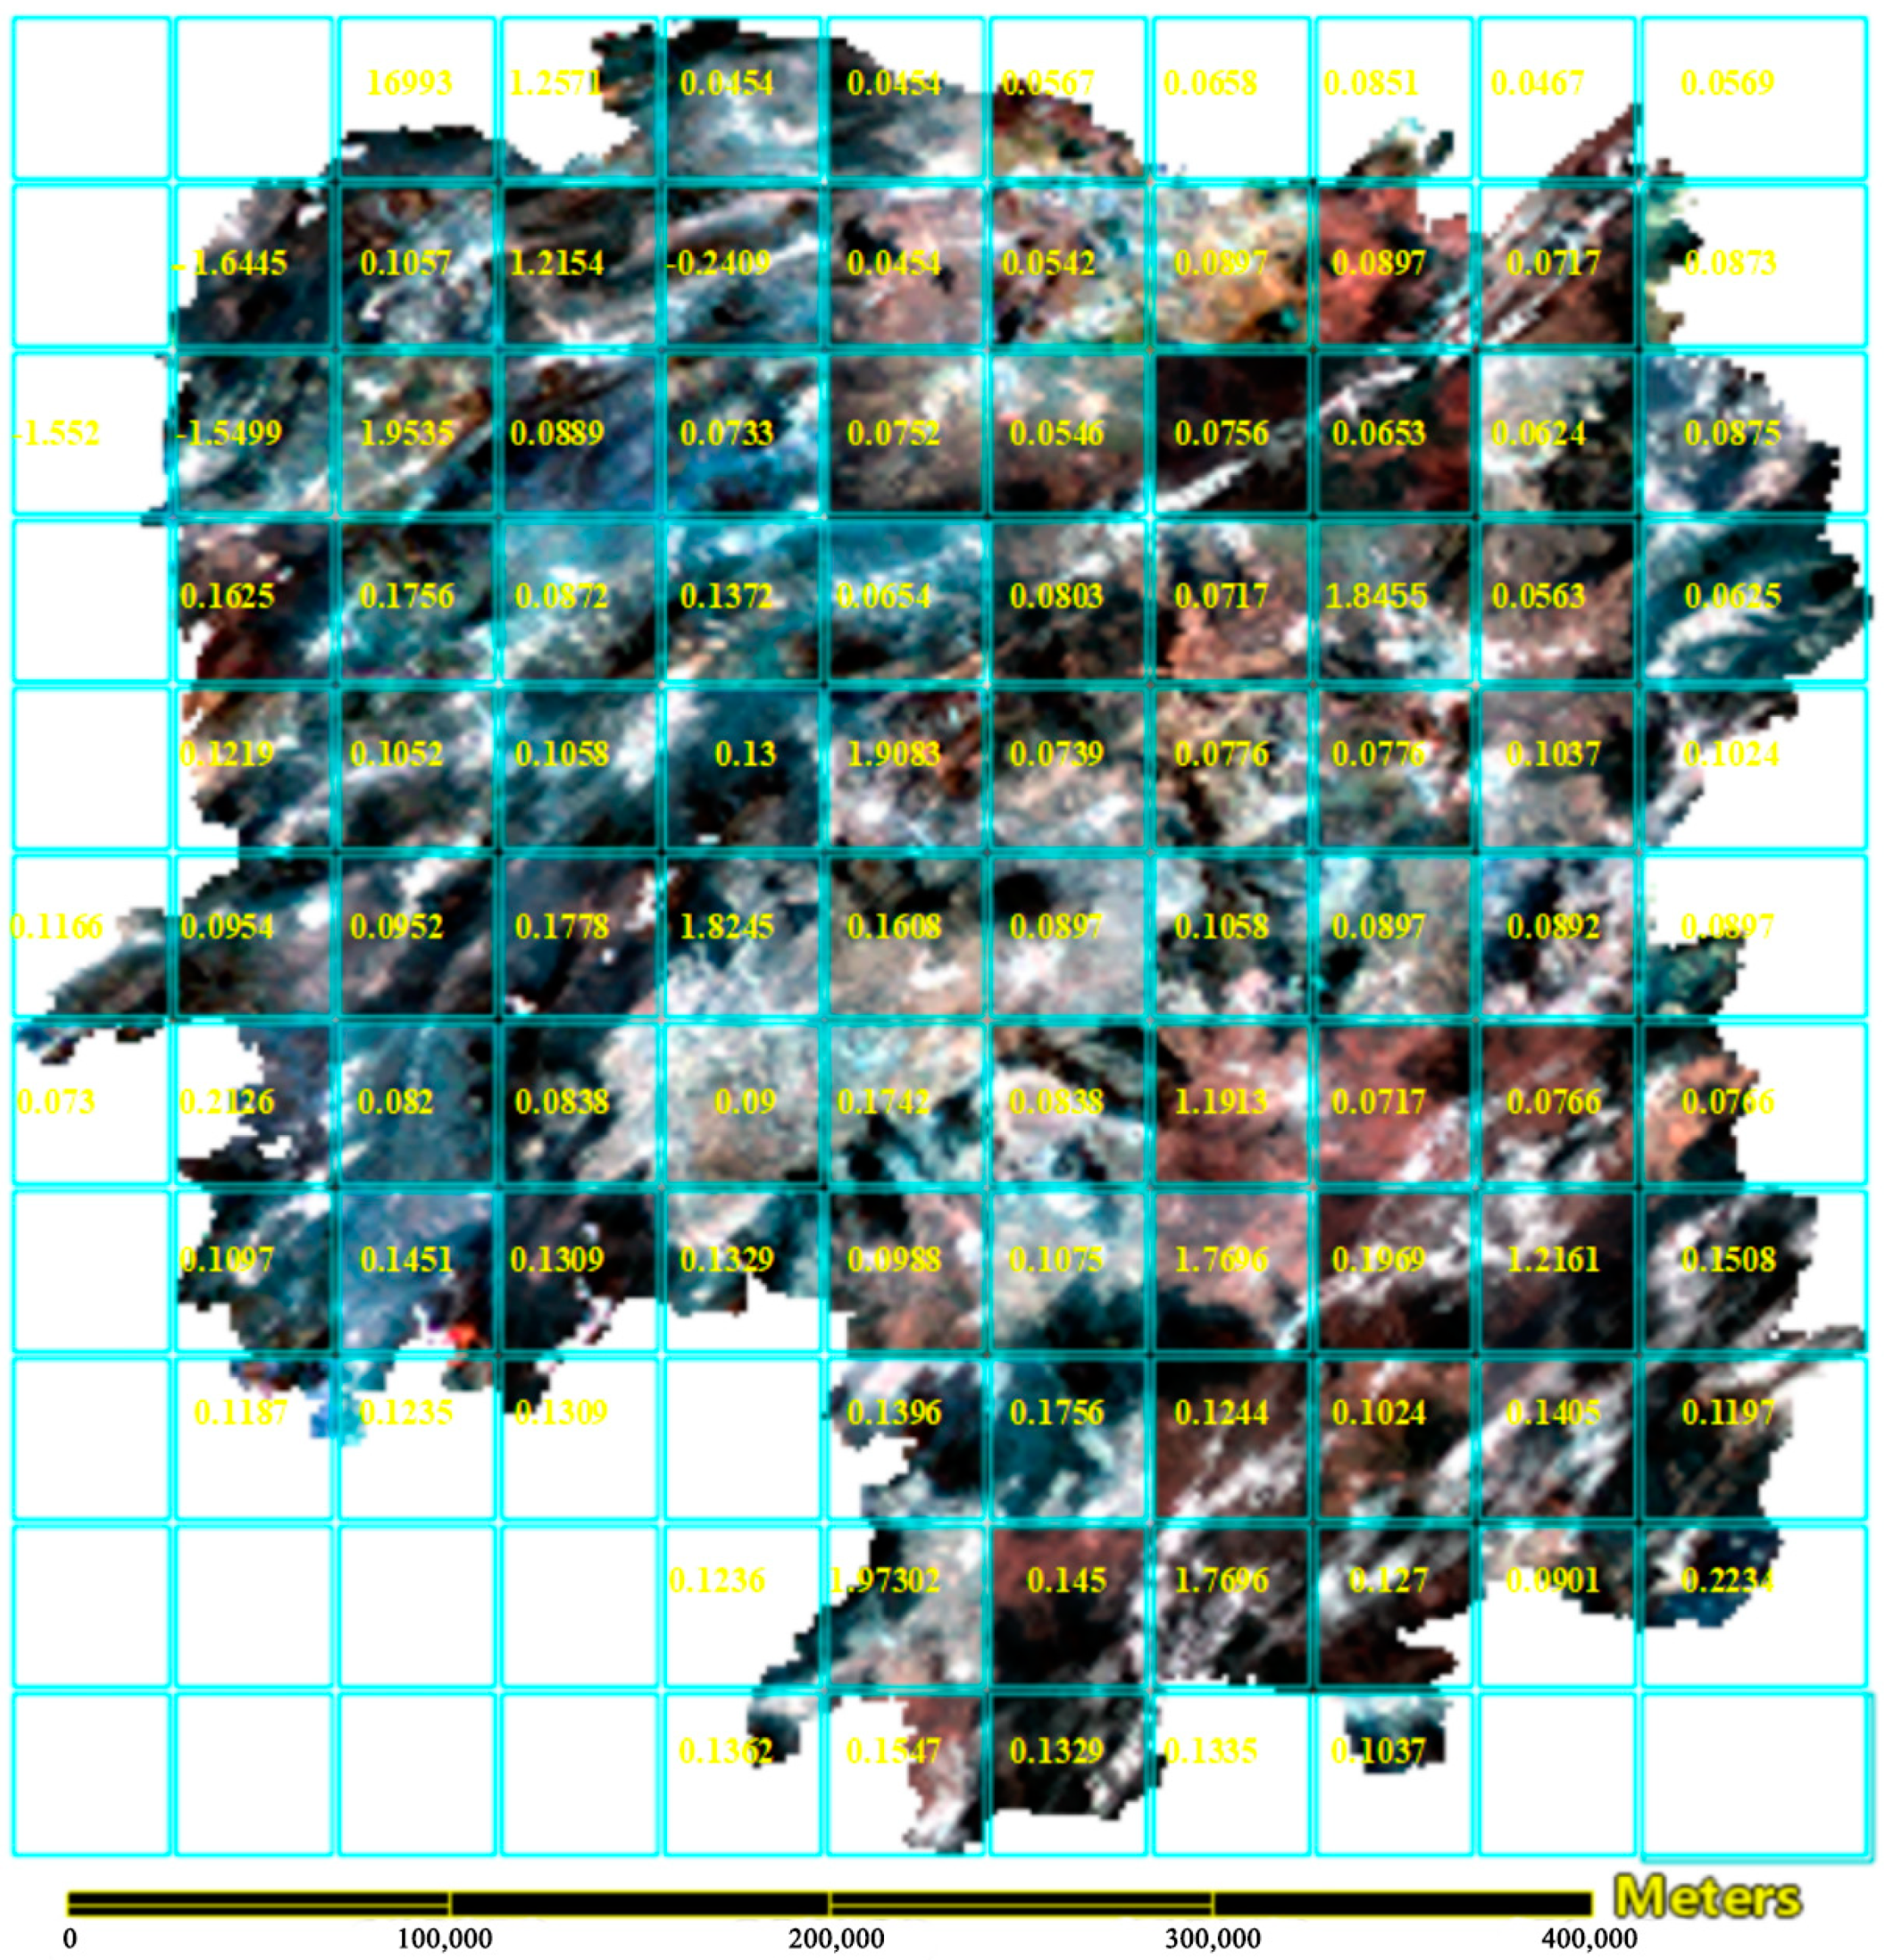
To address the difference in fire point detection thresholds under different temporal and spatial backgrounds, the decomposed three-dimensional OTSU algorithm was used for adaptive threshold segmentation based on the imagery constructed from AMNIR index data. According to the segmentation results (as shown in the example in Figure 8), the thresholds were mostly below 0.2, with lower latitude regions having slightly higher thresholds than higher latitude regions. According to the statistical results of angle slope indices, the maximum value of the fire point AMNIR index was 1.9926, the mean value was 1.7108, and most of the values were greater than 1.0. Therefore, if the segmentation threshold is less than 1.0, it is considered that there is no fire occurrence.
Forest fire identification (FDOA) based on the fusion of angle slope difference index (AMNIR) data, the decomposed three-dimensional OTSU adaptive threshold segmentation algorithm, and ASITR shows large fluctuations in accuracy, with a maximum of 100% and a minimum of 71.43% (i.e., a difference of 28.57%), and an average value of 84.92%, which is higher than the method based on Z indices (the indices were constructed based on the ratio between the element value, mean value, and standard deviation of the infrared bands’ bright temperature images) proposed by Feng et al. [1], but slightly lower than the results from the threshold method based on the angle slope index (ASITR) (88.25%). The missed rate is consistently lower than that of the ASITR method, with an average reduction in the missed rate of 8.95%, and the overall index is 87.85%, higher than that of the ASITR method by 2.52%. The results show that the FDOA method effectively enhances the precision of forest fire detection.

Author Contributions

Conceptualization: G.Z. and P.L.; methodology, data collection, formal analysis and writing—original draft: P.L.; funding acquisition, writing—review, comments and editing: G.Z. All authors have read and agreed to the published version of the manuscript.

Funding

This research was funded by the Scientific Research Fund of Hunan Provincial Education Department under Grant 23B0244 and 22A0194, the Science and Technology Innovation Platform and Talent Plan Project of Hunan Province under Grant 2017TP1022, the Natural Science Foundation of Hunan Province under Grant 2024JJ7645 and Field Observation and Research Station of Dongting Lake Natural Resource Ecosystem, Ministry of Natural Resources.

Data Availability Statement

The data presented in this study are available on request from the corresponding author.

Acknowledgments

We thank the Department of Emergency Management of Hunan Province for their provision of forest fire hotspot data. Pingbo Liu, Gui Zhang. “Forest fire discrimination method, system, equipment and medium based on Angle slope index.” CN117333779B. 30 April 2024.

Conflicts of Interest

The authors do not have conflicts of interest in this study.

Appendix A

Figure A1. Location map of fire points and forest land sample points (the red points) taken in this study (Western Australia, Northern Territory, and New South Wales from 2019 to 2022).
Remotesensing 17 00142 g0a1
Table A1. Partial experimental data information of Himawari-8.
AddressTypeDate & TimeImageryLevel
West Australia (South East)Fire point sample2 May 2022, 02:10 and 02:30NC_H08_20220502_0200_R21_FLDK.06001_06001.ncLevel 1
NC_H08_20220502_0210_R21_FLDK.06001_06001.ncLevel 1
NC_H08_20220502_0230_R21_FLDK.06001_06001.ncLevel 1
H08_20220502_0200_L3WLF010_FLDK.06001_06001.csvLevel 3
H08_20150727_0800_L2WLF010_FLDK.06001_06001.csvLevel 3
Forest land sample12 March 2022, 2:00NC_H08_20220312_0200_R21_FLDK.06001_06001.ncLevel 1
West Australia (West South)Fire point sample7 February 2022, 00:00, 00:30, and 01:00NC_H08_20220207_0000_R21_FLDK.06001_06001.ncLevel 1
NC_H08_20220207_0030_R21_FLDK.06001_06001.ncLevel 1
NC_H08_20220207_0100_R21_FLDK.06001_06001.ncLevel 1
H08_20220207_0000_L3WLF010_FLDK.06001_06001.csvLevel 3
H08_20220207_0100_L3WLF010_FLDK.06001_06001.csvLevel 3
Forest land sample17 December 2021, 02:10NC_H08_20211217_0210_R21_FLDK.06001_06001.ncLevel 1
West Australia (outside Perth)Fire point sample2 February 2022, 03:00, 03:30 and 04:00NC_H08_20210202_0300_R21_FLDK.06001_06001.ncLevel 1
NC_H08_20210202_0330_R21_FLDK.06001_06001.ncLevel 1
NC_H08_20210202_0400_R21_FLDK.06001_06001.ncLevel 1
H08_20210202_0300_L3WLF010_FLDK.06001_06001.csvLevel 3
H08_20210202_0400_L3WLF010_FLDK.06001_06001.csvLevel 3
Forest land sample7 December 2020, 03:30NC_H08_20201207_0330_R21_FLDK.06001_06001.ncLevel 1
New South WalesFire point sample17 November 2019, 00:30 and 01:00NC_H08_20191117_0030_R21_FLDK.06001_06001.ncLevel 1
NC_H08_20191117_0100_R21_FLDK.06001_06001.ncLevel 1
H08_20191117_0000_L3WLF010_FLDK.06001_06001.csvLevel 3
H08_20191117_0100_L3WLF010_FLDK.06001_06001.csvLevel 3
Forest land sample11 September 2019, 01:00NC_H08_20200330_0550_R21_FLDK.06001_06001.ncLevel 1

References

  1. Chinese Academy of Forestry. Available online: http://www.caf.ac.cn/info/1806/48310.htm (accessed on 6 March 2023).
  2. Cai, W.; Yang, J.; Liu, Z.; Hu, Y.; Liu, S.; Jing, G.; Zhao, Z. Forest regeneration and its influencing factors in the burnt areas of Daxing’anling Forest Region, Heilongjiang Province. Acta Ecol. Sin. 2012, 32, 3303–3312. [Google Scholar]
  3. Shi, Y.; Shan, H.; Zhang, Y.; Hu, M. Research on forest fire monitoring of new generation of geostationary meteorological satellite. For. Fire Prev. 2017, 4, 32–35. [Google Scholar]
  4. Shao, Y.; Feng, Z.; Cao, M.; Wang, W.; Sun, L.; Yang, X.; Ma, T.; Guo, Z.; Fahad, S.; Liu, X.; et al. An ensemble model for forest fire occurrence mapping in China. Forests 2023, 14, 704. [Google Scholar] [CrossRef]
  5. Flannigan, M.D.; Vonder Haar, T.H. Forest fire monitoring using NOAA satellite AVHRR. Can. J. For. Res. 1986, 16, 975–982. [Google Scholar] [CrossRef]
  6. Flasse, S.P.; Ceccato, P. A contextual algorithm for AVHRR fire detection. Int. J. Remote Sens. 1996, 17, 419–424. [Google Scholar] [CrossRef]
  7. Giglio, L.; Descloitres, J.; Justice, C.O.; Kaufman, Y.J. An enhanced contextual fire detection algorithm for MODIS. Remote Sens. Environ. 2003, 87, 273–282. [Google Scholar] [CrossRef]
  8. Xie, Z. Research on Fire Detection and Exploration of Auto-Mated Cloud Detection Based on Himawari8 Remote Sensing. Ph.D. Thesis, University of Science and Technology of China, Beijing, China, 2019. [Google Scholar]
  9. Dozier, J. A method for satellite identification of surface temperature fields of subpixel resolution. Remote Sens. Environ. 1981, 11, 221–229. [Google Scholar] [CrossRef]
  10. Miao, T. Research on the algorithm of monitoring forest fire points and estimating burn scar based on MODIS data. Master’s Thesis, Nanjing University of Information Science and Technology, Nanjing, China, 2012. [Google Scholar]
  11. Xu, Q.; Gu, W.; Xie, T.; Liu, R. Crop straw fire remote sensing monitoring and its algorithm implementation. Remote Sens. Technol. Appl. 2017, 32, 728–733. [Google Scholar]
  12. Prins, E.M.; Feltz, J.M.; Menzel, W.P.; Ward, D.E. An overview of GOES-8 diurnal fire and smoke results for SCAR-B and 1995 fire season in South America. J. Geophys. Res. 1998, 103, 31821–31835. [Google Scholar] [CrossRef]
  13. Riguka, S. Real-Time Monitoring and Early Warning of Grassland Fire Based on Geostationary Meteorological Satellite. Master’s Thesis, Inner Mongolia Normal University, Huhehot, China, 2020. [Google Scholar]
  14. Giglio, L.; Csisizar, I.; Justice, C.O. Global distribution and seasonality of active fires as observed with the Terra and Aqua Moderate Resolution Imaging Spectroradiomete (MODIS) sensors. J. Geophys. Res. Biogeosci. 2006, 111, 17–23. [Google Scholar] [CrossRef]
  15. Kaufman, Y.J.; Justice, C.O.; Flynn, L.P.; Kendall, J.D.; Prins, E.M.; Giglio, L.; Ward, D.E.; Menzel, W.P.; Setzer, A.W. Potential global fire monitoring from EOS-MODIS. J. Geophys. Res. 1998, 103, 32215–32238. [Google Scholar] [CrossRef]
  16. Kaufman, Y.J.; Kleidman, R.G.; King, M.D. SCAR-B fires in the tropics: Properties and remote sensing from EOS-MODIS. J. Geophys. Res. 1998, 103, 31955–31968. [Google Scholar] [CrossRef]
  17. Justice, C.O.; Giglio, L.; Korontzi, S.; Owens, J.; Morisette, J.T.; Roy, D.; Descloitres, J.; Alleaume, S.; Petitcolin, F.; Kaufman, Y. The MODIS fire products. Remote Sens. Environ. 2002, 83, 244–262. [Google Scholar] [CrossRef]
  18. Qin, X.; Yi, H. A Method to Identify Forest Fire Based on MODIS Data. Fire Saf. Sci. 2004, 13, 83–89. [Google Scholar]
  19. Gao, M.; Qing, Z.; Liu, S. A Study of Forest Frie Detection Based on MODIS Data. Remote Sens. Land Resour. 2005, 60–63. [Google Scholar] [CrossRef]
  20. Gong, A.; Su, Y.; Lv, X.; Yin, X.; Li, J. A Forest Fire Detection Method Based on MODIS. CN106840409A, 13 June 2017. [Google Scholar]
  21. Schroeder, W.; Oliva, P.; Giglio, L.; Csiszar, I.A. The new VIIRS 375 m active fire detection data product: Algorithm description and initial assessment. Remote Sens. Environ. 2014, 143, 85–96. [Google Scholar] [CrossRef]
  22. Prins, E.M.; Menzel, W.P. Trends in South American biomass burning detected with the GOES visible infrared spin scan radiometer atmospheric sounder from 1983 to 1991. J. Geophys. Res. 1994, 99, 16719–16735. [Google Scholar]
  23. Du, P.; Liu, M.; Xu, T.; Song, Y. Preliminary study on forest fire monitoring using Himawari-8 data. Acta Sci. Nat. Univ. Pekin. 2018, 54, 1251–1258. [Google Scholar]
  24. Zhao, W.; Shan, H.; Zhang, Y. Research on forest fire identification technology based on Himawari-8 geostationary satellite. J. Saf. Environ. 2019, 19, 2063–2073. [Google Scholar]
  25. Yan, J.; Qu, J.; Ran, M.; Zhang, F.F. Himawari-8 AHI fire detection in clear sky based on time-phase change. J. Remote Sens. 2020, 24, 571–577. [Google Scholar] [CrossRef]
  26. Chen, J.; Zheng, W.; Liu, C.; Tang, S. Temporal sequence method for fire spot detection using Himawari-8 geostationary meteorological satellite. Natl. Remote Sens. Bull. 2021, 25, 2095–2102. [Google Scholar] [CrossRef]
  27. Zhang, P.; Guo, Q.; Chen, B.; Feng, X. The Chinese next-generation geostationary meteorological satellite FY-4 compared with the Japanese Himawari-8/9 satellites. Adv. Meteorol. Sci. Technol. 2016, 6, 72–75. [Google Scholar]
  28. Dong, X.; Wei, Y.; Wang, Z. Research on the sensitivity analysis of straw burning monitoring by stationary meteorological satellite. Heilongjiang Meteorol. 2018, 35, 30–31. [Google Scholar]
  29. Jang, E.; Kang, Y.; Im, J.; Lee, D.W.; Yoon, J.; Kim, S.K. Detection and Monitoring of Forest Fires Using Himawari-8 Geostationary Satellite Data in South Korea. Remote Sens. 2019, 11, 271. [Google Scholar] [CrossRef]
  30. Xiong, D.; Tan, S.; Zang, G. Forest fire discrimination research based on FY4 remote sensing data. J. Cent. South Univ. For. Technol. 2020, 40, 42–50. [Google Scholar]
  31. Feng, H.; Zhang, G.; Tan, S.; Wu, X. Forest fire discrimination based on Himawari-8 satellite data. J. Cent. South Univ. For. Technol. 2021, 41, 75–83. [Google Scholar]
  32. Xu, H.; Zhang, G.; Chu, R.; Zhang, J.; Yang, Z.; Wu, X.; Xiao, H. Detecting forest fire omission error based on data fusion at subpixel scale. Int. J. Appl. Earth Obs. Geoinf. 2024, 128, 103737. [Google Scholar] [CrossRef]
  33. Maeda, N.; Tonooka, H. Early stage Forest fire detection from Himawari-8 AHI images using a modified MOD14 algorithm combined with machine learning. Sensors 2022, 23, 210. [Google Scholar] [CrossRef]
  34. Zhang, G.; Li, B.; Luo, J.; He, L. A self-adaptive wild fire detection algorithm with two- dimensional Otsu optimization. Math. Probl. Eng. 2020, 2020, 3735262. [Google Scholar]
  35. Deng, Z.; Zhang, G. An Improved Forest Fire Monitoring Algorithm with Three-Dimensional Otsu. IEEE Access 2021, 9, 118367–118378. [Google Scholar] [CrossRef]
  36. Otsu, N. A threshold selection method from gray-level histograms. IEEE Trans. Syst. Man Cybern. 1979, 9, 62–66. [Google Scholar] [CrossRef]
  37. Yue, F.; Zuo, W.; Wang, K. Algorithm for selecting two-dimensional threshold of grayscale images based on decomposition. Acta Autom. Sin. 2009, 35, 1022–1027. [Google Scholar] [CrossRef]
  38. Jing, X.; Li, J.; Liu, Y. An image segmentation algorithm based on three-dimensional maximum inter-class variance. Acta Electron. Sin. 2003, 9, 1281–1285. [Google Scholar]
  39. Zhang, J.; Zhang, W.Y.; Feng, J.D.; Wang, H.Y.; Yu, Z.; Song, W. Research on MODIS fire point monitoring algorithm based on brightness temperature-vegetation index-aerosol optical thickness. Remote Sens. Technol. Appl. 2016, 31, 886–892. [Google Scholar]
  40. Xu, H.; Zhang, G.; Zhou, Z.; Zhou, X.; Zhou, C. Forest fire monitoring and positioning improvement at subpixel level: Application to himawari-8 fire products. Remote Sens. 2022, 14, 2460. [Google Scholar] [CrossRef]
  41. Zhou, W.; Tang, B.H.; He, Z.W.; Huang, L.; Chen, J. Identification of forest fire points under clear sky conditions with Himawari-8 satellite data. Int. J. Remote Sens. 2024, 45, 214–234. [Google Scholar] [CrossRef]
  42. Wooster, M.J.; Roberts, G.; Freeborn, P.H.; Xu, W.; Govaerts, Y.; Beeby, R.; He, J.; Lattanzio, A.; Fisher, D.; Mullen, R. LSA SAF Meteosat FRP products–Part 1: Algorithms, product contents, and analysis. Atmos. Chem. Phys. 2015, 15, 13217–13239. [Google Scholar] [CrossRef]
  43. Pan, J.; Xing, L.X.; Wen, J.C.; Meng, T.; Jiang, L.J. Inversion method studyon short wave infrared remote sensing data high temperature surface feature temperature. In Proceedings of the 2009 2nd International Congress on Image and Signal Processing, Tianjin, China, 17 October 2009; Volume 10, pp. 1–4. [Google Scholar]
  44. Han, C.; Yang, Q.; He, X.; Mei, Y.; Ding, M.; Li, Y.; Guo, D. Research on fire point identification algorithm based on Himawari-8 satellite. Remote Sens. Technol. Appl. 2023, 38, 173–181. [Google Scholar]
  45. The People’s Government of Hunan Province. Available online: https://www.hunan.gov.cn/hnszf/jxxx/hngk/hngk.html (accessed on 22 September 2024).
  46. The Forestry Department of Hunan Province. Available online: http://lyj.hunan.gov.cn/lyj/ztzl/lshn_77586/202303/t20230306_29264640.html (accessed on 22 September 2024).
  47. Gong, Q.; Ni, L.; Tang, P.; Wang, F. Fast algrithm of 3D Otsu image segmentation based on decomposition. J. Comput. Appl. 2012, 32, 1526–1528. [Google Scholar]
Figure 1. Area of sample points data for angle slope index threshold statistics.
Remotesensing 17 00142 g001
Figure 2. Fire point and smoke sample diagrams. (a) Location map of fire points and forest land sample points (the red points) taken in the study; (b) example of fire point smoke (Northern Australia using bands 1, 2, and 3 of Himawari-8, 5 February 2021, 05:00); (c) false-color composite image using bands 12, 11, 8A of Sentinel-2, near the Margaret River in Australia, 12 July 2021 02:13; (d) true-color composite image using bands 4, 3, 2 of Sentinel-2, near the Margaret River in Australia, 12 July 2021, 02:13; (e) true-color composite image using bands 4, 3, 2 of Sentinel-2, near the Margaret River in Australia, 12 July 2021, 02:13.
Remotesensing 17 00142 g002
Figure 3. Area of forest fire ground actual data.
Remotesensing 17 00142 g003
Figure 4. The forest area of 30 m surface coverage in Hunan province in 2020 (black area).
Remotesensing 17 00142 g004
Figure 5. Flowchart for forest fire discrimination based on angle slope indexes and Himawari-8.
Remotesensing 17 00142 g005
Figure 6. Spectral curve chart of forest land samples, fire point samples, smoke, and clouds.
Remotesensing 17 00142 g006
Figure 7. Statistical charts of the angle slope indexes ANIR, AMIR, Δ A N I R , and Δ A M I R . (a) Forest and fire point ANIR index comparison chart; (b) fire point and forest AMIR index statistical chart; (c) forest and fire point AMNIR index comparison chart; (d) Δ A N I R index statistical chart; (e) Δ A M I R index statistical chart.
Remotesensing 17 00142 g007
Figure 8. Identification threshold of potential forest fires on 28 September 2019, 03:20 (UTC) in Hunan Province. The yellow numbers represent the potential fire threshold segmented by the decomposed 3D OTSU method.
Remotesensing 17 00142 g008
Figure 9. Spatial distribution of forest fire discrimination results based on the FDOA method. The green line represents the vector of Hunan Province. The red squares indicate actual data of forest fires. The yellow pentagrams represent the monitoring results based on the FDOA method. Moment6 represents the moment at 04:30 UTC on 1 October 2019. Moment 7 represents the moment at 03:20 UTC on 28 September 2019. As shown in (a,d), a true-color image (i.e., composed of red, green, and blue) based on the Himawari-8 satellite imagery is generated as the base map. As shown in (b,e), the actual data of forest fires are overlaid on (a,d). As shown in (c,f), the algorithm monitoring results are overlaid on (b,e).
Remotesensing 17 00142 g009
Table 1. Selected bands of satellite imagery data set in this study.
SatelliteSensorChannel No.Wavelength (µm)Spatial Resolution (m)
Himawari-8AHI10.461000
20.511000
30.64500
40.861000
51.602000
62.302000
73.902000
86.202000
1411.202000
1613.302000
Sentinel-2AMSI20.4910
30.5610
40.66510
8A0.86520
111.6120
122.1920
Table 2. Time and location information on the forest fire actual data.
No. *Time of the Fire EventLongitudeLatitudeExtent (ha)
16 October 2018 at 05:00 UTC109°52′27°17′95.88
228 September 2019 at 07:20 UTC109°36′28°15′34.00
328 September 2019 at 05:30 UTC109°34′28°12′22.00
428 September 2019 at 03:10 UTC111°19′29°19′0.87
520 March 2020 at 08:00 UTC109°23′28°21′8.4
621 March 2020 at 08:11 UTC112°21′26°19′18.00
78 November 2020 at 09:12 UTC118°28′27°13′11.00
814 January 2021 at 09:10 UTC112°27′26°43′20.70
914 January 2021 at 07:15 UTC112°29′27°8′5.80
1014 January 2021 at 07:50 UTC110°51′26°51′4.50
1119 January 2021 at 04:30 UTC113°48′25°49′18.55
1219 January 2021 at 06:30 UTC113°1′25°41′23.73
1319 January 2021 at 09:48 UTC112°20′26°12′0.20
1419 January 2021 at 10:23 UTC113°53′28°55′0.90
1520 February 2021 at 09:15 UTC113°17′25°38′9.30
* No. = Number.
Table 3. Summary of angle slope index.
IndexMaximumMinimumAverageVariance
Δ A N I R 1.8702−0.02421.55940.1540
Δ A M I R 0.0741−0.02420.05170.0001
ANIRforest0.88230.71650.82100.0016
ANIRfire0.8094−0.9999−0.73810.1506
AMIRforest0.94530.91820.93080.0001
AMIRfire0.99370.94600.98220.0000
AMNIRforest0.22340.03620.10950.0017
AMNIRfire1.99260.15511.71080.0097
Note: ANIRforest is the ANIR index of the forest samples. ANIRfire is the ANIR index of the fire points. AMIRforest is the AMIR index of the forest samples. AMIRfire is the AMIR index of the fire points. AMNIRforest is the AMNIR index of the forest samples. AMNIRfire is the AMNIR index of the fire points.
Table 4. Application case data information.
No.IdentificationImageryNum. of Gro. Tru. Fir./Pcs.Level
1Moment 1NC_H08_20210220_0210_R21_FLDK.06001_06001.nc12Level 1
2Moment 2NC_H08_20210119_0150_R21_FLDK.06001_06001.nc10Level 1
3Moment 3NC_H08_20210114_0410_R21_FLDK.06001_06001.nc9Level 1
4Moment 4NC_H08_20201108_0200_R21_FLDK.06001_06001.nc5Level 1
5Moment 5NC_H08_20191031_0610_R21_FLDK.06001_06001.nc9Level 1
6Moment 6NC_H08_20191001_0430_R21_FLDK.06001_06001.nc14Level 1
7Moment 7NC_H08_20190928_0320_R21_FLDK.06001_06001.nc8Level 1
8Moment 8NC_H08_20181006_0410_R21_FLDK.06001_06001.nc7Level 1
9Moment 9NC_H08_20181005_0110_R21_FLDK.06001_06001.nc14Level 1
Note: No. = Number. Num. of Gro. Tru. Fir. = Number of ground truth fires. Pcs. = Pieces.
Table 5. Precision evaluation based on the method of ASITR.
No.IdentificationNum. of Gro. Tru. Fir./Pcs.Num. of Fir. Mon./Pcs.Num. of Fal. Fir./Pcs.For. Fir. Ide. Acc.For. Fir. Ide. Mis.For. Fir. Ide. Ove.
1Moment 11210283.33%16.67%83.33%
2Moment 2109190.00%10.00%90.00%
3Moment 397277.78%22.22%77.78%
4Moment 454180.00%20.00%80.00%
5Moment 5970100.00%22.22%87.50%
6Moment 61411191.67%21.43%84.62%
7Moment 7870100.00%12.50%93.33%
8Moment 876185.71%14.29%85.71%
9Moment 91412285.71%14.29%85.71%
Ave.88.25%17.07%85.33%
Note. No. = Number. Num. of Gro. Tru. Fir. = Number of ground truth fires. Num. of Fir. Mon. = Number of fires monitored. Num. of Fal. Fir. = Number of false fires. Pcs. = Pieces. For. Fir. Ide. Acc. = Forest fire identification accuracy. For. Fir. Ide. Mis. = Forest fire identification missed rate. For. Fir. Ide. Ove. = Forest fire identification overall evaluation. Ave. = Average. Num. of Gro. Tru. Fir. is derived from forest fire actual data (see Section 2.1.2). Num. of Fir. Mon. is derived from the forest fire ASITR monitoring result, which represents the actual number of forest fire detected. For. Ide. Acc., Num. of Fir. Mis. And For. Fir. Ide. Ove. are calculated according to Equations (20)–(22) (see Section 2.2.4).
Table 6. Precision evaluation based on the method of FDOA.
No.IdentificationNum. of Gro. Tru. Fir./Pcs.Num. of Fir. Mon./Pcs.Num. of Fal. Fir./Pcs.For. Fir. Ide. Acc.For. Fir. Ide. Mis.For. Fir. Ide. Ove.
1Moment 11211378.57%8.33%84.62%
2Moment 2109190.00%10.00%90.00%
3Moment 397277.78%22.22%77.78%
4Moment 455271.43%0.00%83.33%
5Moment 5980100.00%11.11%94.12%
6Moment 61412192.31%14.29%88.89%
7Moment 788280.00%0.00%88.89%
8Moment 877187.50%0.00%93.33%
9Moment 91413286.67%7.14%89.66%
Ave.86.00%8.12%87.85%
Note. No. = Number. Num. of Gro. Tru. Fir. = Number of ground truth fires. Num. of Fir. Mon. = Number of fires monitored. Num. of Fal. Fir. = Number of false fires. Pcs. = Pieces. For. Fir. Ide. Acc. = Forest fire identification accuracy. For. Fir. Ide. Mis. = Forest fire identification missed rate. For. Fir. Ide. Ove. = Forest fire identification overall evaluation. Ave. = Average. Num. of Gro. Tru. Fir. is derived from forest fire actual data (see Section 2.1.2). Num. of Fir. Mon. is derived from the forest fire FDOA monitoring result, which represents the actual number of forest fire detected. For. Ide. Acc., Num. of Fir. Mis. and For. Fir. Ide. Ove. are calculated according to Equations (20)–(22) (see Section 2.2.4).
Disclaimer/Publisher’s Note: The statements, opinions and data contained in all publications are solely those of the individual author(s) and contributor(s) and not of MDPI and/or the editor(s). MDPI and/or the editor(s) disclaim responsibility for any injury to people or property resulting from any ideas, methods, instructions or products referred to in the content.

