Abstract
Ground subsidence often occurs over a large area. Although traditional monitoring methods have high accuracy, they cannot perform wide-area ground deformation monitoring. Synthetic Aperture Radar (SAR) interferometry (InSAR) technology utilizes phase information in SAR images to extract surface deformation information in a low-cost, large-scale, high-precision, and high-efficiency manner. With the increasing availability of SAR satellite data and the rapid development of InSAR technology, it provides the possibility for wide-area ground deformation monitoring using InSAR technology. Traditional time-series InSAR methods have cumbersome processing procedures, have large computational requirements, and rely heavily on manual intervention, resulting in relatively low efficiency. This study proposes a strategy for wide-area InSAR multi-scale deformation monitoring to address this issue. The strategy first rapidly acquires ground deformation information using Stacking technology, then identifies the main subsidence areas by setting deformation rate thresholds and visual interpretation, and finally employs advanced TS-InSAR technology to obtain detailed deformation time series for the main subsidence areas. The Turpan Basin in Xinjiang, China, was selected as the study area (7474.50 km2) to validate the proposed method. The results are as follows: (1) The basin is generally stable, but there is ground subsidence in the southern plain area, mainly affecting farmland. (2) From 2016 to 2019, the maximum subsidence rate in the farmland area was approximately 0.13 m/yr, with a maximum cumulative subsidence of about 0.25 m, affecting a total area of approximately 952.49 km2. The subsidence mainly occurred from late spring to mid-autumn, while lifting or subsidence mitigation occurred from late autumn to early spring. The study also analyzed the impacts of rainfall, geographical environment, and human activities on subsidence and found that multiple factors, including water resource reduction, overexploitation, geological characteristics, and the expansion of human activities, contributed to the subsidence problem in the Turpan Basin. This method contributes to wide-area InSAR deformation monitoring and the application of InSAR technology in engineering.
1. Introduction
Surface deformation is caused by the consolidation and compression of loose underground strata due to natural factors (such as crustal movement, earthquakes, and volcanic activity) or human activities (such as increased surface loading and underground resource development). The speed, magnitude, duration, and impact range of this deformation vary depending on the specific cause and geological environment [1]. Most surface deformations are characterized by slow generation, strong concealment, a long duration, and a wide impact range, posing serious threats to urban planning, transportation, flood control and drainage, and building safety. In addition, surface deformation may also trigger various geological disasters, such as collapses, landslides, and mudslides, which in turn endanger the stability of production and life and economic development in human society. Globally, potential surface deformation poses a threat to 8% (equivalent to 12 million square kilometers) of the global surface, affecting 1596 major cities, 19% of the population, and 12% of gross domestic product [1,2]. In China, more than 50 cities have experienced land subsidence, distributed across 20 provinces, autonomous regions, and municipalities including Beijing, Tianjin, Hebei, Shanxi, and Inner Mongolia. Among them, the land subsidence situation is particularly severe in cities such as Tianjin, Shanghai, Wuxi in Jiangsu, Xi’an, and Turpan. In addition, the area in China where the cumulative land subsidence exceeds 200 mm has reached 7900 square kilometers and shows a trend of further expansion [2].
Conventional surface deformation monitoring methods, such as leveling, Global Positioning System (GPS), digital close-range photogrammetry, and other technical means, have reached a high level of maturity and precision, providing reliable data support for surface deformation monitoring [3]. However, it is difficult for these methods to meet the application requirements of wide-area surface deformation monitoring. Synthetic Aperture Radar (SAR) Interferometry (InSAR) technology utilizes the phase information in SAR imagery to extract surface deformation information at a low cost, with wide coverage, high accuracy, and high efficiency [4]. Additionally, radar waves are not affected by lighting and weather conditions, allowing InSAR technology to conduct ground observations around the clock and in all weather conditions [5]. It can also retrospectively analyze surface deformation information through historical imagery. A series of time-series InSAR processing techniques developed based on this technology effectively suppress various error terms in InSAR measurements [6]. These techniques enhance the accuracy of surface deformation extraction and bring new opportunities for wide-area surface deformation monitoring. The combination of advanced InSAR processing and high-resolution SAR data acquired from satellites or airborne platforms has greatly improved our ability to detect and monitor subtle changes in the Earth’s surface, enabling the more effective management of geological risks and urban planning [4,5,6].
However, traditional time-series InSAR methods involve cumbersome processing procedures, require significant computational resources, and rely heavily on manual intervention, resulting in relatively low efficiency [7]. This makes it challenging to rapidly extract reliable surface deformation information from vast amounts of data, a task that is crucial for a quick response to geological disasters and wide-area surface deformation screening. In contrast, the Stacking interferometry technique proposed by Sandwell, D.T., exhibits unique advantages [5]. Compared to traditional TS-InSAR techniques (such as Persistent Scatterer (PS), Small Baseline Subset (SBAS), and Interferometric Point Target Analysis (IPTA)), Stacking not only reduces technical requirements but also significantly improves computational efficiency, providing a new approach for rapidly acquiring surface deformation information [8]. Given this, this paper proposes a strategy for multi-scale deformation monitoring using wide-area InSAR. Firstly, we employ the Stacking technique for preliminary monitoring of wide-area surface deformation regions to rapidly obtain low-spatial-resolution maps of surface deformation rates [9]. This helps us identify the approximate locations and extents of the main subsidence areas. Subsequently, for these key subsidence regions, we utilize advanced TS-InSAR techniques to acquire high-spatial-resolution time-series deformation data and cumulative subsidence volumes. This approach enables us to more precisely reveal deformation characteristics and evolution patterns. By combining the efficiency of Stacking with the precision of TS-InSAR, our proposed strategy offers a powerful tool for wide-area surface deformation monitoring, particularly in scenarios where rapid response and accurate assessment are critical [10].
To validate the effectiveness of our proposed strategy, we selected the Turpan Basin in Xinjiang, China, as our study area. The Turpan Basin covers an extensive area of approximately 7474.50 km2, characterized by complex geological structures, multiple fault zones and blocks, and an extremely arid climate with scarce rainfall. With the continuous growth in agricultural and industrial water usage, coupled with inadequate water resource management, groundwater has been severely over-extracted, leading to a persistent decline in water levels. As a result of the massive extraction of groundwater, the voids in underground rock layers are gradually compressed, triggering the phenomenon of land subsidence. This situation has caused severe consequences in the Turpan Basin. It not only makes the land more fragile, increasing the risk of geological disasters such as ground collapses and ground fissures, posing potential dangers to local residents and their buildings, but also has profound negative impacts on agricultural production and the ecological environment, exacerbating ecological fragility. Therefore, there is an urgent need to establish a land subsidence monitoring system to monitor subsidence in real-time, enabling the early detection and warning of potential issues. By applying our strategy, we successfully obtained the spatial and temporal distribution characteristics of land subsidence in the Turpan Basin. This not only provides powerful technical support for the Turpan government in addressing land subsidence issues but also lays a solid foundation for subsequent land subsidence investigation work. Our findings have significant practical application value and scientific importance. Moreover, our approach demonstrates the potential of combining advanced remote sensing techniques with geospatial analysis for effective monitoring and management of geological hazards in large and complex regions. We believe that this strategy can be further refined and applied to other similar regions worldwide, contributing to an improved understanding and mitigation of surface deformation phenomena.
The structure of this article is organized as follows: Section 2 details the Stacking and TS-InSAR techniques, along with their use in monitoring surface deformation. Section 3 briefly outlines the study area of Turpan, including data sources and processing procedures. Section 4 highlights the monitoring results of Turpan’s surface subsidence and assesses their accuracy. Section 5 delves into the reasons and trends behind the deformations, and Section 6 concludes the study with key findings.
2. Methodology
Firstly, we comprehensively collected all available InSAR datasets covering the Turpan Basin and generated multi-temporal DInSAR datasets with a unified spatial reference through precise registration processes and the setting of reasonable spatial and temporal baseline thresholds [3,11,12]. Subsequently, we employed a wide-area InSAR multi-scale deformation monitoring strategy to conduct in-depth processing on these DInSAR datasets. The specific workflow is illustrated in Figure 1.
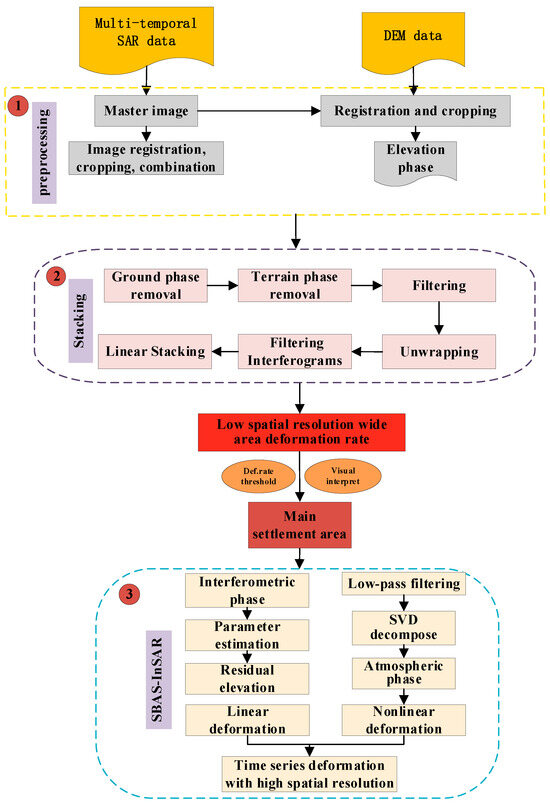
Figure 1.
Flowchart of multi-scale deformation monitoring strategy for wide-area InSAR.
- (1)
- Rapid acquisition of wide-area surface deformation rates using Stacking technique [13]: Initially, we processed a total of 300 Sentinel-1A (P41F135 and P143F136) images using Stacking technology. Subsequently, we mosaicked the results from all frames to obtain a wide-ranging deformation rate.
- (2)
- Identification of major subsidence areas based on the stitched wide-area deformation rates: According to the “Technical Specification for Ground Subsidence Interferometric Radar Data Processing”, we set the deformation rate threshold and used visual interpretation methods to obtain the areas we need.
- (3)
- Acquisition of high-spatial-resolution deformation results for the primary subsidence areas. By utilizing advanced SBAS-InSAR technology to process Radarsat-2 data [14], we obtained high-spatial-resolution time-series deformation and cumulative subsidence in the main subsidence areas, followed by an analysis of the results.
2.1. Stacking Technique
Stacking technology, proposed by Sandwell, D.T., in 1998, involves the linear stacking of unwrapped interferometric SAR images from different time periods. This technique not only mitigates the influence of atmospheric phase but also enhances the signal-to-noise ratio of deformation signals [5]. The mathematical model is as follows:
In Equation (1), represents the deformation phase rate, while and denote the interferometric phase and time interval of the i-th InSAR pair, respectively.
The rate of the deformation phase change would be converted to the deformation rate () as follows:
where is the wavelength of the SAR sensor. The fundamental idea behind this algorithm is that since atmospheric signals are temporally random, assuming linear ground deformation, when N unwrapped interferograms are stacked, the linear signal from the ground surface increases by a factor of N, whereas the atmospheric phase error increases by only a factor of . This effectively suppresses the influence of the atmospheric phase. Therefore, when selecting interferometric pairs for stacking, it is advisable to choose image pairs with minimal atmospheric-phase influence. However, the Stacking technique is unable to capture nonlinear deformation information, thus necessitating the integration of other methods to compensate for this limitation.
2.2. Time Series InSAR Method
For SBAS-InSAR technology, within the time period (, , …, ), one image is selected as the master image from N SAR images acquired in the same area, and the other SAR images are then co-registered with the master image. Assuming that each SAR image satisfies the critical baseline requirements, M sets of interferometric pairs can be generated, subject to the following conditions:
Assuming that the acquisition times of two consecutive images are and , respectively, and that these two images are differenced to generate the j-th interferometric fringe pattern, the interference phase can be expressed as follows, without considering the atmospheric delay phase, residual topographic phase, and noise phase:
In Equation (4), represents the interferometric phase; denotes the scene number of the differential interferogram, with ; λ is the electromagnetic wavelength; and and are the accumulated deformation quantities in the radar line of sight (LOS) direction at times and , respectively, relative to the reference state where . Phase information is obtained through phase unwrapping, and the unknown phase value corresponding to the deformation quantity of a given pixel can be expressed as follows:
The unwrapped phase value is as follows:
The linear relationship between deformation-accumulated phases and interferometric phase sequences is represented using a matrix:
In Equation (7), represents an coefficient matrix. If M is greater than or equal to N, the least squares method can be applied to obtain the following:
If , becomes a singular matrix, and a unique solution cannot be obtained using the least squares method. In this case, the phase in Equation (6) is represented by the product of the average phase velocity between two images and the time.
By replacing the phase in Equation (4) with (9), we obtain the following:
The integration of velocities over the time intervals between master and slave images for each time period can be represented in matrix form as follows:
In Equation (11), is an matrix. At this point, by applying singular value decomposition (SVD) to matrix , the minimum norm solution for the velocity vector, , can be obtained, yielding linear deformation information of the phase. By filtering the residual phase in both time and space, the atmospheric phase and nonlinear deformation phase can be separated. By superimposing these two deformation components, precise surface deformation measurements can be determined.
3. Study Area and SAR Datasets
3.1. Study Area
The Turpan Basin is located in the southern part of Xinjiang Uygur Autonomous Region, China, situated between 40°50′ and 43°20′ north latitude and 88°40′ and 91°15′ east longitude [15]. As one of the largest low-latitude inland basins in China, it features a low-lying terrain surrounded by the Tianshan and Kunlun Mountains, with a dry climate typical of a temperate continental arid region. The internal landforms of the basin mainly consist of plains and low mountains, with the altitude gradually increasing from southwest to northeast. The temperature is relatively high, with significant diurnal temperature variations. The geological structure is complex, composed of limestone, sandstone, shale, etc., and there are multiple fault zones and fault blocks. Vegetation is relatively sparse, dominated by desert plants and a few shrubs, with scarce animal and plant resources. Due to the limitations of natural conditions and the impact of human activities, land desertification is severe, water resources are scarce, and the ecological environment is fragile in the Turpan Basin. However, it is an important agricultural production base with developed planting and fruit industries, known for its grapes, raisins, Hami melons, etc. Figure 2 shows the location of the study area and the scope of the SAR imagery [16,17].
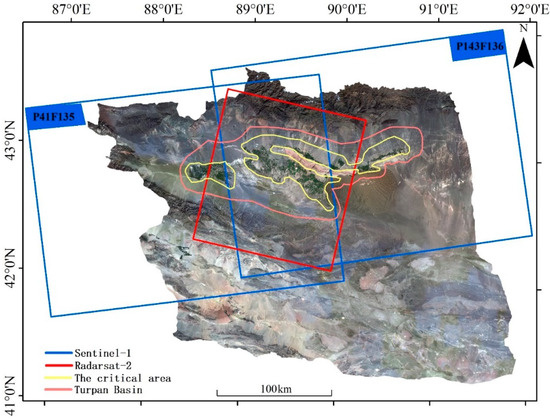
Figure 2.
The Turpan Basin and SAR data range.
3.2. SAR Datasets
The Sentinel-1 mission comprises two polar-orbiting satellites, Sentinel-1A and Sentinel-1B, which constitute an all-weather, day-and-night radar imaging system. It is the first satellite developed by the European Commission (EC) and the European Space Agency (ESA) for the Copernicus global earth observation program and was launched in April 2014 [18]. In this study, SAR imagery provided by the Sentinel-1A satellite was used, offering complete coverage of the Turpan Basin. The time span covers a total of 150 scenes from March 2017 to June 2022. The Sentinel-1A satellite operates in a near-polar, sun-synchronous orbit at an altitude of 693 km, with an orbit inclination of 98.18° and an orbital period of 99 min. The revisit period for the same area is 12 days [19]. Table 1 summarizes the main parameters of the Sentinel-1 satellite system.

Table 1.
Main parameters of Sentinel-1 satellite system.
Radarsat-2 is Canada’s next-generation commercial fully polarimetric SAR satellite, succeeding Radarsat-1 and inheriting all of its operational modes. Radarsat-2 operates in a sun-synchronous orbit at an altitude of 798 km, with an orbit inclination of 98.6° and a revisit period of 24 days. The spaceborne SAR system operates in the C-band [20,21]. For this study, descending orbit data from Radarsat-2 covering key research areas in the Turpan Basin were collected, spanning a time period from August 2016 to September 2019, totaling 19 scenes of imagery. Table 2 summarizes the main parameters of the Radarsat-2 satellite system.

Table 2.
Main parameters of Radarsat-2 satellite system.
Additionally, DEM (Digital Elevation Model) data were collected for flat earth removal processing. The data utilized were the 30 m resolution SRTM (Shuttle Radar Topography Mission) V4 version released by NASA (National Aeronautics and Space Administration).
4. Results
4.1. Monitoring of Wide-Area Surface Deformation in Turpan Basin
We processed two sets of Sentinel-1 data comprising a total of 300 scenes, using Stacking techniques. Initially, one image was selected as the master image from the SAR data with the same map sheet number. Subsequently, the remaining images underwent registration and resampling, and the DEM was also aligned [22]. By setting thresholds of a temporal baseline less than 18 days and a spatial baseline less than 300 m, we generated 622 and 548 interferometric pairs, respectively (as shown in Figure 3).
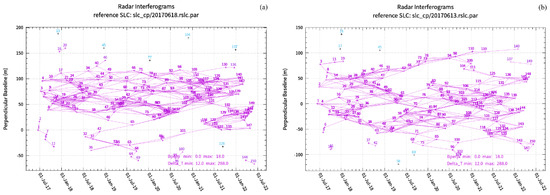
Figure 3.
Spatiotemporal baseline distribution map of Sentinel-1 data: (a) P43F135 and (b) P143F136.
We performed interferometric processing on these interferometric pairs, utilizing external SRTM DEM for geocoding and simulating and removing terrain phases in the SAR coordinate system [23]. Multi-looking processing (10 × 2) was applied to the SAR images to enhance the coherence of the interferograms. To further improve the signal-to-noise ratio of the interferograms, we employed adaptive spatial domain-filtering methods. Points with coherence values below 0.3 were eliminated, and points that maintained high and stable coherence within the interferometric pairs were selected as unwrapping points. Phase unwrapping was performed using the Minimum Cost Flow (MCF) algorithm [24]. Combinations with ideal unwrapped phase maps and minimal phase jumps in the test area were chosen, and linear deformation rates were estimated using weighted stacking. Through spatial low-pass and temporal high-pass filtering, atmospheric phases were further separated to obtain deformation phase maps, and deformation rates in the LOS direction were calculated [25,26]. Utilizing the conversion lookup table between the DEM coordinate system and the image coordinate system, the deformation-phase and -rate maps were transformed into the geographic coordinate system, as shown in Figure 4.
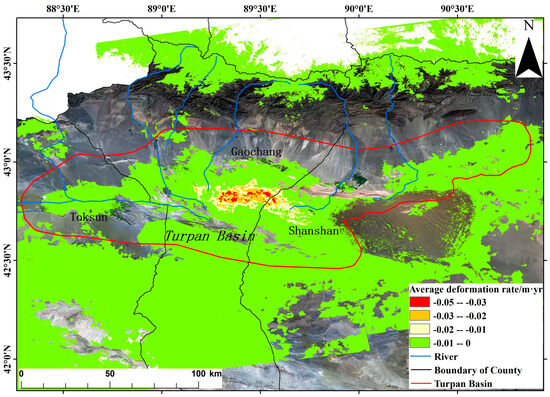
Figure 4.
Distribution of average deformation rate in the Turpan Basin from June 2017 to June 2022, based on Stacking technique.
Based on Figure 4, it is evident that the surface of the Turpan Basin exhibits overall stability, with the primary type of deformation being land subsidence. The subsidence areas are predominantly located in the central portion of the Turpan Basin. Notably, Toksun County does not exhibit significant land subsidence, whereas Gaochang District experiences severe land subsidence over a considerable area, extending to parts of Shanshan County. Importantly, the maximum annual deformation rate does not exceed 0.05 m per year.
According to the “Technical Specification for Ground Subsidence Interferometric Radar Data Processing” [27], the annual deformation rates are classified, and a statistical analysis is conducted for areas of different deformation levels. In the Turpan Basin, the area experiencing surface subsidence (with an annual surface deformation rate less than −0 m/yr) is approximately 3104.10 km2. The area of low subsidence, with an annual deformation rate between −0 m/yr and −0.01 m/yr, is about 2677.13 km2. The area of relatively low subsidence, with rates ranging from −0.01 m/yr to −0.03 m/yr, covers approximately 399.99 km2. The area of moderate subsidence, with rates between −0.03 m/yr and −0.05 m/yr, is about 26.98 km2. Detailed area statistics are presented in Table 3.

Table 3.
Statistical table of distribution area of annual average deformation rate in Turpan Basin from June 2017 to June 2022.
4.2. Monitoring of Land Subsidence in Critical Areas
Through Section 4.1, we discovered that the primary subsidence areas in the Turpan Basin are concentrated in the central part of the basin, specifically in the plain region south of the Flaming Mountain Fault Zone. This area comprises extensive farmland (as depicted in Figure 5), where agricultural irrigation relies heavily on groundwater. As a result, the over-extraction of groundwater has led to significant land subsidence. This subsidence is characterized by prominent vertical displacement with minimal horizontal movement.
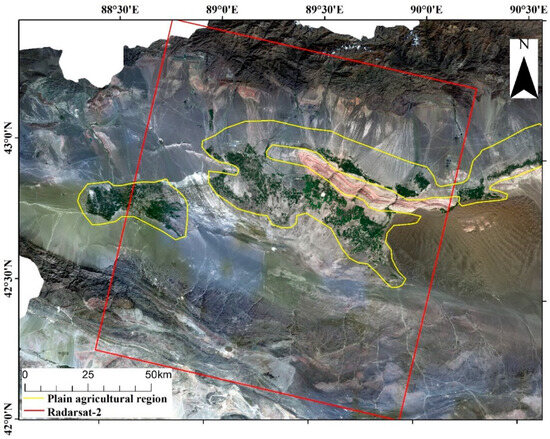
Figure 5.
Turpan Basin Plain and agricultural areas.
Using advanced SBAS-InSAR technology, 19 descending orbit Radarsat-2 datasets covering key areas were processed. With a given threshold of a temporal baseline less than 365 days and a spatial baseline less than 587 m, the 19 datasets were paired to form interferometric image pairs. A total of 85 interferometric pairs were generated, with a maximum spatial baseline of 206.3 m and a maximum temporal separation of 360 days. Each image had an average of eight or nine pair connections, exhibiting good coherence, as shown in Figure 6.
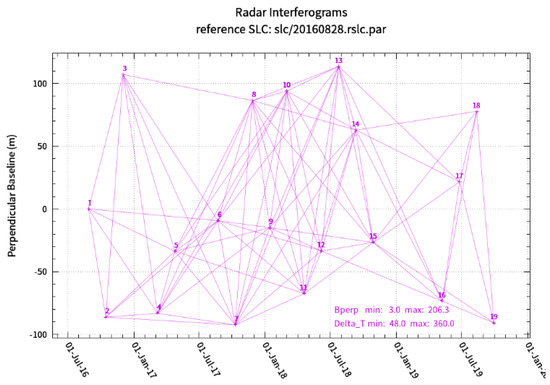
Figure 6.
Spatial and temporal baseline distribution of the SBAS-InSAR technique.
After SBAS-InSAR processing, the average deformation rate in the plain agricultural area of the Turpan Basin from August 2016 to September 2019 was obtained. The maximum ground subsidence rate was approximately 0.13 m/yr, and the maximum cumulative subsidence was about 0.25 m, as shown in Figure 7.
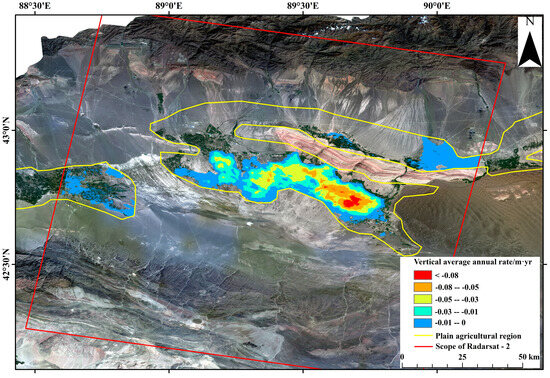
Figure 7.
Distribution of vertical mean deformation rate in agricultural plain area of Turpan Basin based on SBAS-InSAR from August 2016 to June 2019.
4.2.1. Analysis of Subsidence Results in Plain Agricultural Area
Based on the acquired Radarsat-2 data for the observation area in the Turpan Basin between August 2016 and September 2019, the annual average rate of vertical surface deformation was analyzed. Over the three-year period, the area experiencing land subsidence (with an annual deformation rate less than 0 m/year) in the plain agricultural region was approximately 952.49 km2, accounting for about 36.09% of the total plain agricultural area (2638.97 km2). The area without surface subsidence was approximately 1686.48 km2, accounting for about 63.91% of the total area (2638.97 km2).
The subsidence regions are classified by setting different deformation rate thresholds. Specifically, the low subsidence area, characterized by annual deformation rates between 0 m/yr and −0.01 m/yr, occupies an approximate area of 452.78 km2, accounting for nearly half (47.54%) of the total subsiding territory. Following this, the relatively low subsidence area, with rates ranging from −0.01 m/yr to −0.03 m/yr, encompasses 235.16 km2, or 24.69% of the total. The moderate subsidence area, with deformation rates between −0.03 m/yr and −0.05 m/yr, covers 167.60 km2, representing 17.6% of the subsiding area. Higher subsidence rates are observed in the relatively high subsidence area, spanning 80.25 km2, with rates from −0.05 m/yr to −0.08 m/yr, accounting for 8.43% of the total. Finally, the high subsidence area, experiencing the most significant deformation with rates less than −0.08 m/yr, occupies a smaller portion of 16.7 km2, or 1.75% of the total subsiding area. Detailed area statistics are presented in Table 4.

Table 4.
Statistical table of annual average deformation rate distribution area in agricultural area of Turpan Basin Plain from August 2016 to September 2019.
By analyzing the Radarsat-2 data for the Turpan Basin from August 2016 to September 2019, specific subsidence areas with an annual average vertical deformation rate less than −0.01 m/yr have been identified. Two notable subsidence zones, A01 and A02, are depicted in Figure 8. The A01 subsidence area, located at the juncture of Yaer Town, Putao Township, and Qiatekale Township in Gaochang District, has an estimated area of 27.96 km2. Meanwhile, the A02 subsidence zone affects portions of Qiatekale Township, Sanbao Township, and Erbao Township in Gaochang District, as well as areas within Tuyugou Township and Dalangkan Township in Shanshan County. The estimated area of the A02 subsidence region is approximately 471.75 km2. Specific area statistics are presented in Table 5.
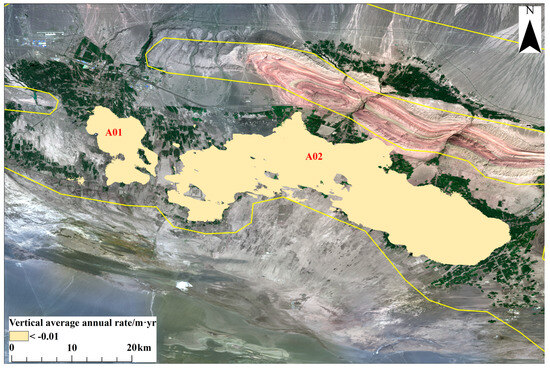
Figure 8.
The surface vertical deformation of annual average rate of less than −0.01 m/yr subsidence area.

Table 5.
Statistics of the area where the average annual rate of surface vertical deformation is less than −0.01 m/yr.
By extracting data from the Radarsat-2 satellite observations in the Turpan Basin between August 2016 and September 2019, we identified several subsidence areas where the annual average rate of vertical surface deformation is less than −0.03 m/yr, as shown in Figure 9. Specifically, the B01 subsidence area is located at the junction of Yaer Town and Putao Township in Gaochang District, covering a small area of approximately 9.12 km2. The B02 subsidence zone, also relatively small, is found at the intersection of Yaer Town and Qiatekale Township in Gaochang District, with an area of about 3.20 km2. Both B03 and B04 subsidence regions are located in small pockets of Qiatekale Township in Gaochang District, with areas of 0.46 km2 and 0.59 km2, respectively. The B05 subsidence area is more extensive, affecting parts of Qiatekale Township, Sanbao Township, and Erbao Township in Gaochang District, as well as portions of Tuyugou Township, Dalangkan Township, and Lukeqin Town in Shanshan County (specifically, the junction areas of these three townships/towns). This region covers a significant area of approximately 249.48 km2. Lastly, the B06 subsidence zone is another small area located in Qiatekale Township of Gaochang District, with a surface area of about 1.70 km2. These detailed findings provide valuable insights into the spatial distribution and varying intensities of land subsidence within the study region. Specific area statistics are presented in Table 6.
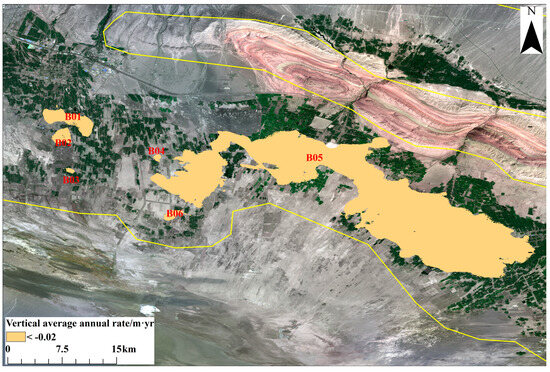
Figure 9.
The surface vertical deformation of annual average rate of less than −0.03 m/yr subsidence area.

Table 6.
Statistics of the area where the average annual rate of surface vertical deformation is less than −0.03 m/yr.
By analyzing the Radarsat-2 satellite data for the Turpan Basin between August 2016 and September 2019, we identified several subsidence areas where the annual average rate of vertical surface deformation is less than −0.05 m/yr, as depicted in Figure 10. The C01 and C02 subsidence regions are located in small pockets of Qiatekale Township in Gaochang District, with areas of approximately 0.64 km2 and 3.28 km2, respectively. The C03 subsidence area is found at the junction of Sanbao Township and Erbao Township in Gaochang District, covering a slightly larger area of about 7.97 km2. Moving to Shanshan County, the C04 and C05 subsidence zones are small areas within Tuyugou Township, with surface areas of 1.98 km2 and 0.71 km2, respectively. The most extensive subsidence region in this category is the C06 area, which affects portions of Tuyugou Township, Dalangkan Township, and Lukeqin Town in Shanshan County, specifically at the junction of these three administrative units. This region has a significant surface area of approximately 82.37 km2. Specific area statistics are presented in Table 7.
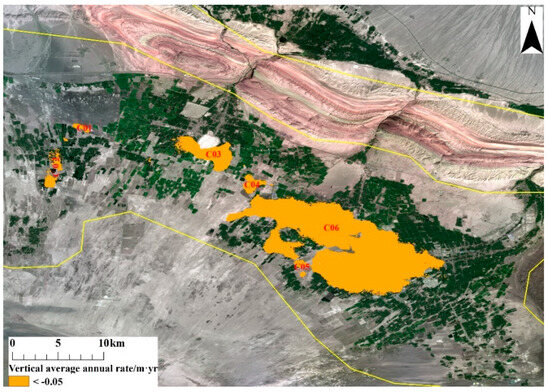
Figure 10.
The surface vertical deformation of annual average rate of less than −0.05 m/yr subsidence area.

Table 7.
Statistics of the area where the average annual rate of surface vertical deformation is less than −0.05 m/yr.
The vertical deformation rate of the ground surface in the observation area of Radarsat-2 data in the Turpan Basin from August 2016 to September 2019 was extracted, and the subsidence area with an average annual rate less than −0.08 m/yr is shown in Figure 11. The D01 subsidence area occurs in a small area of Tuyugou Township, Shanshan County, with an area of approximately 0.44 km2; and the D02 subsidence area occurs in part of Dalangkan Township, Shanshan County, with an area of approximately 16.26 km2. Specific area statistics are presented in Table 8.
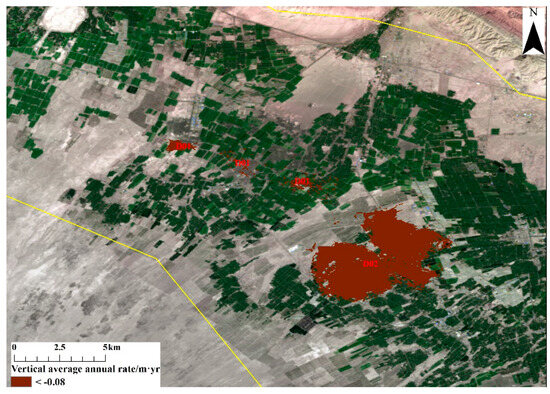
Figure 11.
The surface vertical deformation of annual average rate of less than 0.08 m/yr subsidence area.

Table 8.
Statistics of the area where the average annual rate of surface vertical deformation is less than −0.08 m/yr.
These findings provide valuable insights into the spatial patterns and intensities of land subsidence within the study area, which is critical for understanding the geological processes and potential impacts on the local environment and infrastructure [28].
4.2.2. Analysis of Historical Settlement Results
Assuming that the image acquired on 28 August 2016 serves as the reference, with a deformation value of 0 m, we analyzed other SAR images to derive the time-series cumulative deformation in the region (as illustrated in Figure 12). The figure reveals that, from August 2016 to August 2017, no significant subsidence occurred in the area. However, from August 2017 to September 2018, gradual ground subsidence emerged and exhibited an intensifying trend. Although the total subsidence area remained largely unchanged from September 2018 to September 2019, the severity of the subsidence further increased. To delve deeper into the time-series surface deformation in the Turpan Basin during the three-year period from 2016 to 2019, we selected eight sampling points in areas with pronounced subsidence trends and assigned them sequential numbers from 1 to 8. Additionally, four sampling points, numbered 9 to 12, were chosen from nearby non-subsiding regions for comparison.
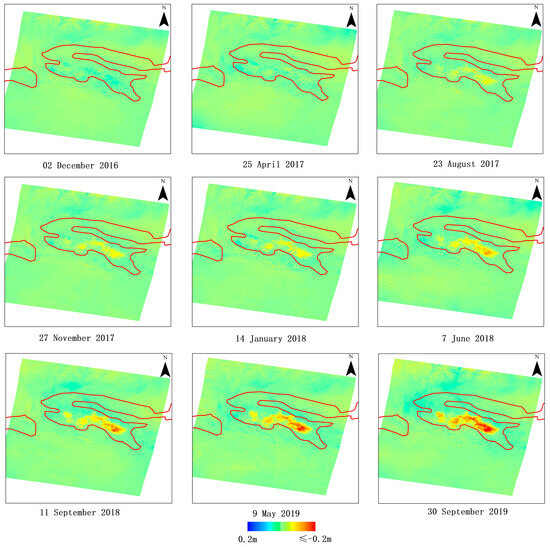
Figure 12.
Series of accumulated subsidence from August 2016 to September 2019 in the observation area.
As clearly demonstrated in Figure 13, the cumulative subsidence amounts for the subsidence areas (sampling points 1 to 8) are 0.14 m, 0.12 m, 0.13 m, 0.15 m, 0.16 m, 0.22 m, 0.23 m, and 0.24 m, respectively. Meanwhile, the non-subsiding areas adjacent to the subsidence zones (sampling points 9 to 12) exhibit a stable trend, unaffected by the subsidence. This provides strong evidence that the ground subsidence phenomenon in the Turpan Basin is not spreading outwards but is intensifying within the existing affected area.
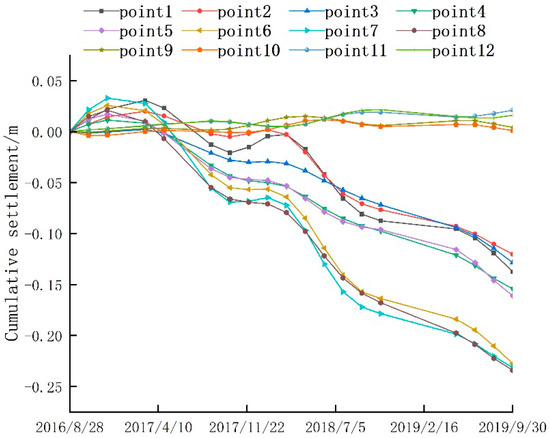
Figure 13.
Time series deformation of sampling points.
Between August 2016 and April 2017, the sampling points in the subsidence area (points 1 to 8) exhibited relatively stable behavior. In fact, during the first half of this period, some sampling points even showed slight ground uplift. However, it is worth noting that sampling points 3 to 5 and point 8 had already begun to show signs of subsidence. Subsequently, from April 2017 to October 2017, the study area experienced its first phase of ground subsidence. During this stage, the eight sampling points showed varying degrees of subsidence, ranging from minor to significant, clearly indicating that the ground subsidence phenomenon in the region had begun to accelerate.
Continuing from the previous trend, the rate of subsidence within the study area began to slow down between October 2017 and April 2018. Notably, sampling points 1, 2, and 7 exhibited a slight uplift, while the changes in subsidence at other sampling points were relatively minor. This indicated a period of stabilization in the topographical variations in the region. However, from April 2018 to September 2019, the study area entered a second phase of ground subsidence. During this stage, sampling points 3 to 5 demonstrated a gradual subsidence trend, while other sampling points underwent significant overall downward changes. The subsidence patterns observed during this period suggest that the ground subsidence issues in the region persist and may have continuing impacts in the future. This possibility is further corroborated by the evidence presented in Section 4.1.
4.3. Reliability Assessment
We performed a comparison with the surface measurement results from Xinjiang Satellite Positioning and Navigation Reference Stations (XJCORS) in Turpan City. We collected the ellipsoid height data measured by CORS from 2017 to 2022 at Turpan Station in the Turpan Basin. Table 9 presents the actual CORS measurement data for Turpan Station.

Table 9.
Geodetic height measured by CORS at Turpan Station in each year (unit: m).
The CORS station’s measured data and InSAR monitoring results were used for a comparison to verify the accuracy of InSAR data processing, as shown in Table 10. The RMSE of the annual height difference comparison between the CORS-measured elevation data and the InSAR-monitored subsidence data at the Turpan Station, starting from 2017, is 2.73 mm/year, indicating that the InSAR deformation monitoring results are relatively reliable.

Table 10.
Comparison table of annual elevation difference between CORS measured data and InSAR monitoring data at Turpan site starting from 2017 (unit: mm).
5. Discussion
5.1. Influence of Rainfall on the Subsidence of Turpan Basin
By collecting data on total water resources and total water usage spanning four years, from 2016 to 2019 (refer to Table 11), we observed that the annual precipitation during these four years was 2.867 billion m3, 2.63 billion m3, 3.32 billion m3, and 1.61 billion m3, respectively. The average precipitation was only 2.607 billion m3, significantly below the multi-year average of 3.13 billion m3. More alarmingly, during this period, there was a persistent decreasing trend in surface water resources, groundwater resources, and total water resources. Concurrently, the total water usage consistently exceeded the total water resources, a situation that not only intensified water usage pressure but also led to a series of severe environmental issues, such as groundwater overexploitation and ground subsidence.

Table 11.
Total water resources and water consumption from 2016 to 2019.
The water yield coefficient is a key metric for assessing the effective utilization rate of precipitation. If a region exhibits a high water yield coefficient, it indicates its excellence in converting precipitation into usable water resources. However, the low water yield coefficients observed in the Turpan Basin in 2017 and 2018 reveal that a significant amount of rainfall during these two years was not effectively and reasonably utilized or converted, aligning with the notable ground subsidence phenomenon observed during this period (Figure 13). Additionally, the water yield modulus is commonly used as a benchmark for evaluating water resource utilization efficiency. Over the four-year period under investigation, the declining trend in the water yield modulus in the Turpan region suggests potential wastage or unreasonable utilization of water resources in the area.
5.2. Influence of Geographical Environment on the Subsidence of Turpan Basin
The Turpan Basin is home to numerous farmlands, with extensive agricultural planting areas located in its western and northern regions. However, it is noteworthy that significant ground subsidence is only observed in the southern part of the basin. By plotting the subsidence results, along with the corresponding fault distribution (as shown in Figure 14), it becomes evident that irrigation in the plain agricultural areas primarily relies on rainfall and melted water from the surrounding mountainous regions. The Flaming Mountains’ fault line, running east to west across the Turpan Basin, effectively blocks the water flow from the southern part of Tianshan Mountain. As a result, the northern part of the basin, located north of the Flaming Mountains, enjoys direct access to abundant mountain water resources, while the southern part of the basin faces a scarcity of both surface water and groundwater. The only river channel in the south has nearly dried up, and the water supply diminishes with increasing distance from the fault. Due to the limited surface water being insufficient to meet the growing irrigation demand, the aquifers have been continuously overexploited, leading to widespread subsidence in this region, and the situation is becoming increasingly severe.
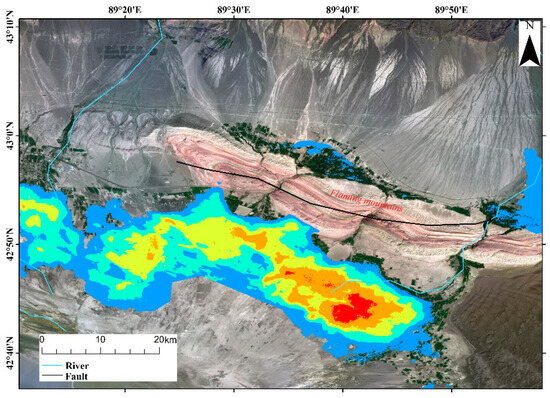
Figure 14.
Subsidence results and corresponding faults.
In addition, the Turpan Basin is renowned for its arid climate, abundant sunshine, and high evaporation rate, particularly during the late-spring-to-summer season, when evaporation accounts for up to 75% of the annual total [29]. This period coincides with the critical growth stage of crops, thus creating an urgent demand for irrigation water. The heavy reliance of agriculture in this region on groundwater extraction has directly led to the rapid depletion of aquifers, further exacerbating the rate of surface subsidence. However, from late autumn to early spring, as the intensity of groundwater extraction for farmland gradually decreases, the underground aquifer is able to recharge through surface runoff and groundwater recharge. This phenomenon explains why the subsidence rate accelerates during the summer and autumn, while it relatively slows down or even shows a slight rebound during the winter and spring.
5.3. Influence of Human Factors on the Subsidence of Turpan Basin
We collected land cover data for the Turpan Basin from the years 2000, 2008, 2010, 2015, and 2020 (as shown in Figure 15, with the dataset provided by the Data Center for Resources and Environment Sciences, Chinese Academy of Sciences (RESDC)), and recorded the area of different land types in detail for each period (see Table 12) [30].
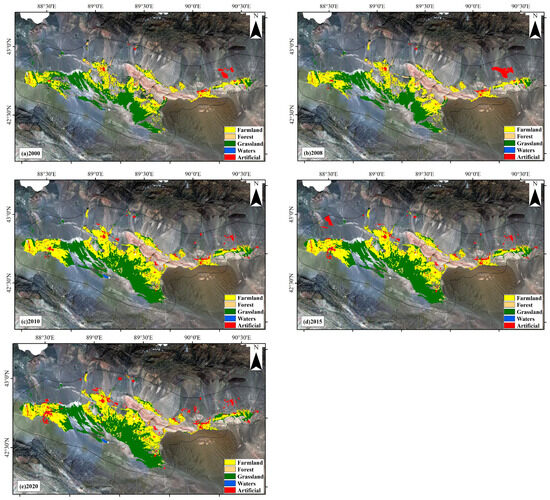
Figure 15.
Temporal and spatial changes in land types in Turpan Basin in 2000, 2008, 2010, 2015, and 2020.

Table 12.
Land cover-type area changes in Turpan Basin in 2000, 2008, 2010, 2015, and 2020.
Over the past two decades, the continuous expansion of agricultural land in the region has led to an increasing demand for water resources. Meanwhile, the reduction in forest area will accelerate water flow, decrease soil water retention capacity, and subsequently affect groundwater recharge. Although the grassland area has shown a gradual increase, the newly added areas are mainly medium- and low-coverage grasslands, which are typically water-scarce and not suitable for the development of animal husbandry. The water area has remained stable, without significant changes over time, but its presence can alleviate the pressure of overexploitation of groundwater for agricultural and domestic use to some extent. Additionally, artificial areas such as urban and rural settlements, industrial and mining areas, and residential land have continued to expand, gradually encroaching on areas with severe subsidence, which may exacerbate the problem of ground subsidence.
6. Conclusions
In this study, we first processed the five-year Sentinel-1 data covering the Turpan Basin from June 2017 to June 2022 using the Stacking technique to obtain a complete annual average deformation rate map of the Turpan Basin. The results indicate that the Turpan Basin is generally stable, with ground subsidence being the primary type of deformation. The subsidence areas are concentrated in the southern part of the Turpan Basin, specifically the plain area south of the Flaming Mountains fault zone, where there are numerous farmland areas. There is no severe ground subsidence in Toksun County, while Gaochang District has suffered significant and extensive ground subsidence, affecting some areas of Shanshan County as well.
Subsequently, we employed the SBAS-InSAR technique to conduct in-depth processing of Radarsat-2 data, focusing on high-precision monitoring of areas with severe subsidence. This comprehensive approach allowed us to acquire both the annual average deformation rate and cumulative subsidence data for the region between August 2016 and September 2019. Our analysis revealed that the maximum subsidence rate within the studied area is approximately 0.13 m/yr, with a maximum cumulative subsidence of about 0.25 m. The total affected area due to ground subsidence is estimated to be approximately 952.49 km2. Further data extraction and analysis highlighted that Gaochang District and Shanshan County are the two most significantly affected regions by subsidence. Particularly, in Tuyugou Township and Dalangkan Township of Shanshan County, the subsidence is particularly severe. Through detailed observations of time-series cumulative deformation data and 12 key sampling points, we discovered that ground subsidence primarily occurs during late spring, summer, and early-to-mid-autumn. Conversely, from late autumn to early spring, there is either ground uplift or a significant reduction in the rate of subsidence. It is worth noting that the affected area due to subsidence has not continued to expand but has persisted within the original footprint. This finding provides a crucial reference for our subsequent research and response measures.
Finally, we conducted an in-depth analysis of three key factors, rainfall, geographical environment, and human activities, to explore the underlying causes of subsidence in the Turpan Basin. By collecting water-resource and water-use data for Turpan City between 2016 and 2019, we identified a notable trend: the total amount of water resources formed by rainfall is decreasing year by year, while the total water usage continues to rise. Further calculations of the water-yield coefficient and water-yield modulus revealed potential issues of wastage or unreasonable utilization of water resources in the Turpan region. Such conditions are likely to have led to overexploitation of groundwater, subsequently triggering ground subsidence. In terms of geographical factors, the Flaming Mountains’ fault line runs through the east and west sides of the Turpan Basin, a geological feature that significantly determines the subsidence areas’ primary distribution in the southern part of the basin. Regarding human activities, we observed the continuous expansion of agricultural land and artificial construction areas, coupled with the reduction of forest areas and high-coverage grasslands. These changes have exacerbated the demand for water resources, further aggravating the problem of ground subsidence. Therefore, we can conclude that the subsidence issue in the Turpan Basin is a result of the combined effects of multiple factors.
Despite its certain degree of rationality, this method still has some limitations. Ground subsidence is often a gradual process, necessitating long-term, continuous monitoring to capture its subtle shifts. When establishing a subsidence monitoring system for a specific region, real-time data updates are particularly crucial. However, traditional time-series InSAR technology faces significant challenges when processing newly added data. Whenever new data scenes are introduced, the entire dataset must be reprocessed, consuming substantial computational resources and causing considerable delays. Moreover, this approach relies on multi-source SAR data. While Sentinel-1 data are freely accessible, their resolution is not exceptionally high, necessitating additional high-resolution SAR data. As a result, data availability poses another limitation to this method.
Author Contributions
Conceptualization, R.L., G.Z. and X.G.; formal analysis, X.G. and Z.C.; funding acquisition, R.L., G.Z. and Z.C.; investigation, X.G. and Z.C.; methodology, X.G. and Z.C.; resources, R.L. and G.Z.; software, G.Z. and Z.C.; validation, Z.C.; writing—original draft, X.G.; writing—review and editing, all authors. All authors have read and agreed to the published version of the manuscript.
Funding
This research was funded by National Natural Science Foundation of China projects (NSFC) (No. 41801397), National Key Research and Development Program of China (2021YFB3900604).
Data Availability Statement
Dataset available on request from the authors: The raw data supporting the conclusions of this article will be made available by the authors on request.
Acknowledgments
The authors would like to thank the European Space Agency (ESA) for providing free and open Sentinel-1 data; the Canadian Space Agency’s Earth Observation Data Receiving Station (EO) for providing Radarsat-2 data; and the Data Center for Resources and Environment Sciences, Chinese Academy of Sciences (RESDC), for providing the free and open Chinese Land Cover Data Product.
Conflicts of Interest
The authors declare no conflict of interest.
References
- Herrera-García, G.; Ezquerro, P.; Tomás, R.; Béjar-Pizarro, M.; López-Vinielles, J.; Rossi, M.; Mateos, R.M.; Carreón-Freyre, D.; Lambert, J.; Teatini, P.; et al. Mapping the Global Threat of Land Subsidence. Science 2021, 371, 34–36. [Google Scholar] [CrossRef] [PubMed]
- Wang, C.; Tang, Y.; Zhang, H.; You, H.; Zhang, W.; Duan, W.; Wang, J.; Dong, L.; Zhang, B. First Mapping of China Surface Movement Using Supercomputing Interferometric SAR Technique. Sci. Bull. 2021, 66, 1608–1610. [Google Scholar] [CrossRef] [PubMed]
- Wright, T.J.; Parsons, B.; England, P.C.; Fielding, E.J. InSAR Observations of Low Slip Rates on the Major Faults of Western Tibet. Science 2004, 305, 236–239. [Google Scholar] [CrossRef] [PubMed]
- Bischoff, C.A.; Ferretti, A.; Novali, F.; Uttini, A.; Giannico, C.; Meloni, F. Nationwide Deformation Monitoring with SqueeSAR Using Sentinel-1 Data. In Proceedings of the Tenth International Symposium on Land Subsidence—Living with Subsidence, Delft, The Netherlands, 20–24 April 2020; pp. 31–37. [Google Scholar]
- Malinverni, E.S.; Sandwell, D.T.; Tassetti, A.N.; Cappelletti, L. InSAR Decorrelation to Assess and Prevent Volcanic Risk. Eur. J. Remote Sens. 2014, 47, 537–556. [Google Scholar] [CrossRef]
- Singh, P.; Diwakar, M.; Shankar, A.; Shree, R.; Kumar, M. A Review on SAR Image and its Despeckling. Arch. Comput. Methods Eng. 2021, 28, 4633–4653. [Google Scholar] [CrossRef]
- Ye, X.; Zhu, H.H.; Wang, J.; Zhang, Q.; Shi, B.; Schenato, L.; Pasuto, A. Subsurface Multi-Physical Monitoring of a Reservoir Landslide with the Fiber-Optic Nerve System. Geophys. Res. Lett. 2022, 49, e2022GL098211. [Google Scholar] [CrossRef]
- Chaussard, E.; Amelung, F.; Abidin, H.; Hong, S.-H. Sinking Cities in Indonesia: ALOS PALSAR Detects Rapid Subsidence Due to Groundwater and Gas Extraction. Remote Sens. Environ. 2013, 128, 150–161. [Google Scholar] [CrossRef]
- Casu, F.; Bonano, M.; De Luca, C.; Lanari, R.; Manunta, M.; Manzo, M.; Zinno, I. National Scale Surface Displacements Mapped via the P-SBAS DInSAR Processing of Sentinel-1 Data. In Proceedings of the EUSAR 2018—12th European Conference on Synthetic Aperture Radar, Aachen, Germany, 4–7 June 2018; VDE: Frankfurt, Germany, 2018; pp. 1–3. [Google Scholar]
- Sandwell, D.T.; Price, E.J. Phase Gradient Approach to Stacking Interferograms. J. Geophys. Res. 1998, 103, 30183–30204. [Google Scholar] [CrossRef]
- Wang, Y.; Feng, G.; Li, Z.; Luo, S.; Wang, H.; Xiong, Z.; Zhu, J.; Hu, J. A Strategy for Variable-Scale InSAR Deformation Monitoring in a Wide Area: A Case Study in the Turpan–Hami Basin, China. Remote Sens. 2022, 14, 3832. [Google Scholar] [CrossRef]
- Fang, K.; Dong, A.; Tang, H.; An, P.; Wang, Q.; Jia, S.; Zhang, B. Development of an easy-assembly and low-cost multismartphone photogrammetric monitoring system for rock slope hazards. Int. J. Rock Mech. Min. Sci. 2024, 174, 105655. [Google Scholar] [CrossRef]
- Yu, C.; Li, Z.; Penna, N.T. Interferometric Synthetic Aperture Radar Atmospheric Correction Using a GPS-based Iterative Trop-ospheric Decomposition Model. Remote Sens. Environ. 2018, 204, 109–121. [Google Scholar] [CrossRef]
- Bamler, R.; Just, D. Phase statistics and decorrelation in SAR interferograms. In Proceedings of the International Geoscience and Remote Sensing Symposium: Better Understanding of Earth Environment (IGARSS ′93), Tokyo, Japan, 18–21 August 1993; pp. 980–984. [Google Scholar]
- Xiao, L. Study of Protection of Karez in Xinjiang from the Perspective of Ecological Civilization Construction. Master’s Thesis, Beijing Forestry University, Beijing, China, 2019. [Google Scholar]
- Ye, K. The Water Quantity Monitoring of Karez and Rational Utilization of Water Resources in Turpan. Master’s Thesis, Jilin University, Changchun, China, 2016. [Google Scholar]
- Rebiyamu, M. Study on the Relationship between the Karez and Turpan Oasis Ecological Environment. Master’s Thesis, Xin-jiang University, Urumqi, China, 2014. [Google Scholar]
- Samsonov, S.V.; Feng, W.; Peltier, A.; Geirsson, H.; D’oreye, N.; Tiampo, K.F. Multidimensional Small Baseline Subset (MSBAS) for volcano monitoring in two dimensions: Opportunities and challenges. Case study Piton de la Fournaise volcano. J. Volcanol. Geotherm. Res. 2017, 344, 121–138. [Google Scholar] [CrossRef]
- Xue, F.; Lv, X.; Dou, F.; Yun, Y. A Review of Time-Series Interferometric SAR Techniques: A Tutorial for Surface Deformation Analysis. IEEE Geosci. Remote Sens. Mag. 2020, 8, 22–42. [Google Scholar] [CrossRef]
- Bateson, L.; Cigna, F.; Boon, D.; Sowter, A. The Application of the Intermittent SBAS (ISBAS) InSAR Method to the South Wales Coalfield, UK. Int. J. Appl. Earth Obs. Geoinf. 2015, 34, 249–257. [Google Scholar] [CrossRef]
- Béjar-Pizarro, M.; Socquet, A.; Armijo, R.; Carrizo, D.; Genrich, J.; Simons, M. Andean Structural Control on Interseismic Coupling in the North Chile Subduction Zone. Nat. Geosci. 2013, 6, 462–467. [Google Scholar] [CrossRef]
- Ge, D.; Ling, Z.; Yan, W.; Guo, X.; Ye, X. Merging multi-track PSI result for land subsidence mapping over very extended area. In Proceedings of the 2010 IEEE International Geoscience and Remote Sensing Symposium, Honolulu, HI, USA, 25–30 July 2010. [Google Scholar]
- Ferretti, A.; Novali, F.; Giannico, C.; Uttini, A.; Iannicella, I.; Mizuno, T. A Squeesar Database Over the Entire Japanese Territory. In Proceedings of the IGARSS 2019—2019 IEEE International Geoscience and Remote Sensing Symposium, Yokohama, Japan, 28 July–2 August 2019. [Google Scholar]
- Wang, B.; Zhao, C.; Zhang, Q.; Peng, M. Sequential InSAR Time Series Deformation Monitoring of Land Subsidence and Re-bound in Xi’an, China. Remote Sens. 2019, 11, 2854. [Google Scholar] [CrossRef]
- Ouchi, K. Recent Trend and Advance of Synthetic Aperture Radar with Selected Topics. Remote Sens. 2013, 5, 716–807. [Google Scholar] [CrossRef]
- Wu, P.C.; Wei, M.; D’Hondt, S. Subsidence in coastal cities throughout the world observed by InSAR. Geophys. Res. Lett. 2022, 49, e2022GL098477. [Google Scholar] [CrossRef]
- Alatza, S.; Loupasakis, C.; Apostolakis, A.; Tzouvaras, M.; Themistocleous, K.; Kontoes, C.; Danezis, C.; Hadjimitsis, D.G. Surface Displacements Monitoring in Cyprus via InSAR and Field Investigation: The Case Studies of Pyrgos-Parekklisia and Pedoulas Villages. Remote Sens. 2024, 16, 960. [Google Scholar] [CrossRef]
- Berardino, P.; Fornaro, G.; Lanari, R.; Sansosti, E. A New Algorithm for Surface Deformation Monitoring Based on Small Baseline Differential SAR Interferograms. IEEE Trans. Geosci. Remote Sens. 2002, 40, 2375–2383. [Google Scholar] [CrossRef]
- Samsonov, S.; D’Oreye, N. Multidimensional time-series analysis of ground deformation from multiple InSAR data sets applied to Virunga Volcanic Province. Geophys. J. Int. 2012, 191, 1095–1108. [Google Scholar] [CrossRef]
- Jiyuan, L.; Mingliang, L.; Xiangzheng, D.; Dafang, Z.; Zengxiang, Z.; Di, L. The land use and land cover change database and its relative studies in China. J. Geogr. Sci. 2002, 12, 275–282. [Google Scholar] [CrossRef]
Disclaimer/Publisher’s Note: The statements, opinions and data contained in all publications are solely those of the individual author(s) and contributor(s) and not of MDPI and/or the editor(s). MDPI and/or the editor(s) disclaim responsibility for any injury to people or property resulting from any ideas, methods, instructions or products referred to in the content. |
© 2024 by the authors. Licensee MDPI, Basel, Switzerland. This article is an open access article distributed under the terms and conditions of the Creative Commons Attribution (CC BY) license (https://creativecommons.org/licenses/by/4.0/).