Article

Comprehensive Assessment and Analysis of the Current Global Aerosol Optical Depth Products

1
School of Geography and Environmental Sciences, Northwest Normal University, 967 Anning East Road, Lanzhou 730070, China
2
Key Laboratory of Remote Sensing of Gansu Province, Heihe Remote Sensing Experimental Research Station, Northwest Institute of Eco-Environment and Resources, Chinese Academy of Sciences, Lanzhou 730000, China
3
College of Earth and Environmental Sciences, Lanzhou University, Lanzhou 730000, China
*
Author to whom correspondence should be addressed.
These authors contributed equally to this work.
Remote Sens. 2024, 16(8), 1425; https://doi.org/10.3390/rs16081425
Submission received: 15 March 2024 / Revised: 12 April 2024 / Accepted: 13 April 2024 / Published: 17 April 2024

Abstract

:
Aerosol Optical Depth (AOD) is one of the most important optical properties of aerosols that may affect the energy budgets of our Earth–atmosphere system significantly. Currently, while regional and even global AOD knowledge has been given by various satellites or models, these products are still fraught with uncertainties. In this study, one sophisticated satellite-derived AOD product from MODIS (MODerate resolution Imaging Spectral-radiometer) and two state-of-the-art model-based AOD products from CAMS (Copernicus Atmosphere Monitoring Service) and MERRA-2 (Modern-Era Retrospective analysis for Research and Application Version 2), based on AERONET measurements from 2000–2022, analyzed the spatial distribution characteristics of global AOD. Then using the Mann-Kendall (MK) trend test, the AOD changing trends revealed by the three products were also computed and analyzed. The accuracies of these products and the reliabilities of changing trends derived are discussed and concluded finally. Our study demonstrates that MODIS products have wider applicability, matching best with AERONET globally, while CAMS and MERRA-2 products are only reliable in North America, South America, and Europe. Through comparative analysis of the AOD trends, we found that MODIS, CAMS, and MERRA-2 AOD consistently exhibited decreasing trends in eastern Asia, Europe, and eastern North America. On the other hand, different products showed increasing trends in regions like West Asia, South Asia, and South Africa, suggesting their limited reliability. The reliability assessment shows that 41.45% of the areas have consistent trends among the three products, with approximately 3.2% showing significant and consistent results. When using site trend validation, the proportions of sites with consistent trends are highest at 64.56% and 46.84% respectively. The regions with the best reliability of global trend changes are mainly distributed in North America, Europe, Australia, eastern Asia, and Central South America. This study provides new insights for validating aerosol changes using remote sensing and has the potential to enhance future monitoring and evaluation methods of aerosol products.

Graphical Abstract

1. Introduction

Aerosols are small particles suspended in the atmosphere, including dust, smoke, solid particulate matter, liquid droplets, et al. [1]. Aerosols can absorb/scatter incoming solar radiation, reducing the amount of energy reaching the Earth’s surface and altering the transmission and composition of solar radiation [2]. This, in turn, affects weather systems, including atmospheric convection [3], radiative balance, temperature distribution, and rainfall patterns [4]. At the same time, aerosol–planetary boundary layer (PBL) interaction has been proposed as a key mechanism for stabilizing the atmosphere and exacerbating surface air pollution [5]. Therefore, accurate monitoring of aerosol spatial distribution and temporal dynamics is very crucial for understanding our climate system.
Aerosol Optical Depth (AOD) is defined as the total extinction coefficient caused by aerosol scattering and absorption in one atmospheric column [6] and can serve as a widely used proxy of aerosol concentration [7]. Currently, various global AOD products exist, such as MODIS, MISR, CALIOP, AERONET, OMI, MERRA-2, CAMS, CFSR, and others [8,9]. Evaluating the accuracy of aerosol products is essential for precise aerosol radiative forcing analysis and forecasting. The global AOD products can be classified into two categories based on data sources: remote sensing AOD products and reanalysis AOD products. Remote sensing AOD products usually have a high spatial resolution and can be summarized on a multi-temporal scale [10,11] but contain numerous spatial and temporal data gaps due to cloud contamination [12]. AOD reanalysis products have coarse spatial resolutions, but they are spatially and temporally continuous [13].
In addition to these AOD products, AERONET (AErosol RObotic NETwork), a global network for measuring atmospheric aerosol properties, provides in situ observed AOD at sites distributed globally. This product is commonly used as ground truth to validate both remote sensing AOD products and reanalysis AOD products. For instance, some scholars’ assessments of MODIS AOD and MERRA-2 AOD in China have revealed similar accuracy [14,15]. The accuracy of various AOD products has also been validated across diverse regions, including the Mediterranean Sea, Black Sea, Turkey, Asia, and others [16,17]. Additionally, some researchers have evaluated AOD accuracy in different seasons or between urban and non-urban areas [18]. While these validation efforts primarily focus on assessing the accuracy of AOD quantities, they consistently highlight the uncertainties associated with these AOD products, which exhibit variations across different regions and seasons. However, the performance of AOD in detecting long-term trends, and how uncertainties in AOD products influence their long-term trend detection, remain unclear and have been rarely validated against ground observations.
The existing literature mainly focuses on the assessment of remote sensing data accuracy in specific regions such as Asia, the Mediterranean, the Black Sea, and South Korea. However, there is limited research evaluating the accuracy of remote sensing products at a global scale, and the types of remote sensing products involved are still not comprehensive, with relatively short time series. Therefore, the primary objective of this study was to evaluate the reliability of three widely used AOD products in detecting long-term trends. The selected AOD products include MODIS (2000–2022) as a representative remote sensing product and CAMS (2002–2022) and MERRA-2 (2000–2022) as representatives of reanalysis products. The assessment process involved two main steps. Firstly, the accuracy of MODIS, CAMS, and MERRA-2 AOD compared to AERONET AOD was assessed using accuracy statistical metrics. Secondly, the long-term trends of MODIS, CAMS, and MERRA-2 AOD were validated against long-term trends of in situ AOD products, and the reliability of trend detection from the three products was evaluated.

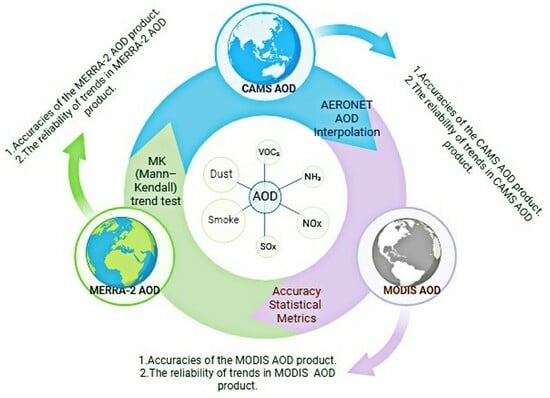
2. Datasets and Methods

2.1. Global AOD Products

The remote sensing-based Aerosol Optical Depth (AOD) product utilized in this study is the MCD19A2 Version 6 data product [19,20]. It is a gridded Level 2 product generated daily and monthly at a 1 km spatial resolution, derived from the Moderate Resolution Imaging Spectroradiometer (MODIS) Terra and Aqua combined Multi-angle Implementation of Atmospheric Correction (MAIAC) AOD.
Modern-Era Retrospective analysis for Research and Application version-2 (MERRA-2) is an AOD dataset developed by NASA in recent years (https://gmao.gsfc.nasa.gov/, accessed 15 May 2023). The MERRA-2 aerosol reanalysis product incorporates the assimilation of multiple data products, such as MODIS, AMSU, CERES and OMI and so on [21,22]. Covering the period from 1980 to the present, the dataset has a temporal resolution of 1 day and a spatial resolution of 0.5° × 0.625° [23,24].
The AOD product (https://ads.atmosphere.copernicus.eu/, 15 June 2023) from the Copernicus Atmosphere Monitoring Service (CAMS) reanalysis [25] is also evaluated in this work. CAMS assimilates a range of remote sensing products, primarily satellites such as MODIS, AIRS, OMI, as well as atmospheric composition observational data from ground-based monitoring stations. This product, initiated in 2003, features a temporal resolution of 1 h and a spatial resolution of 0.75° × 0.75° [26].

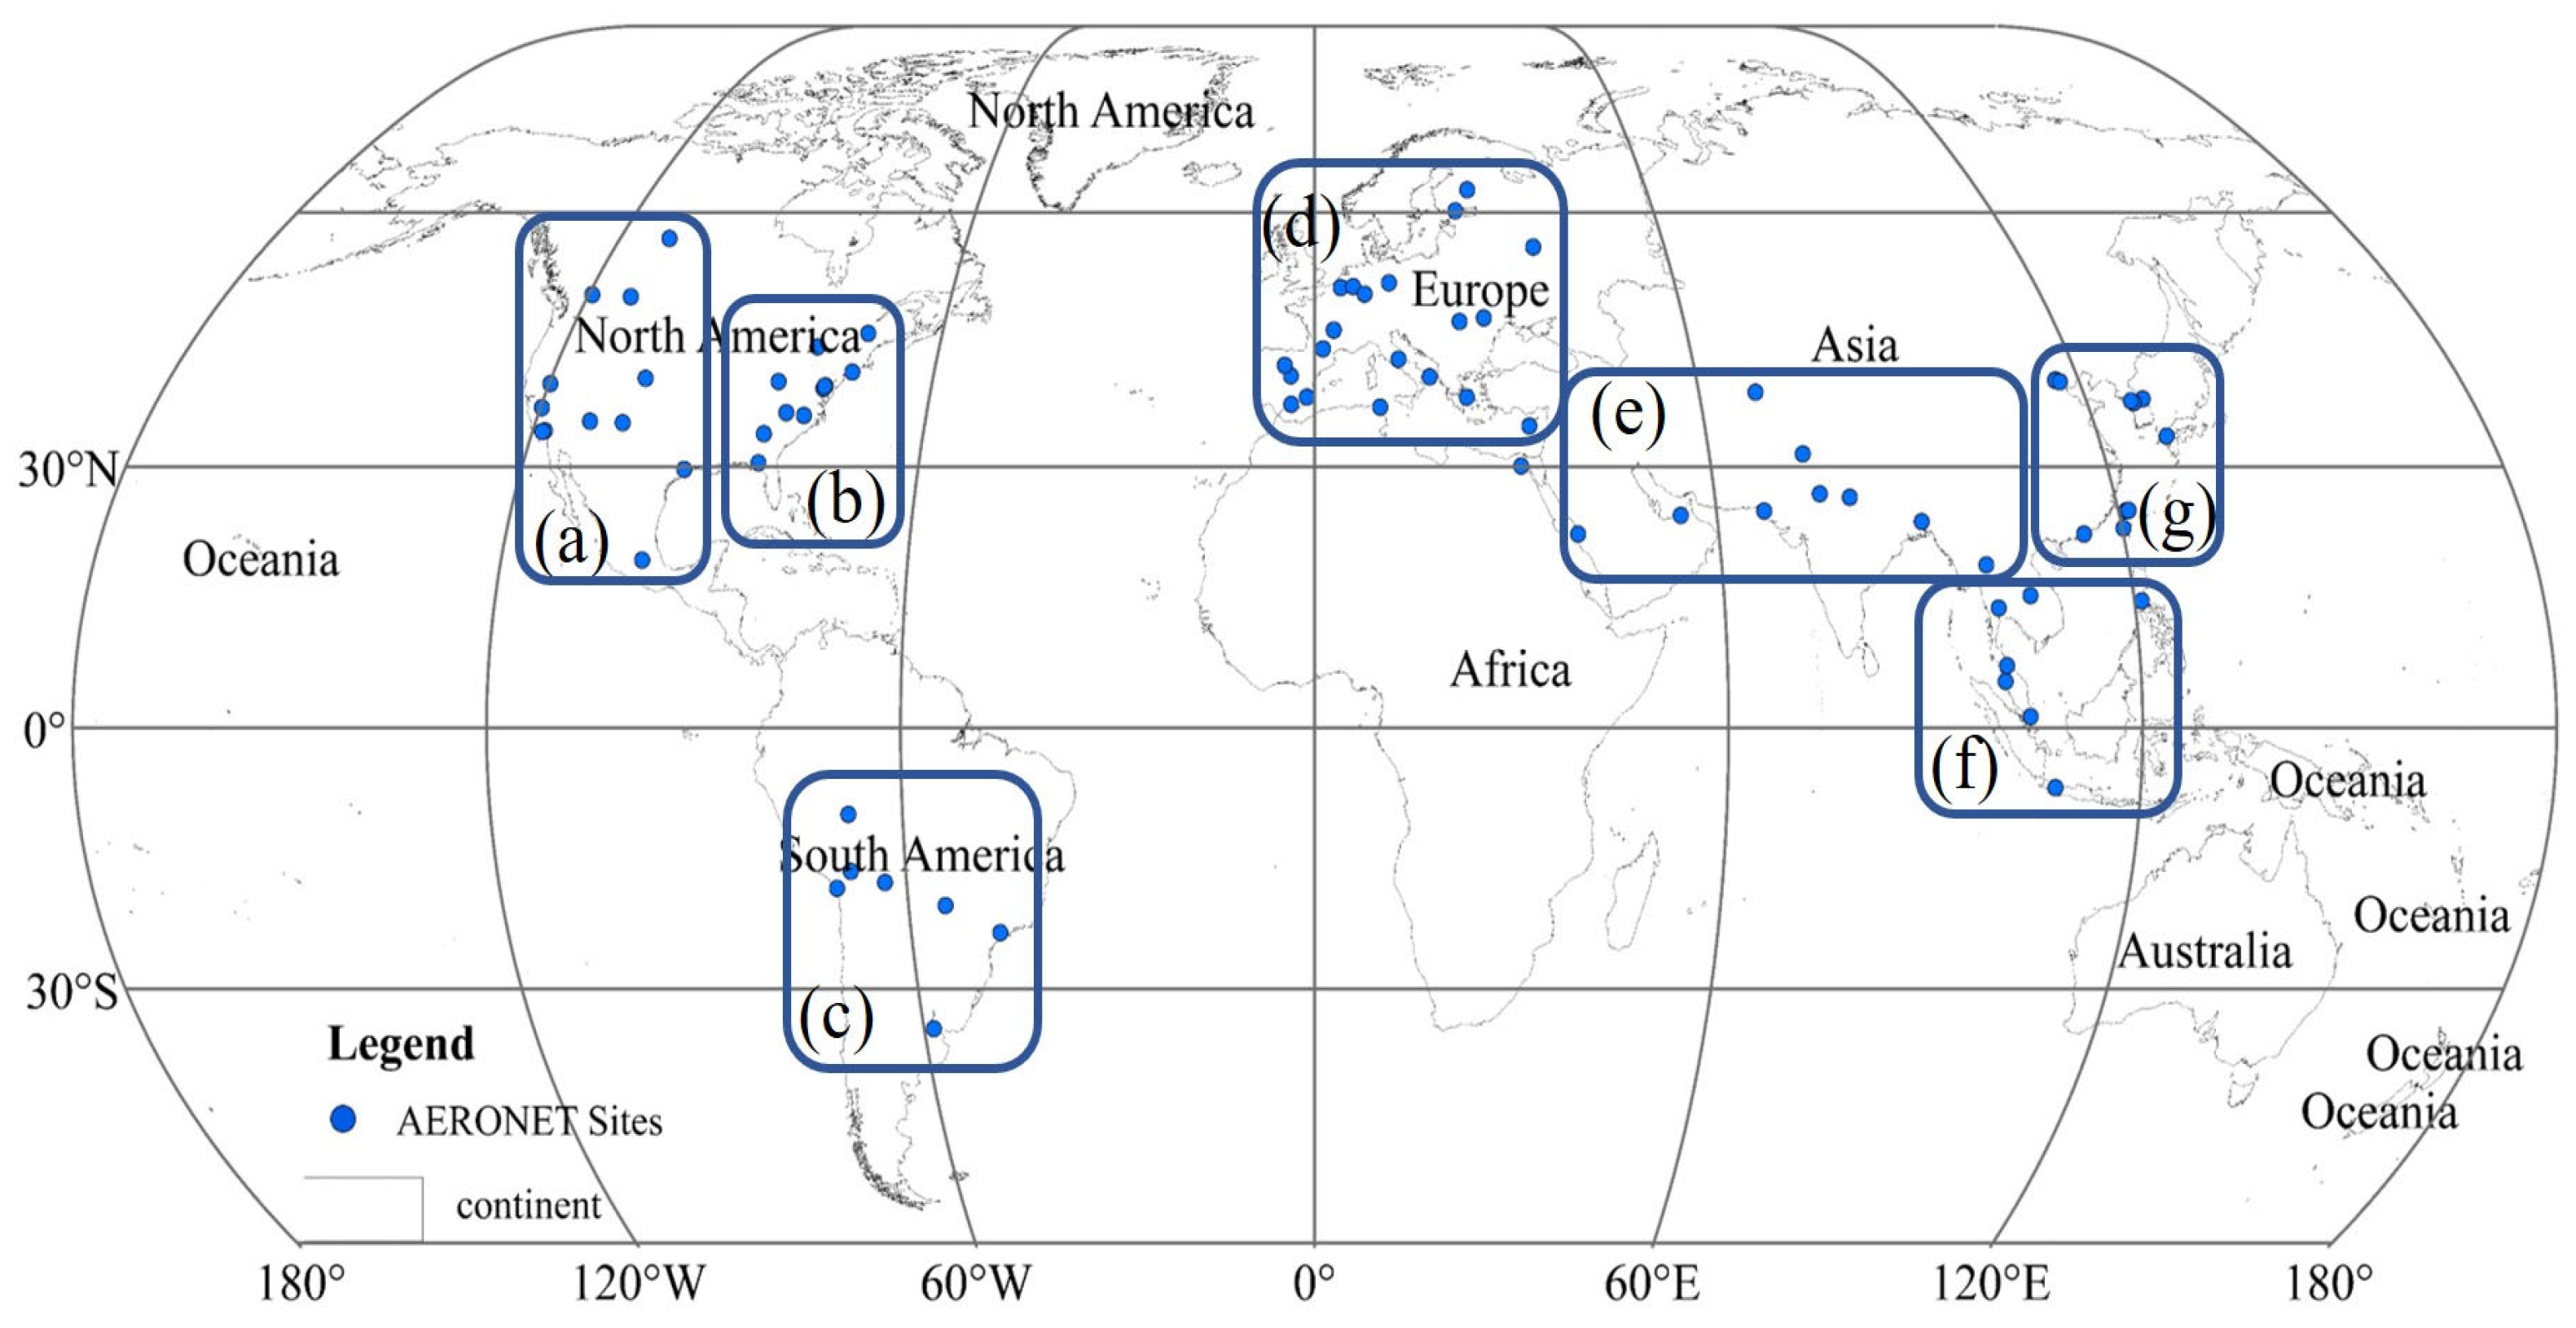
2.2. AERONET Observation

The AErosol RObotic NETwork (AERONET) is a ground-based automatic aerosol observation network (https://aeronet.gsfc.nasa.gov/, accessed 5 March 2023) jointly established by NASA and the French National Center for Scientific Research. It monitors relevant aerosol parameters at numerous sites established in major regions worldwide [25,27]. Due to the high accuracy of AERONET observation data [28], many studies have used observed values as the ground truth for verifying and assessing the accuracy of AOD products [29].
In this study, to assess the long-term trends of AOD products, only sites with Level 2 aerosol optical parameter data records exceeding 8 years were considered. A total of 79 sites were selected, and their spatial distribution is illustrated in Figure A1. The selected sites were further categorized into 7 subregions based on their geographical locations following the partitioning method employed by previous studies [30]. The sites were classified by continent into Western North America (WNA), Eastern North America (ENA), South America (SAM), Europe (EU), Central, South, and West Asia (CSWA), Southeast Asia (SEA), and East Asia (EAS). The partitioned site names and the number of sites in each partition are presented in Table A1.

2.3. AERONET AOD Interpolation

The AERONET ground-based AOD observations are not measured at the same wavelength as the AOD products. Therefore, ground-based AOD observations from AERONET sites were interpolated to AOD at 550 nm to match AOD products, combined with satellite overpass times and other matching criteria. In this study, AOD at 550 nm band was obtained by interpolating AOD at 440 nm and 870 nm using the following equation [31,32]:
τ λ , α = β × λ α
where τ λ , α is the AOD when the wavelength equals λ, α is the Ångström wavelength index, and β is the Ångström atmospheric turbidity coefficient. The wavelength index α can reflect the spectral distribution characteristics of aerosol particles. A higher α value indicates a larger number of smaller (or finer) aerosol particles.

2.4. Accuracy Statistical Metrics

AOD values from the three products are extracted based on the coordinates of AERONET site and the observation date. The quality of AOD was evaluated using expected error (EE). Various formulas exist for calculating EE for AOD products [12,33]. In this study, we considered various algorithms of MODIS data and selected the formula for calculating EE as follows:
±(0.05 + 0.15D)
where D is satellite data from the sites.
The statistic indices R2 (Coefficient of Determination), Relative Root Mean Square Error (RMSE), and Mean Absolute Error (MAE) were usually employed to quantify the accuracy of the AOD products against in situ observation in previous studies [34,35]. R2 ranges from 0 to 1, with 1 indicating perfect predictions and 0 indicating no predictive power. A smaller RMSE value signifies a better fit between satellite data and in situ observation data. Similarly, a smaller MAE value indicates a smaller average error between satellite data and in situ observation values.

2.5. Trend Analysis Methods

The MK (Mann–Kendall) trend test was utilized to detect the AOD temporal trends. MK (Mann–Kendall) trend test [36,37] is a non-parametric statistical test and is commonly employed to detect monotonic trends. It is particularly useful in fields like meteorology and hydrology for analyzing trends in time series data [38,39,40]. To assess the significance (p ≤ 0.05) of AOD trends, a hypothesis test using the Z-test was applied in this study, in order to calculate the regions where the global AOD shows significant changes.
To analyze the reliability of trend among different AOD products, the MK trend test method was initially employed to calculate the AOD trend for MODIS, CAMS, and MERRA-2. The specific characteristics of the trend at each site were determined. Overlay analysis was then utilized to identify areas of consistent and inconsistent changes. Furthermore, a comparative analysis of the reliability of annual and seasonal trend variations was conducted considering parameters such as R2.

3. Results

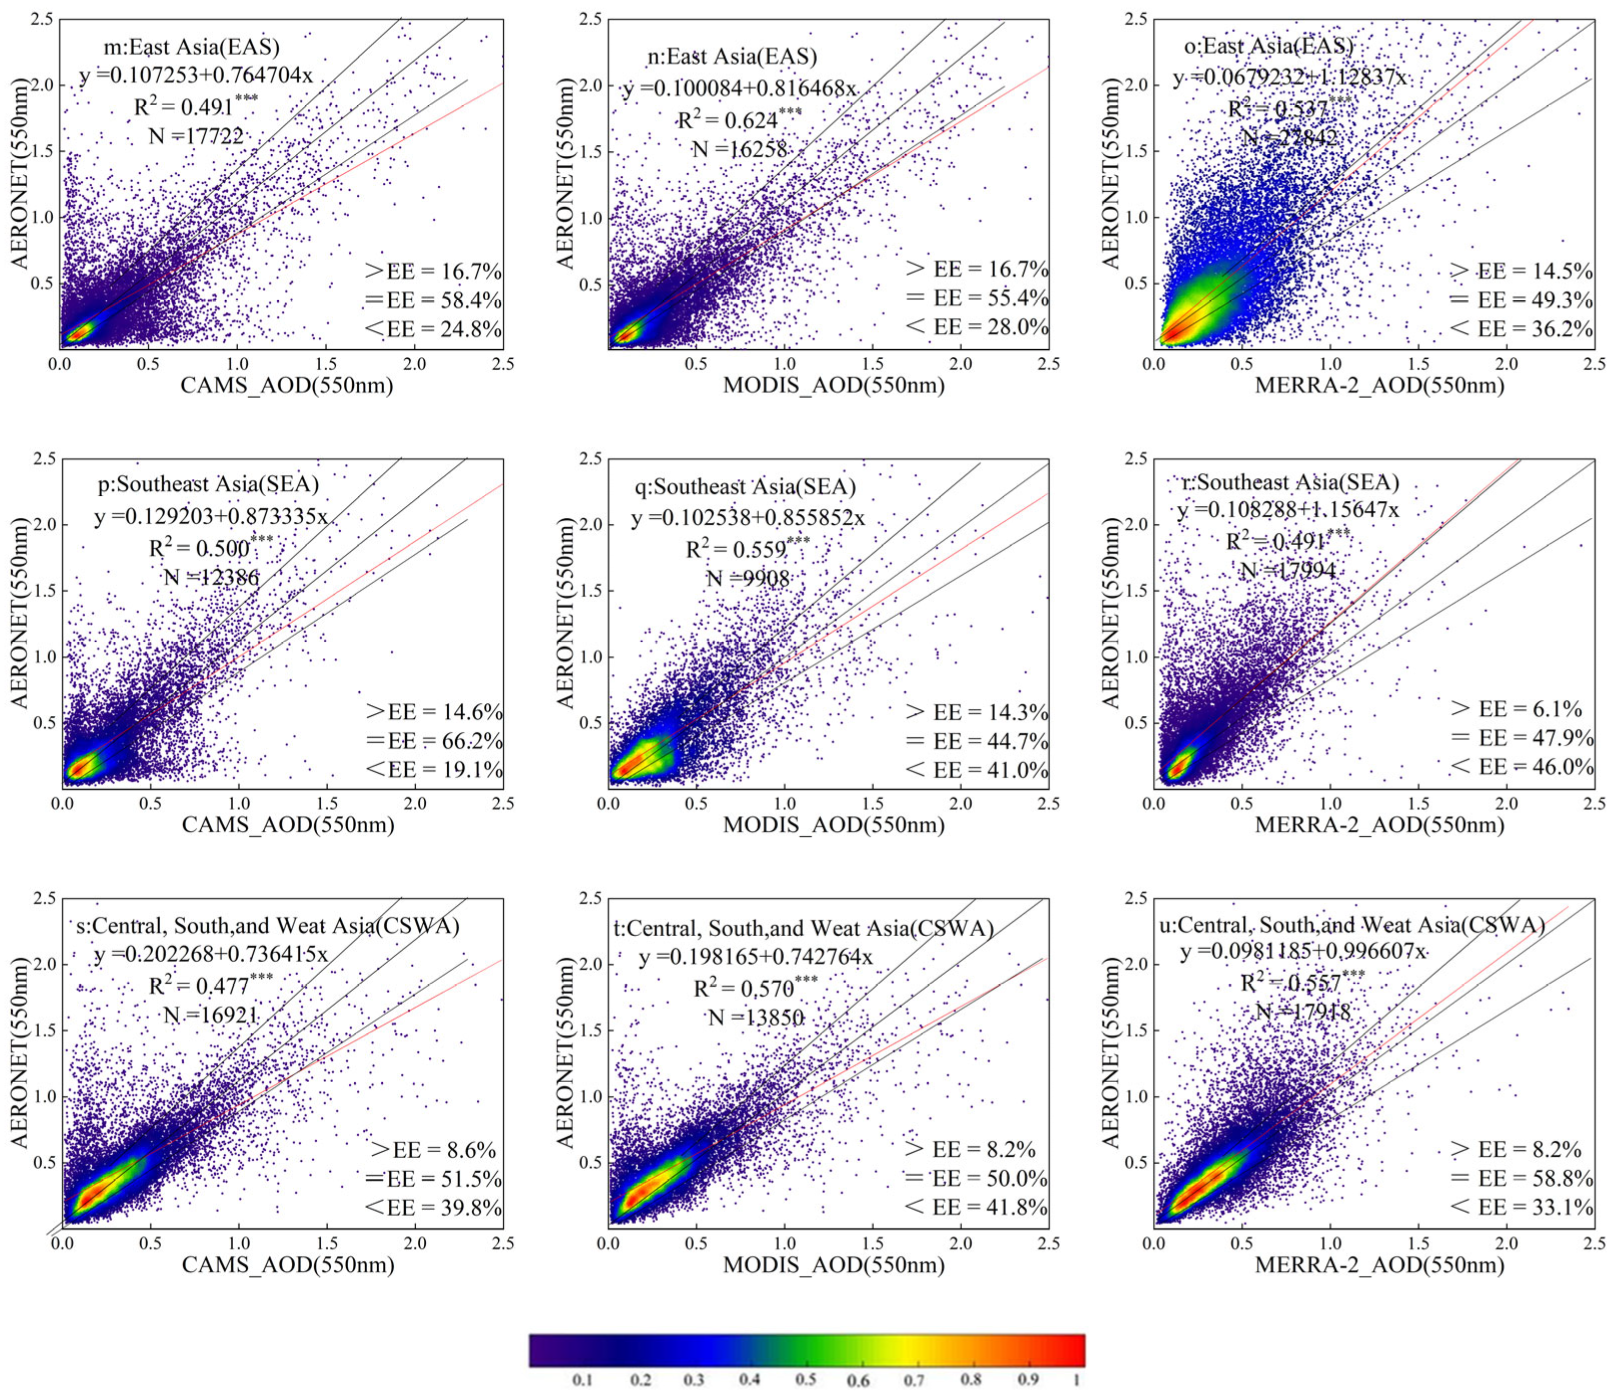
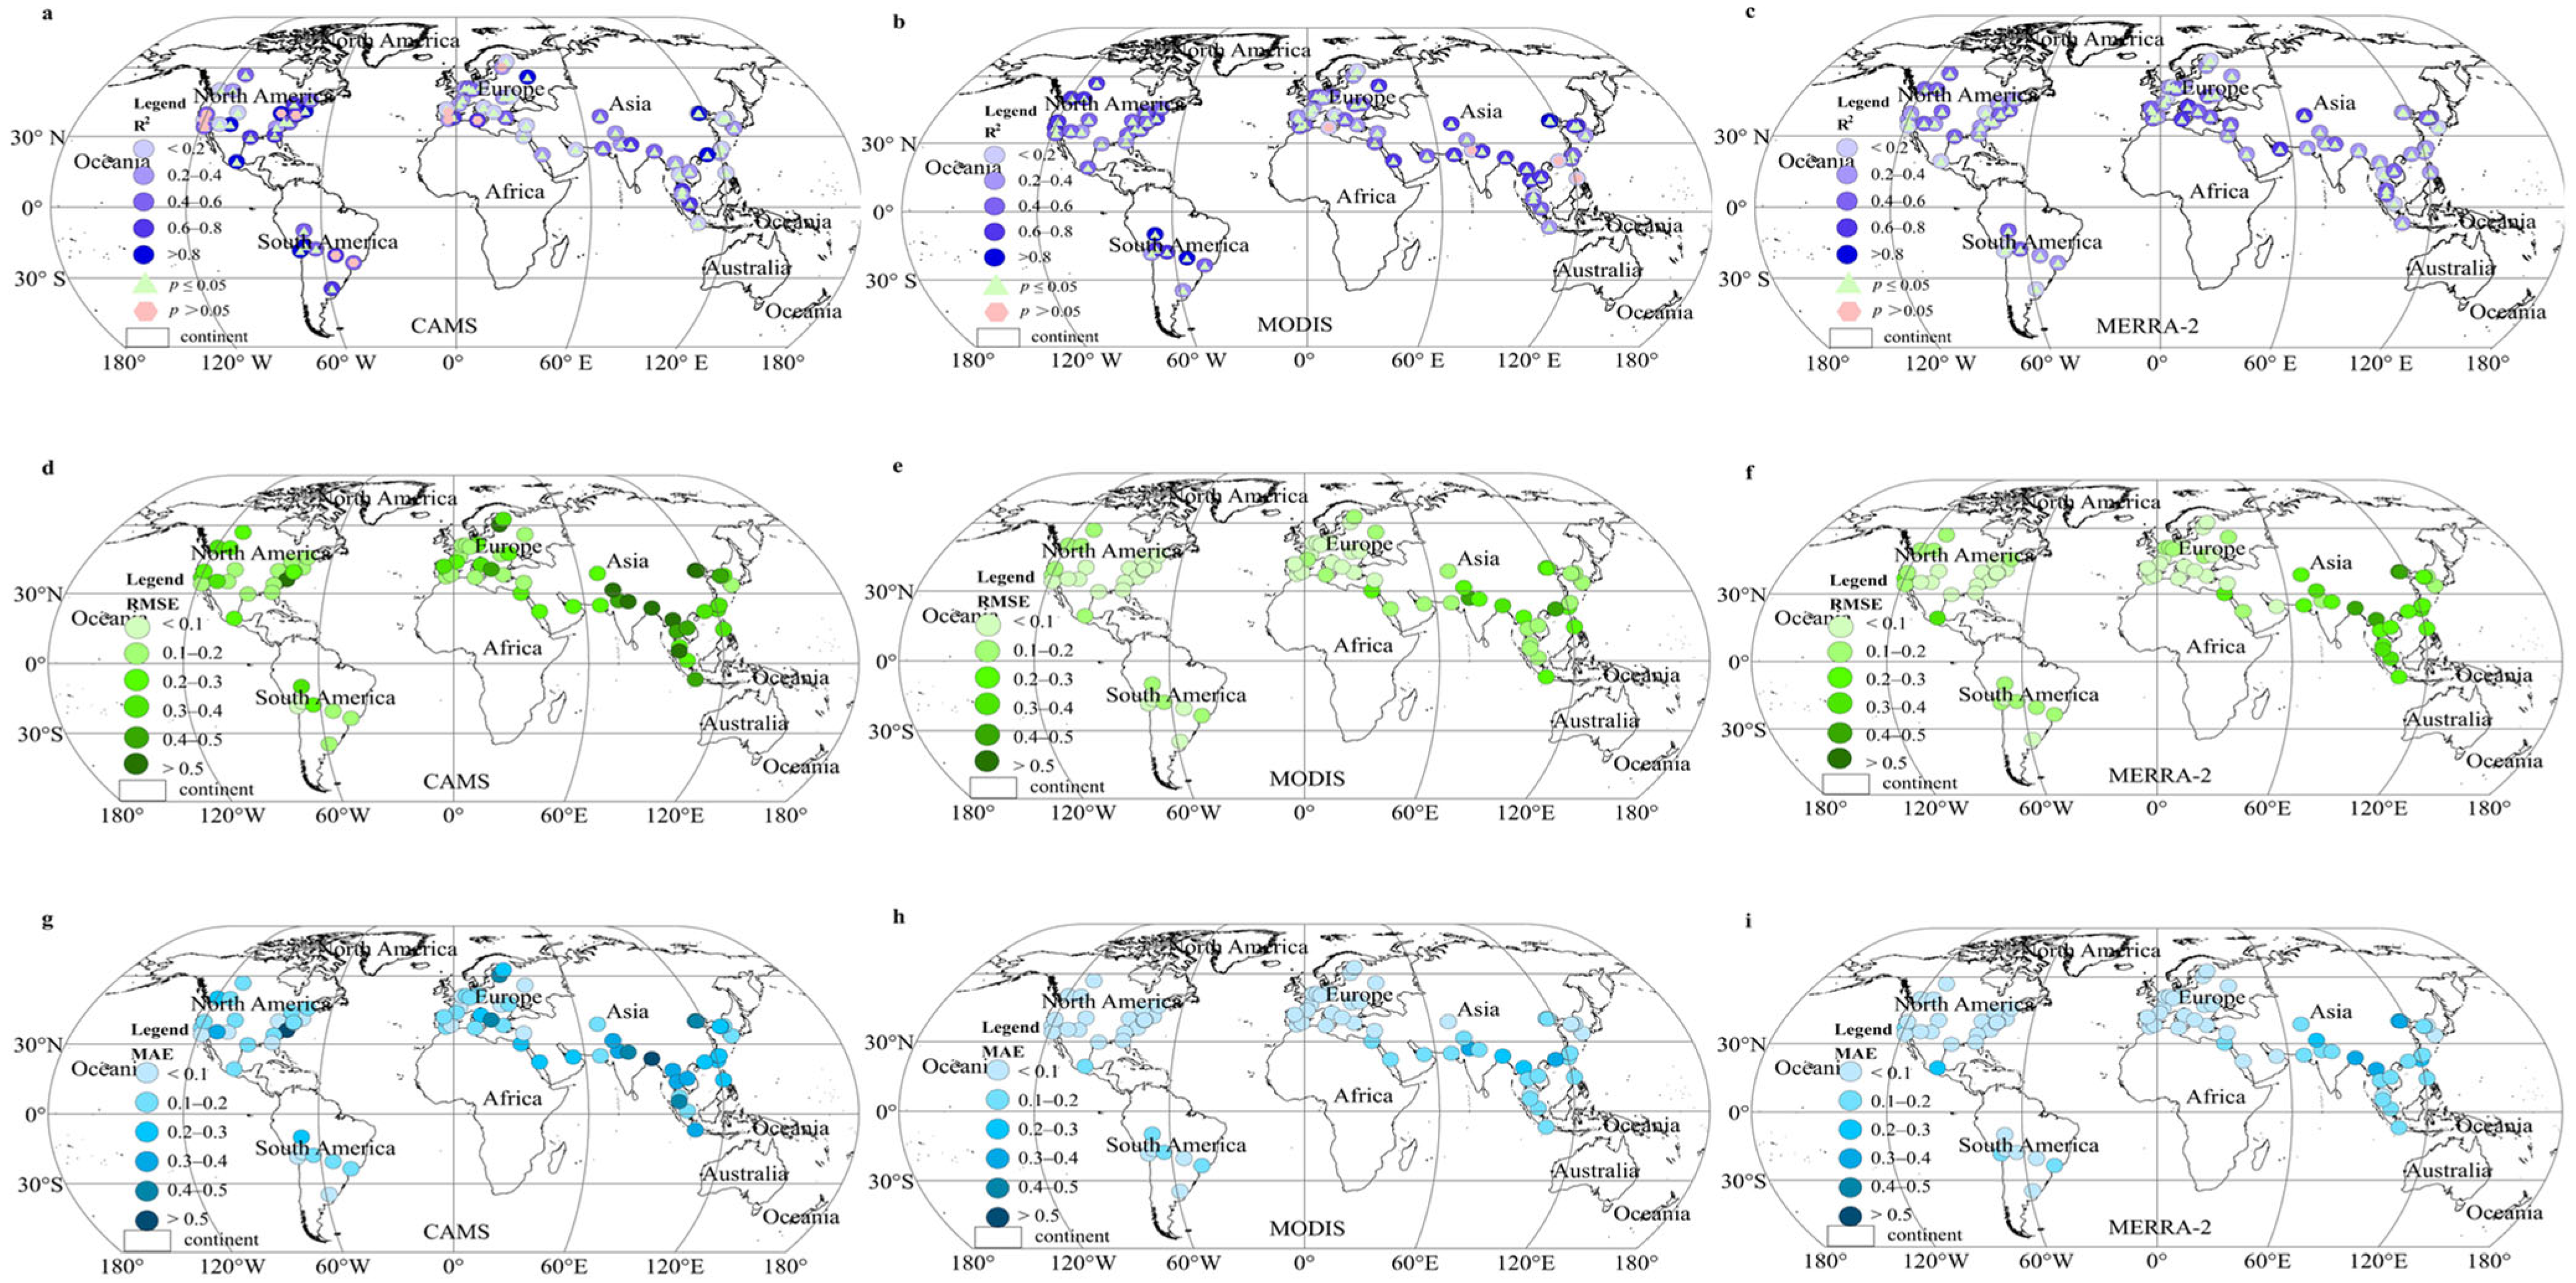
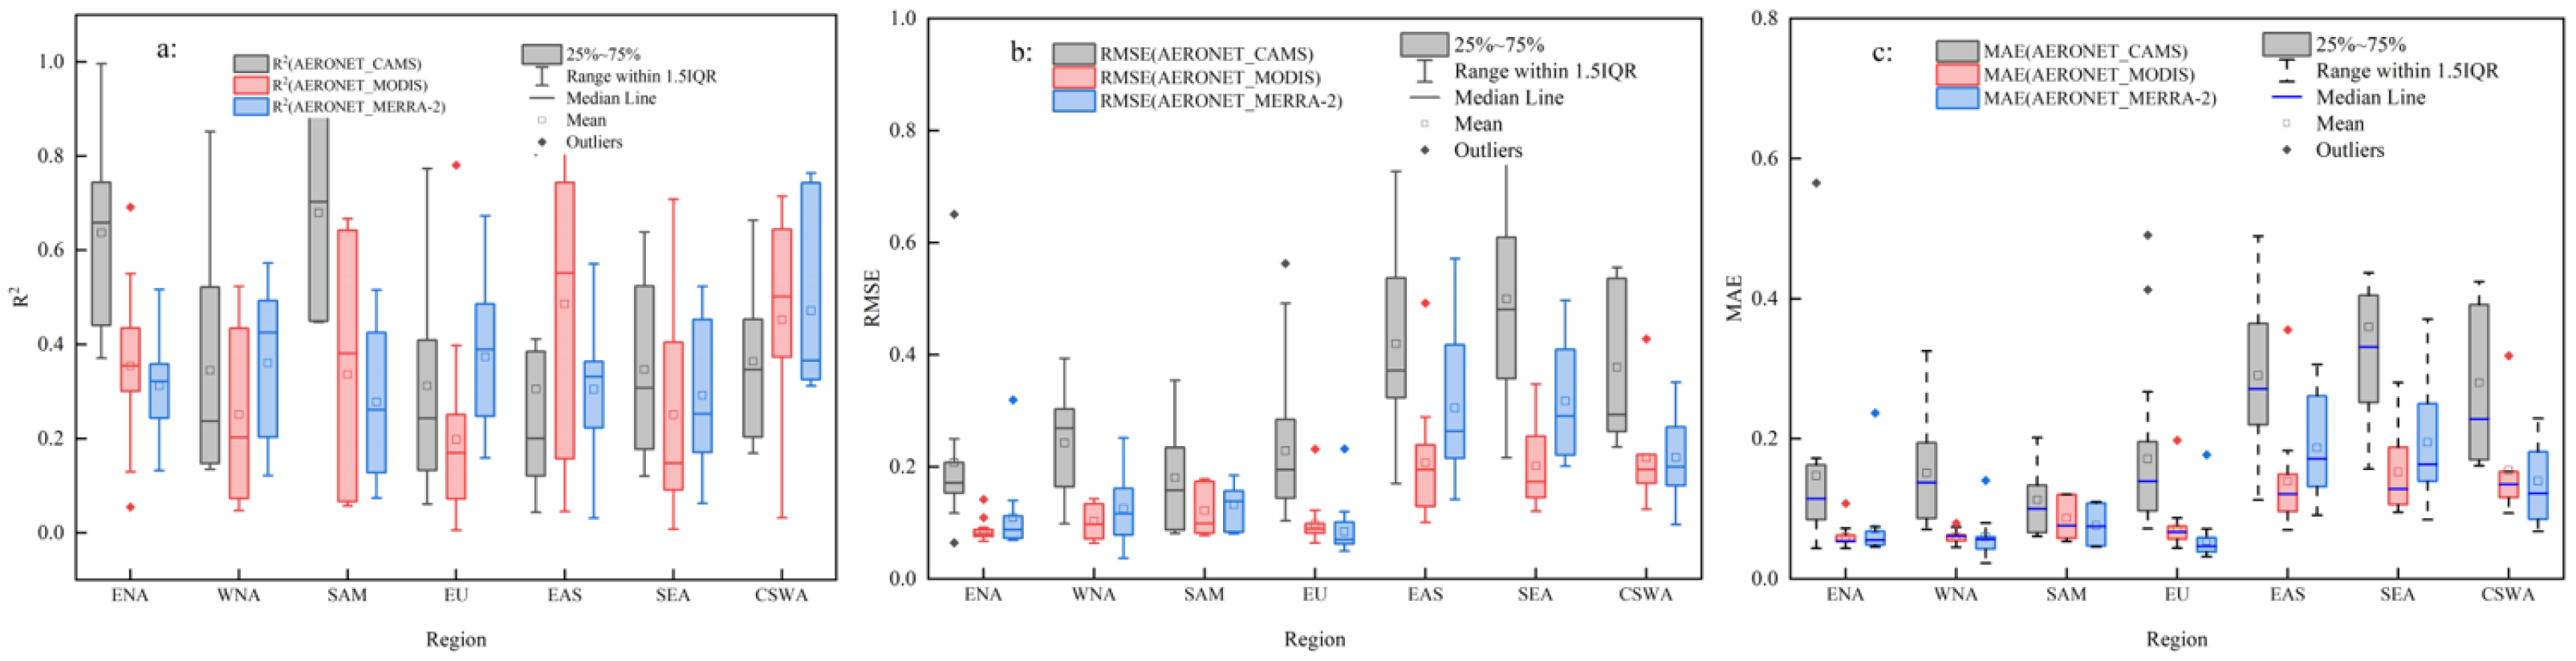
3.1. Accuracies of the Three AOD Products

The spatial distribution characteristics of CAMS, MODIS, and MERRA-2 AOD over global land areas from 2000 to 2022 are illustrated in Figure 1. In the CAMS AOD product (Figure 1a), the high-value area of annual (the average level of AOD values during the years 2000–2022) average AOD (>0.6) values were mainly distributed in eastern East Asia and northeastern South Asia, while the median annual AOD (0.3–0.6) values were distributed in most parts of Africa, Western Asia, South Asia, and Southeast Asia. Low annual AOD values (<0.3) were distributed in South America, Europe, Australia, Oceania, northern Asia, and most parts of North America. In the MODIS AOD product (Figure 1d), the high-value areas (>0.6) of annual mean AOD were mainly distributed in East Asia, South Asia, and some regions in central and western Africa. Low AOD values (<0.3) were distributed in North America, South America, Europe, Australia, and Oceania. For MERRA-2 AOD (Figure 1g), the high-value areas (>0.6) of annual mean AOD were only distributed in the southeastern part of East Asia, the border region between South Asia and East Asia, and the central part of Africa. The median AOD (0.3–0.6) values were distributed in most parts of Africa, Western Asia, East Asia, South Asia, and Southeast Asia. Low AOD values (<0.3) were distributed in North America, South America, Europe, Australia, Oceania, northern Asia, and the southeastern part of South Africa. CAMS, MODIS, and MERRA-2 AODs exhibited consistent distribution patterns of high AOD values (>0.6) in the eastern part of East Asia and the northeastern part of South Asia, as well as similar distribution of low AOD values (<0.3) in North America and South America. The distribution of the median AOD range (0.3–0.6) was similar between CAMS and MERRA-2 AOD, while the MODIS AOD showed a smaller area in the median AOD range (0.3–0.6). The high-value area (>0.6) of the CAMS AOD was greater compared to the MODIS AOD.
The three products exhibited a consistent latitudinal variation pattern (Figure 1b,e,h). The maximum values of the three AOD products were centered around 20°N, gradually decreasing towards the north and south. For the CAMS AOD (Figure 1b), the high values appeared between 20°S and 45°N. For the MODIS AOD (Figure 1e), the high AOD values appeared between 15°S and 40°N. Similarly, for the MERRA-2 AOD (Figure 1h), the areas with high AOD values also appeared between 15°S and 40°N. The average value of the CAMS AOD (Figure 1c) was 0.175, with approximately 15% of the AOD annual mean falling within the range of 0.3–0.6. Pixels with AOD values below 0.3 accounted for approximately 50% of the total pixels. The average value of the MODIS AOD (Figure 1f) was 0.112, with approximately 85% of the pixels having AOD values below 0.3, and the proportion of pixels with values exceeding 0.6 was around 2%. The annual average value of the MERRA-2 AOD (Figure 1i) was 0.144, with approximately 80% of AOD values below 0.3 and only 1% of the global total area exceeding 0.6.
From the spatial pattern of MODIS, CAMS, and MERRA-2 AOD products, it is evident that there are significant differences in AOD among different products. The accuracy of the CAMS, MODIS, and MERRA-2 AODs was assessed against in situ observations using statistical metrics. Generally, within the seven subregions, the three AOD products showed a strong correlation with the AERONET AOD product (Figure 2) but varied in different regions. The highest correlation of the CAMS AOD was observed in SEA (Figure 2p) with an R2 value of 0.500 (p ≤ 0.05). About 66.2% of the product data fall within the EE range, resulting in an overestimation of 14.6% compared to the AERONET AOD. For the MODIS AOD, the highest correlations were found in WNA (Figure 2e) and EAS (Figure 2n) with R2 values of 0.622 (p ≤ 0.05) and 0.624 (p ≤ 0.05). Around 66.9% and 55.4% of the products in these regions meet the acquirement of the EE, leading to overestimations of 22.3% and 16.7% compared to the AERONET AOD observation. The highest correlation of MERRA-2 AOD was observed in SAM (Figure 2i) with an R2 value of 0.700 (p ≤ 0.05). Approximately 69.0% of the product falls within the EE range, resulting in a 5.5% overestimation compared to the AERONET AOD. The MODIS AOD showed a higher correlation with distribution sites in ENA (Figure 2b), WNA (Figure 2e), EAS (Figure 2n), SEA (Figure 2q), and CSWA (Figure 2t) compared to the CAMS and MERRA-2 AODs. The R2 values for these subregions were 0.529 (p ≤ 0.05), 0.622 (p ≤ 0.05), 0.624 (p ≤ 0.05), and 0.570 (p ≤ 0.05); the percentage of the EE ranged from 44.7% to 71.0%. The highest and lowest values were observed in ENA (Figure 2b) and SEA (Figure 2q), resulting in overestimations of 15.5% and 14.3% compared to the AERONET AOD. In SEA (Figure 2q) and CSWA (Figure 2t), the MODIS AOD was underestimated by 41.0% and 41.8% compared to the AERONET AOD, indicating a significant underestimation. The MERRA-2 AOD demonstrated higher correlations with distribution sites in SAM (Figure 2i) and EU (Figure 2l) compared to the CAMS and MODIS AODs. The R2 values for these regions were 0.700 (p ≤ 0.05) and 0.578 (p ≤ 0.05). The products’ percentages of the EE were 69.0% and 80.0% for SAM (Figure 2i) and EU (Figure 2l), respectively, resulting in overestimations of 5.5% compared to the AERONET AOD. In terms of the CAMS and MODIS AODs, the R2 values in EU (Figure 2j,k) and SEA (Figure 2p,q) were similar, with values of 0.384 (p ≤ 0.05), 0.375 (p ≤ 0.05), 0.500 (p ≤ 0.05), and 0.514 (p ≤ 0.05), where the percentage of the EE ranged from 44.7% to 69.9%, and overestimations of 12.9%, 13.7%, 14.6%, and 14.3% compared to the AERONET AOD. Additionally, the correlation differences among the three remote sensing datasets in SEA (Figure 2p,q,r) were relatively small, with an average value of 0.501 (p ≤ 0.05).
It is evident that there are more sites with an R2 value greater than 0.6 in the CAMS AOD (Figure 3a) compared to MODIS (Figure 3b) and MERRA-2 (Figure 3c). Sites with an R2 value above 0.6 for the CAMS AOD were mainly distributed in North America, South America, and Europe. Sites with an R2 value above 0.6 for the MODIS AOD were primarily found in Asia, while sites with an R2 value above 0.6 for the MERRA-2 AOD were mainly concentrated in Europe. The RMSE values for the MODIS (Figure 3e) and MERRA-2 AODs (Figure 3f) were lower than those for CAMS (Figure 3d). The high RMSE value from the CAMS AOD was widely distributed in North America, Europe, and Asia, with particularly high values in the Asian region. The RMSEs for the MODIS and MERRA-2 AODs were similar and exhibited similar spatial distributions, with a low RMSE at some sites in Asia. The spatial patterns of the MAE value for the MODIS (Figure 3g) and MERRA-2 (Figure 3h) sites were consistent, with high MAE values found in Asia. There are only two sites with an MAE greater than 0.4. The MAE of the CAMS AOD (Figure 3i) was higher than the other two datasets.
According to Figure 4a, the CAMS AOD in ENA, SAM, and SEA exhibited the highest R2 values, while the MERRA-2 AOD in EU and WAS showed the highest R2 values. The R2 value for the CAMS AOD in ENA was slightly higher than for the MERRA-2 AOD. In ENA, SAM, and SEA, the R2 value for MODIS AOD was greater than for MERRA-2, whereas in WNA, EU, CSWA, and SWA, the R2 value for the MERRA-2 AOD was greater than for the MODIS AOD.
According to Figure 4b, in the ENA, WNA, EAS, and SEA regions, the ranking of RMSE values was CAMS > MERRA-2 > MODIS AOD. This indicated that the fit between the CAMS AOD and the AERONET AOD was the poorest, while the MODIS AOD exhibited the best fit with the AERONET AOD. In the SAM, EU, and CSWA regions, the CAMS AOD had the highest RMSE value, while the RMSE values of the MODIS and MERRA-2 AODs were similar. Therefore, in these regions, the CAMS AOD had the poorest fit with the AERONET AOD, while the MODIS and MERRA-2 AODs showed similar levels of agreement with the AERONET AOD.
According to Figure 4c, the CAMS AOD had the highest MAE values in each subregion, indicating the largest errors between the CAMS AOD and the AERONET AOD. In the ENA region, the median and mean values of the MODIS and MERRA-2 AOD MAEs were similar, suggesting similar differences between the MODIS and MERRA-2 AODs and the AERONET AOD. In the WNA, SAM, and EU regions, the MODIS AOD had a higher MAE than the MERRA-2 AOD, indicating that the MERRA-2 AOD had smaller errors compared to the AERONET AOD. In the EAS, SEA, and CSWA regions, the MODIS AOD had a lower MAE than the MERRA-2 AOD, indicating that the MODIS AOD had smaller errors in the Asian regions.

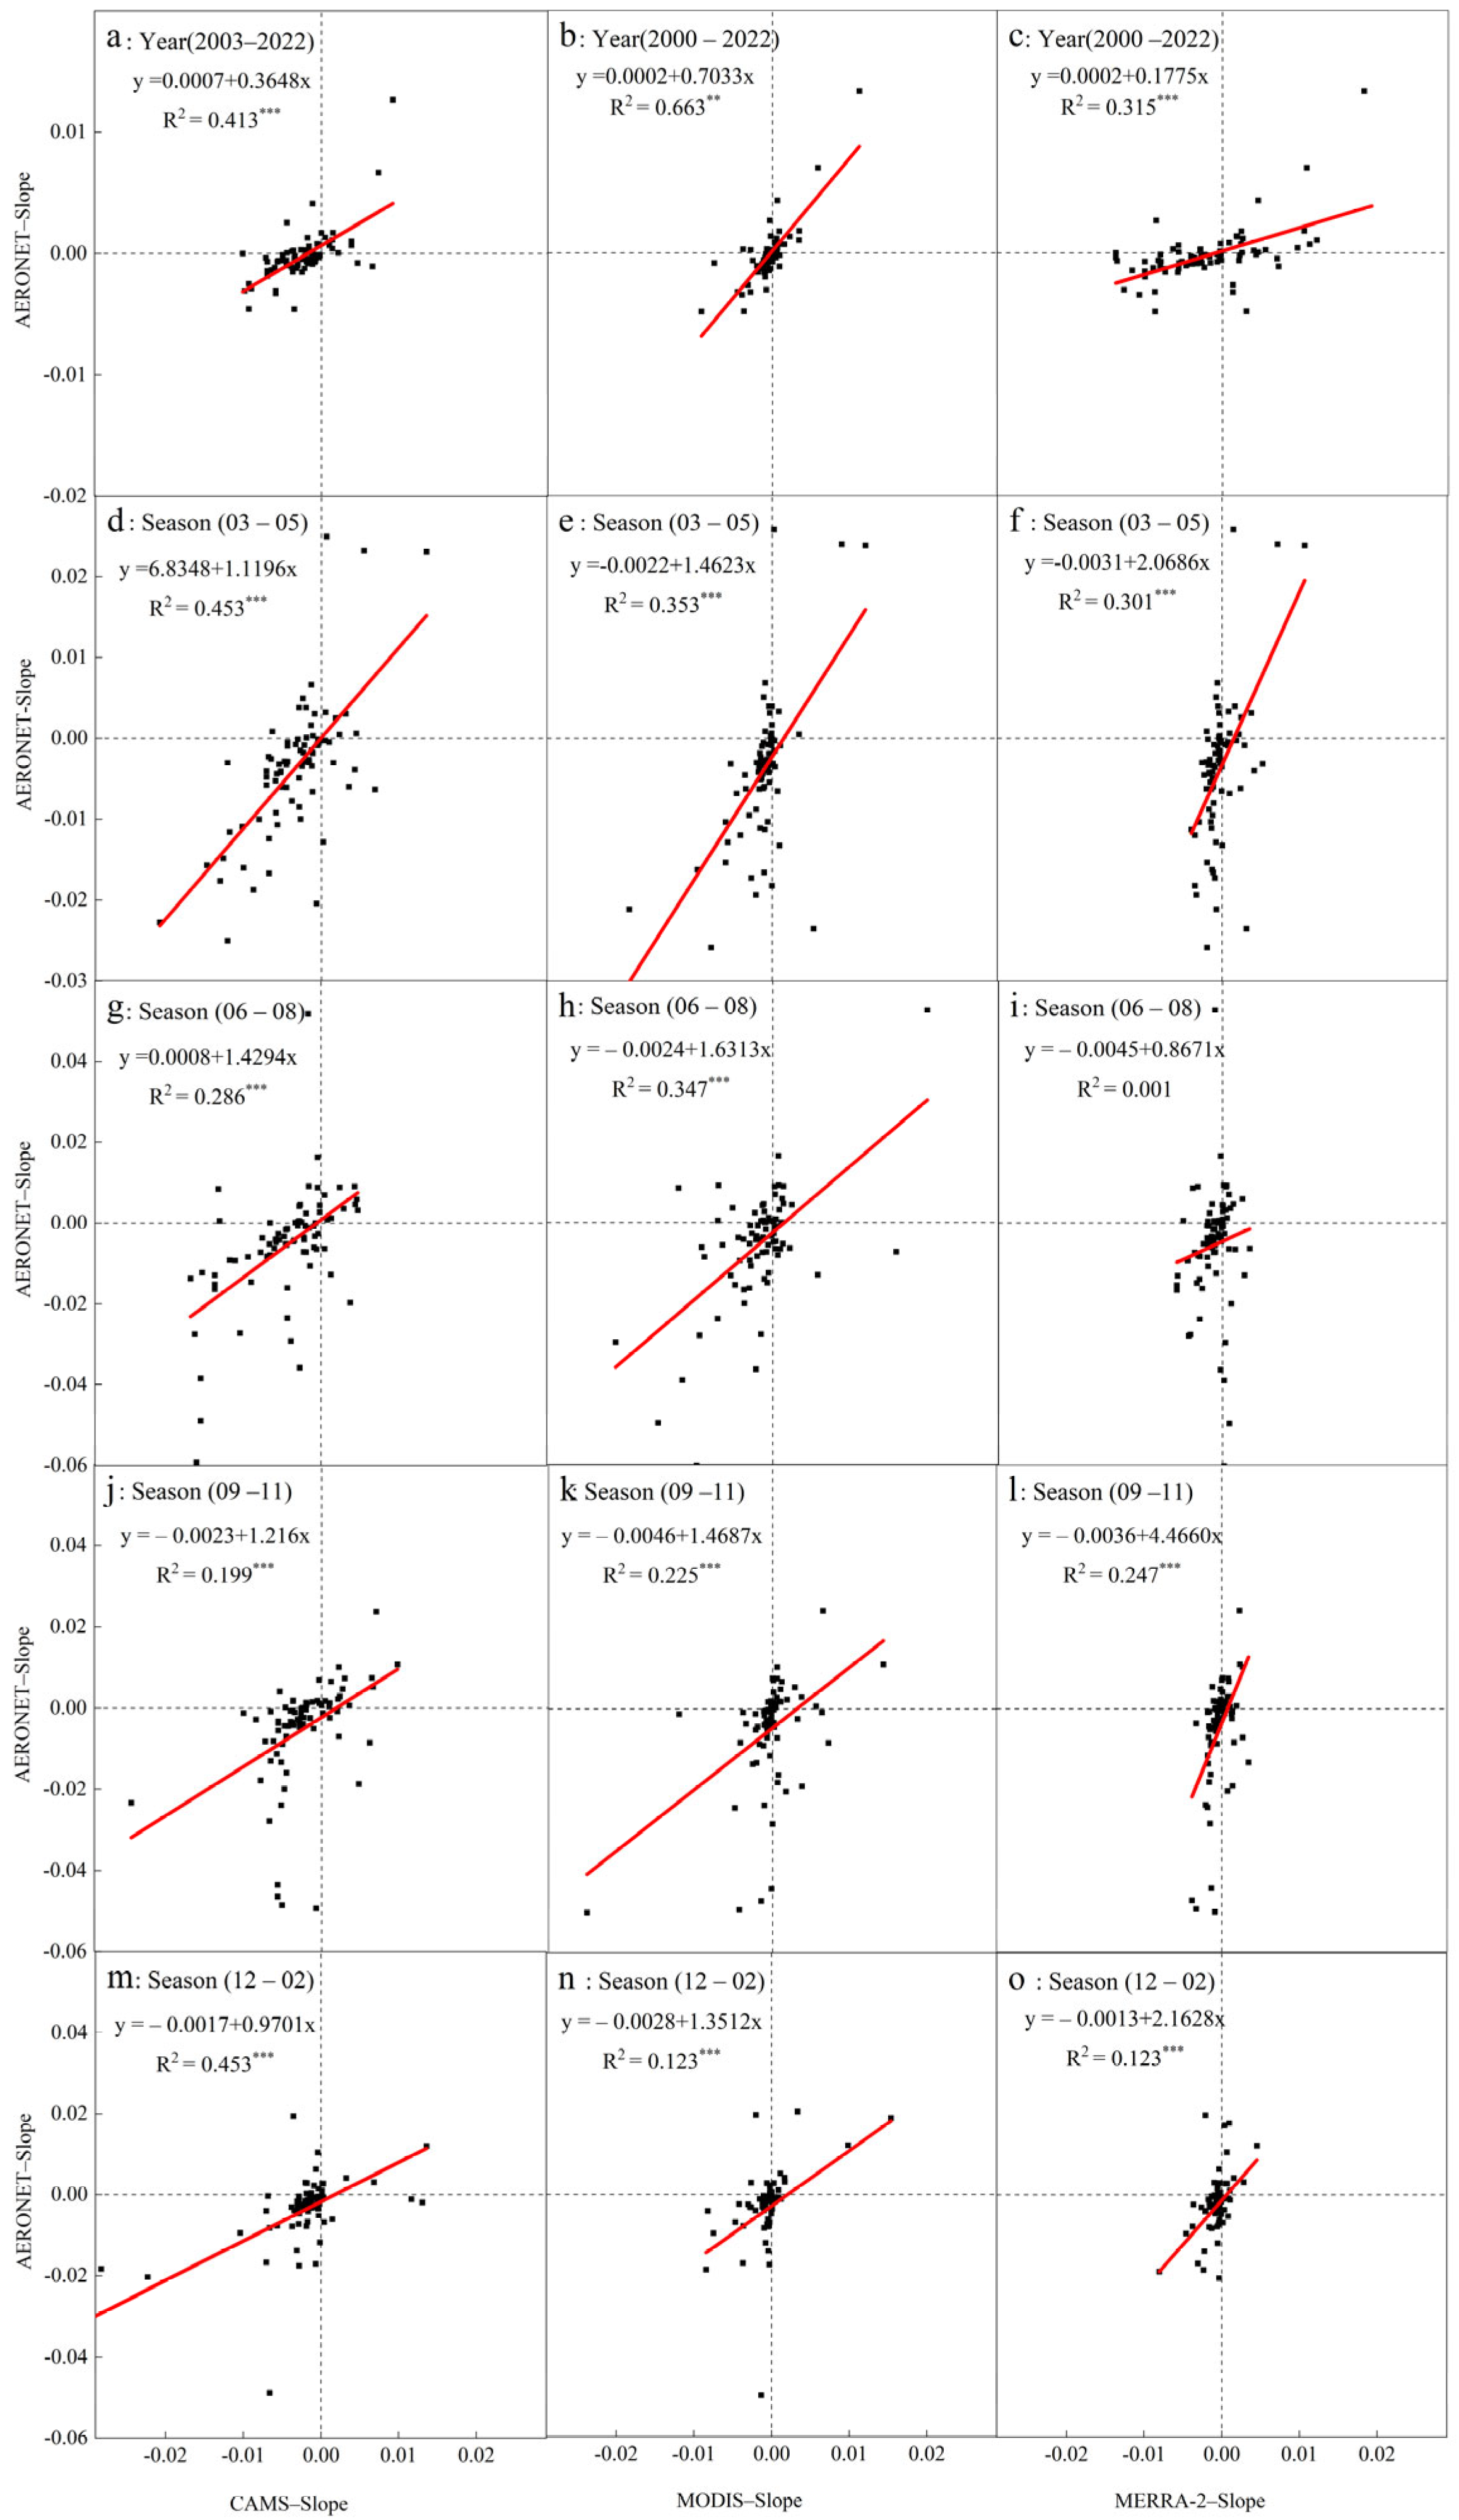
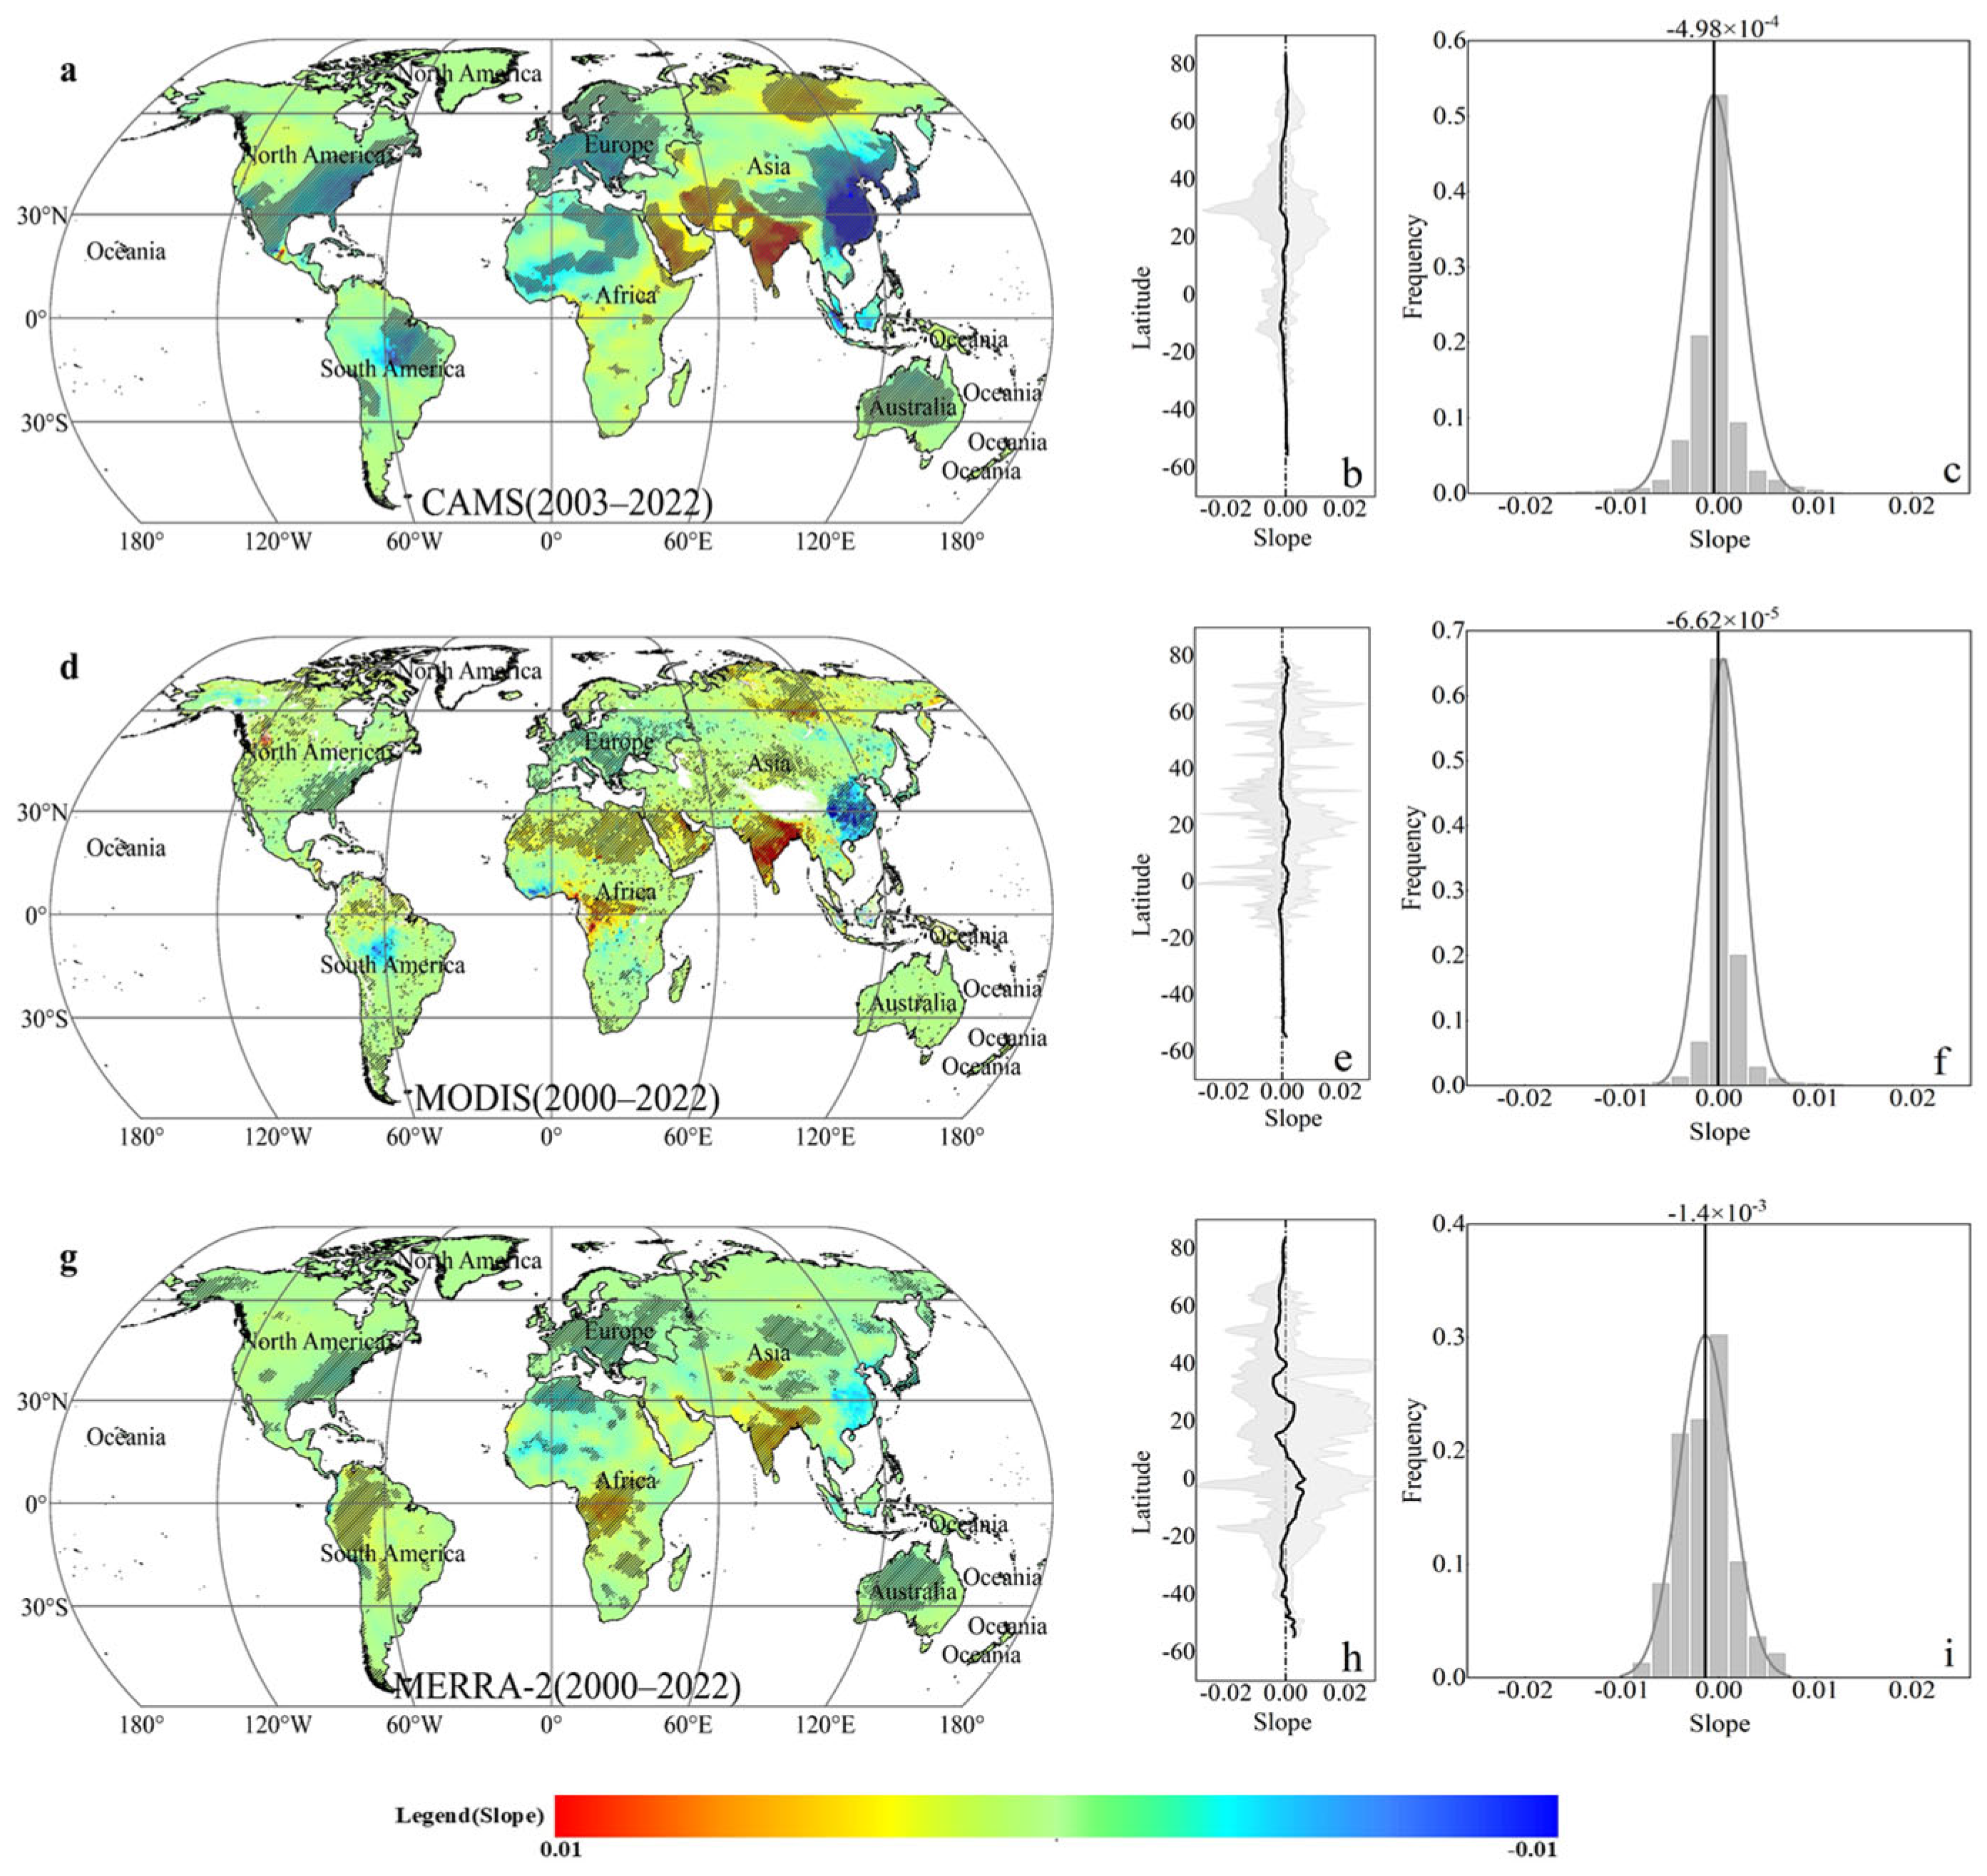
3.2. Validation AOD Trend against In Situ Observed Trend

The spatial patterns of the AOD long-term trends were examined for the three AOD products at an annual scale. The CAMS AOD trend (Figure 5a) showed significant increasing trends (slope > 0, p ≤ 0.05) primarily in northern Asia, South Asia, West Asia, and Central Asia. Regions with significant decreasing trends (slope < 0, p ≤ 0.05) in the CAMS AOD were mainly distributed in the southeastern parts of North America, eastern parts of South America, North Africa, Europe, and East Asia. Areas with increasing trends (slope > 0, p > 0.05) in the CAMS AOD were observed in northwestern North America, northern Asia, Central Asia, West Asia, South Asia, and parts of southern Africa. The MODIS AOD trend (Figure 5d) exhibited similar distribution characteristics to the CAMS AOD, with regions showing significant increasing trends (slope > 0, p ≤ 0.05) primarily seen in Africa and western parts of North America. Regions with significant decreasing trends (slope < 0, p ≤ 0.05) in the MODIS AOD were mainly distributed in eastern parts of East Asia, Europe, southeastern parts of North America, and central parts of South America. The MERRA-2 AOD trend (Figure 5g) showed significant increasing trends (slope > 0, p ≤ 0.05) primarily in southern Africa, South America, South Asia, and central parts of Central Asia. Regions with significant decreasing trends (slope < 0, p ≤ 0.05) in the MERRA-2 AOD were mainly distributed in eastern parts of East Asia, Europe, southeastern parts of North America, North Africa, and at the border of East Asia and northern Asia.
The latitudinal variation patterns of the long-term trends were also explored for the three AOD products (Figure 5b,e,h). The latitudinal average slope of the CAMS AOD (Figure 5b) was greater than 0 around 60°N and 20°N. For the MODIS AOD (Figure 5e), there was significant fluctuation in the latitudinal average slope, with generally more positive slopes than the CAMS AOD. In the case of the MERRA-2 AOD (Figure 5h), the latitudinal average positive slopes were mainly distributed between 20°N and 0°–20°S. The global average slope for the CAMS AOD (Figure 5c), MODIS AOD (Figure 5f), and MERRA-2 AOD (Figure 5i) were all less than 0, consistently indicating a decreasing trend in the AOD across global land areas.
According to the analysis of the MK trend, there were significant differences in the AOD variation trends among different products. Therefore, a comparative analysis was conducted to assess the reliability of CAMS, MODIS, and MERRA-2 AOD variation trends. Based on the consistency of CAMS, MODIS, and MERRA-2 AOD variation rates and the number of products, the regions were classified into four categories: Negative-3 indicating consistent decreasing trends in all three products, Positive-3 indicating consistent increasing trends in all three products, Negative-2 indicating consistent decreasing trends in two out of three products, and Positive-2 indicating consistent increasing trends in two out of three products (Figure 6). The analysis was conducted for trends at both annual and seasonal scales, with the seasons divided into MAM (March to May), JJA (June to August), SON (September to November), and DJF (December, January, and February).
For annual scale trends (Figure 6a) and JJA scale trends (Figure 6c), the pattern of reliability of the trends was similar. Negative-3 or Negative-2 regions were mainly distributed in North America, Europe, North Africa, Australia, and North Asia, while Positive-3 or Positive-2 regions were mainly found in South Africa, South Asia, North Asia, and Southeast Asia. The reliability of MAM (Figure 6b) and DJF (Figure 6e) variation trends was also similar, with Negative-3 or Negative-2 regions covering the largest area, including North America, Europe, Australia, Africa, and East Asia. Positive-3 or Positive-2 regions appeared in South America, South Asia, and West Asia. In the case of SON (Figure 6d), Negative-3 or Negative-2 regions were mainly distributed in South America, North Africa, Europe, and Australia, while Positive-3 or Positive-2 regions were mainly found in West Asia, South Asia, Central Asia, northern North Asia, and central North America. The statistics of reliability percentages are shown in Figure 6f. For annual variation trends, the percentages of Negative-3 and Negative-2 were 30.71% and 38.79% respectively, while Positive-3 and Positive-2 accounted for 11.70% and 18.80% respectively. In terms of seasonal variation trends, the percentages of Negative-3 were 32.13%, 27.95%, 30.91%, and 30.27% for MAM, JJA, SON, and DJF, respectively. The highest percentage of Negative-2 was observed in SON (31.20%), while the highest percentage of Positive-3 was found in JJA (15.13%). The percentage of Positive-2 was highest in MAM (23.58%). The proportions of regions with consistent and significantly changing trends (p ≤ 0.05) in both annual and seasonal scales were relatively small, with 3.87%, 6.98%, 1.93%, 1.81%, and 1.21% for annual, MAM, JJA, SON, and DJF, respectively. These findings indicate significant differences in the long-term trend analysis of AOD. Although a large proportion of regions showed consistent changing trends, the proportion of regions with both consistent and significantly changing trends was lower than expected.
To validate the reliability of the change rates estimated from the three AOD products, the AOD trends of CAMS, MODIS, and MERRA-2 were compared with trends from the AERONET AOD observation at 79 stations. A comparative analysis of the annual and seasonal change rates of the CAMS, MODIS, MERRA-2, and AERONET AODs from 2000 to 2022 was presented in Figure 7. At the annual and seasonal scales, the proportions of sites with consistent trends between the AERONET and satellite data were 63.29%, 64.56%, 46.84%, 58.23%, and 49.37%, respectively. The largest proportion of sites with consistent decreasing trends (slope < 0) was observed during MAM, accounting for 55.70%, while the smallest proportion was during JJA at 41.77%. The highest proportions of sites with consistent increasing trends (slope > 0) were observed during SON and JJA, at 15.19% and 5.06%, respectively.
In the annual slope comparison between products and in situ observation (Figure 7a), there was a higher agreement between the CAMS, MODIS, and AERONET AODs than MERRA-2 in terms of matching positive (slope > 0) and negative (slope < 0) slopes. The order of best matches with the AERONET AOD was as follows: MODIS > CAMS > MERRA-2. At the seasonal scale, in MAM (Figure 7b) and SON (Figure 7d), there was a higher agreement between the remote sensing AOD product and the AERONET AOD than the other two AOD products, except for a few stations where the calculated slope values differed significantly. For example, in JJA (Figure 7c) and DJF (Figure 7e), stations 33 and 43 displayed significant differences between the AERONET AOD and the satellite AOD product. Nonetheless, the consistency in the AERONET AOD was relatively high across the other stations. Additionally, the CAMS reanalysis data, which combined both AERONET and MODIS AODs, demonstrated a higher agreement with the AERONET AOD compared to the MERRA-2 AOD.
To further verify the consistency of the trends between the AOD products and in situ observation, we used scatter plots to analyze the linear relationship between long-term trends from the AOD products and in situ observation. At an annual scale, the AOD trends from MODIS (Figure 8b) fitted best with the AERONET AOD among the three products, and the R2 value could be up to 0.663 (p ≤ 0.05). The AOD trends from the CAMS AOD (Figure 8a) were more accurate than the MERRA-2 AOD (Figure 8c). As shown in Figure 8d–o, at the seasonal scale, the MODIS AOD trends in JJA and SON were more accurate than the CAMS and MERRA-2 AODs, with R2 values of 0.347 (p ≤ 0.05) and 0.225 (p ≤ 0.05), respectively. The MERRA-2 AOD trends had the lowest accuracy in JJA, with an R2 value of 0.001, and did not pass the threshold of significance. In MAM and DJF, the accuracy of the CAMS AOD trends was higher than that of the MODIS and MERRA-2 AODs, with R2 values of 0.453 (p ≤ 0.05).

4. Discussion

The research conducted by Tian [41] also confirms that high AOD values (>0.6) are primarily concentrated in Eastern Asia, Africa, and Northeast Southeast Asia. Moderate AOD values (0.3–0.6) show a predominant distribution in Africa, Eastern Asia, South Asia, Western Asia, and Southeast Asia. The global spatial distribution of AOD is consistent with the findings of Li et al. [42], where low AOD values (<0.3) are observed in various regions, including North America, South America, northern Asia, Europe, and Australia. These distribution characteristics are closely related to the distribution of population and aerosol natural sources. The factors influencing the spatial distribution pattern of AOD can be categorized into anthropogenic and natural factors [43,44]. Regions where anthropogenic effects dominate are primarily observed in Africa, Eastern Asia, and South Asia. These areas are characterized by high population density, industrial development, intensive agriculture and livestock practices, and significant energy consumption [45]. The emissions of aerosols in these regions lead to high aerosol concentrations in the atmosphere. This phenomenon is evident in India, which has become one of the regions most severely affected by aerosol pollution [46]. Natural factors also influence the spatial distribution pattern of AOD. Factors such as topography and landforms play a role in certain regions. In China, for example, the Sichuan Basin and the Tarim Basin are affected by topography, causing the accumulation of air pollutants and hindering their dispersion, resulting in the formation of high pollution centers [47,48]. In regions like North Africa, dust storms, monsoon patterns, and atmospheric circulations contribute to elevated levels of dust aerosols and the high AOD value [49]. Precipitation also influences the spatial distribution pattern of AOD. Generally, higher precipitation leads to lower AOD values, as it cleanses the atmosphere from pollutants. Conversely, lower precipitation results in higher AOD values. This phenomenon weakens the purification effect of precipitation on atmospheric pollutants.
At the global scale, the MODIS AOD shows the highest accuracy, followed by the CAMS AOD, while the MERRA-2 AOD exhibits higher agreement with the AERONET AOD in Europe and South America but lower overall accuracy. The MODIS AOD demonstrates extensive applicability globally, with the best performance in the Asian region, as confirmed by studies by Bibi et al. and Ping et al. [45,50] that also indicate the higher accuracy of MODIS A compared to MERRA-2. On the other hand, the CAMS AOD demonstrates better applicability in North America, South America, and Europe. In specific regions such as the southwestern region of China including plateaus and glacier areas [51], as well as some bright surface desert areas in India, the sensitivity of top-of-atmosphere reflection to aerosol changes beneath bright surfaces poses challenges to satellite monitoring, leading to greater uncertainties in satellite monitoring data [52] in desert areas like Africa [53]. Studies have also shown that different altitudes can affect the accuracy of satellite data [45], and the assimilation of satellite data in reanalysis datasets can impact the accuracy of their products.
The spatial variation trends of AODs across the globe from 2000 to 2022 were analyzed. As discovered by Chen et al. [52], the study analyzed that the CAMS and MODIS AODs exhibited significant increasing trends in northern Asia, South Asia, West Asia, and Central Asia, while the MERRA-2 AOD showed significant increasing trends in southern Africa, South America, South Asia, and central parts of Central Asia. The high population density and unregulated industrial development in regions such as South Asia, West Asia, and southern Africa have led to an increase in anthropogenic pollution emissions, resulting in higher concentrations of particles in the atmosphere [54]. Additionally, geographical features such as low-lying areas and basins have led to the formation of inversion layers, hindering the dispersion of aerosols and other pollutants in regions like the Congo Basin, the Tarim Basin, and others [55,56]. Conversely, the CAMS and MODIS AODs show noticeable decreasing trends in southeastern North America, eastern South America, North Africa, Europe, and East Asia, while the MERRA-2 AOD exhibits significant decreasing trends in eastern East Asia, Europe, southeastern North America, North Africa, and the border of East Asia and northern Asia. These findings indicate that the implementation of emission control policies [57,58], such as energy conservation, emission reduction, industrial process innovation, and the adoption of clean energy, has greatly improved air quality in eastern North America, Europe, and eastern and central China. These successes in air pollution control can serve as valuable references for other severely polluted regions. Furthermore, the reduction of forest wildfires in South America and Africa, as well as the cessation of ground winds in arid regions [59], may also contribute to the decreasing trends in AOD. The AERONET and MODIS AODs are both point-in-time monitoring values, and although there is high consistency in trend patterns when validated at the site level, the lack of monitoring stations in Africa [52] and the lower sensitivity of satellite reflectance [53] to bright surfaces necessitate the establishment of additional AERONET monitoring stations and the construction of a comprehensive aerosol monitoring information database to create conditions for more accurate validation of satellite data accuracy and to provide an essential basis for the improvement of satellite data. It should be noted that reanalysis products such as CAMS and MERRA-2 may be affected by instantaneous data versions and other factors, leading to significant uncertainties in AOD variation trends. Despite this, the research results indicate that the average proportion of consistent area coverage in global-scale variation trends, both at annual and seasonal scales, is 41.45%, primarily distributed in North America, Europe, Australia, East Asia, West Asia, and South Asia. Therefore, the AOD variation trends in this region are highly reliable.

5. Conclusions

This study analyzed the spatial distribution characteristics and temporal trends of different AOD products based on CAMS, MODIS, MERRA-2, and AERONET AOD products. It evaluated the accuracy of AOD and the reliability of its trends using precision evaluation metrics and MK trend tests. The spatial pattern of AOD across the global land area consistently indicates higher values in East and South Asia. On the global scale, the MODIS AOD product demonstrates superior performance compared to the other two products. The CAMS AOD outperforms the other two AOD products in North America, Europe, and South America, while the MERRA-2 AOD product excels in Europe and South America over the other two products. The MODIS AOD had the best match with the AERONET AOD in the Asian region, while the CAMS and MERRA-2 AODs were more suitable for regions with lower AOD values. Analysis of the annual variations in AOD revealed significant trends observed in the latitude 65°N to 20°S. Based on the MK trend tests, overall, the three AOD products consistently depict decreasing global AOD trends. However, the spatial patterns of the changing trends differ among them, around 41.45% of the land area shows fully consistent trends across the three products, and 3.2% of the area shows consistent and significant change trends. The MODIS, CAMS, and MERRA-2 AODs consistently exhibited decreasing trends in regions such as eastern Asia, Europe, and eastern North America, indicating their reliability in these areas. On the other hand, different datasets exhibit varying trends in regions such as West Asia, South Asia, and South Africa, indicating their limited reliability. These findings offer new insights into the understanding of aerosol spatial and temporal dynamics, contributing to the improvement of AOD products. However, there has been no detailed study on the factors leading to the distribution characteristics and temporal trends of AOD based on different regional features. Only a few remote sensing products have been considered in evaluating the accuracy of remote sensing products, and the sources of remote sensing product data have not been deeply investigated. This part will become the focus of future research, and practical and effective response strategies will be proposed based on the corresponding causes.

Author Contributions

X.W., G.H., S.Z. and L.Z. designed this study. L.Z. performed the data analysis. X.W., G.H., S.Z. and L.Z. wrote this manuscript. All authors have read and agreed to the published version of the manuscript.

Funding

This research was supported by the Youth Innovation Promotion Association CAS to X.W. (NO. 2020422), the Foundation for Distinguished Young Scholars of Gansu Province (Grant No. 22JR5RA046), the National Natural Science Foundation of China (42171322 and 42371365), and Joint Funds of the National Natural Science Foundation of China (U22A202690).

Data Availability Statement

The datasets generated and/or analyzed during the current study are available from the corresponding author upon reasonable request.

Conflicts of Interest

The authors declare no conflict of interest.

Appendix A

Figure A1. Spatial distribution map of the selected AERONET sites in the study area. (a): Western North America (WNA). (c): South America (SAM). (d): Europe (EU). (e): Central, South and West Asia (CSWA). (f): Southeast Asia (SEA). (g): East Asia (EAS).
Remotesensing 16 01425 g0a1
Table A1. AERONET sites in each region.
AreasSite NameNumber
Western North America (a, WNA)CalTech, Fort_McMurray, Fresno, Fresno_2, Kelowna_UAS, NEON_CVALLA, Sandia_NM_PSEL, Santa_Monica_Colg, Univ_of_Lethbridge, Univ_of_Nevada-Reno, USGS_Flagstaff_ROLO, Mexico_City, Univ_of_Houston13
Eastern North America (b, ENA)Appalachian_State, Brookhaven, CARTEL, Dayton, EPA-Res_Triangle_Pk, Georgia_Tech, GSFC, MD_Science_Center, Tallahassee, Toronto, UMBC11
South America (c, SAM)Arica, Campo_Grande_SONDA, CEILAP-BA, La_Paz, Rio_Branco, SANTA_CRUZ_UTEPSA, Sao_Paulo7
Europe (d, EU)ATHENS-NOA, Aubiere_LAMP, Brussels, CLUJ_UBB, FZJ-JOYCE, Granada, Helsinki, lasi_LOASL, LAQUILA_Coppito, Lecce_University, Leipzig, Madrid, Mainz, Moscow_MSU_MO, Murcia, Toulouse_MF, Tunis_Carthage, Valladolid, Kuopio, CUT-TEPAK20
Central, South, and West Asia (e, CSWA)Dushanbe, Jaipur, Kanpur, Karachi, Lahore, KAUST_Campus, Masdar_Institute, Chiang_Mai_Met_Sta, Dhaka_University9
Southeast Asia (f, SEA)Bandung, Silpakorn_Univ, Singapore, Songkhla_Met_Sta, Ubon_Ratchathani, USM_Penang6
East Asia (g, EAS)Beijing, Beijing-CAMS, Chen-Kung_Univ, EPA-NCU, Fukuoka, Gangneung_WNU, Hankuk_UFS, Hong_Kong_PolyU, Manila_Observatory, Taipei_CWB, XiangHe, Yonsei_University12
Table A2. AERONET sites in the study area.
NumberSites NameNumberSites NameNumberSites Name
1Appalachian_State28FZJ-JOYCE55Murcia
2Arica29Gangneung_WNU56NEON_CVALLA
3ATHENS-NOA30Georgia_Tech57Rio_Branco
4Aubiere_LAMP31Granada58Sandia_NM_PSEL
5Bandung32GSFC59SANTA_CRUZ_UTEPSA
6Beijing33Hankuk_UFS60Santa_Monica_Colg
7Beijing-CAMS34Helsinki61Sao_Paulo
8Brookhaven35Hong_Kong_PolyU62Silpakorn_Univ
9Brussels36Iasi_LOASL63Singapore
10Cairo_EMA_237Jaipur64Songkhla_Met_Sta
11CalTech38Kanpur65Taipei_CWB
12Campo_Grande_SONDA39Karachi66Tallahassee
13CARTEL40KAUST_Campus67Toronto
14CEILAP-BA41Kelowna_UAS68Toulouse_MF
15Chen-Kung_Univ42Kuopio69Tunis_Carthage
16Chiang_Mai_Met_Sta43La_Paz70Ubon_Ratchathani
17CLUJ_UBB44Lahore71UMBC
18CUT-TEPAK45LAQUILA_Coppito72Univ_of_Houston
19Dayton46Lecce_University73Univ_of_Lethbridge
20Dhaka_University47Leipzig74Univ_of_Nevada-Reno
21Dushanbe48Madrid75USGS_Flagstaff_ROLO
22EPA-NCU49Mainz76USM_Penang
23EPA-Res_Triangle_Pk50Manila_Observatory77Valladolid
24Fort_McMurray51Masdar_Institute78XiangHe
25Fresno52MD_Science_Center79Yonsei_University
26Fresno_253Mexico_City
27Fukuoka54Moscow_MSU_MO

References

  1. Xue, W.; Zhang, J.; Qiao, Y.; Wei, J.; Lu, T.; Che, Y.; Tian, Y. Spatiotemporal variations and relationships of aerosol-radiation-ecosystem productivity over China during 2001–2014. Sci. Total Environ. 2020, 741, 140324. [Google Scholar] [CrossRef] [PubMed]
  2. Luo, H.; Han, Y.; Lu, C.S.; Yang, J.; Wu, Y.H. Characteristics of Surface Solar Radiation under Different Air Pollution Conditions over Nanjing, China: Observation and Simulation. Adv. Atmos. Sci. 2017, 36, 1047–1059. [Google Scholar] [CrossRef]
  3. Molero, F. Remote Sensing of Aerosols. Atmosphere 2019, 10, 655. [Google Scholar] [CrossRef]
  4. Zhao, B.; Wang, Y.; Gu, Y.; Liou, K.-N.; Jiang, J.H.; Fan, J.; Liu, X.; Huang, L.; Yung, Y.L. Ice nucleation by aerosols from anthropogenic pollution. Nat. Geosci. 2019, 12, 602–607. [Google Scholar] [CrossRef] [PubMed]
  5. Luo, H.; Dong, L.; Chen, Y.C.; Zhao, Y.F.; Zhao, D.L.; Huang, M.Y.; Ding, D.P.; Liao, J.Y.; Ma, T.; Hu, M.H.; et al. Interaction between aerosol and thermodynamic stability within the planetary boundary layer during wintertime over the North China Plain: Aircraft observation and WRF-Chem simulation. Atmos. Chem. Phys. 2022, 22, 2507–2524. [Google Scholar] [CrossRef]
  6. Huang, G.; Huang, C.; Li, Z.; Chen, H. Development and Validation of a Robust Algorithm for Retrieving Aerosol Optical Depth over Land from MODIS Data. IEEE J. Sel. Top. Appl. Earth Obs. Remote. Sens. 2015, 8, 1152–1166. [Google Scholar] [CrossRef]
  7. Tomasi, C.; Lupi, A.; Mazzola, M.; Stone, R.S.; Dutton, E.G.; Herber, A.; Radionov, V.F.; Holben, B.N.; Sorokin, M.G.; Sakerin, S.M.; et al. An update on polar aerosol optical properties using POLAR-AOD and other measurements performed during the International Polar Year. Atmos. Environ. 2012, 52, 29–47. [Google Scholar] [CrossRef]
  8. Anderson, T.L.; Wu, Y.; Chu, D.A.; Schmid, B.; Redemann, J.; Dubovik, O. Aerosol and Clouds–D18204–Testing the MODIS satellite retrieval of aerosol fine-mode fraction. J. Geophys. Res. Part D Atmos. 2005, 110. [Google Scholar]
  9. Kim, S.; Jeong, Y.; Youn, Y.; Cho, S.; Kang, J.; Kim, G.; Lee, Y. A Comparison between Multiple Satellite AOD Products Using AERONET Sun Photometer Observations in South Korea: Case Study of MODIS, VIIRS, Himawari-8, and Sentinel-3. Korean J. Remote Sens. 2021, 37, 543–557. [Google Scholar]
  10. Lv, B.; Hu, Y.; Chang, H.H.; Russell, A.G.; Cai, J.; Xu, B.; Bai, Y. Daily estimation of ground-level PM2.5 concentrations at 4 km resolution over Beijing-Tianjin-Hebei by fusing MODIS AOD and ground observations. Sci. Total Environ. 2017, 580, 235–244. [Google Scholar] [CrossRef]
  11. Wei, J.; Huang, B.; Sun, L.; Zhang, Z.; Wang, L.; Bilal, M. A Simple and Universal Aerosol Retrieval Algorithm for Landsat Series Images over Complex Surfaces. J. Geophys. Res. Atmos. 2017, 122, 13338–13355. [Google Scholar] [CrossRef]
  12. King, M.D.; Menzel, W.P.; Kaufman, Y.J.; Tanré, D.; Gao, B.-C.; Platnick, S.; Ackerman, S.A.; Remer, L.A.; Pincus, R.; Hubanks, P.A. Cloud and aerosol properties, precipitable water, and profiles of temperature and water vapor from MODIS. IEEE Trans. Geosci. Remote Sens. 2003, 41, 442–458. [Google Scholar] [CrossRef]
  13. Yang, O.; Zhengqiang, L.; Cheng, C.; Ying, Z.; Kaitao, L.; Zheng, S.; Jiantao, D.; Hua, X.; Zongren, P.; Yisong, X.; et al. Evaluation of MERRA-2 Aerosol Optical and Component Properties over China Using SONET and PARASOL/GRASP Data. Remote Sens. 2022, 14, 821. [Google Scholar] [CrossRef]
  14. Chen, A.; Zhao, C.; Fan, T. Spatio-temporal distribution of aerosol direct radiative forcing over mid-latitude regions in north hemisphere estimated from satellite observations. Atmos. Res. 2022, 266, 105938. [Google Scholar] [CrossRef]
  15. Sun, E.; Che, H.; Xu, X.; Wang, Z.; Lu, C.; Gui, K.; Zhao, H.; Zheng, Y.; Wang, Y.; Wang, H.; et al. Variation in MERRA-2 aerosol optical depth over the Yangtze River Delta from 1980 to 2016. Theor. Appl. Clim. 2019, 136, 363–375. [Google Scholar] [CrossRef]
  16. Osgouei, P.E.; Roberts, G.; Kaya, S.; Bilal, M.; Dash, J.; Sertel, E. Evaluation and comparison of MODIS and VIIRS aerosol optical depth (AOD) products over regions in the Eastern Mediterranean and the Black Sea. Atmos. Environ. 2022, 268, 118784. [Google Scholar] [CrossRef]
  17. Jiang, D.; Wang, L.; Yi, X.; Su, X.; Zhang, M. Comprehensive evaluation of multisource aerosol optical depth gridded products over China. Atmos. Environ. 2022, 278, 119088. [Google Scholar] [CrossRef]
  18. Aldabash, M.; Balcik, F.B.; Glantz, P. Validation of MODIS C6.1 and MERRA-2 AOD Using AERONET Observations: A Comparative Study over Turkey. Atmosphere 2020, 11, 905. [Google Scholar] [CrossRef]
  19. Palácios, R.; Nassarden, D.C.S.; Franco, M.A.; Morais, F.G.; Machado, L.A.T.; Rizzo, L.V.; Cirino, G.; Pereira, A.G.C.; Ribeiro, P.d.S.; Barros, L.R.C.; et al. Evaluation of MODIS Dark Target AOD Product with 3 and 10 km Resolution in Amazonia. Atmosphere 2022, 13, 1742. [Google Scholar] [CrossRef]
  20. Selvetikar, A.; Chandra, S.M.; Bhupal, R.D.R. Retrieving MODIS AOD and Evaluation of Ground-level PM2.5 in Addition to the Identification of Potential Source Regions Over South India. Indian J. Ecol. 2022, 49, 2395–2403. [Google Scholar]
  21. Buchard, V.; da Silva, A.; Randles, C.; Colarco, P.; Ferrare, R.; Hair, J.; Hostetler, C.; Tackett, J.; Winker, D. Evaluation of the surface PM2.5 in Version 1 of the NASA MERRA Aerosol Reanalysis over the United States. Atmos. Environ. 2016, 125, 100–111. [Google Scholar] [CrossRef]
  22. Buchard, V.; Randles, C.A.; Da Silva, A.M.; Darmenov, A.; Colarco, P.R.; Govindaraju, R.; Ferrare, R.; Hair, J.; Beyersdorf, A.J.; Ziemba, L.D.; et al. The MERRA-2 Aerosol Reanalysis, 1980 Onward. Part II: Evaluation and Case Studies. J. Clim. 2017, 30, 6851–6872. [Google Scholar] [CrossRef]
  23. Buchard, V.; da Silva, A.M.; Colarco, P.; Krotkov, N.; Dickerson, R.R.; Stehr, J.W.; Mount, G.; Spinei, E.; Arkinson, H.L.; He, H. Evaluation of GEOS-5 sulfur dioxide simulations during the Frostburg, MD 2010 field campaign. Atmos. Chem. Phys. 2014, 14, 1929–1941. [Google Scholar] [CrossRef]
  24. Randles, C.A.; Da Silva, A.M.; Buchard, V.; Colarco, P.R.; Darmenov, A.; Govindaraju, R.; Smirnov, A.; Holben, B.; Ferrare, R.; Hair, J.; et al. The MERRA-2 Aerosol Reanalysis, 1980 Onward. Part I: System Description and Data Assimilation Evaluation. J. Clim. 2017, 30, 6823–6850. [Google Scholar] [CrossRef] [PubMed]
  25. Ke, L.; Kaixu, B.; Zhengqiang, L.; Jianping, G.; Ni-Bin, C. Synergistic data fusion of multimodal AOD and air quality data for near real-time full coverage air pollution assessment. J. Environ. Manag. 2022, 302, 114121. [Google Scholar]
  26. Zhang, T.; Zang, L.; Mao, F.; Wan, Y.; Zhu, Y. Evaluation of Himawari-8/AHI, MERRA-2, and CAMS Aerosol Products over China. Remote Sens. 2020, 12, 1684. [Google Scholar] [CrossRef]
  27. Ali, A.; Bilal, M.; Wang, Y.; Qiu, Z.; Nichol, J.E.; de Leeuw, G.; Ke, S.; Mhawish, A.; Almazroui, M.; Mazhar, U.; et al. Evaluation and comparison of CMIP6 models and MERRA-2 reanalysis AOD against Satellite observations from 2000 to 2014 over China. Geosci. Front. 2022, 13, 101325. [Google Scholar] [CrossRef]
  28. Che, H.; Yang, L.; Liu, C.; Xia, X.; Wang, Y.; Wang, H.; Wang, H.; Lu, X.; Zhang, X. Long-term validation of MODIS C6 and C6.1 Dark Target aerosol products over China using CARSNET and AERONET. Chemosphere 2019, 236, 124268. [Google Scholar] [CrossRef]
  29. Fu, D.; Xia, X.; Wang, J.; Zhang, X.; Li, X.; Liu, J. Synergy of AERONET and MODIS AOD products in the estimation of PM2.5 concentrations in Beijing. Sci. Rep. 2018, 1, 10174. [Google Scholar] [CrossRef]
  30. Gui, K.; Che, H.; Wang, Y.; Xia, X.; Holben, B.N.; Goloub, P.; Cuevas-Agullo, E.; Yao, W.; Zheng, Y.; Zhao, H.; et al. A global-scale analysis of the MISR Level-3 aerosol optical depth (AOD) product: Comparison with multi-platform AOD data sources. Atmos. Pollut. Res. 2021, 12, 101238. [Google Scholar] [CrossRef]
  31. Ångström, A. The parameters of atmospheric turbidity. Tellus 1964, 16, 64–75. [Google Scholar] [CrossRef]
  32. Jin, J.; Henzing, B.; Segers, A. How aerosol size matters in aerosol optical depth (AOD) assimilation and the optimization using the Ångström exponent. Atmos. Chem. Phys. 2023, 23, 1641–1660. [Google Scholar] [CrossRef]
  33. Wei, J.; Peng, Y.; Mahmood, R.; Sun, L.; Guo, J. Intercomparison in spatial distributions and temporal trends derived from multi-source satellite aerosol products. Atmos. Chem. Phys. 2019, 19, 7183–7207. [Google Scholar] [CrossRef]
  34. Azan, A.N.A.M.; Mototo, N.F.A.M.Z.; Mah, P.J.W. The Comparison between ARIMA and ARFIMA Model to Forecast Kijang Emas (Gold) Prices in Malaysia using MAE, RMSE and MAPE. J. Comput. Res. Innov. 2021, 6, 22–33. [Google Scholar] [CrossRef]
  35. Chicco, D.; Warrens, M.J.; Jurman, G. The coefficient of determination R-squared is more informative than SMAPE, MAE, MAPE, MSE and RMSE in regression analysis evaluation. PeerJ Comput. Sci. 2021, 7, e623. [Google Scholar] [CrossRef] [PubMed]
  36. Mann, H.B. Nonparametric tests against trend. Econometrica 1945, 13, 245–259. [Google Scholar] [CrossRef]
  37. Semeonoff, B. Rank Correlation Methods—Kendall, MG. Br. J. Psychol. 1957, 48, 77–78. [Google Scholar]
  38. Guo, F.; Rasmussen, B. Predictive maintenance for residential air conditioning systems with smart thermostat data using modified Mann-Kendall tests. Appl. Therm. Eng. 2023, 222, 119955. [Google Scholar] [CrossRef]
  39. Khavse, R.; Chaudhary, J. Trend assessment in climate variable by Mann Kendall test of Bastar district of Chhattisgarh. Mausam 2022, 73, 79–82. [Google Scholar] [CrossRef]
  40. Pandey, V.; Pandey, P.K.; Chakma, B.; Ranjan, P. Influence of short- and long-term persistence on identification of rainfall temporal trends using different versions of the Mann-Kendall test in Mizoram, Northeast India. Environ. Sci. Pollut. Res. 2023, 31, 10359–10378. [Google Scholar] [CrossRef]
  41. Tian, X.; Tang, C.; Wu, X.; Yang, J.; Zhao, F.; Liu, D. The global spatial-temporal distribution and EOF analysis of AOD based on MODIS data during 2003–2021. Atmos. Environ. 2023, 302, 119722. [Google Scholar] [CrossRef]
  42. Li, B.; Su, S.; Yuan, H.; Tao, S. Spatial and temporal variations of AOD over land at the global scale. Int. J. Remote Sens. 2012, 33, 2097–2111. [Google Scholar] [CrossRef]
  43. Ma, W.; Ding, J.; Jin, X. Spatial heterogeneity and driving factors of aerosol in Western China: Analysis on multiangle implementation of atmospheric correction–aerosol optical depth in Xinjiang over 2001–2019. Int. J. Clim. 2023, 43, 1993–2011. [Google Scholar] [CrossRef]
  44. Zhang, Z.; Ding, J.; Chen, X.; Wang, J. Aerosols characteristics, sources, and drive factors analysis in typical megacities, NW China. J. Clean. Prod. 2023, 403, 136879. [Google Scholar] [CrossRef]
  45. Ping, W.; Qingxin, T.; Yuxin, Z.; Ke, Z.; Tianquan, L.; Quanzhou, Y.; Yaqian, H. Validation and Analysis of MAIAC AOD Aerosol Products in East Asia from 2011 to 2020. Remote Sens. 2022, 14, 5735. [Google Scholar] [CrossRef]
  46. David, L.M.; Ravishankara, A.R.; Kodros, J.K.; Venkataraman, C.; Sadavarte, P.; Pierce, J.R.; Chaliyakunnel, S.; Millet, D.B. Aerosol Optical Depth Over India. J. Geophys. Res. -Atmos. Sect. 2018, 123, 3688–3703. [Google Scholar] [CrossRef]
  47. Cao, J.; Tang, G.; Fang, X.; Li, J.; Liu, Y.; Zhang, Y.; Zhu, Y.; Li, F. Terrain relief periods of loess landforms based on terrain profiles of the Loess Plateau in northern Shaanxi Province, China. Front. Earth Sci. 2019, 13, 410–421. [Google Scholar] [CrossRef]
  48. Hu, W.; Zhao, Y.; Zhao, T.; Bai, Y.; Zhao, C.; Kong, S.; Chen, L.; Du, Q.; Zheng, H.; Lu, W.; et al. Aggravated chemical production of aerosols by regional transport and basin terrain in a heavy PM2.5 pollution episode over central China. Atmos. Environ. 2023, 294, 1352–2310. [Google Scholar] [CrossRef]
  49. Varga, G. Changing nature of Saharan dust deposition in the Carpathian Basin (Central Europe): 40 years of identified North African dust events (1979–2018). Environ. Int. 2020, 139, 105712. [Google Scholar] [CrossRef]
  50. Bibi, H.; Alam, K.; Chishtie, F.; Bibi, S.; Shahid, I.; Blaschke, T. Intercomparison of MODIS, MISR, OMI, and CALIPSO aerosol optical depth retrievals for four locations on the Indo-Gangetic plains and validation against AERONET data. Atmos. Environ. 2015, 111, 113–126. [Google Scholar] [CrossRef]
  51. Filonchyk, M.; Hurynovich, V. Validation of MODIS Aerosol Products with AERONET Measurements of Different Land Cover Types in Areas over Eastern Europe and China. J. Geovisualization Spat. Anal. 2020, 4, 10. [Google Scholar] [CrossRef]
  52. Chen, Q.-X.; Han, X.-L.; Gu, Y.; Yuan, Y.; Jiang, J.H.; Yang, X.-B.; Liou, K.-N.; Tan, H.-P. Evaluation of MODIS, MISR, and VIIRS daily level-3 aerosol optical depth products over land. Atmos. Res. 2022, 265, 105810. [Google Scholar] [CrossRef]
  53. Qin, W.; Fang, H.; Wang, L.; Wei, J.; Zhang, M.; Su, X.; Bilal, M.; Liang, X. MODIS high-resolution MAIAC aerosol product: Global validation and analysis. Atmos. Environ. 2021, 264, 118684. [Google Scholar] [CrossRef]
  54. Gupta, G.; Ratnam, M.V.; Madhavan, B.; Narayanamurthy, C. Long-term trends in Aerosol Optical Depth obtained across the globe using multi-satellite measurements. Atmos. Environ. 2022, 273, 118953. [Google Scholar] [CrossRef]
  55. Li, X.; Abdullah, L.C.; Sobri, S.; Said, M.S.M.; Hussain, S.A.; Aun, T.P.; Hu, J. Characteristics of air pollution variation and potential source contributions of typical megacities in the Sichuan Basin, Southwest China. Air Qual. Atmos. Health 2023, 17, 641–660. [Google Scholar] [CrossRef]
  56. Yu, H.; Yang, W.; Wang, X.; Yin, B.; Zhang, X.; Wang, J.; Gu, C.; Ming, J.; Geng, C.; Bai, Z. A seriously sand storm mixed air-polluted area in the margin of Tarim Basin: Temporal-spatial distribution and potential sources. Sci. Total Environ. 2019, 676, 436–446. [Google Scholar] [CrossRef] [PubMed]
  57. Cao, S.; Zhang, S.; Gao, C.; Yan, Y.; Bao, J.; Su, L.; Liu, M.; Peng, N.; Liu, M. A long-term analysis of atmospheric black carbon MERRA-2 concentration over China during 1980–2019. Atmos. Environ. 2021, 264, 118662. [Google Scholar] [CrossRef]
  58. Shaheen, A.; Wu, R.; Aldabash, M. Long-term AOD trend assessment over the Eastern Mediterranean region: A comparative study including a new merged aerosol product. Atmos. Environ. 2020, 238, 117736. [Google Scholar] [CrossRef]
  59. Wang, Y.; Huang, P. Potential fire risks in South America under anthropogenic forcing hidden by the Atlantic Multidecadal Oscillation. Nat. Commun. 2022, 13, 2437. [Google Scholar] [CrossRef]
Figure 1. The annual mean spatial distribution map of CAMS ((a), 2003–2022), MODIS ((d), 2000–2022), and MERRA-2 ((g), 2000–2022) AODs around the world; latitude line charts of the annual average of CAMS (b), MODIS (e), and MERRA-2 (h) AODs. The shaded area represents the range of AODs for that latitude region. Histogram of the annual AOD of CAMS (c), MODIS (f), and MERRA-2 (i).
Remotesensing 16 01425 g001
Figure 2. Validation of AOD products against AERONET observation in the subregions. CAMS AOD vs. AERONET in subregions ENA (a), WNA (d), SAM (g), EU (j), EAS (m), SEA (p), and CSWA (s). MODIS AOD vs. AERONET in subregions ENA (b), WNA (e), SAM (h), EU (k), EAS (n), SEA (q), and CSWA (t). MERRA-2 AOD vs. AERONET in subregions ENA (c), WNA (f), SAM (i), EU (l), EAS (o), SEA (r), and CSWA (u). The color bars indicate the frequency of match. *** represents p ≤ 0.01.
Remotesensing 16 01425 g002aRemotesensing 16 01425 g002b
Figure 3. Spatial pattern of R2, RMSE, and MAE between AOD products (CAMS, MODIS, MERRA-2) and AERONET in situ observed AOD. R2 of CAMS (a), MODIS (b), and MERRA-2 (c). RMSE of CAMS (d), MODIS (e), and MERRA-2 (f). MAE of CAMS (g), MODIS (h), and MERRA-2 (i).
Remotesensing 16 01425 g003
Figure 4. Box plots of R2, RMSE, and MAE for the three AOD products in the subregions. (a) R2 of CAMS, MODIS, and MERRA-2. (b) RMSE of CAMS, MODIS, and MERRA-2. (c) MAE of CAMS, MODIS, and MERRA-2.
Remotesensing 16 01425 g004
Figure 5. Spatial patterns of long-term AOD trends for the three products. The spatial pattern of trend for CAMS (a), MODIS (d), and MERRA-2 (g) over global lands. Latitudinal variation of the AOD trends for CAMS (b), MODIS (e), and MERRA-2 (h) AODs. The shaded area represents the range of trends for that latitude region. Histogram of the AOD trends for CAMS (c), MODIS (f), and MERRA-2 (i) AODs.
Remotesensing 16 01425 g005
Figure 6. Consistent spatial distribution map of the variation trend. (a): Consistent spatial distribution map of the annual variation trend. (be): Spatial distribution maps of the seasonal variation trend. (f): Statistical chart of consistent variation trends for both annual and seasonal variations. The black dots indicate the 95% confidence of correlation coefficient (p ≤ 0.05).
Remotesensing 16 01425 g006
Figure 7. Comparison of the AOD trends between AOD products and in situ observation at the AERONET sites. (a) Comparing the AOD trend at annual scale at the AERONET sites. (b) Comparing the AOD trend at seasonal scale (March to May) at the AERONET sites. (c) Comparing the AOD trend at seasonal scale (June to August) at the AERONET sites. (d) Comparing the AOD trend at seasonal scale (September to November) at the AERONET sites. (e) Comparing the AOD trend at seasonal scale (December to February) at the AERONET sites. The stations are sorted in alphabetical order by their names (Table A2).
Remotesensing 16 01425 g007
Figure 8. Comparison of AOD trends between AOD products (CAMS, MODIS, and MERRA-2) and in situ observations at different temporal scales. Annual scale trends are depicted in (a) for CAMS AOD trend vs. AERONET, (b) for MODIS AOD trend vs. AERONET, and (c) for MERRA-2 AOD trend vs. AERONET. Seasonal trends in MAM are presented in (d) for CAMS AOD trend vs. AERONET, (e) for MODIS AOD trend vs. AERONET, and (f) for MERRA-2 AOD trend vs. AERONET. Seasonal trends in JJA are illustrated in (g) for CAMS AOD trend vs. AERONET, (h) for MODIS AOD trend vs. AERONET, and (i) for MERRA-2 AOD trend vs. AERONET. Seasonal trends in SON are illustrated in (j) for CAMS AOD trend vs. AERONET, (k) for MODIS AOD trend vs. AERONET and (l) for MERRA-2 AOD trend vs. AERONET. Seasonal trends in DJF are illustrated in (m) for CAMS AOD trend vs. AERONET, (n) for MODIS AOD trend vs AERONET and (o) MERRA-2 AOD trend vs. AERONET. *** represents p ≤ 0.01, ** represents p ≤ 0.05.
Remotesensing 16 01425 g008
Disclaimer/Publisher’s Note: The statements, opinions and data contained in all publications are solely those of the individual author(s) and contributor(s) and not of MDPI and/or the editor(s). MDPI and/or the editor(s) disclaim responsibility for any injury to people or property resulting from any ideas, methods, instructions or products referred to in the content.

