Article

Detection of Typical Forest Degradation Patterns: Characteristics and Drivers of Forest Degradation in Northeast China

1
State Key Laboratory of Urban and Regional Ecology, Research Center for Eco-Environmental Sciences, Chinese Academy of Sciences, Beijing 100085, China
2
University of Chinese Academy of Sciences, Beijing 100049, China
3
Institute of International Rivers and Eco-Security, Yunnan University, Kunming 650091, China
4
Baotou Teachers’ College, Inner Mongolia University of Science & Technology, Baotou 014030, China
*
Author to whom correspondence should be addressed.
Remote Sens. 2024, 16(8), 1389; https://doi.org/10.3390/rs16081389
Submission received: 19 February 2024 / Revised: 3 April 2024 / Accepted: 11 April 2024 / Published: 14 April 2024

Abstract

:
The accurate identification of forest degradation and its driving factors is a prerequisite for implementing high-quality forest management. However, distinguishing degradation patterns is often neglected in large-scale forest quality assessments. The indicators were constructed to identify typical forest degradation patterns using remote sensing indexes, followed by an analysis of the spatiotemporal dynamics of forest degradation and quantification of the contributions from various driving factors. The results indicated that the constructed indicators could effectively distinguish typical forest degradation patterns, with a fire degradation identification accuracy of 90.0% and a fitting accuracy of drought and pest degradation higher than 0.7. The cold temperate conifer forest zone had the largest proportion of fire degradation, accounting for 67.7% of the area, and totals of 99.0% of the subtropical evergreen broadleaf forest zone and 92.8% of the temperate conifer and broadleaf mixed forest zone were moderately to severely affected by drought, with long-term stability. Additionally, 0.1% of the temperate grassland region and 0.1% of the cold temperate conifer forest zone underwent severe pest infestations, with a long-term stable trend. Meteorological factors were the primary contributors to all typical degradation patterns, accounting for 81.35%, 58.70%, and 82.29%, respectively. The research developed an index for assessing forest degradation and explained the importance of natural and anthropogenic factors in forest degradation. The results are beneficial for the scientific management of forest degradation and for improving forest management efficiency.

1. Introduction

Forests are the largest terrestrial ecosystems and are an integral part of the biosphere, playing a crucial role in global material cycling and energy flow [1]. They provide important ecological services, such as nitrogen fixation, oxygen release, water conservation, and soil retention [2]. However, forest degradation has become a significant environmental issue worldwide, with major degradation patterns that include forest fires, droughts, pest infestations, and wind damage [3,4]. Forest degradation impairs forest structure and functionality [5], even when it is not represented by a reduction in forest area [6], and also leads to a loss of biodiversity, weakened material cycles, and a reduction in ecosystem services [7]. Therefore, accurately identifying forest degradation and exploring its influencing factors play a crucial role in forest management and ecological restoration, promoting fine forest management and enhancing human well-being.
Forest degradation can be identified through in situ surveys or remote sensing. In situ surveys provide accurate information [8], but they are limited by human and material resources, making it challenging to meet the requirements of large-scale, frequent forest-quality monitoring and precise and effective forest protection and restoration [9]. Remote sensing utilizes the physical, morphological, and biochemical features of vegetation to identify forest degradation. These mainly include canopy gap, canopy height, vegetation index, forest fragmentation [10], aboveground biomass [11], and logging and agricultural activities [12]. The identification algorithms of forest degradation include classification comparison, direct analysis, time-series analysis, and deep learning methods [13]. The development of remote sensing technology has made large-scale forest degradation assessments possible, and it has been widely applied in various fields [14,15,16].
Different forest degradation patterns exhibit significant differences in external manifestation. However, traditional remote sensing methods for identifying forest degradation typically use a unified index, which cannot represent multiple degradation patterns [6,17], resulting in a lower accuracy of forest degradation assessment [5,6]. Different forest degradation patterns also have a different quality dynamic process, which results in different degradation response times [18]. For example, forest fires cause an immediate deviation from the natural variation range of the land surface temperature (LST)/enhanced vegetation index (EVI) ratio, whereas forest pest outbreaks deviate gradually from the natural variation range as the infestation spreads [16]. The forest ecosystem is a dynamic system composed of multiple nonlinear features, and there is a complex mapping relationship between identification indicators and degradation patterns. For instance, forest fires and logging activities both result in the rapid opening of the forest canopy [5], and broad-leaved forests can germinate again in the year of an insect infestation, which causes the vegetation index to fluctuate [19]. In addition, the major driving factors and their contributions vary with the forest degradation pattern, and inaccurate identification can mislead management and restoration planning. However, the existing research on forest degradation identification has rarely considered the difference between degradation patterns.
To identify the major patterns of forest degradation accurately and apply them to high-quality forest management and restoration assessments, this study chose the forest ecosystems in northeast China as the subject. Utilizing multiple years of remote sensing data, this study had the following objectives: construct and validate identification indicators for different forest degradation patterns, use the constructed indicators to identify the spatiotemporal dynamics of forest degradation, and identify and quantify the driving factors for each degradation pattern and propose corresponding management measures. These results provide support for the accurate identification of forest degradation and offer detailed strategies for forest degradation management.

2. Materials and Methods
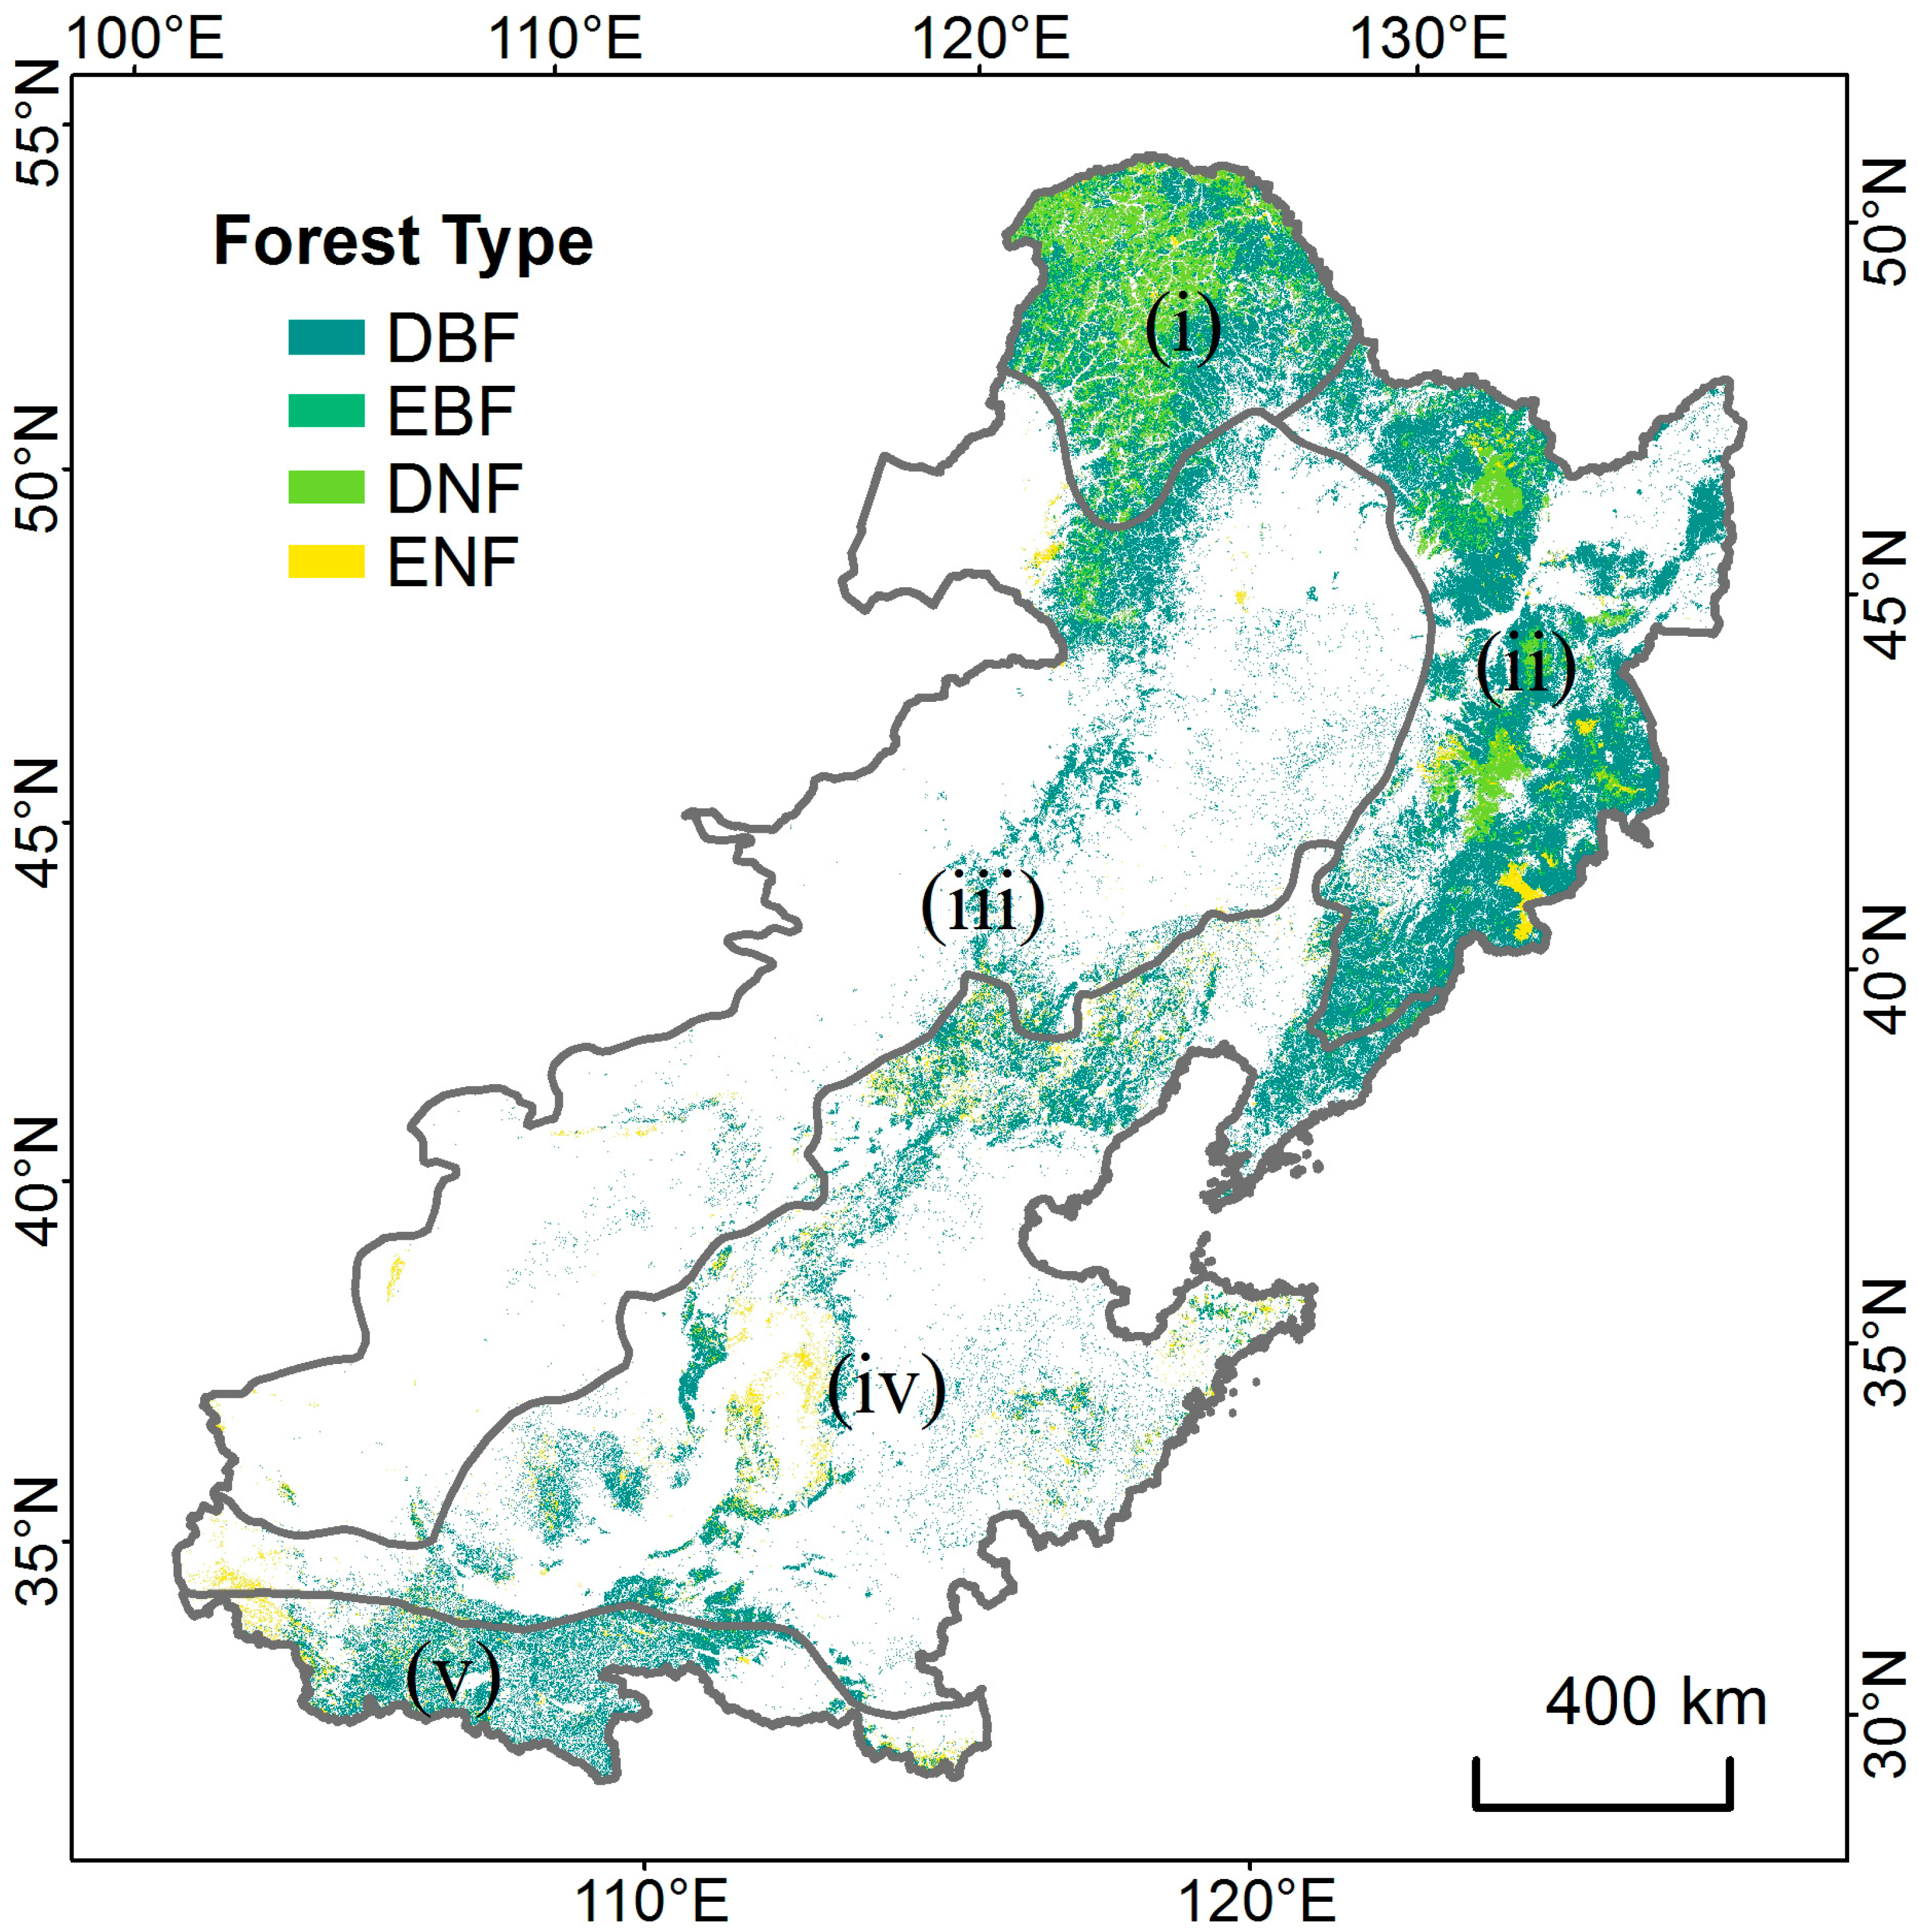
2.1. Study Area

With a large area of natural secondary forest, the northeast forest region (Figure 1) is the largest forest region in China, accounting for one-third of the total national forest area [20]. It has a temperate monsoon climate with concurrent rainfall and heat [21]. The average annual precipitation is 543 mm, and the average annual temperature is 6.3 °C. The northeast forest region provides various ecosystem services, such as water conservation, soil retention, and climate regulation, thus playing a vital role in the national ecological security framework [22]. In addition, it is an important carbon sink, contributing more than 20% of China’s forest carbon sequestration [23]. To protect and enhance the ecological services of the northeast forest area and improve the regional ecological environment, a series of ecological restoration projects have been implemented. These include the Three-North Shelterbelt Project, Natural Forest Conservation Project, and Beijing–Tianjin Sand Source Control Project [24]. According to the classification by Fang et al. [25], the study area encompasses five vegetation zones, e.g., a cold temperate conifer forest zone (i), temperate conifer and broadleaf mixed forest zone (ii), temperate grassland region (iii), warm temperate deciduous broadleaf forest zone (iv), and subtropical evergreen broadleaf forest zone (v) (Figure 1). The main patterns of forest degradation that occur in the northeast forest region include fire, drought, and pest infestation [22]. With climate change, the frequency and intensity of forest degradation is expected to increase [26].

2.2. Data Sources

2.2.1. Remote Sensing Index and Driving Factors

This study aimed to capture the different biophysical changes in forest ecosystems caused by different degradation patterns. Remote sensing indicators were utilized to detect these changes and identify typical forest degradation. Fire reduces vegetation density and increases surface temperature [28]. To identify forest degradation caused by fire, the land surface temperature (LST) and enhanced vegetation index (EVI) were adopted. Drought leads to vegetation water stress and reduces the cooling effect of vegetation [29]. To identify forest degradation due to drought, the LST and normalized difference water index (NDWI) were selected. Pest infestations damage vegetation leaves and alter leaf color [30]. To identify forest degradation caused by pests, the ratio vegetation index (RVI) and EVI were used. In addition, meteorological, topographical, soil, vegetation, and human activity factors, usually used for vegetation growth analysis, were selected to analyze the driving factors of forest degradation. For detailed information about the data and a description of each variable, please refer to Table 1.

2.2.2. Field Validation Data

From July to August 2021, a forest survey was carried out in the study area. Before conducting field surveys, the main types of forest degradation and relevant remote sensing indices were identified through literature review and data screening. Subsequently, forest conditions were evaluated using remote sensing indices, and potential sampling points were preliminarily selected based on factors (Table 2) such as the degree of forest degradation, stand structure, climatic zone, and accessibility. Alternate points were retained for further consideration. During field surveys, adjustments were made to the initial selection of points based on actual field conditions to ensure that the samples adequately represented typical degradation areas and covered different vegetation belts, thereby maintaining the diversity and uniformity of sampling. Prior to the measurements, 500 × 500 m aerial imagery of the target plots was acquired using the DJI Mavic 2 Pro unmanned aerial vehicle (DJI, Nanshan District, Shenzhen, China), and three representative subplots (30 × 30 m) were selected within each plot. The LAI-2000 Plant Canopy Analyzer (LI-COR Biosciences, Lincoln, NE, USA) was used to measure the leaf area index (LAI) with the cross method to verify the degree of degradation. The average LAI of the subplots was considered to be the measured value for each plot. The supplementary material (Table S1) shows the details of the field survey data.

2.3. Construction of the Degradation Index

2.3.1. Fire-Induced Indicator

Mildrexler et al. [16] developed the MODIS Global Disturbance Index (MGDI), which captures the process of surface temperature rise triggered by forest fires. The surface temperature increases with the decrease in vegetation density [28]. During forest fires, the forest canopy cover decreases, causing a larger proportion of the incident solar energy to be transferred as heat flux, resulting in an immediate increase in surface temperature [41]. The ecosystem disturbance index is constructed as follows:
DI F = LST max / EVI max   post current   year   ( y ) LST max / EVI max   post multi - mean   ( y 1 )
where DI F represents the value of the ecosystem disturbance index, LST max corresponds to the maximum synthesized surface temperature (°C) in a year, EVI max   post refers to the maximum vegetation index value after the occurrence of the maximum synthesized surface temperature in a year, “ current   year   ( y ) ” represents the year of disturbance detection, and “ multi - mean   ( y 1 ) ” denotes the average value of multiple previous years LST max / EVI max   post .
Wu et al. [42] established a 65% threshold for identifying areas affected by fires, aiming to mitigate the potential impacts of delayed recovery on subsequent fire disturbance detection. This study adopts the same threshold as the criterion for determining fire occurrence. The calculation method is as follows:
DI FC = 0 MGDI y MGDI y 1 MGDI y 1 0.65 1 MGDI y MGDI y 1 MGDI y 1 > 0.65
where D I FC represents the annual change rate of the disturbance index, MGD I y corresponds to the disturbance index value in the current year of disturbance detection, and MGD I y 1 represents the disturbance index value from the previous year before disturbance detection. Based on pixel-level statistical methods and the literature, a disturbance index change rate greater than 65% is indicative of fire occurrence.

2.3.2. Drought-Induced Indicator

In comparison to the rate of forest wildfires, the change in forest drought has a slower pace. Based on the significant cooling effects of canopy shading and leaf transpiration cooling [29], as well as the observed leaf dryness after a forest drought, this study drew on the non-instantaneous disturbance recognition model [16] and constructed a forest drought monitoring index using the LST and NDWI:
DI D = LST max / NDWI max current   year   ( y ) LST max / NDWI max multi - mean   y 1
where DI D represents the forest drought index, LST max denotes the maximum temperature in the given year, and NDWI max represents the maximum NDWI in the given year.

2.3.3. Insect-Induced Indicator

Forest pest infestations and forest drought both fall under the category of non-instantaneous degradation [16]. Pest infestations in forests cause leaf defoliation and discoloration, which can be captured with satellite remote sensing [30]. Therefore, the EVI and RVI, which are correlated with leaf area and color change [30,43], were selected to represent pest infestation. The calculation method is as follows:
DI I = RVI 1 max / EVI max current   year   ( y ) RVI 1 max / EVI max multi - mean   y 1
where DI I represents the forest pest index, RVI 1 max refers to the ratio of the near-infrared and red-light spectral bands in the given year, and EVI max represents the EVI in the given year.

2.4. Spatiotemporal Characteristics of Forest Degradation

In the analysis of the spatial characteristics of forest degradation, in the case of fire, the DIFC accumulated over the years was used for classification: no fire (ΣDIFC = 0, No), single fire (ΣDIFC = 1, One), and multiple fires (ΣDIFC > 1, More). Drought, pests, and diseases were quantified using the standardized average value of the multi-year degradation indicators (standardized to 0–1). To facilitate the comparison, the results were multiplied by 100 and graded as mild, moderate, or severe degradation (Table 3). Considering the temporal characteristics of forest degradation, the least-squares method was used to calculate the DI trend changes for fire, drought, and insect pests, and the change trends of the three disturbance types were classified according to their significance (see Table 3).

2.5. Analysis of Factors Driving Forest Degradation

The article converted raster data into vector points and extracted response variables and predictor values. The degradation response variables were then categorized as 1 ( DI FC > 0.65 or DI D ,   DI I > 1 ) or 0 ( DI FC   0.65 or DI D ,   DI I   1 ), followed by a boosting regression tree (BRT) analysis. This study utilized the boosted regression tree method to examine the driving factors behind forest degradation, a technique that obviates the need for prior data transformation or outlier removal and adeptly fits complex nonlinear relationships while concurrently managing interactions among predictor variables [44]. Widely utilized in ecological research [44], the BRT method was chosen because of its ability to effectively model intricate ecological processes. Before analyzing the driving factors, all influencing variables were assessed for collinearity using the variance inflation factor (VIF), and only variables with a VIF < 5 were retained to address multicollinearity concerns [45].

3. Results

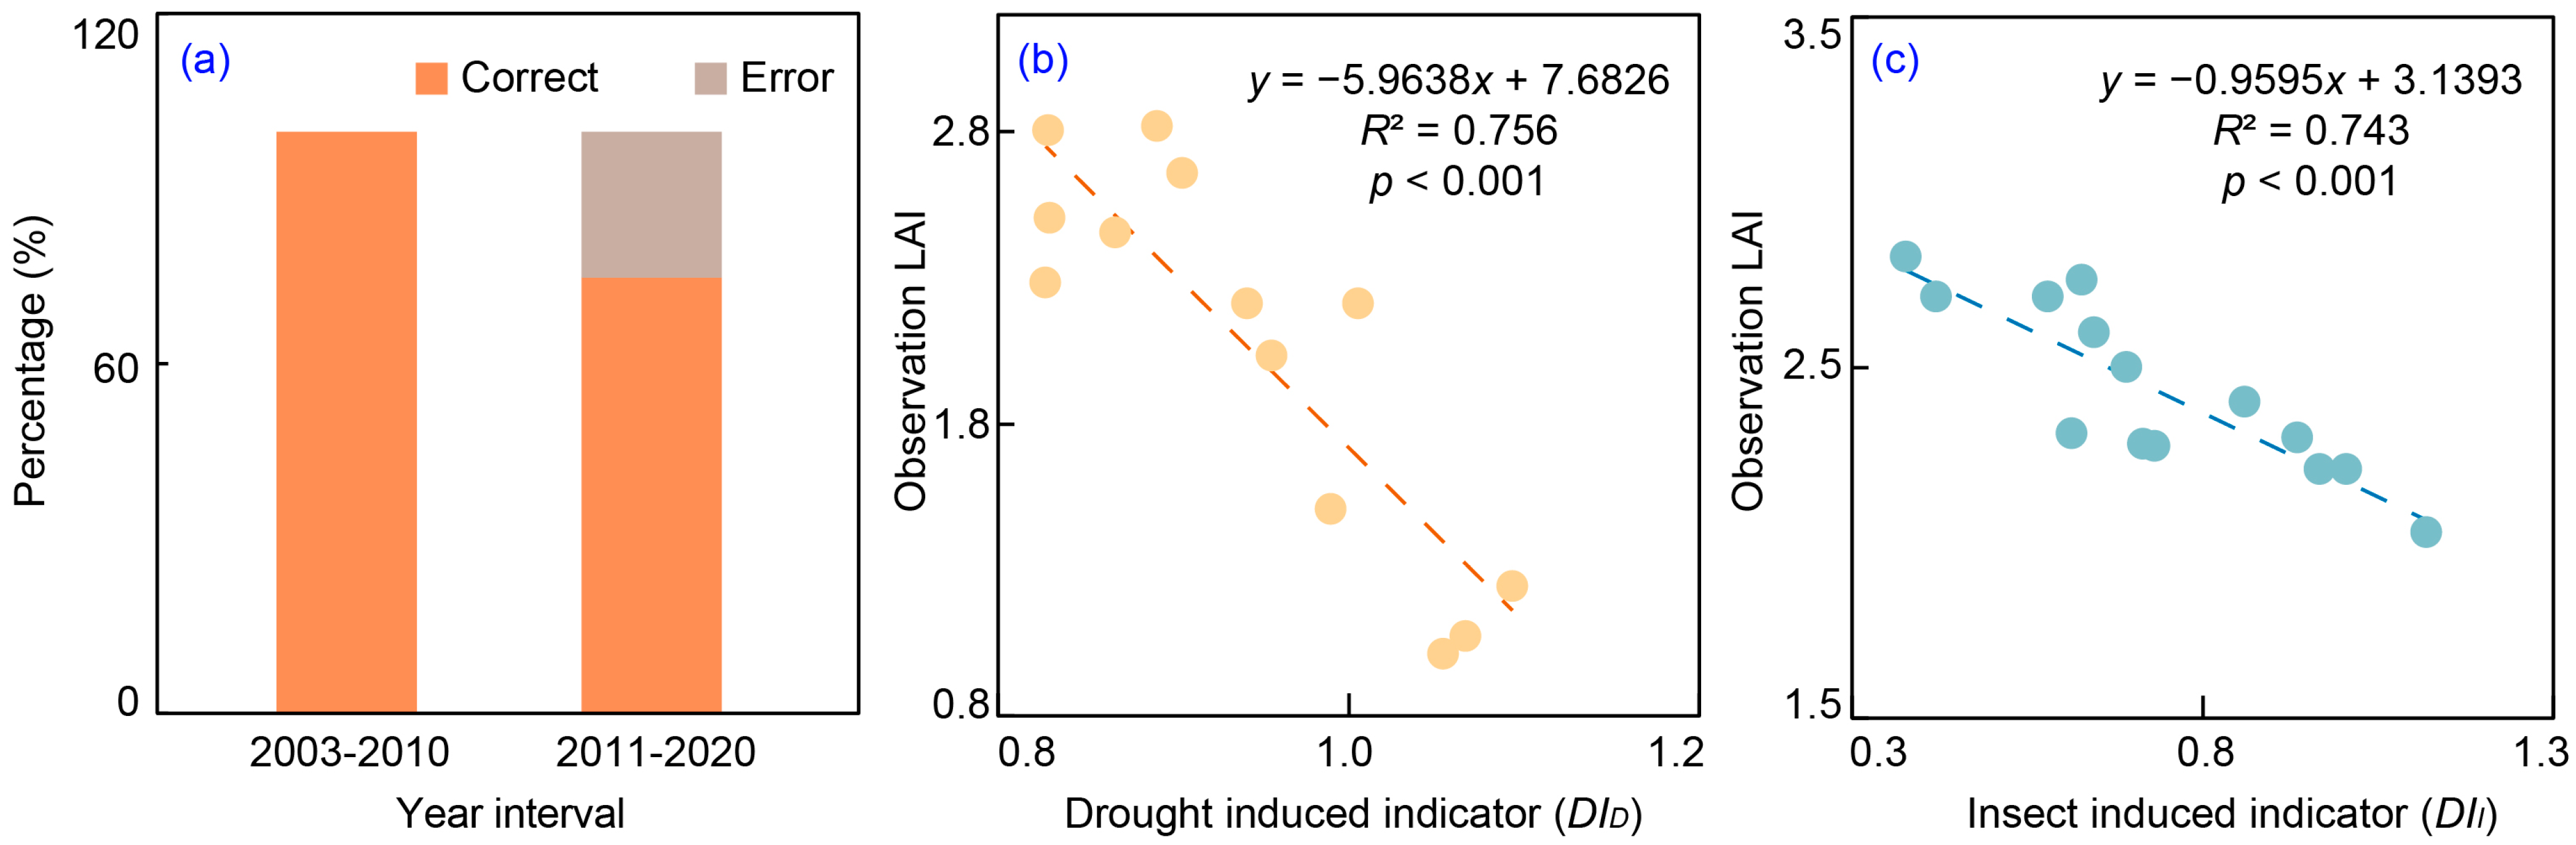
3.1. Index Validation

Figure 2 presents the accuracy evaluation of the forest degradation index, indicating that the index constructed for this investigation accurately reflects the actual situation. The correspondence between the threshold-based identification of forest fires and the field surveys was 90.0%. Specifically, the accuracy of the identification of forest fires from 2003 to 2010 was 100%, whereas the accuracy from 2011 to 2020 was 83.3%. The fitting accuracy of the forest drought index to the field survey LAI was 0.756 (p < 0.001, n = 13), and the fitting accuracy of the forest pest index was 0.743 (p < 0.001, n = 14).

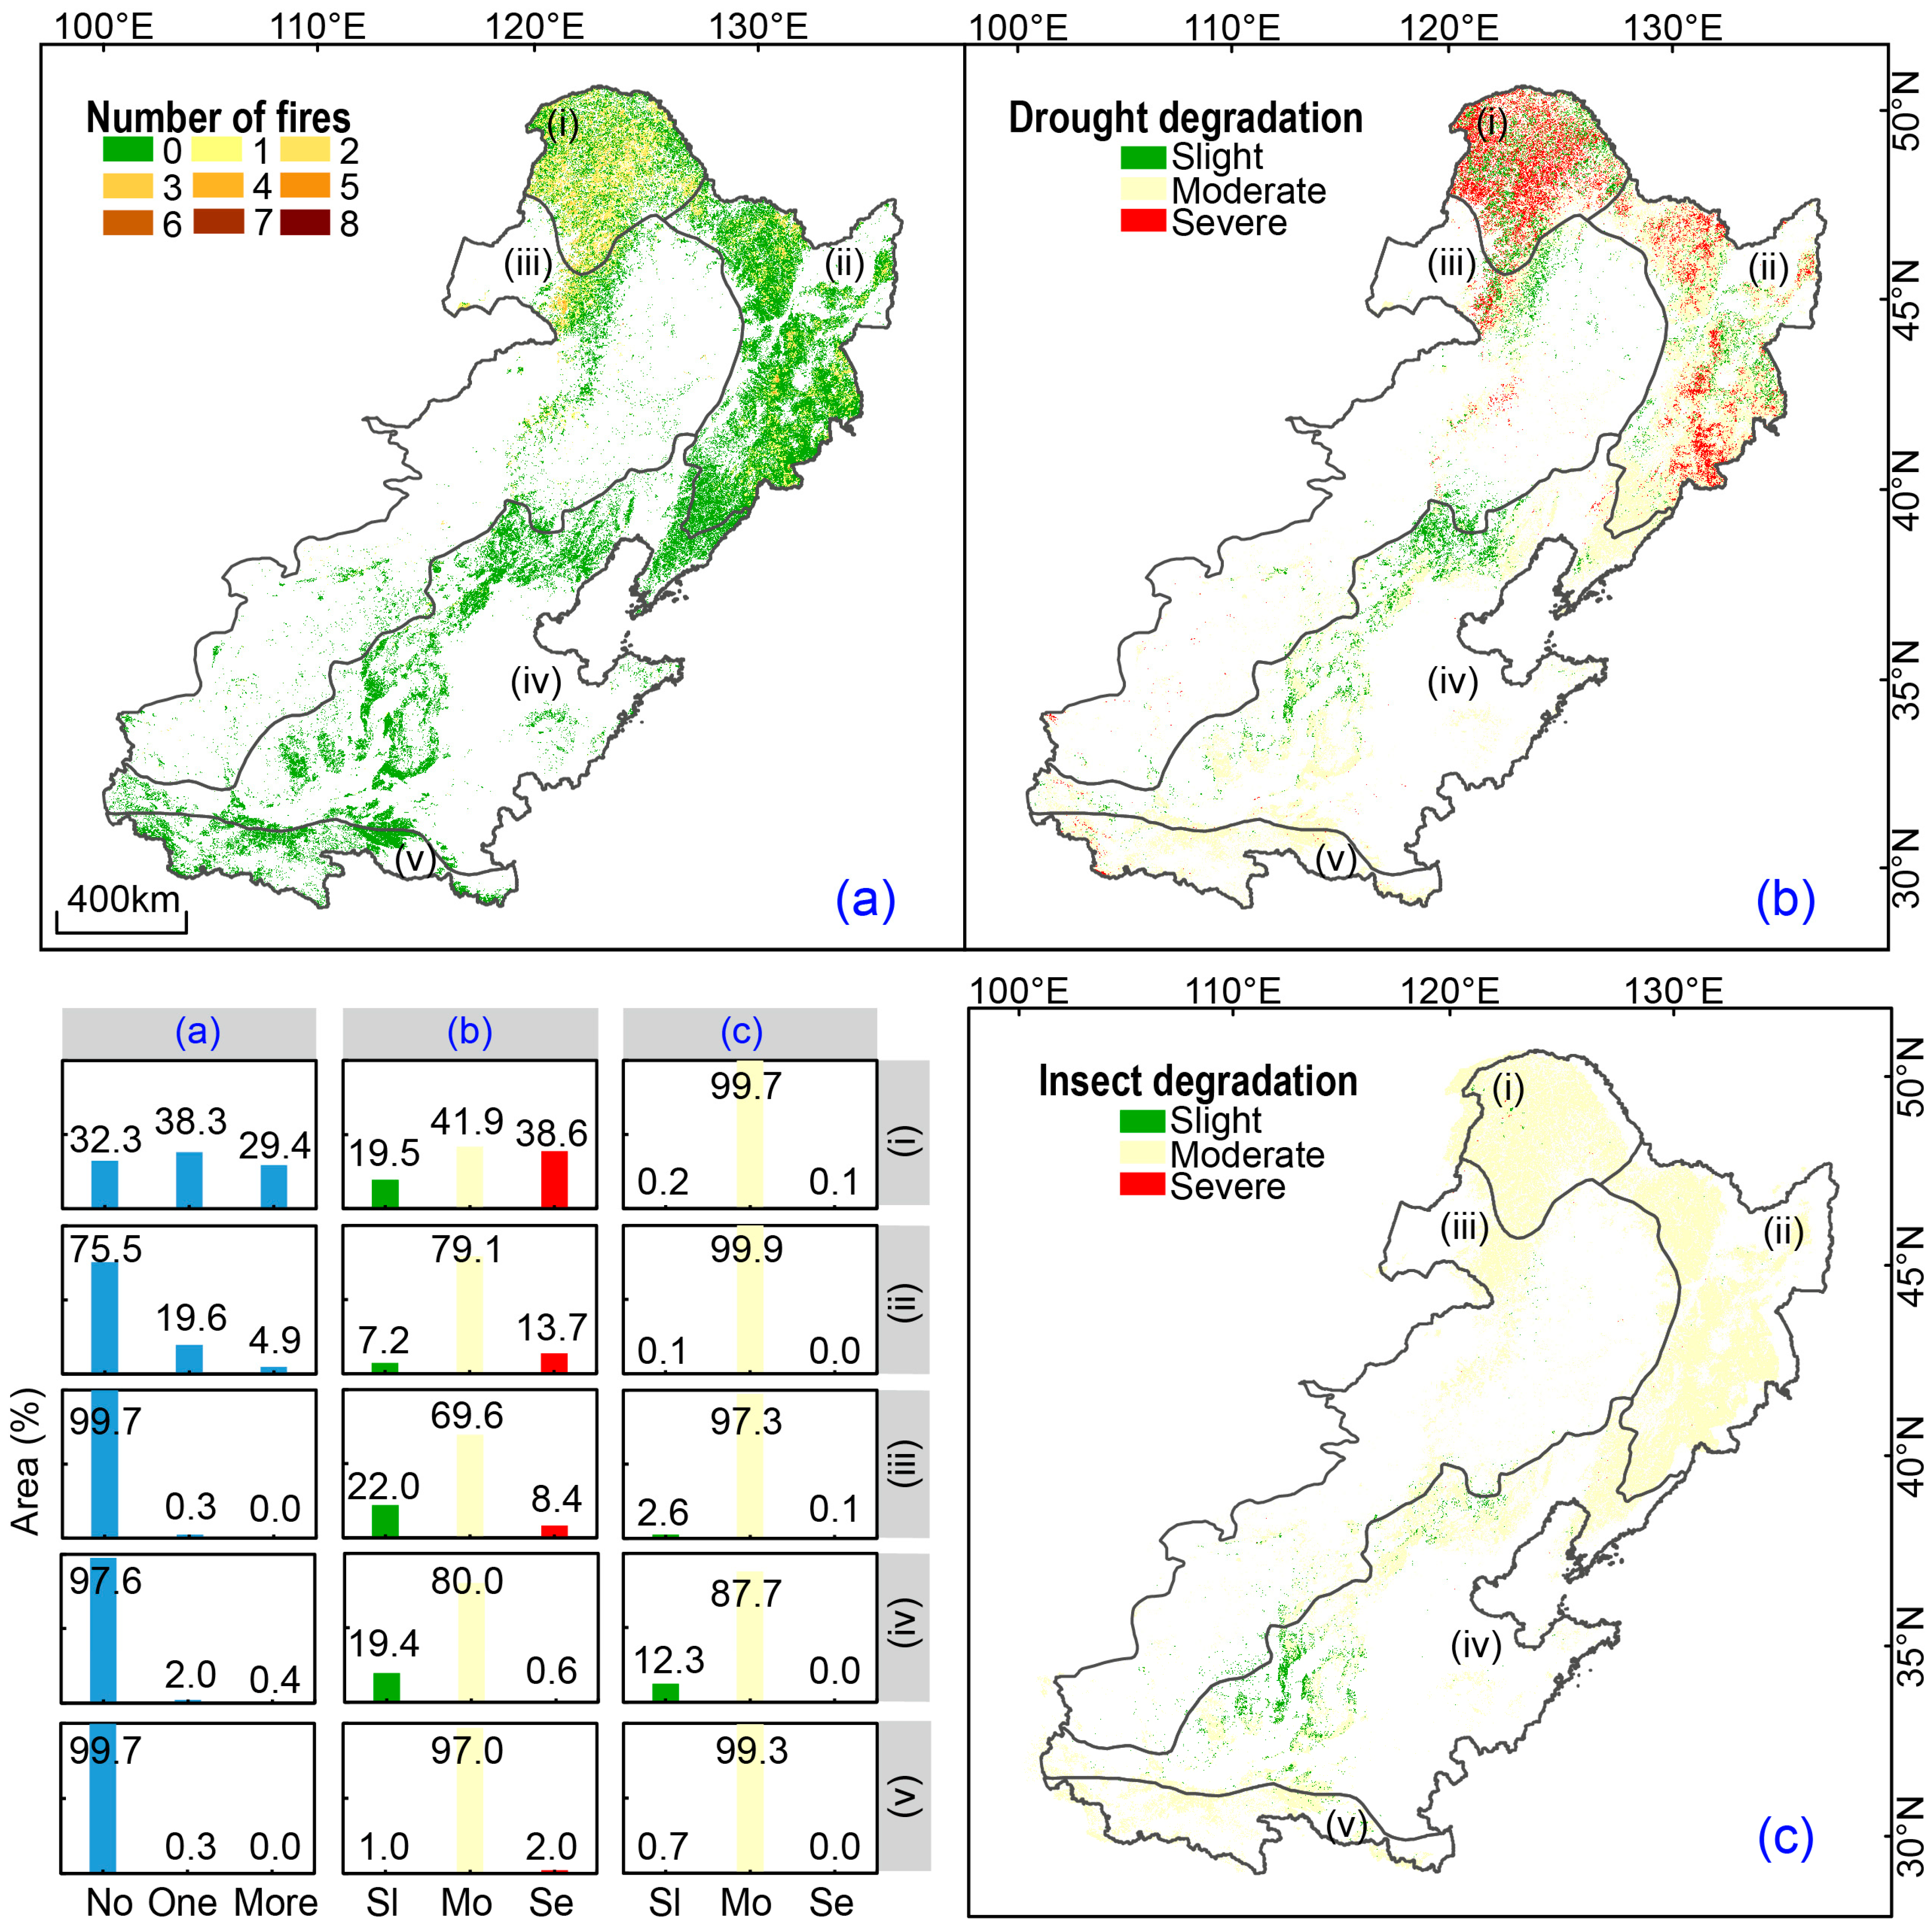
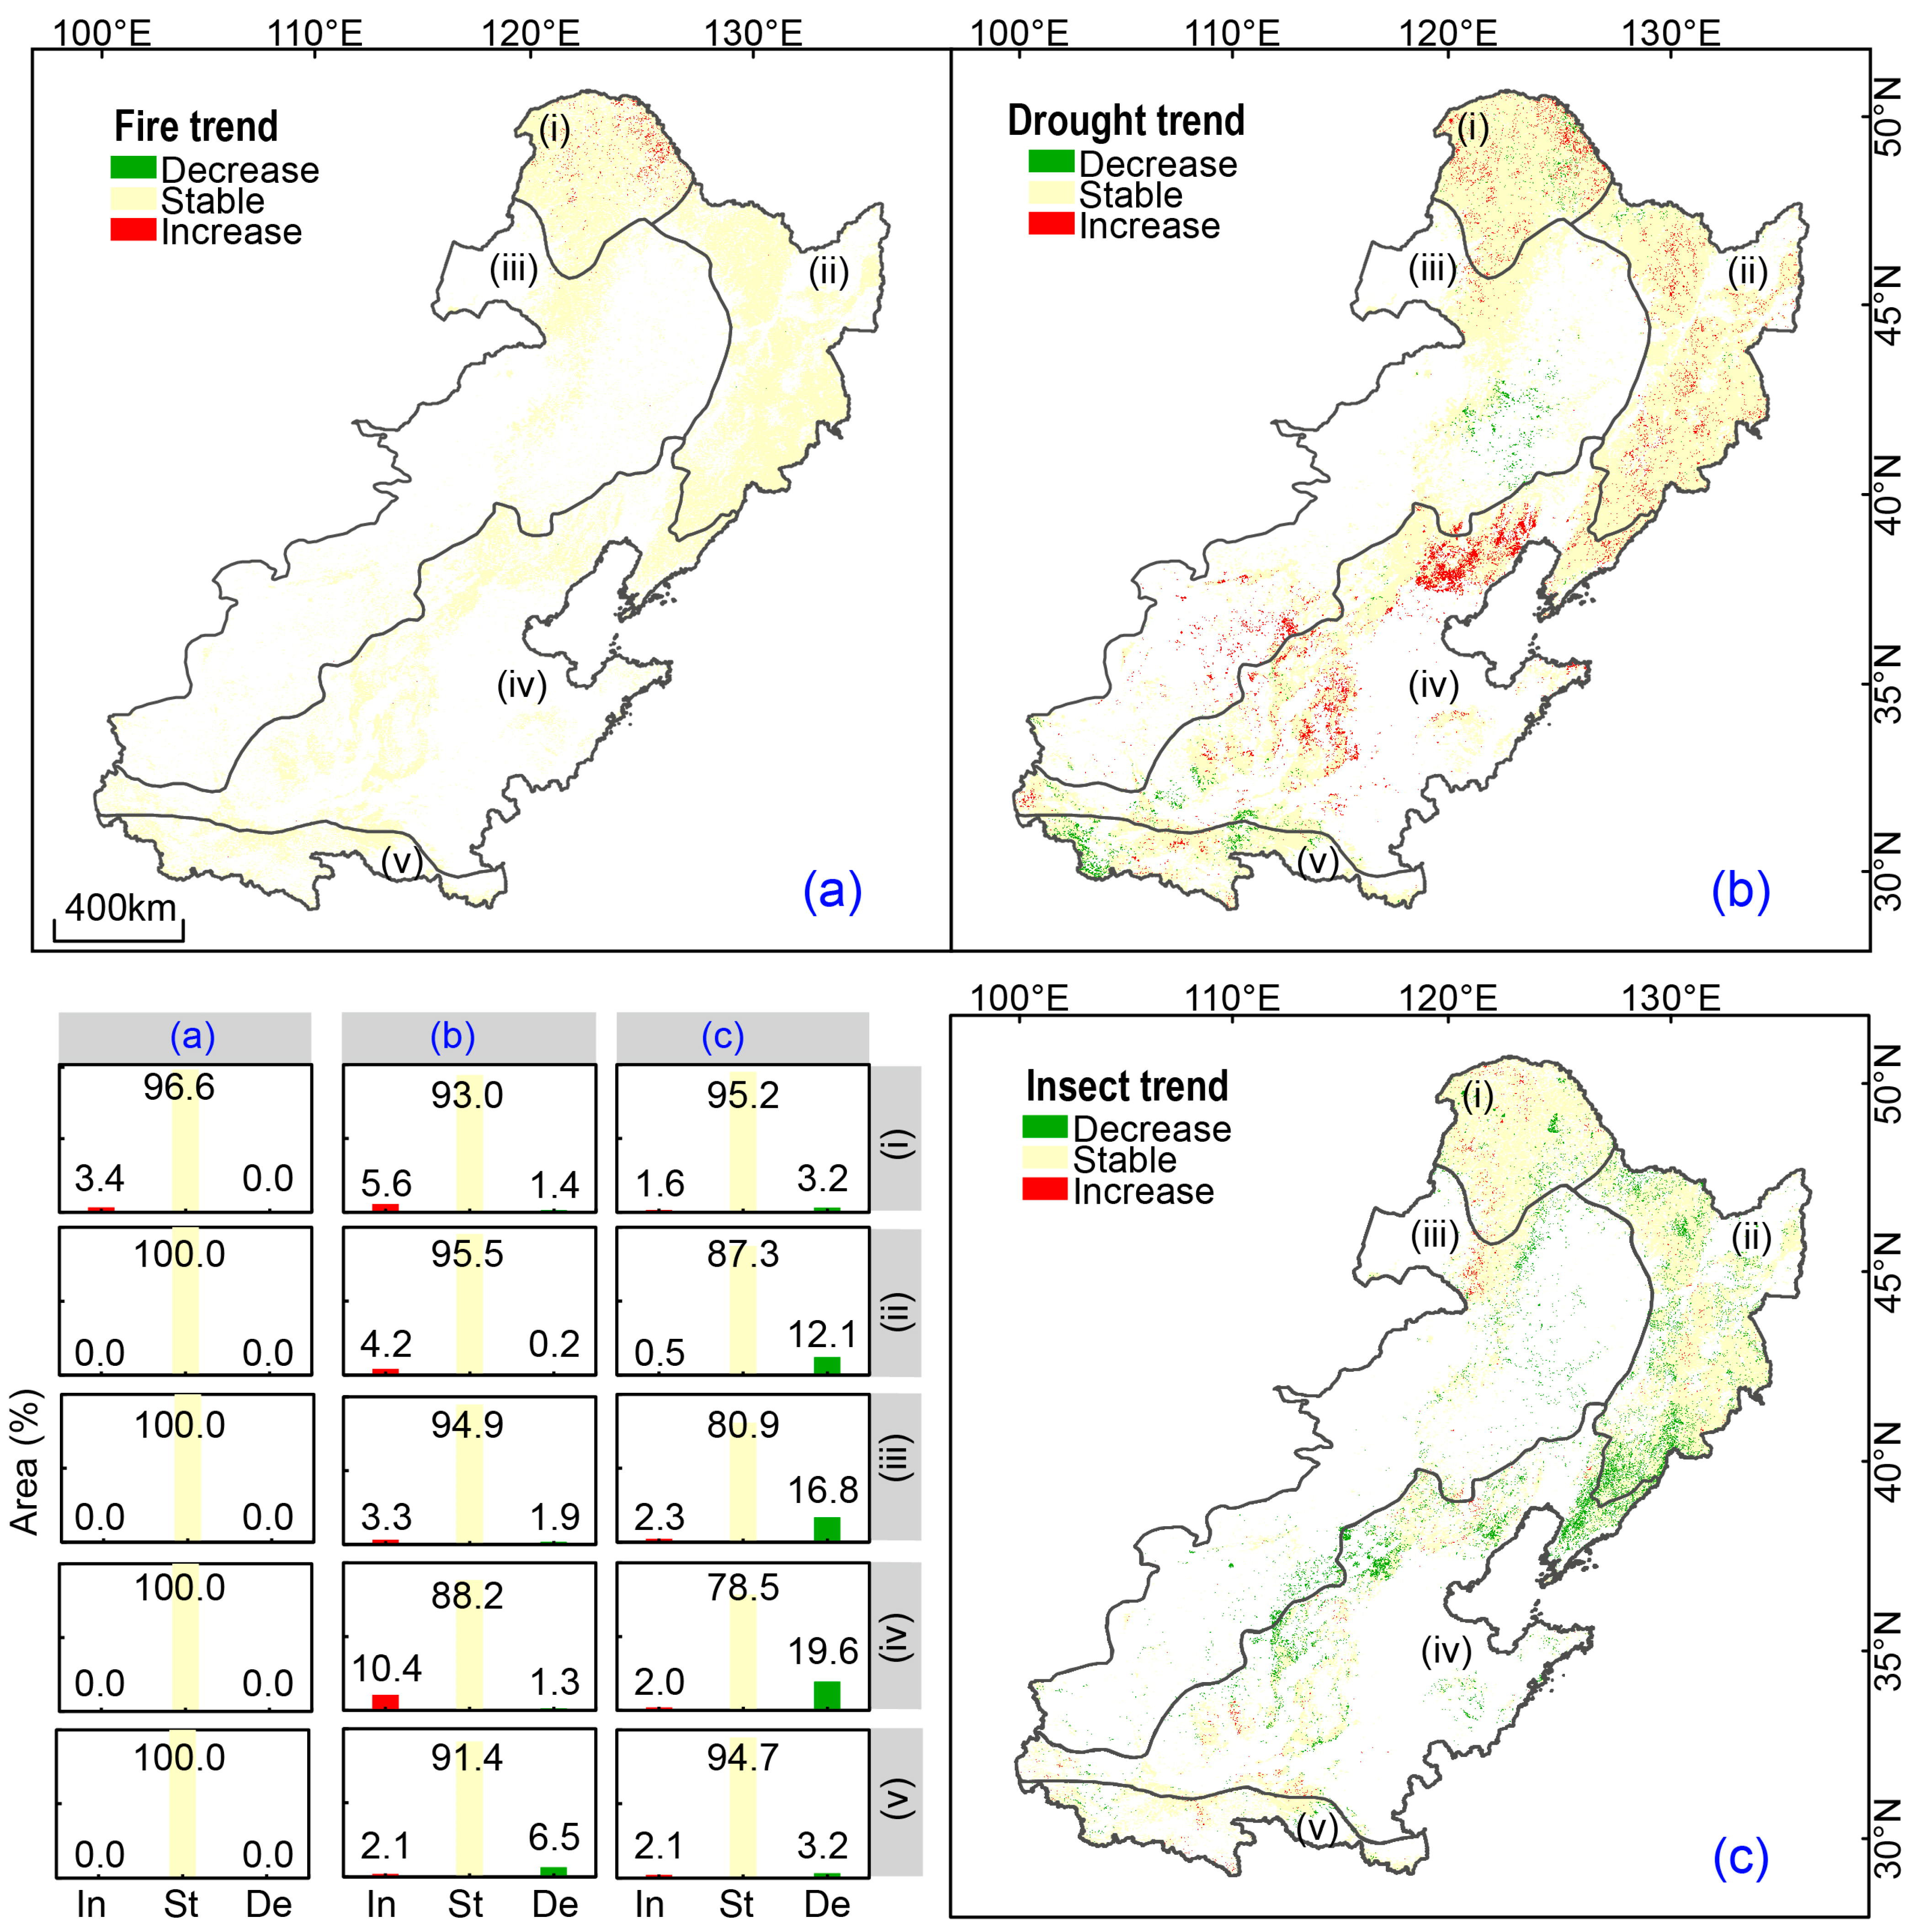
3.2. Spatiotemporal Characteristics of Forest Degradation

The three forest degradation patterns exhibited spatial heterogeneity. The spatial distribution of forest fires was uneven, with fires occurring predominantly in the northern region. The proportion of forest areas affected by fires or repeated fires was higher in the northern region than in the southern region. In the cold temperate conifer forest zone, 67.7% of the forest area had experienced fire, with 29.4% having experienced multiple fires. The proportion of forest fires in the temperate conifer and broadleaf mixed forest zones was lower than that in the cold temperate conifer forest zone, but the occurrence of forest fires was still relatively high at 24.5%, with 4.9% having experienced multiple fires; both of these proportions were higher than those in the other forest zones (Figure 3a). Forest droughts are predominantly moderate and spatially distributed in the subtropical evergreen broadleaf forest zone, warm temperate deciduous broadleaf forest zone, and temperate conifer and broadleaf mixed forest zone, with proportions ranging from 79.1% to 97.0%. The temperate grassland zone had the highest proportion of mild drought, reaching 22.1%, and the cold temperate conifer forest zone had the highest incidence of severe drought at 38.6% (Figure 3b). Forest pest infestations had mostly moderate intensity and were spatially distributed across the cold temperate coniferous forest zone, temperate conifer and broadleaf mixed forest zone, and subtropical evergreen broadleaf forest zone, with proportions between 99.3% and 99.9%. The warm temperate deciduous broadleaf forest zone had the highest proportion of mild pest infestations, at 12.2%, while severe infestations were relatively rare, ranging from 0.0% to 0.1%, and mainly occurred in the cold temperate conifer forest zone and temperate grassland region (Figure 3c).
Through the past two decades, the trend of the degradation index for forest fires remained largely stable, with only 3.4% of the cold temperate conifer forest zone showing an increasing trend in forest fire disturbance (Figure 4a). The trend of forest drought was predominantly stable, spatially concentrated mainly in the warm temperate deciduous broadleaf forest zone, temperate grassland region, and cold temperate conifer forest zone, with proportions ranging between 93.0% and 95.5%. The subtropical evergreen broadleaf forest zone exhibited the highest percentage decrease in drought trend, reaching 6.5%; the warm temperate deciduous broadleaf forest zone showed the highest percentage increase in drought trend, reaching 10.4% (Figure 4b). The trend of forest pest infestation was primarily stable and spatially distributed across the cold temperate conifer forest zone, subtropical evergreen broadleaf forest zone, and temperate conifer and broadleaf mixed forest zone, with proportions between 87.3% and 95.2%. The warm temperate deciduous broadleaf forest zone had the highest percentage decrease in pest infestation trend, at 19.6%, and the temperate grassland region had the highest increase in pest infestation trend, at 2.3% (Figure 4c).

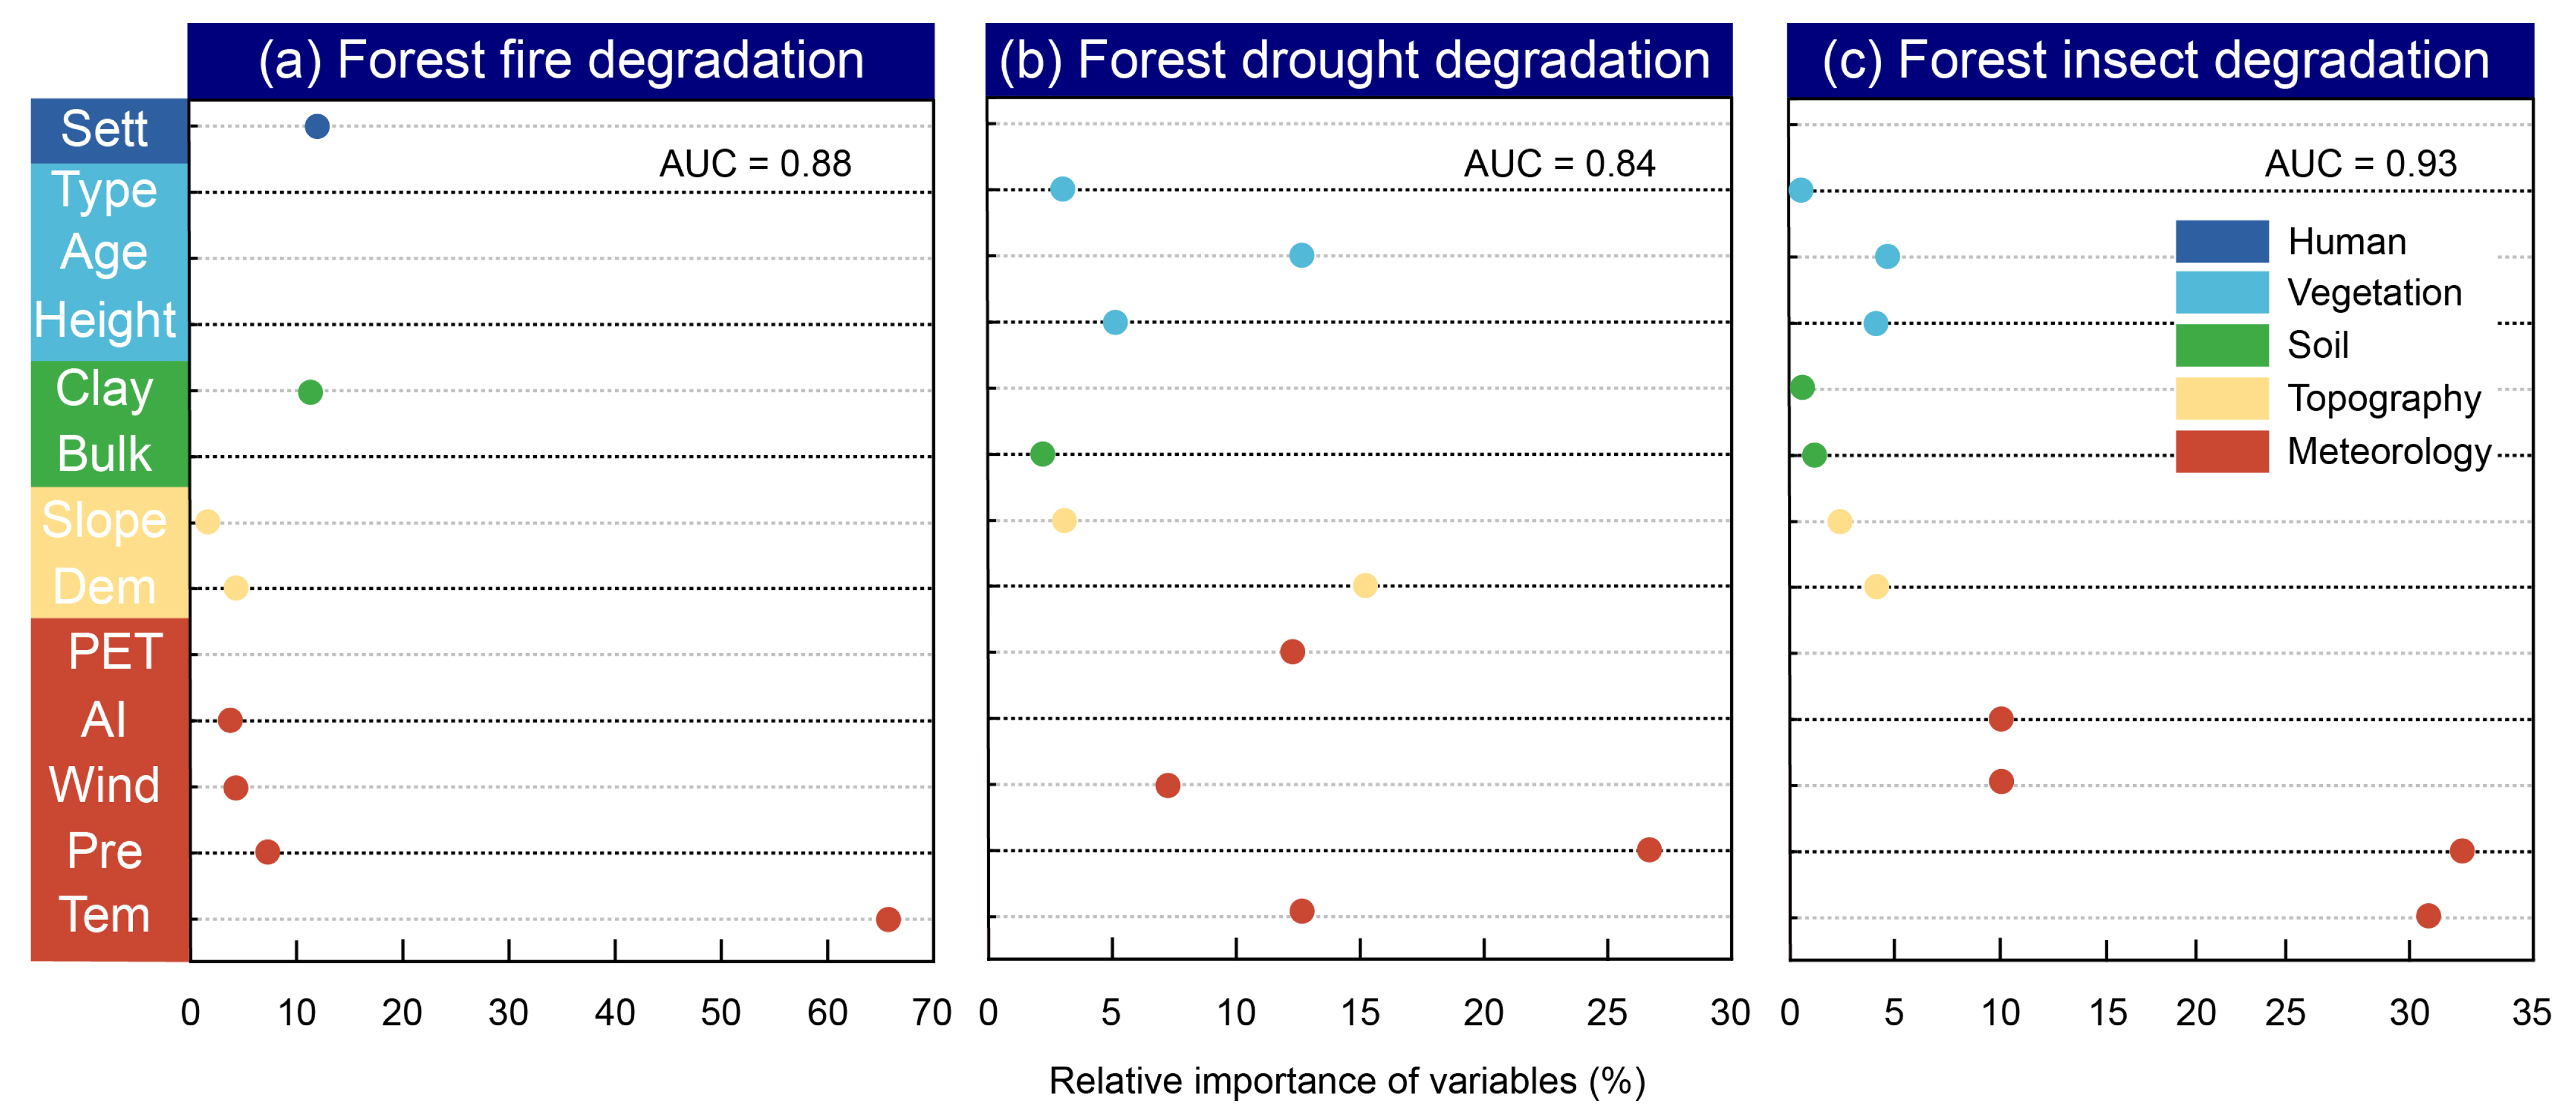
3.3. Drivers of Forest Degradation

The area under the curve (AUC) values for the models for analysis of the driving factors of the three degradation patterns were all greater than 0.8 (Figure 5). An examination of the types of influencing factors showed that meteorological factors (81.35%) were the primary contributors to forest fire degradation, followed by anthropogenic factors (11.94%), topographic factors (5.17%), and forest characteristics (1.55%) (Figure 5a). In terms of specific influencers, temperature (65.82%) had the most significant impact on forest fire degradation, followed by distance to residential areas (11.94%). For drought, meteorological factors (58.70%) were the main influencing factors of forest degradation, followed by forest characteristics (20.83%), topographic factors (18.27%), and soil factors (2.21%); precipitation (26.67%) had the greatest impact on drought degradation, followed by elevation (15.26%), forest age (12.67%), temperature (12.59%), and potential evapotranspiration (12.21%) (Figure 5b). In the case of pest infestation, meteorological factors (82.29%) were the main explanatory variables for degradation due to forest pests, followed by forest characteristics (9.30%), topographic factors (6.53%), and soil factors (1.88%) (Figure 5c). Among these, precipitation (31.81%) had the largest impact on pest-induced forest degradation, followed by temperature (30.29%), aridity (10.15%), and wind speed (10.04%).

4. Discussion

4.1. Distinguishing Different Degradation Patterns Using Indicators Constructed Based on Different Remote Sensing Indicators

Based on the relationship between degradation patterns and forest ecosystem characteristics, this study utilized corresponding remote sensing indicators to identify three main forest degradation types in northeast China. Remote sensing techniques are used to identify forest fires through active fire detection, vegetation anomalies, and forest-fired area. The former method uses the threshold of the temperature–vegetation index (LST–NDVI) changes to determine the occurrence of fire [46]. The latter method uses indicators, such as the burn area index (BAI) [47], normalized burn ratio (NBR) [48], and normalized difference fire index (NDFI) [49], to identify forest fires, resulting in identification accuracies of 82–94%. The results of fire identification (Figure 2a) were superior to most of the previous identification accuracies.
Vegetation drought monitoring typically involves the relationship between vegetation response to temperature and water content. Commonly used indicators include the temperature vegetation dryness index (TVDI) [50,51] and the vegetation temperature condition index (VTCI) [52]. In this study, a drought index was constructed based on temperature and vegetation canopy water content. It not only adheres to the basic principles but is also sensitive to the change in moisture content [53,54]. The index showed an improved fit with field survey data (Figure 2b), which is higher than the accuracy of the previous research of 0.558–0.721 [50,51,52].
Research progress in the area of forest pest infestations has been slow due to the diversity of insect types and their relationships. Different pests cause various types of forest damage (canopy, bark, trunk, roots), which increases the difficulty of remote sensing identification [19]. Indicators that are commonly used to capture forest pest infestation include the NDVI [55], vegetation indicators, and others associated with vegetation status or the red band [56]. The forest pest index constructed in this study simultaneously uses vegetation status and the red band, while also considering the regrowth of the deciduous broadleaf forest after pest infestation [57]. In a recent study, the accurate monitoring of discolored standing trees affected by pine wilt disease was achieved by combining satellite remote sensing data with semi-supervised deep learning technology. The recognition accuracy ranged from 68.36% to 80.09% [58].The index demonstrated a good fit with the field survey data (Figure 2c).
The spatial distributions of forest drought and forest pest infestation identified had overlapping regions, which were confirmed through field surveys. Previous research has also found synchronous outbreaks of pest infestations and drought at the regional scale [59]. Forest drought and pest infestation exhibit synergistic impacts in terms of drought duration, drought intensity, and pest behavior. The simultaneous occurrence of drought and pest infestation makes forests more vulnerable and can even lead to extensive forest mortality [60,61].

4.2. Differences of Forest Degradation Patterns among Vegetation Zones

Previous research has indicated that forest fires occur at a higher rate in specific types of forests [62]. The findings indicate that the probability of fires in the boreal coniferous forest regions (Figure 3a) was significantly higher than in other areas, which can be attributed to the low water content, high oil content, and high flammability of the coniferous forest litter [63]. Moreover, inappropriate planting methods can increase the likelihood of forest fires [64].Additionally, the research found a decreasing trend in the area affected by forest fires across all vegetation zones (Figure 4a). Zhao et al. [65] similarly found a significant reduction in forest fire areas in China from 2003 to 2016. This indicates that the strict forest fire management measures implemented by the government after the Great Khingan Range Fire in 1987 led to a significant decline in forest fires [66].
For drought, previous studies have indicated that vegetation in northern China has exhibited significant drought stress during the growing season since the weakening of the East Asian Summer Monsoon (EASM) in the late 1970s [67,68,69]. Influenced by climate change, there is a trend of increasing consecutive extreme drought days in summer in the northeast region of China [70], which has widely affected the cold temperate conifer forest zone and the temperate coniferous and broadleaf mixed forest zone. The temperate grassland region, located in the semi-arid zone with annual precipitation below 400 mm [71], has a forest cover rate of less than 30% and has long been subjected to drought stress [72,73]. The research results also confirmed that forests were threatened by drought and spatially overlapped with previous studies (Figure 3b). Furthermore, over recent decades, the extent of warming in the northern regions of China has been higher than that in the southern regions, and a declining trend in precipitation near the northeastern transitional zone has been observed [74], leading to a reduced availability of water for vegetation and prolonged periods of drought stress.
Reports from the National Forestry Bureau of China indicate a diversity of harmful forest organisms in the country, including diseases, insects, rodents, and harmful plants [15], resulting in a high occurrence of forest pests. The study results also confirm the severity of forest drought in these regions (Figure 3c). Regional warming and increased effective accumulated temperatures have expanded the distribution range of forest pests. Mild winters are conducive to pest overwintering and extend the period of pest damage, leading to a higher severity of forest pests in the northern region [75]. In terms of trends, the severity of forest pest infestations has remained relatively stable over time (Figure 4c), which may be associated with the rapid increase in artificial forests in China. The relatively simple forest stand structures fail to enhance the resistance of forest ecosystems to disasters [15]. Against the backdrop of global warming and ecological afforestation projects, the risk of forest pest invasions is expected to increase [15].

4.3. Insights for Management Implications from Differences in Factors Driving Forest Degradation

Past research has indicated that meteorological, topographic, and anthropogenic factors play an essential role in driving forest fires [76]. Specifically, temperature and aridity are significantly negatively correlated with the moisture content of combustible materials, facilitating the occurrence of forest fires under warm and dry climatic conditions [14]. Studies have also shown that the distance between forests and infrastructure is a major factor influencing fire events, confirming that human activities increase the likelihood of fires [76,77]. Topographic factors affect the spread rate and probability of fires; steep slopes are conducive to the rapid spread of fire, whereas areas at higher elevations are less prone to fire [78]. Additionally, different soil types exhibit varying capacities to absorb and retain moisture, resulting in differences in surface humidity and affecting the spread of fires [79].
Drought is a major stressor for forest ecosystems, especially in the northern regions of China. Climate change has altered precipitation patterns, while the concurrent increase in temperatures has increased the duration and severity of droughts, resulting in reduced available water for vegetation and consequently forest droughts [80]. Topographic features such as slope strongly influence site moisture and also alter the availability of moisture in forests [81]. Additionally, vegetation characteristics play a crucial role in forest droughts. Although the relationship between tree age and height and drought is not yet clear [82], some studies have suggested that the root systems of smaller plants are more sensitive to changes in soil moisture [81] and that larger plants have higher water demands [83]. Additionally, forest responses to drought vary according to the composition of the forest. Compared to other forest types, broadleaf forests tend to react more quickly to drought, whereas mixed forests are less affected by drought [80].
Climate is considered a primary driver of the population dynamics of forest pests [84], particularly in dry and warm environments with higher larval survival rates, which augment pest population sizes [85,86,87]. Stand characteristics, such as tree age structure and planting density, are strongly correlated with forest pests, with appropriate age structures and densities enhancing the forest’s disease resistance [88]. A diversity of tree species can also increase the stability of forest ecosystems, thus mitigating the risk of large-scale pest outbreaks [87]. Terrain complexity also manifests ecosystem diversity. In complex terrains, the spread of pests is inhibited; in simple terrains, pest propagation is facilitated, leading to large-scale outbreaks [89]. Moreover, humid and fertile soil conditions are conducive to not only forest growth but also pest proliferation, with the rate of leaf litter fall in forest stands being 19% higher in humid and fertile areas than in humid and impoverished ones [90].
The precision management of forests requires the formulation of preventative and management measures tailored to different forms of degradation to enhance the efficiency of forest conservation and restoration. For protection against forest fires, regular monitoring of meteorological factors, with increased frequency in monitoring during years of climatic anomalies, is necessary. In addition, minimizing human disturbances to forest ecosystems [91,92], such as logging, agricultural activities, and pastoral activities, and deploying forest fire prevention facilities in areas of frequent human activity are crucial to mitigate the damage caused by wildfires. To protect against forest drought, the selection of forest thinning management practices can reduce stand basal area and density, alleviating long-term pressure from water resource competition and enhancing drought resistance [93,94] to cope with extreme drought events. High biodiversity has been proven to enhance ecosystem function and resilience [95,96,97]. In preventing forest pest infestations, forest management can enhance biodiversity by increasing species composition [87], selectively preserving forest structure during thinning measures [98], and retaining patches of different tree age classes [99].
The research findings can be applied in the following areas: identifying different types of forest degradation, the findings support the formulation of targeted restoration measures; accurately identifying the degree of forest degradation, the findings provide a basis for clarifying the priorities of forest management and restoration; quantifying the main driving factors of different degradation types, the findings offer evidence for the early warning and prevention measures of disasters.

5. Conclusions

Distinguishing forest degradation patterns and quantifying their degree are vital for the sustainability of forest ecosystems and for thoroughly investigating the driving factors of forest degradation. The results demonstrated that the constructed index was capable of accurately identifying instances of forest degradation; forest fires were predominantly found in the boreal coniferous forest belt, with meteorological factors accounting for 81.35% of the influences. The boreal coniferous belt and the temperate mixed needleleaf and broadleaf forest belts experienced severe droughts, which were exacerbated by meteorological (58.70%) and arboreal characteristics (20.83%), and topographical factors (18.27%). Moreover, forest pests were widespread, with meteorological (82.29%) and tree characteristics (9.30%) being the main factors triggering pest outbreaks. Future research should involve increasing the number of sampling points, improving the reliability and applicability of remote sensing indicators, and enhancing the application of research findings in the areas of forest management and conservation.

Supplementary Materials

The following supporting information can be downloaded at: https://www.mdpi.com/article/10.3390/rs16081389/s1, Table S1: Field survey data.

Author Contributions

Conceptualization, Y.H. and H.Z.; methodology, Y.H., H.S. and R.L.; investigation, Y.H., R.L. and Y.Y. (Yanzheng Yang); data, M.L. and Y.Y. (Yuze Yang); writing—original draft preparation, Y.H. and R.L. All authors have read and agreed to the published version of the manuscript.

Funding

This research was funded and supported by National Key R&D Program of China, Grant/Award Number: 2022YFF1301802, National Natural Science Foundation of China, Grant/Award Numbers: 42171099. We are grateful to the anonymous reviewers for their valuable suggestions in improving the manuscript.

Data Availability Statement

Data are contained within the article.

Conflicts of Interest

The authors declare that the research was conducted in the absence of any commercial or financial relationships that could be construed as potential conflicts of interest.

References

  1. FAO. Global Forest Resources Assessment 2010 Main Report; Food and Agriculture Organization (FAO): Rome, Italy, 2010. [Google Scholar]
  2. Griffiths, P.; Kuemmerle, T.; Baumann, M.; Radeloff, V.C.; Abrudan, I.V.; Lieskovsky, J.; Munteanu, C.; Ostapowicz, K.; Hostert, P. Forest Disturbances, Forest Recovery, and Changes in Forest Types across the Carpathian Ecoregion from 1985 to 2010 Based on Landsat Image Composites. Remote Sens. Environ. 2014, 151, 72–88. [Google Scholar] [CrossRef]
  3. Millar, C.I.; Stephenson, N.L. Temperate Forest Health in an Era of Emerging Megadisturbance. Science 2015, 349, 823–826. [Google Scholar] [CrossRef] [PubMed]
  4. Seidl, R.; Thom, D.; Kautz, M.; Martin-Benito, D.; Peltoniemi, M.; Vacchiano, G.; Wild, J.; Ascoli, D.; Petr, M.; Honkaniemi, J.; et al. Forest Disturbances under Climate Change. Nat. Clim. Chang. 2017, 7, 395–402. [Google Scholar] [CrossRef] [PubMed]
  5. Gao, Y.; Skutsch, M.; Paneque-Gálvez, J.; Ghilardi, A. Remote Sensing of Forest Degradation: A Review. Environ. Res. Lett. 2020, 15, 103001. [Google Scholar] [CrossRef]
  6. Bullock, E.L.; Woodcock, C.E.; Olofsson, P. Monitoring Tropical Forest Degradation Using Spectral Unmixing and Landsat Time Series Analysis. Remote Sens. Environ. 2020, 238, 110968. [Google Scholar] [CrossRef]
  7. Ghazoul, J.; Burivalova, Z.; Garcia-Ulloa, J.; King, L.A. Conceptualizing Forest Degradation. Trends Ecol. Evol. 2015, 30, 622–632. [Google Scholar] [CrossRef]
  8. NFGA. China Forest Resources Report; National Forestry and Grassland Administration: Beijing, China, 2019.
  9. Boisvenue, C.; Smiley, B.P.; White, J.C.; Kurz, W.A.; Wulder, M.A. Integration of Landsat Time Series and Field Plots for Forest Productivity Estimates in Decision Support Models. For. Ecol. Manag. 2016, 376, 284–297. [Google Scholar] [CrossRef]
  10. Herold, M.; Skutsch, M. Monitoring, Reporting and Verification for National REDD + Programmes: Two Proposals. Environ. Res. Lett. 2011, 6, 014002. [Google Scholar] [CrossRef]
  11. Castillo, M.; Rivard, B.; Sánchez-Azofeifa, A.; Calvo-Alvarado, J.; Dubayah, R. LIDAR Remote Sensing for Secondary Tropical Dry Forest Identification. Remote Sens. Environ. 2012, 121, 132–143. [Google Scholar] [CrossRef]
  12. Laporte, N.T.; Stabach, J.A.; Grosch, R.; Lin, T.S.; Goetz, S.J. Expansion of Industrial Logging in Central Africa. Science 2007, 316, 1451. [Google Scholar] [CrossRef]
  13. Mitchell, A.L.; Rosenqvist, A.; Mora, B. Current Remote Sensing Approaches to Monitoring Forest Degradation in Support of Countries Measurement, Reporting and Verification (MRV) Systems for REDD+. Carbon Balance Manag. 2017, 12, 9. [Google Scholar] [CrossRef]
  14. Gao, C.; Zhao, F.; Shi, C.; Liu, K.; Wu, X.; Wu, G.; Liang, Y.; Shu, L. Previous Atlantic Multidecadal Oscillation (AMO) Modulates the Lightning-Ignited Fire Regime in the Boreal Forest of Northeast China. Environ. Res. Lett. 2021, 16, 024054. [Google Scholar] [CrossRef]
  15. Ji, L.; Wang, Z.; Wang, X.; An, L. Forest Insect Pest Management and Forest Management in China: An Overview. Environ. Manag. 2011, 48, 1107–1121. [Google Scholar] [CrossRef] [PubMed]
  16. Mildrexler, D.J.; Zhao, M.; Running, S.W. Testing a MODIS Global Disturbance Index across North America. Remote Sens. Environ. 2009, 113, 2103–2117. [Google Scholar] [CrossRef]
  17. Tyukavina, A.; Hansen, M.C.; Potapov, P.V.; Stehman, S.V.; Smith-Rodriguez, K.; Okpa, C.; Aguilar, R. Types and Rates of Forest Disturbance in Brazilian Legal Amazon, 2000–2013. Sci. Adv. 2017, 3, e1601047. [Google Scholar] [CrossRef] [PubMed]
  18. Goward, S.N.; Masek, J.G.; Cohen, W.; Moisen, G.; Collatz, G.J.; Healey, S.; Houghton, R.A.; Huang, C.; Kennedy, R.; Law, B.; et al. Forest Disturbance and North American Carbon Flux. Eos Trans. AGU 2008, 89, 105. [Google Scholar] [CrossRef]
  19. Senf, C.; Seidl, R.; Hostert, P. Remote Sensing of Forest Insect Disturbances: Current State and Future Directions. Int. J. Appl. Earth Obs. Geoinf. 2017, 60, 49–60. [Google Scholar] [CrossRef]
  20. Yu, D.; Zhou, L.; Zhou, W.; Ding, H.; Wang, Q.; Wang, Y.; Wu, X.; Dai, L. Forest Management in Northeast China: History, Problems, and Challenges. Environ. Manag. 2011, 48, 1122–1135. [Google Scholar] [CrossRef]
  21. Deng, K.; Yang, S.; Ting, M.; Lin, A.; Wang, Z. An Intensified Mode of Variability Modulating the Summer Heat Waves in Eastern Europe and Northern China. Geophys. Res. Lett. 2018, 45, 11361–11369. [Google Scholar] [CrossRef]
  22. Zhang, Y.; Liang, S. Changes in Forest Biomass and Linkage to Climate and Forest Disturbances over Northeastern China. Glob. Chang. Biol. 2014, 20, 2596–2606. [Google Scholar] [CrossRef]
  23. Xu, X.; Cao, M.; Li, K. Temporal-Spatial Dynamics of Carbon Storage of Forest Vegetation in China. Prog. Geogr. 2007, 6, 3–12. [Google Scholar] [CrossRef]
  24. Wang, S.; Zhong, R.; Liu, L.; Zhang, J. Ecological Effect of Ecological Engineering Projects on Low-Temperature Forest Cover in Great Khingan Mountain, China. Int. J. Environ. Res. Public Health 2021, 18, 10625. [Google Scholar] [CrossRef] [PubMed]
  25. Fang, J.; Song, Y.; Liu, H.; Piao, S. Vegetation-Climate Relationship and Its Application in the Division of Vegetation Zone in China. Acta Bot. Sin. 2002, 44, 1105–1122. [Google Scholar]
  26. Dale, V.H.; Joyce, L.A.; Mcnulty, S.; Neilson, R.P.; Ayres, M.P.; Flannigan, M.D.; Hanson, P.J.; Irland, L.C.; Lugo, A.E.; Peterson, C.J.; et al. Climate Change and Forest Disturbances. BioScience 2001, 51, 723. [Google Scholar] [CrossRef]
  27. Li, C.; Wang, J.; Hu, L.; Yu, L.; Clinton, N.; Huang, H.; Yang, J.; Gong, P. A Circa 2010 Thirty Meter Resolution Forest Map for China. Remote Sens. 2014, 6, 5325–5343. [Google Scholar] [CrossRef]
  28. Goward, S.N.; Cruickshanks, G.D.; Hope, A.S. Observed Relation between Thermal Emission and Reflected Spectral Radiance of a Complex Vegetated Landscape. Remote Sens. Environ. 1985, 18, 137–146. [Google Scholar] [CrossRef]
  29. Gobin, R.; Korboulewsky, N.; Dumas, Y.; Balandier, P. Transpiration of Four Common Understorey Plant Species According to Drought Intensity in Temperate Forests. Ann. For. Sci. 2015, 72, 1053–1064. [Google Scholar] [CrossRef]
  30. Tan, Y.; Sun, J.-Y.; Zhang, B.; Chen, M.; Liu, Y.; Liu, X.-D. Sensitivity of a Ratio Vegetation Index Derived from Hyperspectral Remote Sensing to the Brown Planthopper Stress on Rice Plants. Sensors 2019, 19, 375. [Google Scholar] [CrossRef] [PubMed]
  31. Google Earth Engine. Available online: https://earthengine.google.com (accessed on 25 March 2024).
  32. National Earth System Science Data Center. Available online: https://www.geodata.cn (accessed on 25 March 2024).
  33. Van Zyl, J.J. The Shuttle Radar Topography Mission (SRTM): A Breakthrough in Remote Sensing of Topography. Acta Astronaut. 2001, 48, 559–565. [Google Scholar] [CrossRef]
  34. Jones, P.G.; Thornton, P.K. Representative Soil Profiles for the Harmonized World Soil Database at Different Spatial Resolutions for Agricultural Modelling Applications. Agric. Syst. 2015, 139, 93–99. [Google Scholar] [CrossRef]
  35. Potapov, P.; Li, X.; Hernandez-Serna, A.; Tyukavina, A.; Hansen, M.C.; Kommareddy, A.; Pickens, A.; Turubanova, S.; Tang, H.; Silva, C.E.; et al. Mapping Global Forest Canopy Height through Integration of GEDI and Landsat Data. Remote Sens. Environ. 2021, 253, 112165. [Google Scholar] [CrossRef]
  36. Xiao, Y.; Wang, Q.; Tong, X.; Atkinson, P.M. Thirty-Meter Map of Young Forest Age in China. Earth Syst. Sci. Data 2023, 15, 3365–3386. [Google Scholar] [CrossRef]
  37. National Geomatics Center of China. Available online: https://www.ngcc.cn/ngcc/ (accessed on 25 March 2024).
  38. Lloyd, C.T.; Sorichetta, A.; Tatem, A.J. High Resolution Global Gridded Data for Use in Population Studies. Sci. Data 2017, 4, 170001. [Google Scholar] [CrossRef] [PubMed]
  39. Cao, M.; Li, Q.; Zhang, L.; Gao, J.; Li, W.; Ding, W.; Sun, Y. Accumulated Temperature Variation and Accumulated Temperature Rezone in Heilongjiang Province. Chin. J. Agrometeorol. 2014, 35, 492. [Google Scholar] [CrossRef]
  40. Hu, Z.; Zhou, J.; Zhang, L.; Wei, W.; Cao, J. Climate dry-wet change and drought evolution characteristics of different dry-wet areas in northern China. Acta Ecol. Sin. 2018, 38, 1908–1919. [Google Scholar]
  41. Dou, X.; Li, K.; Zhang, Q.; Ma, C.; Tang, H.; Liu, X.; Qian, Y.; Chen, J.; Li, J.; Li, Y.; et al. Estimation of Land Surface Temperature from Chinese ZY1-02E IRS Data. Remote Sens. 2024, 16, 383. [Google Scholar] [CrossRef]
  42. Wu, W.; Yang, F.; Wang, J.; Diao, Y.; Guo, Y.; Wu, R. Dynamic monitoring and analysis of ecosystem disturbances in major vegetation types based on MODIS time series data in Southwest China. Geogr. Res. 2021, 40, 1478–1494. [Google Scholar]
  43. Rullán-Silva, C.; Olthoff, A.E.; Pando, V.; Pajares, J.A.; Delgado, J.A. Remote Monitoring of Defoliation by the Beech Leaf-Mining Weevil Rhynchaenus Fagi in Northern Spain. For. Ecol. Manag. 2015, 347, 200–208. [Google Scholar] [CrossRef]
  44. Elith, J.; Leathwick, J.R.; Hastie, T. A Working Guide to Boosted Regression Trees. J. Anim. Ecol. 2008, 77, 802–813. [Google Scholar] [CrossRef]
  45. Doetterl, S.; Stevens, A.; Six, J.; Merckx, R.; Van Oost, K.; Casanova Pinto, M.; Casanova-Katny, A.; Muñoz, C.; Boudin, M.; Zagal Venegas, E.; et al. Soil Carbon Storage Controlled by Interactions between Geochemistry and Climate. Nat. Geosci. 2015, 8, 780–783. [Google Scholar] [CrossRef]
  46. Vlassova, L.; Pérez-Cabello, F.; Mimbrero, M.; Llovería, R.; García-Martín, A. Analysis of the Relationship between Land Surface Temperature and Wildfire Severity in a Series of Landsat Images. Remote Sens. 2014, 6, 6136–6162. [Google Scholar] [CrossRef]
  47. Riaño, D.; Moreno Ruiz, J.A.; Barón Martínez, J.; Ustin, S.L. Burned Area Forecasting Using Past Burned Area Records and Southern Oscillation Index for Tropical Africa (1981–1999). Remote Sens. Environ. 2007, 107, 571–581. [Google Scholar] [CrossRef]
  48. Chompuchan, C.; Lin, C.-Y. Assessment of Forest Recovery at Wu-Ling Fire Scars in Taiwan Using Multi-Temporal Landsat Imagery. Ecol. Indic. 2017, 79, 196–206. [Google Scholar] [CrossRef]
  49. Souza, C.M.; Roberts, D.A.; Cochrane, M.A. Combining Spectral and Spatial Information to Map Canopy Damage from Selective Logging and Forest Fires. Remote Sens. Environ. 2005, 98, 329–343. [Google Scholar] [CrossRef]
  50. Shi, S.; Yao, F.; Zhang, J.; Yang, S. Evaluation of Temperature Vegetation Dryness Index on Drought Monitoring Over Eurasia. IEEE Access 2020, 8, 30050–30059. [Google Scholar] [CrossRef]
  51. Wei, W.; Pang, S.; Wang, X.; Zhou, L.; Xie, B.; Zhou, J.; Li, C. Temperature Vegetation Precipitation Dryness Index (TVPDI)-Based Dryness-Wetness Monitoring in China. Remote Sens. Environ. 2020, 248, 111957. [Google Scholar] [CrossRef]
  52. Wang, L.; Wang, P.; Li, L.; Xun, L.; Kong, Q.; Liang, S. Developing an Integrated Indicator for Monitoring Maize Growth Condition Using Remotely Sensed Vegetation Temperature Condition Index and Leaf Area Index. Comput. Electron. Agric. 2018, 152, 340–349. [Google Scholar] [CrossRef]
  53. Baeza, A.; Martin, R.E.; Stephenson, N.L.; Das, A.J.; Hardwick, P.; Nydick, K.; Mallory, J.; Slaton, M.; Evans, K.; Asner, G.P. Mapping the Vulnerability of Giant Sequoias after Extreme Drought in California Using Remote Sensing. Ecol. Appl. 2021, 31, e02395. [Google Scholar] [CrossRef] [PubMed]
  54. Lyons, D.S.; Dobrowski, S.Z.; Holden, Z.A.; Maneta, M.P.; Sala, A. Soil Moisture Variation Drives Canopy Water Content Dynamics across the Western U.S. Remote Sens. Environ. 2021, 253, 112233. [Google Scholar] [CrossRef]
  55. Olsson, P.-O.; Lindström, J.; Eklundh, L. Near Real-Time Monitoring of Insect Induced Defoliation in Subalpine Birch Forests with MODIS Derived NDVI. Remote Sens. Environ. 2016, 181, 42–53. [Google Scholar] [CrossRef]
  56. Liu, Z.; Yan, M.; Zhang, X.; Tu, G. Methodical Study on Monitoring Wide-Range Forest Insect Pest by Meteorsat. J. Nat. Disasters 2002, 11, 109–114. [Google Scholar]
  57. Eklundh, L.; Johansson, T.; Solberg, S. Mapping Insect Defoliation in Scots Pine with MODIS Time-Series Data. Remote Sens. Environ. 2009, 113, 1566–1573. [Google Scholar] [CrossRef]
  58. Wang, J.; Zhao, J.; Sun, H.; Lu, X.; Huang, J.; Wang, S.; Fang, G. Satellite Remote Sensing Identification of Discolored Standing Trees for Pine Wilt Disease Based on Semi-Supervised Deep Learning. Remote Sens. 2022, 14, 5936. [Google Scholar] [CrossRef]
  59. Lantschner, M.V.; Aukema, B.H.; Corley, J.C. Droughts Drive Outbreak Dynamics of an Invasive Forest Insect on an Exotic Host. For. Ecol. Manag. 2019, 433, 762–770. [Google Scholar] [CrossRef]
  60. Kolb, T.E.; Fettig, C.J.; Ayres, M.P.; Bentz, B.J.; Hicke, J.A.; Mathiasen, R.; Stewart, J.E.; Weed, A.S. Observed and Anticipated Impacts of Drought on Forest Insects and Diseases in the United States. For. Ecol. Manag. 2016, 380, 321–334. [Google Scholar] [CrossRef]
  61. Rouault, G.; Candau, J.-N.; Lieutier, F.; Nageleisen, L.-M.; Martin, J.-C.; Warzée, N. Effects of Drought and Heat on Forest Insect Populations in Relation to the 2003 Drought in Western Europe. Ann. For. Sci. 2006, 63, 613–624. [Google Scholar] [CrossRef]
  62. Cumming, S.G. Forest Type and Wildfire in the Alberta Boreal Mixedwood: What Do Fires Burn? Ecol. Appl. 2001, 11, 97–110. [Google Scholar] [CrossRef]
  63. Kasischke, E.S.; Verbyla, D.L.; Rupp, T.S.; McGuire, A.D.; Murphy, K.A.; Jandt, R.; Barnes, J.L.; Hoy, E.E.; Duffy, P.A.; Calef, M.; et al. Alaska’s Changing Fire Regime—Implications for the Vulnerability of Its Boreal forests. Can. J. For. Res. 2010, 40, 1313–1324. [Google Scholar] [CrossRef]
  64. Astrup, R.; Bernier, P.Y.; Genet, H.; Lutz, D.A.; Bright, R.M. A Sensible Climate Solution for the Boreal Forest. Nat. Clim. Chang. 2018, 8, 11–12. [Google Scholar] [CrossRef]
  65. Zhao, J.; Wang, J.; Meng, Y.; Du, Z.; Ma, H.; Qiu, L.; Tian, Q.; Wang, L.; Xu, M.; Zhao, H.; et al. Spatiotemporal Patterns of Fire-Driven Forest Mortality in China. For. Ecol. Manag. 2023, 529, 120678. [Google Scholar] [CrossRef]
  66. Tian, X.; Zhao, F.; Shu, L.; Wang, M. Distribution Characteristics and the Influence Factors of Forest Fires in China. For. Ecol. Manag. 2013, 310, 460–467. [Google Scholar] [CrossRef]
  67. Ding, Y.; Sun, Y.; Wang, Z.; Zhu, Y.; Song, Y. Inter-Decadal Variation of the Summer Precipitation in China and Its Association with Decreasing Asian Summer Monsoon Part II: Possible Causes. Int. J. Climatol. 2009, 29, 1926–1944. [Google Scholar] [CrossRef]
  68. Pei, F.; Wu, C.; Liu, X.; Li, X.; Yang, K.; Zhou, Y.; Wang, K.; Xu, L.; Xia, G. Monitoring the Vegetation Activity in China Using Vegetation Health Indices. Agric. For. Meteorol. 2018, 248, 215–227. [Google Scholar] [CrossRef]
  69. Zhou, W.; Chen, W.; Wang, D.X. The Implications of El Niño-Southern Oscillation Signal for South China Monsoon Climate. Aquat. Ecosyst. Health Manag. 2012, 15, 14–19. [Google Scholar] [CrossRef]
  70. Sun, Y.; Wang, Y.; Zhang, M.; Zeng, Z. Summer Extreme Consecutive Dry Days over Northeast China in the Changing Climate: Observed Features and Projected Future Changes Based on CESM-LE. Front. Earth Sci. 2023, 11, 1138985. [Google Scholar] [CrossRef]
  71. Chang, J.; Liu, Q.; Wang, S.; Huang, C. Vegetation Dynamics and Their Influencing Factors in China from 1998 to 2019. Remote Sens. 2022, 14, 3390. [Google Scholar] [CrossRef]
  72. Liu, H. It Is Difficult for China’s Greening through Large-Scale Afforestation to Cross the Hu Line. Sci. China Earth Sci. 2019, 62, 1662–1664. [Google Scholar] [CrossRef]
  73. Bai, Y.; Zhu, Y.; Liu, Y.; Wang, S. Vegetation Greening and Its Response to a Warmer and Wetter Climate in the Yellow River Basin from 2000 to 2020. Remote Sens. 2024, 16, 790. [Google Scholar] [CrossRef]
  74. Zhao, D.; Gao, X.; Wu, S.; Zheng, D. Trend of Climate Variation in China from 1960 to 2018 Based on Natural Regionalization. Adv. Earth Sci. 2020, 35, 750–760. [Google Scholar]
  75. Wang, X.; Zhao, C.; Jia, Q. Impacts of Climate Change on Forest Ecosystems in Northeast China. Adv. Clim. Chang. Res. 2013, 4, 230–241. [Google Scholar] [CrossRef]
  76. Guo, F.; Su, Z.; Wang, G.; Sun, L.; Tigabu, M.; Yang, X.; Hu, H. Understanding Fire Drivers and Relative Impacts in Different Chinese Forest Ecosystems. Sci. Total Environ. 2017, 605–606, 411–425. [Google Scholar] [CrossRef]
  77. Ding, Z.; Zheng, H.; Wang, J.; O’Connor, P.; Li, C.; Chen, X.; Li, R.; Ouyang, Z. Integrating Top-Down and Bottom-Up Approaches Improves Practicality and Efficiency of Large-Scale Ecological Restoration Planning: Insights from a Social–Ecological System. Engineering 2022, 31, 50–58. [Google Scholar] [CrossRef]
  78. Pyne, S.J.; Andrews, P.L.; Laven, R.D. Introduction to Wildland Fire, 2nd ed.; Wiley: New York, NY, USA, 1996; ISBN 978-0-471-54913-0. [Google Scholar]
  79. Rakhmatulina, E.; Stephens, S.; Thompson, S. Soil Moisture Influences on Sierra Nevada Dead Fuel Moisture Content and Fire Risks. For. Ecol. Manag. 2021, 496, 119379. [Google Scholar] [CrossRef]
  80. Chen, Q.; Timmermans, J.; Wen, W.; Van Bodegom, P.M. A Multi-Metric Assessment of Drought Vulnerability across Different Vegetation Types Using High Resolution Remote Sensing. Sci. Total Environ. 2022, 832, 154970. [Google Scholar] [CrossRef]
  81. Guarín, A.; Taylor, A.H. Drought Triggered Tree Mortality in Mixed Conifer Forests in Yosemite National Park, California, USA. For. Ecol. Manag. 2005, 218, 229–244. [Google Scholar] [CrossRef]
  82. Xu, P.; Zhou, T.; Yi, C.; Fang, W.; Hendrey, G.; Zhao, X. Forest Drought Resistance Distinguished by Canopy Height. Environ. Res. Lett. 2018, 13, 075003. [Google Scholar] [CrossRef]
  83. Bennett, A.C.; McDowell, N.G.; Allen, C.D.; Anderson-Teixeira, K.J. Larger Trees Suffer Most during Drought in Forests Worldwide. Nat. Plants 2015, 1, 15139. [Google Scholar] [CrossRef]
  84. Marini, L.; Økland, B.; Jönsson, A.M.; Bentz, B.; Carroll, A.; Forster, B.; Grégoire, J.-C.; Hurling, R.; Nageleisen, L.M.; Netherer, S.; et al. Climate Drivers of Bark Beetle Outbreak Dynamics in Norway Spruce Forests. Ecography 2017, 40, 1426–1435. [Google Scholar] [CrossRef]
  85. Greenbank, D.O. The Role of Climate and Dispersal in the Initiation of Outbreaks of the Spruce Budworm in New Brunswick: I. the Role of Climate. Can. J. Zool. 1956, 34, 453–476. [Google Scholar] [CrossRef]
  86. Royama, T. Population Dynamics of the Spruce Budworm Choristoneura Fumiferana. Ecol. Monogr. 1984, 54, 429–462. [Google Scholar] [CrossRef]
  87. Jactel, H.; Brockerhoff, E.G. Tree Diversity Reduces Herbivory by Forest Insects. Ecol. Lett. 2007, 10, 835–848. [Google Scholar] [CrossRef]
  88. Watt, A.D.; Evans, R.; Varley, T. The Egg Laying Behaviour of a Native Insect, the Winter Moth Operophtera brumata (L.) (Lep., Geometridae), on an Introduced Tree Species, Sitka Spruce Picea Sitchensis. J. Appl. Entomol. 1992, 114, 1–4. [Google Scholar] [CrossRef]
  89. Senf, C.; Seidl, R. Natural Disturbances Are Spatially Diverse but Temporally Synchronized across Temperate Forest Landscapes in Europe. Glob. Chang. Biol. 2018, 24, 1201–1211. [Google Scholar] [CrossRef]
  90. MacKinnon, W.E.; MacLean, D.A. The Influence of Forest and Stand Conditions on Spruce Budworm Defoliation in New Brunswick, Canada. For. Sci. 2003, 49, 657–667. [Google Scholar] [CrossRef]
  91. Adams, M.A. Mega-Fires, Tipping Points and Ecosystem Services: Managing Forests and Woodlands in an Uncertain Future. For. Ecol. Manag. 2013, 294, 250–261. [Google Scholar] [CrossRef]
  92. Mengist, W.; Soromessa, T.; Feyisa, G.L. Forest Fragmentation in a Forest Biosphere Reserve: Implications for the Sustainability of Natural Habitats and Forest Management Policy in Ethiopia. Resour. Environ. Sustain. 2022, 8, 100058. [Google Scholar] [CrossRef]
  93. Linares, J.C.; Tíscar, P.A. Climate Change Impacts and Vulnerability of the Southern Populations of Pinus nigra Subsp. Salzmannii. Tree Physiol. 2010, 30, 795–806. [Google Scholar] [CrossRef]
  94. Lechuga, V.; Carraro, V.; Viñegla, B.; Carreira, J.A.; Linares, J.C. Managing Drought-Sensitive Forests under Global Change. Low Competition Enhances Long-Term Growth and Water Uptake in Abies Pinsapo. For. Ecol. Manag. 2017, 406, 72–82. [Google Scholar] [CrossRef]
  95. Allan, E.; Weisser, W.W.; Fischer, M.; Schulze, E.-D.; Weigelt, A.; Roscher, C.; Baade, J.; Barnard, R.L.; Beßler, H.; Buchmann, N.; et al. A Comparison of the Strength of Biodiversity Effects across Multiple Functions. Oecologia 2013, 173, 223–237. [Google Scholar] [CrossRef]
  96. Soliveres, S.; Van Der Plas, F.; Manning, P.; Prati, D.; Gossner, M.M.; Renner, S.C.; Alt, F.; Arndt, H.; Baumgartner, V.; Binkenstein, J.; et al. Biodiversity at Multiple Trophic Levels Is Needed for Ecosystem Multifunctionality. Nature 2016, 536, 456–459. [Google Scholar] [CrossRef]
  97. Van Passel, J.; De Keersmaecker, W.; Bernardino, P.N.; Jing, X.; Umlauf, N.; Van Meerbeek, K.; Somers, B. Climatic Legacy Effects on the Drought Response of the Amazon Rainforest. Glob. Chang. Biol. 2022, 28, 5808–5819. [Google Scholar] [CrossRef] [PubMed]
  98. Müller, J.; Hothorn, T.; Pretzsch, H. Long-Term Effects of Logging Intensity on Structures, Birds, Saproxylic Beetles and Wood-Inhabiting Fungi in Stands of European Beech Fagus sylvatica L. For. Ecol. Manag. 2007, 242, 297–305. [Google Scholar] [CrossRef]
  99. Jeffries, J.M.; Marquis, R.J.; Forkner, R.E. Forest Age Influences Oak Insect Herbivore Community Structure, Richness, and Density. Ecol. Appl. 2006, 16, 901–912. [Google Scholar] [CrossRef] [PubMed]
Figure 1. Vegetation zonation and forest spatial distribution in study area. The forest spatial distribution data come from Li et al. [27], with forest types including the deciduous broadleaf forest (DBF); evergreen broadleaf forest (EBF); deciduous needleleaf forest (DNF); evergreen needleleaf forest (ENF).
Remotesensing 16 01389 g001
Figure 2. Accuracy evaluation of the forest degradation index. (a) Accuracy of the forest fire degradation index in identifying surveyed fire points. (b,c) Fitting of the forest drought and pest degradation index with the surveyed leaf area index.
Remotesensing 16 01389 g002
Figure 3. Spatial characteristics of forest degradation. (a) Spatial distribution of the frequency of forest fire occurrences from 2003 to 2021. (b,c) Forest drought and pest severity map from 2000 to 2021. The bar chart shows the frequency of forest fires and the degree of forest degradation.
Remotesensing 16 01389 g003
Figure 4. Temporal characteristics of forest degradation. (a) Annual variation rate trend of the forest fire disturbance index from 2003 to 2021. (b,c) Trend level map of forest drought and pest severity from 2000 to 2021. The bar chart shows the trend level of forest degradation.
Remotesensing 16 01389 g004
Figure 5. The relative contributions of predictors in typical forest degradation due to fire (a), drought (b), and insect (c).
Remotesensing 16 01389 g005
Table 1. Forest degradation assessment indicators and driving factor data indicators.
Data TypeNameCodeSpatial ResolutionSource
Remote sensing indexLand surface temperatureLST1 kmGoogle Earth Engine [31]
Enhanced vegetation indexEVI500 m
Ratio vegetation indexRVI500 m
Normalized difference water indexNDWI500 m
MeteorologicalTemperatureTem1 kmNational Earth System Science Data Center [32]
PrecipitationPre1 km
Wind speedWind1 km
Winter temperatureWt1 km
Growing season precipitationGp1 km
Potential evapotranspirationPET1 km
AridityAI1 km
TopographicalElevationElev90 mVan Zyl [33]
SlopeSlope90 m
AspectAspect90 m
SoilSoil bulk densityBulk1 kmJones et al. [34]
Clay contentClay1 km
VegetationCanopy heightHeight30 mPotapov et al. [35]
Forest ageAge1 kmXiao et al. [36]
Forest typeType30 mLi et al. [27]
HumanNearest road distanceRoad1:250,000National Geomatics Center of China [37]
Nearest settlement distanceSett1:250,000
Population densityPop1 kmLloyd et al. [38]
Table 2. Environmental factor gradient.
FactorsClassReference
Accumulated temperature
(At, °C)
Cold temperate zone (1600 > At)Cao et al. [39]
Mid temperate zone (3400 > At ≥ 1600)
Warm temperate zone (4500 > At ≥ 3400)
Subtropical zone (8000 > At ≥ 4500)
Precipitation
(P, mm)
Humid region (P > 800)Hu et al. [40]
Subhumid region (800 ≥ P > 400)
Semi-arid region (400 ≥ P > 200)
Forest typeConifer forestLi et al. [27]
Conifer and broadleaf mixed forest
Deciduous broadleaf forest
Evergreen broadleaf forest
Table 3. Degree of degradation and trend grade of forest.
Degradation degreeSlight (Sl)Moderate (Mo)Severe (Se)
0 ≤ DI ≤ 33.333.3 < DI ≤ 66.666.6 < DI ≤ 100
Trend gradeIncrease (In)Decrease (De)Stable (St)
Slope > 0Slope < 0Other
p < 0.05p < 0.05Other
Disclaimer/Publisher’s Note: The statements, opinions and data contained in all publications are solely those of the individual author(s) and contributor(s) and not of MDPI and/or the editor(s). MDPI and/or the editor(s) disclaim responsibility for any injury to people or property resulting from any ideas, methods, instructions or products referred to in the content.

