Abstract
Ground-penetrating radar (GPR) is a classic geophysical exploration method that utilizes the emission and reception of electromagnetic waves to non-destructively detect target objects in the target medium. It has been widely applied in various fields such as pipeline detection, cavity detection, and rebar detection. However, GPR systems are susceptible to environmental clutter interference, which poses challenges for data interpretation and subsequent processing. In this paper, the separability of clutter and target signal in the frequency-wavenumber (F-K) domain is validated through modeling, leading to the proposal of a comprehensive clutter removal method based on the F-K domain for complex scenarios. The direct coupling wave is initially eliminated by applying a peak matching mean subtraction filter, which avoids the artifacts. Subsequently, the F-K domain transformation is performed and surface clutter undulations are effectively removed using a method based on singular value decomposition and k-means clustering. Finally, an angle filter with Gaussian tapering at the edges is designed based on physical models to efficiently eliminate linear interference without undesired ringing interference. The commonly used clutter removal algorithms, including mean subtraction (MS), singular value decomposition (SVD), robust principal component analysis (RPCA), and traditional F-K filtering methods, are compared with the proposed algorithm on both the numerical simulated data and actual GPR data. The results from visual and quantitative analysis confirm that our proposed method is more effective than current commonly used clutter suppression algorithms. We have successfully enhanced the Signal-to-Clutter Ratio (SCR) of the GPR data, resulting in an Improvement Factor (IF) of 30.63 dB, 23.59 dB, and 30.60 dB for simulated data, experimental data, and TU1208 public data, respectively. The detection capability of buried targets is enhanced, thereby establishing a solid foundation for subsequent data interpretation and target identification.
1. Introduction
Ground-Penetrating Radar (GPR) is a form of Ultra-WideBand (UWB) radar, which operates by emitting electromagnetic waves into the target medium and analyzing wave propagation characteristics in relation to different electrical properties of the medium. Through the analysis of received radar echoes, it enables the determination of electromagnetic parameters and structural composition within the target medium, thereby facilitating the non-intrusive detection of buried objects within the medium [1,2,3]. GPR is also known by various alternative terms such as Impulse Radar, Surface Penetrating Radar, Subsurface Radar, GeoRadar, Through-the-Wall Radar, and the Radio Echo Sounding (RES) technique [4,5,6,7,8,9,10], all employing electromagnetic wave pulses for the detection of concealed subterranean targets or internal structures. Currently, GPR represents the most widely adopted terminology.
Compared to traditional geophysical exploration methods and construction quality inspection techniques, GPR offers several advantages including non-destructiveness, efficiency, user-friendliness, high resolution, and straightforward results. Due to these benefits, GPR technology is increasingly being widely applied in various fields such as urban construction, industrial development, and aerospace research. These applications encompass road quality inspection, bridge quality assessment, urban pipeline detection, archaeological exploration, landmine and unexploded bomb detection, ice layer investigation, and lunar exploration [11,12,13,14,15,16], among others.
However, in practical engineering applications, the waveform of the target being measured is often submerged under various types of interference. Common sources of interference include direct coupling waves between transmitting and receiving antennas (also known as direct waves), strong reflection signals from the ground surface, clutter caused by uneven terrain, interference signals from objects within the medium, and reflection signals at multiple interfaces within layered media. In most cases, these types of interference signals have much stronger energy compared to the target signal energy and can easily affect the interpretation of ground-penetrating radar waveforms. Additionally, due to wide beamwidths in some GPR antenna designs or lack of backscatter suppression in system design processing, strong targets such as power lines, cables, signal towers, fences or walls in the air can generate powerful interfering noise. This type of interfering noise often appears as linear interference on radar profiles with high energy levels and a wide impact range that severely affects data readability for GPR. Therefore, how to suppress noise signals in GPR data has always been a research hotspot in GPR signal processing.
In recent years, both domestic and international scholars have proposed various signal processing algorithms for clutter suppression in GPR data. These methods can be broadly classified into several categories, including filtering techniques, clutter modeling approaches, subspace-based algorithms, and transform domain methodologies.
The filtering method aims to effectively suppress clutter components by designing appropriate filters. To mitigate direct-coupled clutter interference, Hamran et al. [17] proposed a time-gating filtering method that nullifies early echo data, thereby effectively removing direct-coupled wave interference and improving data readability. However, the selection of the time window significantly impacts clutter removal effectiveness and can affect shallow buried targets. In order to achieve automatic time window selection, Solimene et al. [18] introduced an entropy-based time-gating method assuming similar characteristics in direct-coupled clutter signals received by GPR. By calculating Shannon’s information entropy and setting a threshold value, automatic filtering is achieved while minimizing damage to target waveform caused by both direct-coupled clutter and strong surface reflection clutter. Nevertheless, this approach incurs high computational cost for entropy calculation and accurate measurement of the filter entropy threshold value remains challenging. In practical applications, a commonly used filtering technique is mean subtraction (MS) filter [19], which represents the average of clutter signals by calculating the signal mean in the horizontal direction. Subtracting this average from the received waveform results in a clutter-free signal. This method effectively eliminates direct coupling clutter and strong reflection waveform originating from horizontal surfaces. However, it may not be as effective in removing clutter from undulating terrain or linear interference. To address this limitation, Li et al. [20] proposed a symmetric filtering method based on the assumption that target waveform exhibit symmetry while clutter exhibits randomness. This approach demonstrates promising suppression effects on random clutter interference but shows limited performance when dealing with non-completely symmetric target waveform in complex scenes.
Clutter modeling methods primarily involve parameterized modeling based on the mathematical and physical characteristics of both target waveforms and clutter waveforms, with the aim of separating different waveforms and achieving clutter suppression. Brunzell [21] initially proposed utilizing the least squares method for modeling, separately representing the target signal, background signal, and noise to ultimately achieve clutter separation and suppression. Chan’s team [22] introduced a generalized bilateral linear prediction (LP) method to eliminate background interference in GPR data. This approach outperforms adaptive ground bounce removal and conventional LP modeling algorithms in terms of performance by effectively removing background interference and surface clutter interference. However, the effectiveness of such methods largely relies on the accuracy of the employed clutter signal model. In practical applications, they may exhibit poor generalization ability as their clutter removal effects will significantly decline if there are deviations between the actual clutter characteristics and estimated models.
Subspace methods are employed to decompose GPR data into a clutter signal subspace and target signal subspace, under the assumption that clutter signals exhibit significantly higher strength than target signals [23]. The dominant clutter signal subspace can be eliminated to achieve effective clutter suppression. Abujarad et al. [24] proposed the utilization of Singular Value Decomposition (SVD) for processing GPR signals by eliminating the subspace formed by the largest singular values to achieve clutter removal. Karlsen’s team [25] introduced Principal Component Analysis (PCA) and Independent Component Analysis (ICA) for suppressing clutter interference. PCA assumes that the first principal component represents the clutter signal subspace and removes it, while ICA assumes that the clutter signal subspace consists of independent components with Gaussian characteristics and eliminates them accordingly. Masarik et al. [26] proposed the utilization of Robust Principal Component Analysis (RPCA) for GPR signal processing, yielding promising outcomes. However, subspace-based methods are limited to clutter suppression in simplistic scenarios. In more complex experimental environments where the clutter interference subspace cannot be effectively separated from the target signal subspace, the efficacy of clutter removal is significantly diminished.
Due to the difficulty of effectively separating clutter interference and target echoes in the time domain, the core idea of transform domain methods is to transform GPR time-domain echo data into other domains where clutter signals and target signals can be separated. Among the various transform domain methods, the frequency–wave number (F-K) domain (also known as frequency–spatial frequency) transform method is widely employed due to its extensive usage. This method was first applied in the field of seismic wave de-cluttering, which can effectively separate the clutter and target components through the difference of apparent velocity [27,28,29,30]. Treitel et al. [27] were pioneers in proposing fan filters for the F-K domain, which significantly enhance the quality of seismic signals and subsequent analysis. The design of fan-pass and fan-reject filters not only improves signal quality but also establishes a theoretical foundation for further research in the F-K domain. Hayashi et al. [31] migrated the use of F-K filtering method to GPR data and designed two filters to provide effective filtering of the direct waveform. Carpentier’s team [32] performed imaging by migrating GPR signals in the F-K domain, and removed most of the clutter signals using a target mask approach. Liu’s team [33] removed most of the clutter by applying multi-scale filtering and Radon transform on optical fiber hydrophone signal in the F-K domain. Wei’s team [34] proposed a new approach based on F-K dip filtering to remove interference such as direct coupling waves and rebar reflections. Chen’s team [35] introduced an angular weighting template in the F-K domain, which improved the effectiveness of final filtering results. However, these methods have limited effectiveness when dealing with multiple types of clutter interference in practical application scenarios.
In this paper, we propose a clutter removal method based on the F-K domain for ground-penetrating radar data in complex scenarios. The method effectively eliminates direct coupling clutter, surface jitter clutter, and linear interference clutter through peak matching mean subtraction filter, SVD and k-means-based methods, as well as angle filtering with edge Gaussian tapering in the F-K domain. The effectiveness and interpretability of the algorithm are demonstrated from multiple perspectives including physical modeling, numerical simulation, and experimental results.
The main contributions of this study are as follows:
- Modeling and derivation of the distribution characteristics of target waveform and linear clutters in the F-K domain to theoretically validate the feasibility of clutter separation.
- A peak-matching based mean subtraction filtering method is proposed, which can effectively remove direct-coupling clutter without generating artifacts.
- The proposed approach combines Singular Value Decomposition (SVD) and k-means clustering to effectively mitigate the undulating clutter present at the surface interface in the F-K domain, thereby enhancing data readability.
- The proposed angle filtering method, incorporating edge Gaussian tapering in the F-K domain, effectively eliminates linear interference clutters while simultaneously enhancing targets without inducing unnecessary ringing disturbances.
The article is structured as follows: Section 2 provides a comprehensive introduction to the propagation model of electromagnetic waves in the F-K domain, presenting the specific algorithm flow for clutter removal in complex scenarios. In Section 3, numerical simulation data, experimental data, and publicly available datasets are employed to compare the efficacy of different methods for GPR clutter removal, thereby showcasing the superiority of the proposed method. In Section 4, the application scope and improvement direction of this method are discussed. Finally, Section 5 concludes this article.
2. Theory and Methodology
2.1. Signal Modeling in the F-K Domain
The F-K filtering method was initially employed in the field of seismic exploration to suppress coherent linear events, such as ground roll, guided waves, and side-scattered energy [34]. The schematic diagram illustrating the operational principle of seismic wave exploration is depicted in Figure 1a.
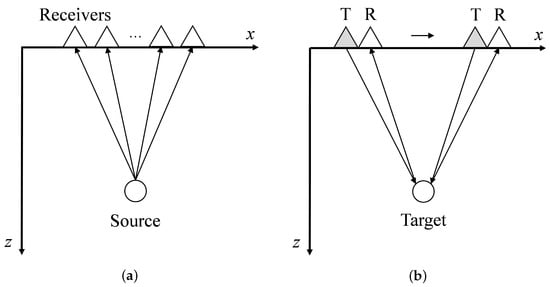
Figure 1.
Schematic diagram of physical models: (a) Seismic wave detection model. (b) Ground-penetrating radar detection model.
In general, the exploration process entails pre-configuring a series of receiving units, drilling and burying explosives at the designated location, and detonating them to generate seismic waves for reception by surface units. Subsequently, these data are synthesized into a 2D profile to analyze subterranean structures beneath geological layers and accomplish exploration objectives.
GPR employs the electromagnetic wave emission and analysis of received echo signals to detect subsurface structures. The acquired data in a single scan are one-dimensional, commonly referred to as A-scan data. By moving the GPR system during data collection, multiple sets of A-scan data are combined to form two-dimensional B-scan data, revealing the underground profile structure. Figure 1b illustrates the operational principle where T denotes the transmitting antenna and R represents the receiving antenna. The GPR traverses along an x-direction measurement line, continuously detecting and receiving reflected echo signals from targets to generate two-dimensional B-scan GPR data.
These two methods exhibit significant similarities in terms of physical modeling, thereby justifying the applicability of transferring the F-K filtering method to GPR signal processing.
The fundamental principle of the F-K filtering method involves transforming the two-dimensional time-domain B-scan data, as depicted in Equation (1), into the F-K domain using a two-dimensional Fourier transform. By employing tailored filters, it effectively discriminates between clutter and valid signals exhibiting distinct apparent velocities, as illustrated in Equation (2):
where denotes the B-scan raw data merged from x bars of A-scan data with time window t. The two-dimensional Fourier transform is applied to obtain in the F-K domain, followed by linear multiplication with a specifically designed filtering function to effectively eliminate noise and acquire filtered data. Finally, the time-domain signal can be obtained by applying the Fourier inverse transform to Equation (3), resulting in clutter removal.
Under an assumption that an incident wave is a plane wave, Figure 2 illustrates the definition of apparent velocity in the temporal domain and is given as [31]:
where v represents the propagation speed of electromagnetic waves in the measured medium, while denotes the incident angle of the electromagnetic waves. In addition, within the F-K domain, the apparent velocity can be determined as the slope passing through the origin [36]. Consequently, Figure 3 illustrates a corresponding relationship between target waveform in both time and F-K domains. For simplicity purposes, only receiving antenna R is given.
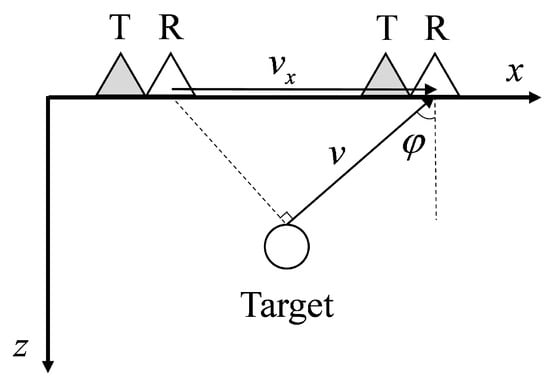
Figure 2.
Schematic diagram of the apparent velocity.
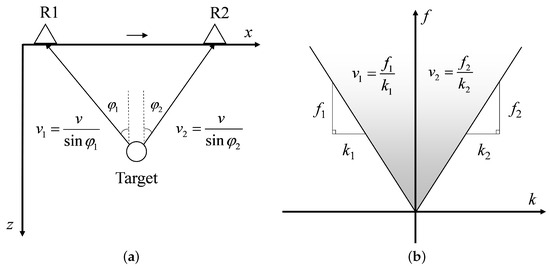
Figure 3.
Apparent velocity of the target: (a) In the time domain. (b) In the F-K domain.
In ideal conditions, the inclination angle of tangent points on a circle with approximately circular cross-sections varies continuously from −90° to 90°, considering multiple tangents around the circumference [34]. However, practical applications are subject to limitations in the receiving antenna window of GPR, limited measurement line length, and finite propagation distance of electromagnetic waves in media. Consequently, target waveform tend to concentrate within a sector region characterized by slope values ranging from to in the F-K domain. As depicted in Figure 3a, as the receiving antenna moves from position R1 towards directly above the target, the incident angle gradually approaches 0 and apparent velocity tends towards negative infinity near the frequency axis in the F-K domain. Conversely, when moving from directly above the target to position R2, gradually increases from 0 to while apparent velocity tends towards .
In certain application scenarios, such as city pipeline inspection, bridge maintenance inspection, and soil layer detection, potential interference like foundations, roadbeds, and steel bars may be encountered at the beginning and end of the measurement line. The presence of linear clutter interference caused by these factors can significantly impact the interpretation of the target signal. Figure 4 illustrates the corresponding relationship between linear clutter in both the time domain and F-K domain.
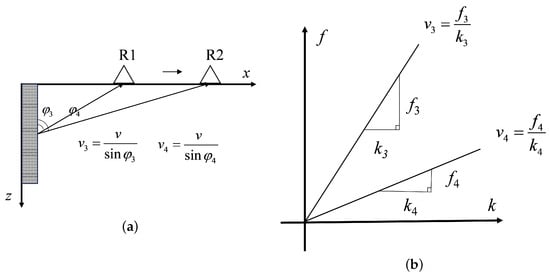
Figure 4.
Apparent velocity of the target: (a) In the time domain. (b) In the F-K domain.
As the receiving antenna moves from R1 to R2, the incident angle continues to increase, leading to a gradual decrease in the value of and resulting in a deceleration of the apparent velocity. In the F-K domain, this is evidenced by the concentration of clutter energy within a sector-shaped region spanning from to . Based on the aforementioned derivation, it can be inferred that there exist disparities in the distribution of target waveform energy and linear clutter energy in complex scenarios within the F-K domain. Consequently, it becomes feasible to design polar-coordinate sector filters for effective clutter suppression.
2.2. The Proposed Method
Based on the aforementioned analysis, for effective clutter removal from B-scan data acquired by GPR in complex scenarios, it is imperative to systematically analyze and eliminate various clutter signals individually. This paper presents a robust approach for clutter removal in complex scenarios, as illustrated in Figure 5. The method comprises three primary steps: (A) the peak matching mean subtraction filter for direct coupling removal, (B) a surface jitter interference removal method based on SVD and k-means, and (C) application of an edge Gaussian tapered polar angle filter in the F-K Domain.
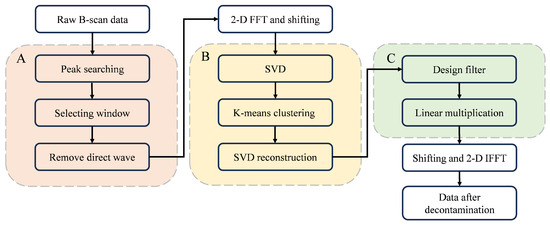
Figure 5.
Flowchart of the proposed method.
We will provide a detailed introduction to this method according to the workflow depicted in Figure 5.
2.2.1. Step A: The Peak Matching Mean Subtraction Filter
In the B-scan raw data of GPR, direct coupling clutter inevitably occurs due to the distance between the transmitting and receiving antennas. This type of waveform exhibits the highest intensity and significantly impacts the interpretation of shallow targets. The commonly employed approach involves using the mean subtraction filter [19], which is both straightforward and effective in implementation. However, when the target’s energy is stronger, the mean value of the transversal at the top of the target will be much higher than the background, resulting in transverse artifacts after processing, which affects the GPR data. To address this concern, we propose the peak matching mean subtraction filter method.
Assuming the original GPR B-scan data consists of x A-scan data, with each A-scan data containing t sample points represented as matrix . In order to avoid the interference caused by GPR jitter in the head and tail data of the measurement line, we select the th column in the middle of the matrix (or th column if x is an odd number), and perform a peak search using the dichotomising search method. Given that the direct-coupled wave peak consistently represents the strongest energy signal in A-scan data, assuming that we can obtain the peak signal at time . By considering the transmitted Riker waveform to be symmetric, we can effectively suppress clutter caused by direct coupling by implementing a processing window of , as demonstrated in Equation (5):
where represents the original sampled B-scan data, matrix M represents the preprocessed matrix, i denotes the ith A-scan data ranging from 1 to x, and j denotes the jth sample point ranging from 1 to .
The processed matrix M is transformed to the F-K domain through two-dimensional Fourier transform:
The B-scan data in the transformed F-K domain are denoted as , where f represents frequency and k represents wave number. To facilitate subsequent processing, a coordinate system is established at the center of matrix . The first quadrant of is swapped with the third quadrant, while the second quadrant is exchanged with the fourth quadrant, effectively relocating the zero-frequency component to the center of the spectrum. The resulting matrix after frequency shift is referred to as N.
2.2.2. Step B: Surface Jitter Interference Removal Based on SVD and k-Means
During GPR detection, the surface conditions of the tested medium can be intricate, potentially leading to interference from underlying layer fluctuations. Eliminating such interference is challenging due to its proximity to the surface and irregular nature, resulting in strong reflected energy. Since it directly faces the receiving antenna at an incident angle close to 0 degrees, this interference exhibits an apparent velocity approaching infinity on the F-K domain along the frequency axis. Based on the characteristic that the jitter energy of the ground surface clusters around the frequency axis in the F-K domain, we propose a novel method combining singular value decomposition (SVD) with k-means clustering in the F-K domain. In comparison to traditional time-domain SVD methods, our proposed approach is more interpretable and aligns better with the characteristics of surface jitter clutter distribution. By incorporating a one-dimensional k-means method, it enables more efficient localization and the removal of clutter components. The specific implementation method is as follows.
Apply SVD to the matrix N after shifting.
where, is a unitary matrix of order f, is a unitary matrix of order k, and the matrix only has values on its main diagonal, which are the singular values of matrix N.
The aforementioned equation can alternatively be expressed as:
where, represents the i-th column vector of matrix U, represents the j-th row vector of matrix , and denotes the k-th singular value of matrix N.
According to the analysis based on GPR principles [37], it can be inferred that matrix N consists of at least four components.
Among them, represents the component of the ground or wall’s first reflected wave, represents the component of clutter caused by ground undulations, represents the linear interference component of clutter, and represents the target component.
Based on the aforementioned assumptions, we extract the singular values from the diagonal of matrix S and organize them into a one-dimensional array:
The one-dimensional k-means method is applied to cluster the singular value array into 4 classes, following a specific procedure as described below [38]:
- (1)
- Perform centroid initialization by selecting initial centroids for 4 clusters.
- (2)
- Calculate the Euclidean distance between r objects and n centroids.
- (3)
- Compare the distances between each object and centroid, assigning each object to the nearest centroid in order to achieve effective clustering.
- (4)
- Based on the values of samples within each cluster, recalculate the average and update the centroids of each cluster accordingly.
- (5)
- Repeat steps (2), (3), and (4) until convergence is achieved in the clustering algorithm. Convergence is reached when there are no further changes observed in centroids or cluster assignments after multiple iterations.
The can ultimately be classified into four distinct categories, each of which corresponds to a specific component of N.
Since the two categories with larger singular value components are the a direct component of the ground wall and the b strong interference component of the ground jitter. So the singular values of the first components are directly zeroed out to obtain .
The values on the main diagonal of the singular value diagonal matrix S are replaced with to obtain , which effectively eliminates both direct wave interference and jitter interference. After performing inverse singular value transformation multiplication, is obtained, representing the data after strong interference removal:
2.2.3. Step C: Edge Gaussian Tapered Polar Angle Filter in the F-K Domain
After applying the aforementioned algorithm, residual linear interference still persists in matrix N, thereby impacting our data interpretation. In previous F-K domain filtering methods, rectangular filters or customized filters were commonly employed [39]. However, these approaches are subjective and lack interpretability. We were greatly inspired by the fan filter proposed by Treitel et al. [27], whose design of a fan-pass filter and fan-reject filter became the prototype of our theory. Hayashi [31] initially proposed angle filtering in the F-K domain, which aligns with the definition of apparent velocity. Chen et al. [35] introduced a stepwise segmented filtering approach based on angles. Nevertheless, the filters designed by the aforementioned methods are ideal filters with steep edges in the passband or stopband, which will inevitably produce the shape of sinc function after Fourier inverse transform back to the time domain, and then produce the ringing effect interference in the image.
This paper proposes a Gaussian tapered edge filter in the F-K domain. After performing the model calculation depicted in Figure 4, we obtained the apparent velocity range of the interfering target. By mapping the slope of the rectangular coordinates to the angle of the polar coordinates, we determined the angular range of clutter as [, ].
Using a filter that incorporates edge-preserving Gaussian smoothing
where is in the range of to . Based on the empirical values of the tests, the standard deviation is set to 0.1, the coefficient is taken as , and the mean is set to .
Multiply the processed matrix with the designed edge Gaussian smoothing filter linearly to obtain data without linear interference as follows:
As seen in Figure 6, compared with the traditional F-K filter and the segmented filter proposed in [35], our edge Gaussian tapered polar angle filter in the F-K Domain has a smoother transition, which is able to effectively suppress the ringing interference due to the abrupt change of the passband stopband of the ideal filter. On account of the complementary property of the Fourier transform of a Gaussian, the Gaussian method preserves the overall structure and edges of the target waveform relatively well while smoothing the background.
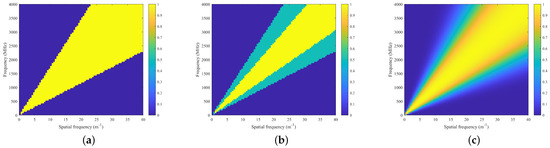
Figure 6.
Comparison of different F-K filters (in the first quadrant): (a) The traditional F-K filter. (b) The F-K filter in [35]. (c) The edge Gaussian tapered polar angle F-K filter in this paper.
After removing the interference of noise, exchange the first quadrant with the third quadrant, and exchange the second quadrant with the fourth quadrant. Utilize two-dimensional inverse Fourier transform to convert back to time domain B-scan data , where x represents the number of A-scans and t represents the number of samples.
represents the final processed data result, obtained by eliminating any extraneous signals or disturbances.
3. Results
3.1. Numerical Simulation
We developed a GPR testing environment using GprMax 3.0, a simulator based on the finite-difference time-domain (FDTD) method, to accurately simulate complex scenarios. To validate the effectiveness of our proposed clutter suppression method and enhance linear interference, we incorporated triangular metallic objects into the simulation as suggested in article [39]. The simulated scenario is depicted in Figure 7a:
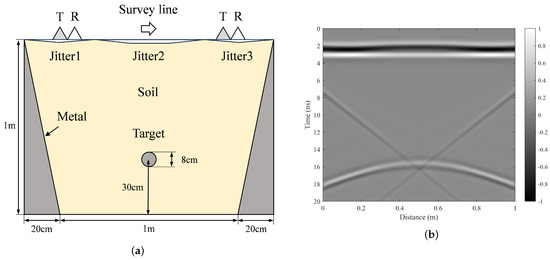
Figure 7.
The schematic of the simulated scenario and raw B-scan data: (a) The schematic of the model. (b) The raw B-scan data.
The model’s dimensions are 1.4 m × 1.1 m, with a grid size of 0.002 m × 0.002 m × 0.002 m. It comprises two layers: an upper layer consisting of a 10 cm air layer with a relative dielectric constant of 1, and a lower layer comprising a 1 m soil layer with a relative dielectric constant of 9. Within the soil layer, symmetrical triangular metal targets measuring 0.2 m × 1 m are buried to generate linear interference, while at a depth of 70 cm in the center of the model, there is an 8 cm diameter metal target present. In order to verify the performance of the proposed method for removing surface jitter, we set up three jitters along the upper edge of the soil layer, where jitter 1 and jitter 3 are inverted isosceles triangular cavities with a bottom edge length of 40 cm and a height of 1 cm, and jitter 2 is an isosceles trapezoidal cavity with an upper bottom edge length of 60 cm and a lower bottom edge length of 20 cm and a height of 2 cm. The radar antenna employs a point electric dipole source as its excitation source and utilizes Ricker wavelet waveform at a central frequency of 800 MHz for transmission and reception purposes; the antennas are spaced apart by 10 cm, and measurement lines have been set to be one meter long.
The raw B-scan data are shown in Figure 7b, in which it can be clearly seen that there is a direct-coupled waveform mixed with the surface-reflected waveform at the position of 2 to 3 ns. Due to the jitter we added, it has some fluctuation in the middle position. The target waveform exhibits distinct hyperbolic characteristics within the range of 15 to 18 ns. Notably, there is a downward linear interference on the left side and an upward linear interference on the right side.
In order to validate the effectiveness of the step A, step B, and step C processes proposed in our method, we conducted a step-by-step comparison of the processing results. For addressing direct-coupled interference waves, we compared the traditional MS method with our proposed peak matching mean subtraction filter method, as shown in Figure 8. It is evident that both methods effectively eliminate interference waveforms at positions 2 to 3 ns. However, the MS method introduces horizontal artifacts at positions 16 ns and 18 ns, leading to suboptimal processing performance.
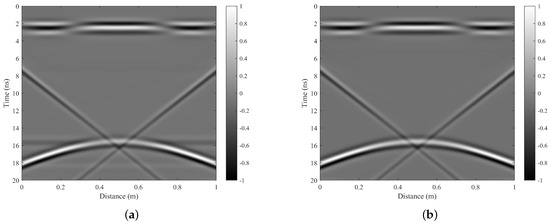
Figure 8.
The comparison of direct-coupled clutter removal results: (a) The result processed by mean subtraction (MS). (b) The result processed by our method Step A.
When comparing the impact of surface jitter interference processing, we utilized the Step A processed data to compare the conventional SVD method with our proposed Step B method as described in our paper. The number of singular values removed by the traditional SVD method is 2, which is the optimal parameter obtained after many experiments. The results are presented in Figure 9. It is obvious that our proposed method shows superior results in dealing with surface clutter interference without generating unwanted interference artifacts.
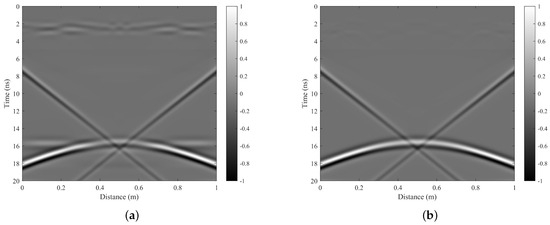
Figure 9.
The comparison of surface jitter interference removal results: (a) The result processed by SVD. (b) The result processed by our method Step B.
Finally, to assess the impact of eliminating linear disturbances, we compare the conventional F-K filtering method with our proposed edge Gaussian tapered polar angle filter in the F-K domain using the processed data obtained from Step A and Step B. In this case, both methods set 10° to 65° as the blocking band which are used to filter out the linear interference, and the results are shown in Figure 10. The effectiveness of both methods in mitigating linear interference is evident. However, the conventional F-K filtering method exhibits pronounced ringing artifacts that significantly compromise the quality of the final processed outcomes. After comparing the normalized results Figure 10a,b, it becomes evident that the proposed method in this paper exhibits a superior processing effect by effectively highlighting the target and achieving better clutter reduction. In summary, it is apparent that the enhancements suggested in this paper for direct-coupled clutter, surface jitter clutter, and linear clutter are not only effective but also outperform current mainstream methods. A comparison of the final processing results of the complete algorithm will be presented below.
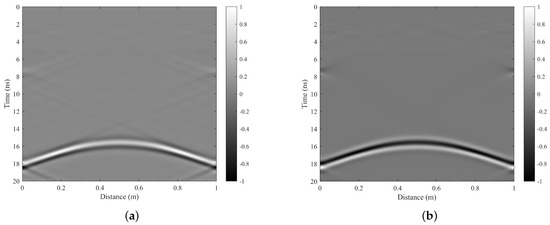
Figure 10.
The comparison of linear interference removal results: (a) The result processed by F-K filter. (b) The result processed by our method Step C.
The final processing results of the algorithm in this paper are compared with the methods proposed by MS [19], SVD [19], RPCA [26], and F-K filter [31]. Figure 8a and Figure 11a–d show the clutter suppression results of MS, SVD, RPCA, F-K filter and the present algorithm, respectively, and the results are normalised. Where the number of singular values removed by the SVD method is 2; in the RPCA method the tolerance for stopping criterion is 0.15; both the F-K filter and the method proposed in this paper set 10° to 65° as the blocking band. The aforementioned parameters represent the optimal values obtained through multiple experimental adjustments. From Figure 8a, it is evident that the MS method fails to effectively eliminate surface jitter interference and linear clutter. Figure 11a demonstrates that while the SVD method exhibits better suppression of direct waves and strong reflections from the surface, it still struggles with removing linear interference and generates transverse artifacts. On the other hand, although the RPCA method achieves superior suppression of various interferences, it introduces some additional clutter, resulting in suboptimal processing outcomes. Traditional F-K method results shown in Figure 11c without edge tapering processing exhibit ringing artifacts and fail to achieve satisfactory performance either. The processing results of the proposed method in this paper, as shown in Figure 11d, effectively suppress all of the direct coupling wave, surface reflection and linear interference, without any appearance of artifacts.
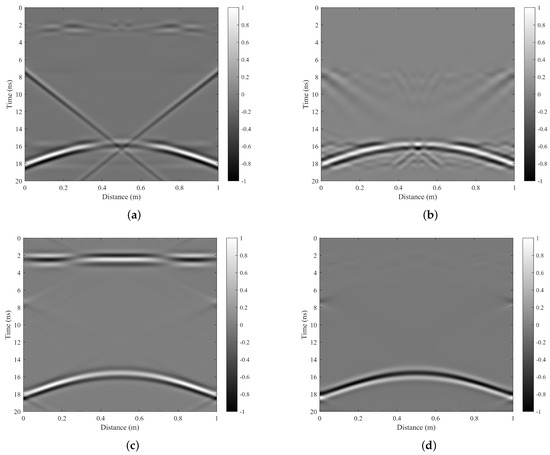
Figure 11.
Simulation results: (a) The result processed by SVD. (b) The result processed by RPCA. (c) The result processed by F-K filter. (d) The result processed by our method.
The comparison of F-K domain data before and after processing is presented in Figure 12. By integrating our derivations in Section 2.1, it becomes evident that our method effectively mitigates the direct wave components adjacent to the frequency axis and linear interference components characterized by lower apparent velocities. Meanwhile, the strong surface vibrations around the frequency axis have also been effectively suppressed. The majority of the remaining energy is attributed to the target waveform, and our method’s exceptional clutter suppression can also be observed in the F-K domain.
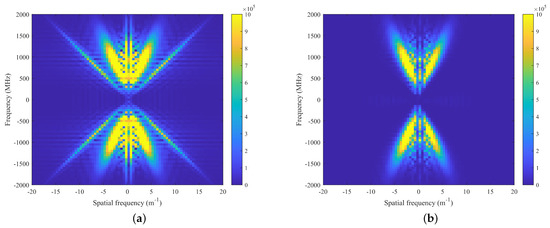
Figure 12.
Simulation results in F-K domain: (a) The raw B-scan data. (b) The processed results.
In order to facilitate quantitative comparison of clutter removal effects achieved by different algorithms, we propose the utilization of two metrics [40]: Signal-to-Clutter Ratio (SCR) and Improvement Factor (IF).
For B-scan data M, the SCR is defined as follows:
where and are the number of elements in the selected signal region and clutter region , respectively. and denote the values of the p-th and q-th elements in the matrix. A higher Signal-to-Clutter Ratio (SCR) value indicates a more effective suppression of clutter.
The definition of IF is as follows:
Among them, and represent the SCR of B-scan data before and after applying clutter suppression methods. The unit of IF is dB, and when the IF value is higher, it indicates better clutter removal effect.
The comparison of the quantitative results of the different methods on simulated data is shown in Table 1:

Table 1.
Quantitative results of simulated data.
The numerical simulation environment employed in this study reveals that both the MS method and the traditional F-K filtering method exhibit limited efficacy in mitigating surface jitter. The SVD method removes surface jitter but cannot suppress linear interference, resulting in average numerical results. On the other hand, RPCA yields better numerical results and effectively improves the Signal-to-Clutter Ratio. In contrast, our proposed method in this paper showcases exceptional performance in both SCR and IF metrics.
3.2. Experimental Result
In order to validate the efficacy of our approach in practical scenarios, a series of experiments were conducted at the Aerospace Information Research Institute of the Chinese Academy of Sciences using our self-developed 1600-MHz GPR system CAS-1600. The schematic diagram of the real test scene we designed is shown in Figure 13. The actual test photos are shown in Figure 14.
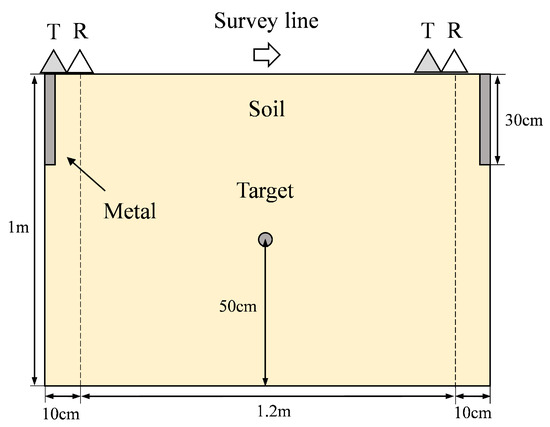
Figure 13.
The schematic diagram of experiment scenario.
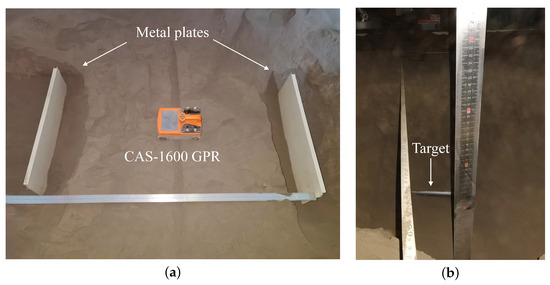
Figure 14.
The real experimental scenario: (a) The placement of interference. (b) The placement of target.
During the experimental test, a measuring line with a length of 1.2 m was employed. Metal plates, measuring 70 cm in length, 2 cm in width, and 30 cm in height, were strategically buried at both ends of the measuring line to induce linear interference waveforms. A metal pipe target with a diameter of 3 cm was positioned at a depth of 50 cm from the central position of the measuring line. The tested medium consisted of volcanic ash exhibiting an approximate relative dielectric constant value of 4. The CAS-1600 GPR operated at a central frequency of 1600 MHz and utilized Ricker wavelet as its excitation waveform. The distance between the transmitting and receiving antennas was approximately maintained at 10 cm.
The original B-scan data are presented in Figure 15a. In this figure, a distinct direct coupling surface reflection waveform can be observed at the position of 2 ns, while the target waveform is distributed between 12–16 ns, exhibiting prominent hyperbolic characteristics. Notably, there is significant downward linear interference on the left side and upward linear interference on the right side. These observed data features are entirely consistent with our numerical simulation results.
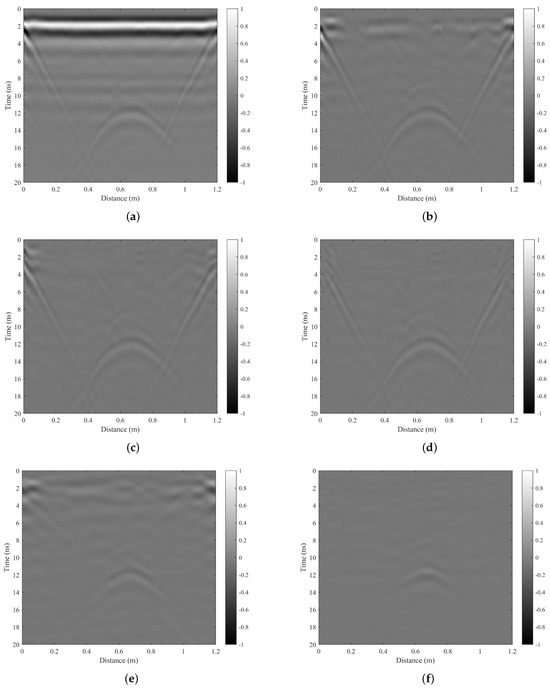
Figure 15.
Experimental results: (a) The raw B-scan data. (b) The result processed by mean subtraction (MS). (c) The result processed by SVD. (d) The result processed by RPCA. (e) The result processed by F-K filter. (f) The result processed by our method.
The algorithm in this article is compared with MS, SVD, RPCA, and F-K filter methods. Figure 15b–f depict the clutter suppression results of MS, SVD, RPCA, F-K filter, and our proposed algorithm respectively. All results have been normalized for comparison purposes. Where the number of singular values removed by the SVD method is 2; in the RPCA method the tolerance for stopping criterion is 0.09; both the F-K filter and the method proposed in this paper set 0° to 55° as the blocking band. The aforementioned parameters represent the optimal values obtained through multiple experimental adjustments. The MS method effectively suppresses direct waves and surface clutter in the original data but fails to eliminate linear clutter. Both SVD and RPCA methods exhibit some effectiveness against surface clutter but are unable to completely remove linear clutter. Although the traditional F-K filter method partially suppresses linear clutter, it does not provide a clear final target image. After applying the proposed method described in the paper, the normalized image exhibits a higher target energy, effectively suppressing surface clutter and linear interference. Simultaneously, it also reveals intricate details within the measured medium, resulting in an optimal overall outcome.
The comparison of F-K domain images before and after processing the measured data is illustrated in Figure 16. By integrating our derivations presented in Section 2.1, it becomes evident that our method effectively mitigates clutter near the frequency axis as well as linear interference components with lower apparent velocities. The remaining energy predominantly corresponds to the target waveform, indicating exceptional clutter suppression performance achieved through our approach, which is further supported by the F-K domain analysis.
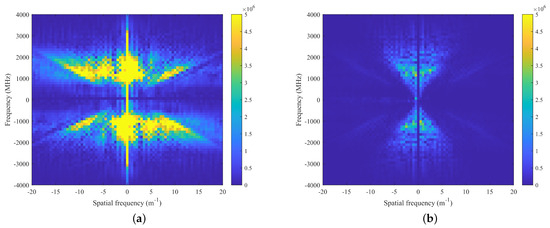
Figure 16.
Experimental results in F-K domain: (a) The raw B-scan data. (b) The processed results.
As shown in Table 2. Quantitative results obtained from experimental data demonstrate that the MS method and traditional F-K filter method exhibit comparable performance, while the SVD method outperforms both. The RPCA approach yields superior results and is more effective in suppressing clutter. The proposed method presented in this paper demonstrates excellent performance in both SCR and IF metrics. Compared to the traditional F-K filter method, it achieves a 12.91 dB improvement on IF value, and compared to the best RPCA result, it improves by 4.54 dB on IF value, which is highly encouraging.
Table 2.
Quantitative results of experimental data.
3.3. The TU1208 Dataset Result
In order to validate the robustness and wide applicability of our method in complex scenarios, we extensively conducted experiments using data from TU1208 Open Database of Radargrams [41]. In consideration of article length constraints, we have selected data collected from limestone survey line 2 using a 270 MHz antenna for demonstration purposes. The profile schematic diagram of limestone survey line 2 is shown in Figure 17.
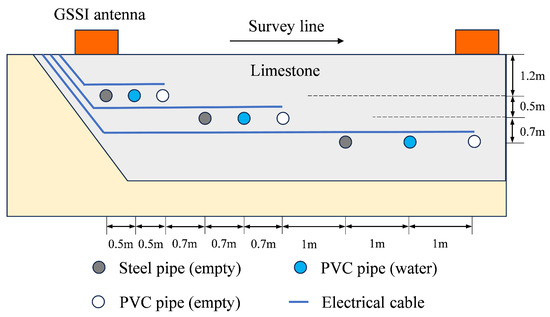
Figure 17.
Profile schematic diagram of the limestone survey line 2 in the TU1208 dataset [41].
The survey line had a length of 12.85 m, and the surveyed profile exhibited a trapezoidal shape filled with limestone. Within this profile, three layers of pipes were laid, each layer containing three pipes: an empty steel pipe, a PVC pipe filled with water, and another empty PVC pipe. Each individual pipe measured 2.5 m in length, while the burial depth varied across the layers. Additionally, the distance between pipes within the same layer increased with depth. Furthermore, each layer featured a large cross-sectional cable oriented orthogonally to the axis of the pipes. The 270 MHz data from limestone area survey line 2 was measured using a GPR system designed by GSSI (Geophysical Survey Systems, Inc; Nashua, NH, USA). The system was used in bistatic configuration, using a 270 MHz antenna with 200 data samples per metre and a time window of 100 ns, during which 1024 32-bit data points were sampled.
The raw GPR data, as shown in Figure 18a, exhibits poor quality, containing a large amount of surface jitter interference and clutter due to non-uniformity of the medium. The presence of a pronounced downward linear interference effect is observed at a distance of 2 m, exhibiting significant strength. We could only barely see the first layer of buried pipe targets at 30 ns.
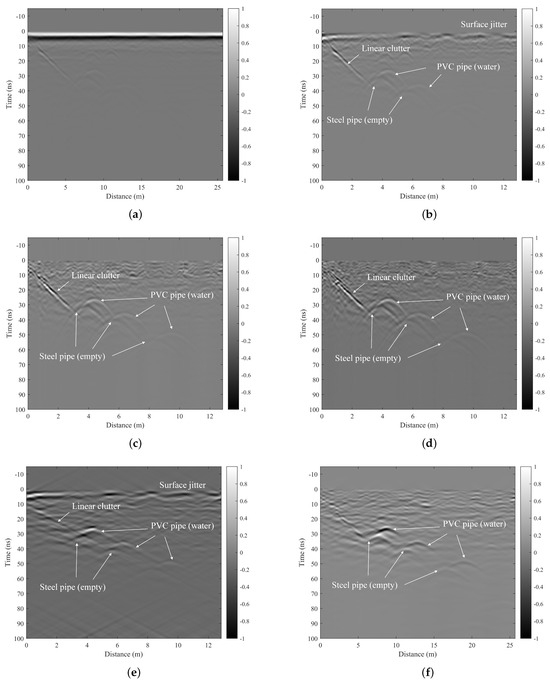
Figure 18.
The TU1208 dataset results: (a) The raw B-scan data. (b) The result processed by mean subtraction (MS). (c) The result processed by SVD. (d) The result processed by RPCA. (e) The result processed by F-K filter. (f) The result processed by our method.
The algorithm in this article is compared with MS, SVD, RPCA, and F-K filter methods. Figure 18b–f depict the clutter suppression results of MS, SVD, RPCA, F-K filter, and our proposed algorithm, respectively. All results have been normalized for comparison purposes, where the number of singular values removed by the SVD method is 5; in the RPCA method the tolerance for stopping criterion is 0.3; and both the F-K filter and the method proposed in this paper set 0° to 55° as the blocking band. The aforementioned parameters represent the optimal values obtained through multiple experimental adjustments. The application of the MS method to the original data resulted in some improvement, enabling us to discern the targets of the second layer of water pipes and steel pipes as depicted in Figure 18b. Nevertheless, surface jitter and linear clutter continue to pose significant interference. The SVD and RPCA methods demonstrate certain similarities in their processing effects, effectively suppressing surface jitter and facilitating the detection of three rows of steel pipes and water pipe targets. However, they are unable to mitigate linear interference. The traditional F-K filtering method partially suppresses linear interference but introduces ringing interference while also exhibiting noticeable surface jitter interference. The method proposed in this article effectively mitigates surface clutter interference and partially alleviates the impact of linear interference. It successfully represents the target waveforms of steel pipes and water pipes at different depths, resulting in larger reflected energy and optimal integrated effects.
The comparison of F-K domain images before and after processing is illustrated in Figure 19. In conjunction with our derivation in Section 2.1, it becomes evident that the prominent downward linear interference components present in the upper left and lower right regions of the original data are effectively suppressed through the method proposed in this paper. Simultaneously, the surface jitter component proximate to the frequency axis is also significantly attenuated, thereby preserving a substantial portion of signal energy associated with the target waveform. As demonstrated above, the comparative results obtained in the F-K domain further validate this paper’s approach for mitigating direct-coupled clutter, surface jitter, and linear interference.
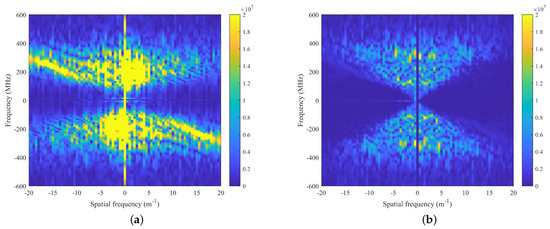
Figure 19.
The TU1208 dataset results in F-K domain: (a) The raw B-scan data. (b) The processed results.
As shown in the quantitative comparison of TU1208 dataset results in Table 3, MS’s method has improved the original data to some extent. The outcomes of SVD and RPCA methods exhibit similarity, although RPCA may slightly underperform due to the introduction of additional noise at shallow layers and amplification of linear interference energy, resulting in a reduction in IF values. The conventional F-K filtering yields unsatisfactory results, likely due to its inability to effectively eliminate strong surface jitter and its tendency to introduce excessive ringing artifacts. Moreover, it exhibits limited applicability when applied to complex scene data. In contrast, the proposed method in this study demonstrates superior performance in both SCR and IF metrics, effectively highlighting the target during processing.
Table 3.
Quantitative results of TU1208 Open Database.
4. Discussion
In response to the issue of susceptibility of GPR B-scan data to environmental clutter, this article presents a model for targets and clutter in the F-K domain. Building upon this foundation, we propose a clutter removal method based on the F-K domain for ground-penetrating radar in complex scenarios, which has successfully enhanced the signal-to-clutter ratio of the GPR data, resulting in an improvement factor of 30.63 dB, 23.59 dB, and 30.60 dB for simulated data, experimental data, and the TU1208 dataset, respectively. These results unequivocally demonstrate the efficacy and superiority of our proposed methodology. The method exhibits high interpretability and finds extensive application in GPR systems manufactured by various companies across different frequency bands. Moreover, the method’s versatility extends beyond GPR signals, as its fundamental principles can be applied to process and optimize seismic wave signals, remote sensing signals, and microwave signals. We anticipate further practical applications of this method in diverse scenarios in the future, including the detection of river dam injuries, identification of underground pipeline corridors, and archaeological exploration, etc.
However, the method proposed in this article fails to effectively address background clutter interference in non-uniform media. Both experimental results and outcomes from the TU1208 Dataset demonstrate the presence of certain interference and clutter at shallow depths. Such clutter is characterized by irregular patterns and weak energy, posing challenges for traditional methods. We will conduct further research around such clutter problems in the future based on the existing research. At the same time, for the weak targets of empty pipelines like those in the TU1208 data, how to augment them effectively is also an issue worth studying in the next stage. The method proposed in this article demonstrates superior performance compared to traditional algorithms, albeit at the expense of increased computational complexity. Moving forward, we will strive to further optimize the algorithm to meet real-time processing requirements for GPR data.
5. Conclusions
The present study proposes a comprehensive clutter removal method based on the F-K domain for B-scan data acquired from GPR, which is susceptible to various environmental interference. This method offers a straightforward procedure and exhibits excellent clutter removal performance in complex scenarios. It is derived from the physical propagation model of electromagnetic waves and F-K domain distribution inference, providing strong interpretability. The proposed method effectively suppresses direct coupling clutter, surface jitter clutter, linear interference, and demonstrates robustness with wide applicability. The comparison of visualised images as well as quantitative results in both simulated and experimental GPR data shows that the method in this paper is clearly superior to the widely used clutter removal methods and can effectively suppress a wide range of clutter. Furthermore, this approach holds significant potential for applications in pipeline inspection, road damage detection, tunnel disease diagnosis, and other related fields. This will enhance the readability of B-scan data and increase the efficiency of subsequent data processing.
Author Contributions
Conceptualization, Q.K., S.Y., X.L. (Xiao Liang) and X.L. (Xu Li); methodology, Q.K., S.Y. and X.L. (Xiao Liang); software, Q.K., X.L. (Xiao Liang) and X.L. (Xu Li); validation, Q.K., X.L. (Xiao Liang) and X.L. (Xu Li); formal analysis, Q.K. and X.L.(Xiaojun Liu); investigation, X.L. (Xiaojun Liu), G.F. and G.S.; resources, S.Y., X.L. (Xiaojun Liu), G.F. and G.S; data curation, Q.K., S.Y., X.L. (Xiaojun Liu) and G.F; writing—original draft preparation, Q.K.; writing—review and editing, X.L. (Xiao Liang), S.Y. and X.L. (Xiaojun Liu); visualization, X.L. (Xiaojun Liu); supervision, X.L. (Xiaojun Liu) and G.F.; project administration, X.L. (Xiaojun Liu), G.F. and G.S.; funding acquisition, S.Y., X.L. (Xiaojun Liu), G.F. and G.S. All authors have read and agreed to the published version of the manuscript.
Funding
This research was funded by the Strategic Priority Research Program of the Chinese Academy of Sciences, grant number XDA28050302; the Science and Technology on Near-Surface Detection Laboratory, grant number 6142414220710; the National Natural Science Foundation of China, grant number 61827803 and by the Science and Technology Research and Development Program Project of China Railway Qinghai-Tibet Group Co., Ltd.
Data Availability Statement
The data are not publicly available due to privacy.
Conflicts of Interest
Author Guixing Si was employed by the company China Railway Tenth Group Telecom Engineering Co., Ltd. The remaining authors declare that the research was conducted in the absence of any commercial or financial relationships that could be construed as a potential conflict of interest.
References
- Daniels, D.J. GPR for landmine detection, an invited review paper. In Proceedings of the Tenth International Conference on Grounds Penetrating Radar, 2004. GPR 2004, Delft, The Netherlands, 21–24 June 2004; Volume 1, pp. 7–10. [Google Scholar]
- Chen, W.; Wang, W.; Gao, J.; Xu, J.; Wang, W. GPR clutter noise separation by statistical independency promotion. In Proceedings of the 2012 14th International Conference on Ground Penetrating Radar (GPR), Shanghai, China, 4–8 June 2012; pp. 367–370. [Google Scholar] [CrossRef]
- Lai, W.W.; Chang, R.K.; Sham, J.F. Detection and imaging of city’s underground void by GPR. In Proceedings of the 2017 9th International Workshop on Advanced Ground Penetrating Radar (IWAGPR), Edinburgh, UK, 28–30 June 2017; pp. 1–6. [Google Scholar] [CrossRef]
- Annan, A.P.; Davis, J.L. Impulse radar sounding in permafrost. Radio Sci. 1976, 11, 383–394. [Google Scholar] [CrossRef]
- Daniels, D. Searching for buried objects with surface penetrating radar. In Proceedings of the Institute of Electrical and Electronics Engineers. 29th Annual 1995 International Carnahan Conference on Security Technology, Sanderstead, UK, 18–20 October 1995; pp. 133–143. [Google Scholar] [CrossRef]
- Pilon, J.; Grieve, R.; Sharpton, V. The subsurface character of Meteor Crater, Arizona, as determined by ground-probing radar. J. Geophys. Res. Planets 1991, 96, 15563–15576. [Google Scholar] [CrossRef]
- Heincke, B.; van der Kruk, J.; Green, A.; Horstmeyer, H. Processing strategy for 3-D georadar data acquired in areas characterized by rugged topography. In Proceedings of the Tenth International Conference on Grounds Penetrating Radar, 2004. GPR 2004, Delft, The Netherlands, 21–24 June 2004; Volume 1, pp. 283–286. [Google Scholar]
- Zhang, Y.; Xia, T. In-Wall Clutter Suppression Based on Low-Rank and Sparse Representation for Through-the-Wall Radar. IEEE Geosci. Remote Sens. Lett. 2016, 13, 671–675. [Google Scholar] [CrossRef]
- Robin, G.d.Q.; Evans, S.; Bailey, J.T. Interpretation of radio echo sounding in polar ice sheets. Philos. Trans. R. Soc. Lond. Ser. A Math. Phys. Sci. 1969, 265, 437–505. [Google Scholar]
- Bogorodskiĭ, V.V.; Bentley, C.R.; Gudmandsen, P.E. Radioglaciology; Springer Science & Business Media: Dordrecht, The Netherlands, 1985; Volume 1. [Google Scholar]
- Baek, J.; Yoon, J.S.; Lee, C.M.; Choi, Y. A Case Study on Detection of Subsurface Cavities of Urban Roads Using Ground-coupled GPR. In Proceedings of the 2018 17th International Conference on Ground Penetrating Radar (GPR), Rapperswil, Switzerland, 18–21 June 2018; pp. 1–4. [Google Scholar] [CrossRef]
- Solla, M.; Lorenzo, H.; Rial, F.I.; Novo, A.; Riveiro, B. Masonry arch bridges evaluation by means of GPR. In Proceedings of the XIII Internarional Conference on Ground Penetrating Radar, Lecce, Italy, 21–25 June 2010; pp. 1–6. [Google Scholar] [CrossRef]
- Liao, X.T.; Hong, T.Q.; Liu, D.J.; Yang, M.W.; Liao, X.T.; Cao, G.X. The analysis of frequency shift of the nonmetallic pipeline’s GPR signal. In Proceedings of the 2016 16th International Conference on Ground Penetrating Radar (GPR), Hong Kong, China, 13–16 June 2016; pp. 1–7. [Google Scholar] [CrossRef]
- Grasmueck, M.; Weger, R.; Horstmeyer, H. Full-resolution 3D GPR imaging for geoscience and archeology. In Proceedings of the Tenth International Conference on Grounds Penetrating Radar, 2004. GPR 2004, Delft, The Netherlands, 21–24 June 2004; Volume 1, pp. 329–332. [Google Scholar]
- Gonzalez-Huici, M.A. A strategy for landmine detection and recognition using simulated GPR responses. In Proceedings of the 2012 14th International Conference on Ground Penetrating Radar (GPR), Shanghai, China, 4–8 June 2012; pp. 871–876. [Google Scholar] [CrossRef]
- Hu, Y.S.; Zeng, Z.F.; Li, J.; Liu, F.S. Simulation and processing of LPR onboard the rover of Chang’E-3 mission: Based on multilayer lunar regolith structure stochastic media model. In Proceedings of the 2016 16th International Conference on Ground Penetrating Radar (GPR), Hong Kong, China, 13–16 June 2016; pp. 1–6. [Google Scholar] [CrossRef]
- Hamran, S.E.; Gjessing, D.; Hjelmstad, J.; Aarholt, E. Ground penetrating synthetic pulse radar: Dynamic range and modes of operation. J. Appl. Geophys. 1995, 33, 7–14. [Google Scholar] [CrossRef]
- Solimene, R.; D’Alterio, A. Entropy-based clutter rejection for intrawall diagnostics. Int. J. Geophys. 2012, 2012, 418084. [Google Scholar] [CrossRef]
- Tesfamariam; Gebremichael, T.; Mali, D.; Zoubir, A.M. Clutter reduction techniques for GPR based buried landmine detection. In Proceedings of the 2011 International Conference on Signal Processing, Communication, Computing and Networking Technologies, Thuckalay, India, 21–22 July 2011; pp. 182–186. [Google Scholar]
- Li, T.-J.; Kong, L.-J.; Zhou, Z.-O. Symmetry filtering method for GPR clutter reduction. In Proceedings of the 2008 International Conference on Microwave and Millimeter Wave Technology, Nanjing, China, 21–24 April 2008; Volume 3, pp. 1515–1517. [Google Scholar] [CrossRef]
- Brunzell, H. Detection of shallowly buried objects using impulse radar. IEEE Trans. Geosci. Remote Sens. 1999, 37, 875–886. [Google Scholar] [CrossRef]
- Chan, T.C.T.; So, H.C.; Ho, K.C. A study on two-sided linear prediction approach for land mine detection. In Proceedings of the 2007 15th European Signal Processing Conference, Poznan, Poland, 3–7 September 2007; pp. 2414–2418. [Google Scholar]
- Cagnoli, B.; Ulrych, T. Singular value decomposition and wavy reflections in ground-penetrating radar images of base surge deposits. J. Appl. Geophys. 2001, 48, 175–182. [Google Scholar] [CrossRef]
- Abujarad, F.; Nadim, G.; Omar, A. Clutter reduction and detection of landmine objects in ground penetrating radar data using singular value decomposition (SVD). In Proceedings of the 3rd International Workshop on Advanced Ground Penetrating Radar, 2005. IWAGPR 2005, Delft, The Netherlands, 2–3 May 2005; pp. 37–42. [Google Scholar] [CrossRef]
- Karlsen, B.; Larsen, J.; Sorensen, H.; Jakobsen, K. Comparison of PCA and ICA based clutter reduction in GPR systems for anti-personal landmine detection. In Proceedings of the 11th IEEE Signal Processing Workshop on Statistical Signal Processing (Cat. No.01TH8563), Singapore, 8 August 2001; pp. 146–149. [Google Scholar] [CrossRef]
- Masarik, M.P.; Burns, J.; Thelen, B.T.; Kelly, J.; Havens, T.C. GPR anomaly detection with robust principal component analysis. In Proceedings of the Detection and Sensing of Mines, Explosive Objects, and Obscured Targets XX, Baltimore, MD, USA, 20–24 April 2015; Volume 9454, pp. 395–405. [Google Scholar]
- Treitel, S.; Shanks, J.L.; Frasier, C.W. Some aspects of fan filtering. Geophysics 1967, 32, 789–800. [Google Scholar] [CrossRef]
- Tong, S.; Wang, D.; Xu, X.; Liu, H.; Zhang, J.; Wang, L. Application of pre-stack FK time migration method in high-density seismic exploration. In Proceedings of the 2010 Second IITA International Conference on Geoscience and Remote Sensing, Qingdao, China, 28–31 August 2010; Volume 2, pp. 366–368. [Google Scholar]
- Serdyukov, A.S.; Yablokov, A.V.; Duchkov, A.A.; Azarov, A.A.; Baranov, V.D. Slant f-k transform of multichannel seismic surface wave data. Geophysics 2019, 84, A19–A24. [Google Scholar] [CrossRef]
- Liu, W.; Duan, Z. Seismic signal denoising using fx variational mode decomposition. IEEE Geosci. Remote Sens. Lett. 2019, 17, 1313–1317. [Google Scholar]
- Hayashi, N.; Sato, M. F–k Filter Designs to Suppress Direct Waves for Bistatic Ground Penetrating Radar. IEEE Trans. Geosci. Remote Sens. 2010, 48, 1433–1444. [Google Scholar] [CrossRef]
- Carpentier, S.F.; Horstmeyer, H.; Green, A.G.; Doetsch, J.; Coscia, I. Semiautomated suppression of above-surface diffractions in GPR data. Geophysics 2010, 75, J43–J50. [Google Scholar] [CrossRef]
- Liu, W.; Huang, W.; Wei, Y.; Chen, X. A noise reduction method based on FK transform for optical fiber hydrophone towed array. In Proceedings of the 2016 IEEE/OES China Ocean Acoustics (COA), Harbin, China, 9–11 January 2016; pp. 1–5. [Google Scholar]
- Wei, X.; Zhang, Y. Interference removal for autofocusing of GPR data from RC bridge decks. IEEE J. Sel. Top. Appl. Earth Obs. Remote Sens. 2015, 8, 1145–1151. [Google Scholar] [CrossRef]
- Yang, C.; Wang, N.; Li, X.; Jiao, Y.; Cui, Y. A United Bandpass-Angular Weighting template for Stolt’s f-k in Coherent Plane-Wave Compounding. In Proceedings of the 2021 IEEE International Ultrasonics Symposium (IUS), Xi’an, China, 11–16 September 2021; pp. 1–4. [Google Scholar] [CrossRef]
- Miwa, T.; Sato, M.; Niitsuma, H. Enhancement of reflected waves in single-hole polarimetric borehole radar measurement. IEEE Trans. Antennas Propag. 2000, 48, 1430–1437. [Google Scholar] [CrossRef]
- Rohman, B.P.; Andra, M.B.; Nishimoto, M. Through-the-wall human respiration detection using UWB impulse radar on hovering drone. IEEE J. Sel. Top. Appl. Earth Obs. Remote Sens. 2021, 14, 6572–6584. [Google Scholar] [CrossRef]
- Kanungo, T.; Mount, D.; Netanyahu, N.; Piatko, C.; Silverman, R.; Wu, A. An efficient k-means clustering algorithm: Analysis and implementation. IEEE Trans. Pattern Anal. Mach. Intell. 2002, 24, 881–892. [Google Scholar] [CrossRef]
- Zhang, L.w.; Nie, J.l. Suppression of Linear Interference Signal in GPR Profiling by Improved fk Filtering Approach. Acta Electron. Sin. 2022, 50, 1444. [Google Scholar]
- Ni, Z.K.; Ye, S.; Shi, C.; Li, C.; Fang, G. Clutter Suppression in GPR B-Scan Images Using Robust Autoencoder. IEEE Geosci. Remote Sens. Lett. 2022, 19, 3500705. [Google Scholar] [CrossRef]
- Dérobert, X.; Pajewski, L. TU1208 open database of radargrams: The dataset of the IFSTTAR geophysical test site. Remote Sens. 2018, 10, 530. [Google Scholar] [CrossRef]
Disclaimer/Publisher’s Note: The statements, opinions and data contained in all publications are solely those of the individual author(s) and contributor(s) and not of MDPI and/or the editor(s). MDPI and/or the editor(s) disclaim responsibility for any injury to people or property resulting from any ideas, methods, instructions or products referred to in the content. |
© 2024 by the authors. Licensee MDPI, Basel, Switzerland. This article is an open access article distributed under the terms and conditions of the Creative Commons Attribution (CC BY) license (https://creativecommons.org/licenses/by/4.0/).