Abstract
The spectroscopic detection of SO2 and unknown UV absorber substance in the H2SO4 cloud layer of Venus’ atmosphere is currently a focal point in the study of the habitability of Venusian atmospheric clouds. This paper addresses the simultaneous detection requirements of multiple substances in the ultraviolet range of Venus’ atmosphere and proposes a multi-channel hyperspectral imaging system design using pupil separation prisms and grating multilevel spectra. The system achieves a multi-channel design by splitting the entrance pupil of the telescope using prisms. Spectra from different channels are diffracted to the same detector through different orders of the grating. The system features a single spectrometer and detector, enabling simultaneous detection of spectra from different channels. It also boasts advantages such as compact size, ultra-high spectral resolution, and simultaneous multi-channel detection. The system design results indicate that within the working spectral range of three channels, the spectral resolution is better than 0.15 nm, surpassing previous in-orbit or current in-orbit planetary atmospheric detection spectrometers. With a Nyquist frequency of 56 lp/mm, the full-field MTF exceeds 0.7. The system’s smile is less than 0.05 μm, and the keystone is less than 0.04 μm, meeting the requirements for imaging quality.
1. Introduction
Venus closely resembles Earth in appearance, mass, and size, and has long been regarded as Earth’s twin [1,2]. As illustrated in Figure 1, the atmosphere of Venus primarily comprises the troposphere, sulfuric acid (H2SO4) cloud layer, mesosphere, and thermosphere. Among these, the H2SO4 cloud layer plays a predominant role in influencing the Venusian atmosphere. Its atmospheric pressure and temperature are nearly identical to Earth’s and remain in a relatively stable state [3,4]. Therefore, researchers believe that the H2SO4 cloud layer in the atmosphere of Venus could serve as a habitable cloud layer. This renewed interest has sparked further research into the atmospheric cloud layers of Venus. In the field of Venus’s atmospheric exploration, 46 missions have been conducted since the successful launch of “Sputnik 7” in 1961, with typical exploration tasks depicted in Figure 2. In 1962, the Mariner 2 spacecraft became the first successful space probe to fly by another planet, collecting atmospheric temperature and weather data of Venus, and confirming the high surface temperature characteristics of the planet [5,6]. Venera 4 entered orbit around Venus in 1967, becoming the first spacecraft to retrieve atmospheric data from a planet beyond Earth [7]. The data from Venera 4 confirmed that the primary components of Venus’s atmosphere are CO2 and N2, with CO2 constituting a staggering 96.5% and N2 making up 2.5% [8]. Additionally, it revealed the absence of a magnetic field on the surface of Venus. Venera 9 landed on the surface of Venus in 1975 and returned the first image of the rocky landscape on the surface of Venus, giving the first visual understanding of Venus’s world [9]. In 1984, the Soviet Union launched the Venera Gallei 1 probe [10]. The trajectory of the mission involved visiting Venus and then entering a comet exploration orbit. During the descent, the probe utilized a UV spectrometer to measure the ultraviolet absorption features in the Venusian atmosphere, with a working wavelength range of 120~290 nm. This revealed the presence of SO2 and potentially sulfur atomic vapor in the atmosphere of Venus, providing an explanation for the observed Venusian cloud layer circulation phenomenon in the ultraviolet spectrum [11]. In 2005, the ESA launched the Venus Express probe, aiming to gain in-depth insights into the atmosphere and environment of Venus [12]. By measuring parameters such as temperature, pressure, and composition of the atmosphere, as well as observing phenomena like cloud layers and winds, the probe aimed to understand the climate and atmospheric structure of Venus [13]. In 2010, the Japanese Akatsuki probe successfully entered orbit around Venus, contributing to the study of the planet’s atmosphere and weather patterns and achieving significant milestones [14]. It provided valuable data on Venusian cloud layers and atmospheric circulation, enhancing our understanding of Venus and its unique atmospheric characteristics [15].
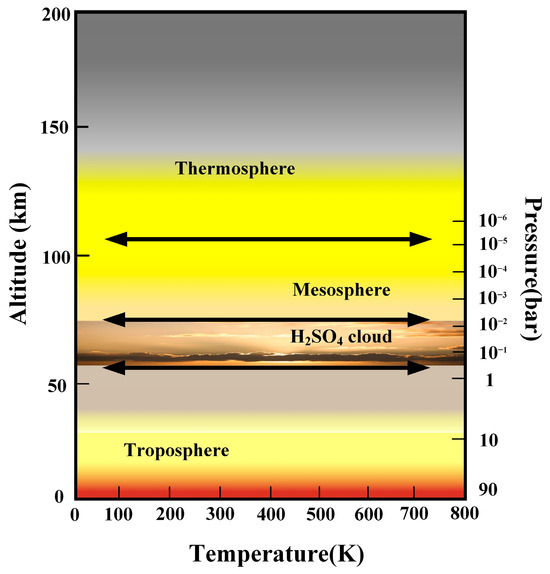
Figure 1.
Distribution of Venus’ atmosphere.
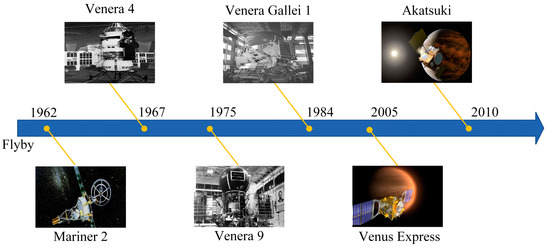
Figure 2.
Typical missions for remote sensing detection of the atmosphere of Venus.
SO2 is the third most abundant gas in the atmosphere of Venus [16,17]. As shown in Figure 3, the composition of Venus’ atmosphere indicates that SO2 ranks just below the dominant gases CO2 and N2 [18]. Volcanic eruptions on the surface of Venus release a significant amount of SO2 into the atmosphere, leading to the formation of the H2SO4 cloud layer [19,20]. As illustrated in Figure 4, the H2SO4 cloud layer undergoes a series of reactions, resulting in the decomposition of SO2 back to the surface [21]. The interaction between SO2 and the H2SO4 cloud layer plays a crucial role in determining the chemical composition, formation mechanisms, and evolution of the atmospheric cloud layers on Venus. At the same time, research shows the presence of an unknown UV absorber substance in the atmospheric cloud layers of Venus, and its absorption energy accounts for about half of the total energy absorbed by Venus in solar radiation. As shown in Figure 5, the chemical composition of this substance remains a mystery [22,23]. Some scientists even speculate that this material could be evidence of life on Venus. Therefore, the study of SO2 and the unknown UV absorber substance in the atmosphere of Venus contributes to a better understanding of the nature and evolution of Venusian atmospheric cloud layers. It unravels the mysteries surrounding the formation mechanisms of the H2SO4 cloud layer and provides evidence for the habitability of Venusian cloud layers. Simultaneously, the detailed analysis of the ultra-fine spectral features of the unknown UV absorber substance aids in identifying its chemical composition and elucidating its origin mechanisms.
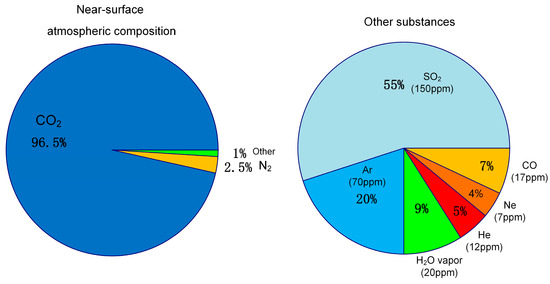
Figure 3.
Composition of Venus’ atmosphere.
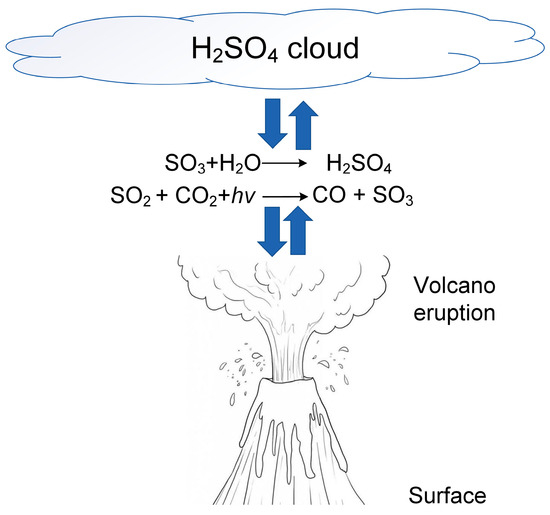
Figure 4.
Schematic diagram of the formation principle of H2SO4 cloud layer.

Figure 5.
The possible composition of the unknown UV absorber substance.
Atmospheric remote sensing detection technology utilizes remote sensing instruments to collect the spectral information of target objects. After data processing, this enables the identification and monitoring of the target objects. Atmospheric remote sensing platforms include ground-based, space-based, and airborne platforms. Among these, space-based remote sensing platforms utilize satellites as carriers to remotely detect the atmospheres of target celestial bodies. Imaging spectrometers are currently one of the primary instruments for remote sensing detection [24,25]. According to the research [26], the absorption peaks in the ultraviolet range for SO2 and the unknown UV absorber substance are depicted in Figure 6. The determined operational spectral range for the designed ultraviolet imaging spectrometer is within the 180~400 nm wavelength range. This range encompasses the ultraviolet strong absorption peaks of SO2 at 215 nm and 283 nm, as well as the unknown UV absorber substance’s strong absorption peak at 365 nm. By detecting the spectral characteristics of SO2 and the unknown UV absorber substance and employing spectral data inversion processing, the concentrations and distribution characteristics of these substances, as well as the identification of the components of the unknown UV absorber substance, can be obtained. This facilitates research on the habitability of the Venusian atmosphere and atmospheric radiative balance [27,28,29].
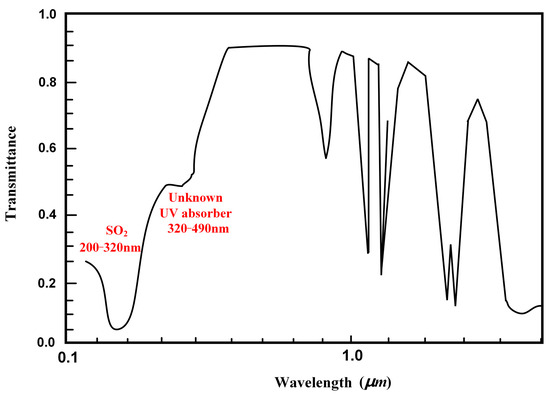
Figure 6.
Transmittance curve diagram of SO2 and unknown UV absorber substance in the H2SO4 cloud layer of Venus’s atmosphere.
In order to simultaneously acquire ultra-fine spectral data for both SO2 and the unknown UV absorber substance, the ultraviolet imaging spectrometer should possess characteristics such as ultra-high spectral resolution, simultaneous detection of multiple substances, and system miniaturization. However, the current research on UV imaging spectrometers for planetary atmospheric detection, both domestically and internationally, has not yet met these requirements. The SPICAV imaging spectrometer carried on Venus Express, developed by ESA, operates in the spectral range of 0.118~0.32 μm [30]. The system is designed with a single-channel structure, and the spectral resolution is only 1.5 nm. Similarly, ESA-developed Sentinel-5 carries two imaging spectrometers, namely UV1 and UV2-VIS [31,32]. Both have a single-channel design, corresponding to spectral ranges of 0.27~0.31 μm and 0.3~0.5 μm, with spectral resolutions of 1 nm and 0.5 nm, respectively. The IUVS imaging spectrometer, developed by NASA and mounted on MAVEN, utilizes a beam splitter to divide the spectral imaging system into two channels [33,34]. These two channels image onto the surfaces of two detectors. The operational spectral ranges are 0.11~0.19 μm and 0.18~0.34 μm, with spectral resolutions of 0.6 nm and 1.2 nm, respectively. While IUVS achieves multi-channel detection, it employs multiple detectors for spectral reception, making the system relatively complex with lower spectral resolution. The Hope probe, developed by the United Arab Emirates Mars Mission (EMM), carries a Mars ultraviolet and far ultraviolet spectrometer (EMU) [35]. The instrument operates in the spectral range of 0.1~0.170 μm and is primarily designed for studying the composition and evolution of the upper atmospheric cloud layers on Mars. The system is designed with a single-channel structure and has a spectral resolution of 1.3 nm [36]. The EMI (UV-Visible Imaging Spectrometer) carried on China’s GF-5 satellite is composed of a telescope system and a relay optical path [37]. The relay optical path divides the incident light into four channels and transmits it to different spectral imaging systems. The operational spectral ranges are 0.24~0.5 μm, 0.306~0.34 μm, 0.401~0.55 μm, and 0.545~0.710 μm, with spectral resolutions ranging from 0.3 to 0.5 nm [38]. Although this system meets the requirements for multi-channel detection, it necessitates the use of multiple spectral imaging systems, leading to issues such as excessive volume. Tianwen-1 is China’s second Mars exploration mission, and it carries a high-resolution camera with a working spectral range of 0.45~0.9 μm [39]. The system is designed with a long focal length and three-mirror optical structure, consisting of three reflective mirrors with focal power and one flat mirror without focal power. The camera will only be able to image Mars and will not be able to detect its spectrum [40].
In response to the issues of low spectral resolution and the inability to simultaneously detect multiple channels in the aforementioned planetary atmospheric detection imaging spectrometer, this paper proposes a novel imaging spectrometer system. The highlights of this study include:
- A multi-channel hyperspectral imaging spectrometer for ultraviolet detection of Venus’s atmosphere is proposed.
- Emphasis is placed on the introduction of the design principles of the pupil separation prism and the grating multilevel spectra. Simultaneously, the selection of the spectral imaging system structure is conducted, and its design principles are introduced.
- Through the initial structure calculation and optical design software optimization simulation, a UV multi-channel hyperspectral imaging spectrometer system is obtained. This system achieves simultaneous three-channel spectral detection using only a single spectrometer system and detector, with a high spectral resolution of up to 0.15 nm.
2. Multi-Channel Hyperspectral Imaging Spectrometer System Design Principles
The multi-channel hyperspectral imaging spectrometer system employs a single spectrometer system and detector to achieve hyperspectral detection of SO2 and unknown UV absorber substances in the H2SO4 cloud layer of Venus at the same position. The multi-channel hyperspectral imaging spectrometer system layout is depicted in Figure 7, utilizing prisms to split the entrance pupil of the telescope system into multiple sub-pupils. Different sub-pupils correspond to different channels, and different channels can be used to detect different objects through different working bands. The incident light is imaged onto a slit, and due to the presence of prisms, the slit is spatially separated. The separated slit enters the spectral imaging system used for multi-channel coupling. The design of this spectral imaging system is a self-collimating structure where the collimating system and imaging system share the same set. This design significantly reduces the size and weight of the system. Different channel spectral ranges undergo diffraction at different orders of gratings and converge onto the same detector surface. This design achieves ultra-high-resolution detection of different target spectra in different channels under a single spectrometer system and detector.
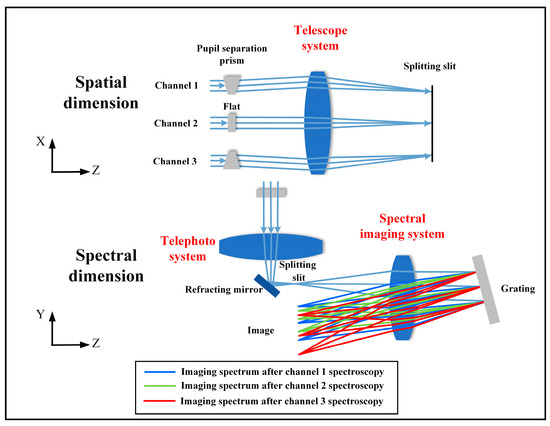
Figure 7.
Multi-channel hyperspectral imaging spectrometer system layout diagram. Note: the blue light represents Channel 1: the distribution schematic of the imaging spectrum on the image plane after spectral dispersion in the 180~220 nm range; the green light represents Channel 2: the distribution schematic of the imaging spectrum on the image plane after spectral dispersion in the 275~305 nm range; and the red light represents Channel 3: the distribution schematic of the imaging spectrum on the image plane after spectral dispersion in the 360~400 nm range.
2.1. Pupil Separation Prism Design
The imaging spectrometer system designed in this paper uses only a single detector to receive the imaging spectra of SO2 and unknown UV absorber substances. Therefore, it is necessary to spatially separate different spectra to avoid overlap. This is achieved by separating slits on the focal plane of the telescope, where different slits correspond to different channel spectral ranges. The separated slits are obtained through the segmentation of the entrance pupil of the telescope system using a prism array. This prism is referred to as a pupil-separation prism.
The structure of a traditional telescope system without a pupil-separation prism is illustrated in Figure 8, where the slit continuously contains only one channel [41]. If one aims to achieve ultra-high spectral resolution detection in the 180~400 nm range with 0.15 nm resolution, there is an issue where the imaged spectrum exceeds the effective working area of the detector after dispersion through the spectral imaging system. Therefore, a traditional single spectrometer system cannot achieve multi-channel, hyperspectral resolution detection.
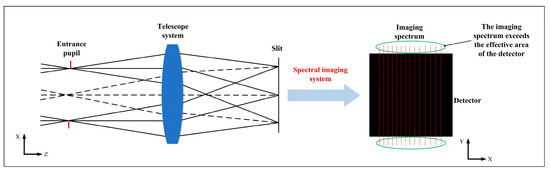
Figure 8.
Imaging principle of telescope system without pupil separation prisms and detector spectral distribution diagram.
The working principle of the pupil separation prism is illustrated in Figure 9. Two prisms and one flat plate are placed at the entrance pupil of the front telescope system. A flat plate is positioned in the central channel to ensure the straight-line nature of the central channel system, facilitating later adjustments. They divide the incident light pupil of the telescope system into three sub-pupils. These three sub-pupils correspond to the same field of view. The incident light, passing through these three sub-pupils, forms separate slits at the location of the slit. The separated slits ensure that the imaging spectra of different channel spectral ranges, after dispersion through the spectral imaging system, do not overlap in the spatial dimension. Different prisms and flat plates are coated with corresponding working channel spectral bandpass filters to prevent crosstalk between different wavelength bands. Mechanically, a light shield is designed on each prism’s entrance structure to prevent interference from other fields of view. The design of the spacing “L” between split slits and the total slit length needs to consider the effective working size of the detector. The spacing between split slits should not be too short to avoid the occurrence of overlapping dispersion spectra of different channels.
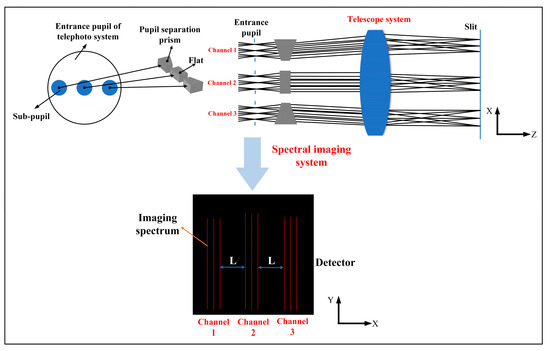
Figure 9.
Imaging principle of telescope system with pupil separation prisms and detector spectral distribution diagram.
2.2. Grating Multilevel Spectra Design
To ensure that the imaging spectra of different channels, after dispersion through the spectral imaging system, reach the same detector surface without exceeding the effective photosensitive area of the detector in the spectral dimension, a grating multilevel spectra approach is employed. Different channels use different diffraction orders of the same grating. If the diffraction angles are not significantly different, imaging on the same detector can be achieved. According to Equation (1) of the grating equation, if the same diffraction order is used, the imaging spectra of different channels will exhibit a step-like distribution, as shown in Figure 10a, surpassing the effective working area of the detector. Therefore, employing different diffraction orders for different spectral channels results in diffraction patterns, as shown in Figure 10b. This method ensures that the diffraction angles for each spectral channel are not significantly different, allowing the dispersed spectra of different channels to image within the effective working area of the detector in the spectral dimension.
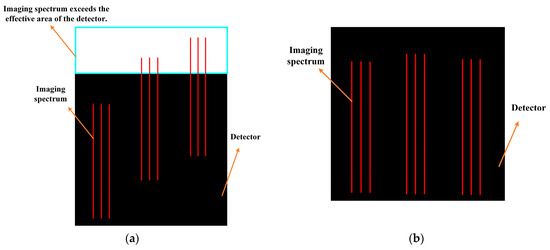
Figure 10.
Diffraction results of gratings with the same and different order in different channel spectral segments. Note: (a) The spectral distribution of the effective photosensitive area of the detector after different channel spectral segments are diffracted by the same order of grating. The imaging spectrum exceeds the effective area of the detector. (b) The spectral distribution of the effective photosensitive area of the detector after different channel spectral segments are diffracted at different orders by the grating. The imaging spectrum does not exceed the effective area of the detector.
Grating equation:
“d” represents the grating constant, “” is the incident angle, “” is the diffraction angle, “m” is the diffraction order, and “” is the working wavelength.
2.3. Spectral Imaging System Structure Selection and Design
The proposed multi-channel hyperspectral imaging spectrometer system in this article not only needs to meet the requirements of hyperspectral resolution and simultaneous multi-channel detection but also requires a compact design. Therefore, the selection of the spectral imaging system structure is influenced by various factors, such as system size, optical lens surface type, system spectral smile, and keystone. This article conducts research and simulation on various spectral imaging system structures. The simulated optical path diagrams of each system are shown in Figure 11, including the Offner structure, Wynne–Offner structure, Czerny–Turner structure, Dyson structure, and off-axis three-mirror self-collimating structure. The design results of the aforementioned spectral imaging system structures are presented in Table 1 below. All structures are designed for simultaneous detection in three channels, with the same operating wavelength bands (T1 = 180~220 nm, T2 = 275~305 nm, T3 = 360~400 nm). A spectral resolution of 0.15 nm is required for all structures, and the field of view is consistent at 1°.
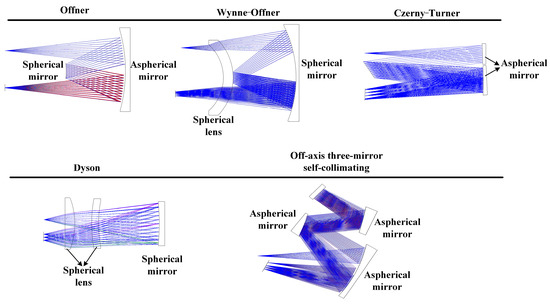
Figure 11.
Optical path diagrams of spectral imaging systems with different structures.

Table 1.
Design results of spectral imaging systems with different structures.
Based on the comprehensive simulation and analysis results, it is evident that the abovementioned spectral imaging systems all exhibit excellent spectral imaging performance. However, not all structures meet the design requirements for compactness, miniaturization, and the use of spherical optical lens surfaces. After comparing the design results of various types of spectral imaging systems, this article selects the Wynne–Offner spectral imaging system structure. The Wynne–Offner spectral imaging system structure is shown in Figure 12, where all optical lens surfaces in this structure are spherical [42]. Additionally, this structure incorporates a correcting lens with negative dispersion and a curvature towards the flat surface [43]. The convex reflective grating coincides with the lens’s rear surface. The incident light passes through the correcting lens twice, correcting aberrations caused by the off-axis slit, effectively reducing dispersion in the system. Additionally, the angle of incidence for light rays from the edge of the slit’s field of view reaching the correcting lens is significantly greater than the angle for rays from the central field of view. As the angle of incidence increases, the deviation angle also increases. The larger deviation towards the short-wave direction compensates for the system smile, effectively counteracting each other. Therefore, the Wynne–Offner spectral imaging structure not only eliminates third-order Seidel aberrations in the system but also minimizes the smile in the system.
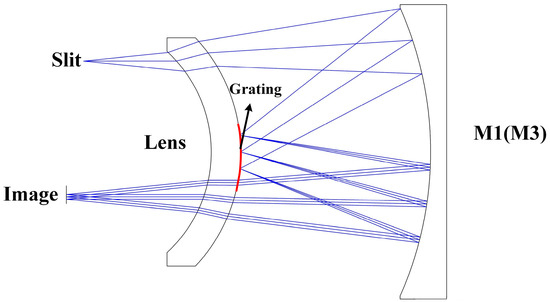
Figure 12.
Wynne–Offner spectral imaging system structure diagram.
The optical path of the Wynne–Offner spectral imaging system is illustrated in Figure 13. The system comprises a concave mirror M, a convex diffractive grating G, and a correcting lens L. The grating G is located at the center of the rear surface of the correcting lens L, with the aperture stop coinciding with the grating G. The front and rear surfaces of M, G, and L share a common center of curvature, denoted as C. R1 is the radius of curvature of the front surface, R2 is the radius of curvature of the rear surfaces of G and L, and R3 is the radius of curvature of M. For an arbitrary point O on the slit, the incident angle on the front surface of L is denoted as , the refracted angle as , the incident angle on the rear surface of L as , and the refracted angle as . The main ray incident on M has an angle of incidence denoted as , and on G as . The radius of curvature of the concave mirror M is R3 = 2R2, and the refractive index of the correcting lens L is denoted as n. The off-axis distance of the slit point O is represented as h.
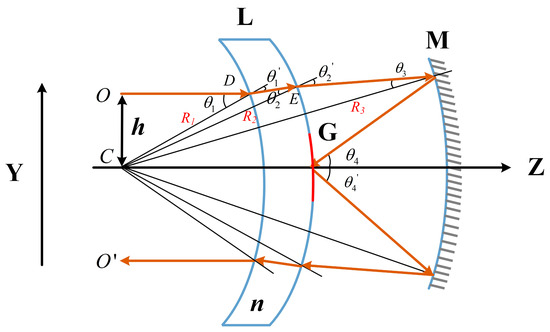
Figure 13.
Wynne–Offner spectral imaging system optical path diagram.
From the geometric relationship within , it can be inferred that:
From the sine formula in , the following can be obtained:
According to Snell’s law, the following is obtained:
The spectral surface height after dispersion in the Wynne–Offner spectral system is denoted as H.
Here, m represents the diffraction order of the grating, d is the grating constant, and is the width of the working spectral range.
Considering the above, R1, R2, and R3 are represented as:
3. Multi-Channel Hyperspectral Imaging Spectrometer System Optical Design
In the design process of the multi-channel hyperspectral imaging spectrometer, the inclusion of a pupil separation prism in the telescope system can lead to a non-image side telecentric problem where the central light is not perpendicular to the image plane. This issue can directly result in a failure in the dock between the telescope system and the spectral imaging system. Therefore, besides ensuring the imaging quality of the telescope system, it is necessary to ensure that the slit-emitted lights are image-side telecentric, making it conducive to alignment and integration with the spectral imaging system. Another challenge lies in the selection of the diffraction orders for the grating. As three channels share the same plane grating for dispersion, the design of different channel grating diffraction orders needs to consider two aspects. Firstly, the dispersion spectrum should not exceed the effective working area of the detector. Secondly, the dispersion length should not be too short to avoid wasting the detection area of the detector. This section provides the design results and performance of the multi-channel hyperspectral imaging spectrometer.
3.1. Multi-Channel Hyperspectral Imaging Spectrometer System Design Example
Based on the above design principles, this paper addresses the ultraviolet spectroscopic detection of SO2 and the unknown UV absorber substance in Venus’s atmosphere. To achieve this, a multi-channel hyperspectral imaging spectrometer has been designed. The operational spectral range of the system is selected in the ultraviolet band, which covers the absorption peak of the substance to be measured. At the entrance of the telescope system, two pupil separation prism assemblies (P1, P2) and a flat mirror (F1) are placed, dividing the entrance pupil into three channels. The deviation angle of the pupil separation prism assemblies is designed to be 4° based on the slit size and physical separation. The three channels correspond to the following operational spectral ranges: T1 = 180~220 nm, T2 = 275~305 nm, T3 = 360~400 nm. The telescope system has an F-number of 5 and a focal length of 150 mm. The system adopts a transmissive structure, and all optical elements are spherical mirrors. The lens materials consist of a combination of silica and CaF2.
The spectral imaging system adopts the Wynne–Offner structure. In the spectral imaging system, both the reflective mirrors and the corrective lens are spherical. The dispersive element is a convex spherical reflective grating with a groove density of 238 gr/mm. By calculating the diffraction angles for the center wavelengths of different channels according to the grating equation, three diffraction orders with similar diffraction angles are selected for the center wavelengths of the three channels. This ensures that the spectrum after three-channel dispersion can be imaged on the same detector surface. The diffraction orders for the three channels are chosen as +5, +4, and +3, corresponding to channels 1, 2, and 3, respectively.
Utilizing optical design software, both the telescope system and the Wynne–Offner spectral imaging system have been optimized to enhance the imaging quality of the overall optical system. After optimization, the two systems are integrated, and the complete optical system structure is illustrated in Figure 14 and Figure 15. The key performance parameters of the multi-channel hyperspectral imaging spectrometer system are presented in Table 2. The overall system magnification ratio is 1, and the spectral resolution of all three channels is better than 0.15 nm. The Nyquist frequency is at 56 lp/mm, and the modulation transfer function (MTF) across the full field of view exceeds 0.7. The overall system has an F-number of 5, with dimensions of 105 × 325 × 600 (mm) in the XYZ directions.
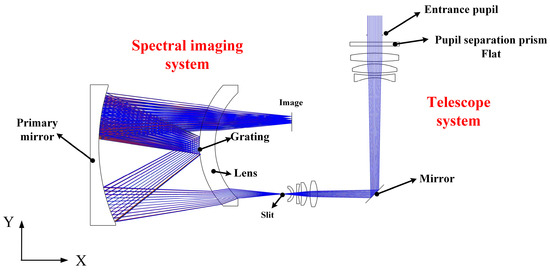
Figure 14.
Two-dimensional diagram of the multi-channel hyperspectral imaging spectrometer system.
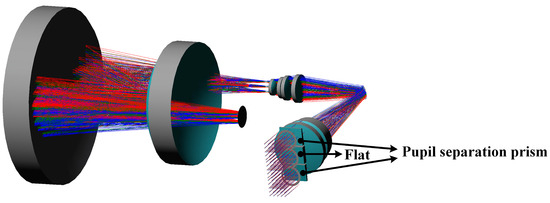
Figure 15.
Three-dimensional diagram of the multi-channel hyperspectral imaging spectrometer system.
Table 2.
Multi-channel hyperspectral imaging spectrometer system index parameters.
The multi-channel hyperspectral imaging spectrometer system, designed based on the proposed method in this paper, not only meets the requirements for simultaneously detecting Venusian atmospheric ultraviolet SO2 and unknown UV absorber substance but also possesses advantages such as ultra-high spectral resolution and compact size. The design of the pupil separation prism and the grating multilevel spectra enables simultaneous multi-channel detection in a single system, significantly improving spectral resolution compared to previous imaging spectrometers used for planetary atmospheric exploration.
3.2. Detector Parameters
This paper utilizes the Dhyana 4040BSI large-area sCMOS cooled detector. The detector is produced by Gpixel in Changchun, Jilin Province, China. The detector has a pixel count of 4096 (H) × 4096 (V), with individual pixel dimensions of 9 μm × 9 μm, covering a photosensitive area of 36.9 × 36.9 mm. The quantum efficiency reaches up to 60% in the ultraviolet wavelength range. The key performance parameters of the detector are summarized in Table 3. Figure 16 illustrates the 4040BSI detector, while Figure 17 displays the quantum efficiency curve for this array detector. The quantum efficiency of this detector remains above 35% in the 180~400 nm spectral range, meeting the requirements for the system’s use in this study.
Table 3.
Key performance parameters of the 4040BSI detector.
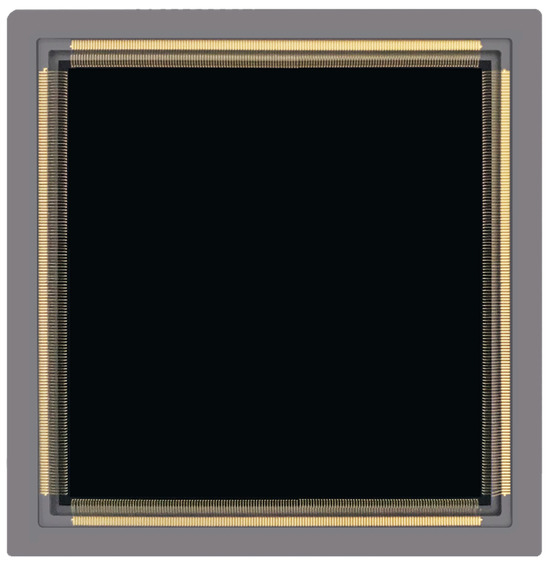
Figure 16.
4040BSI Detector.
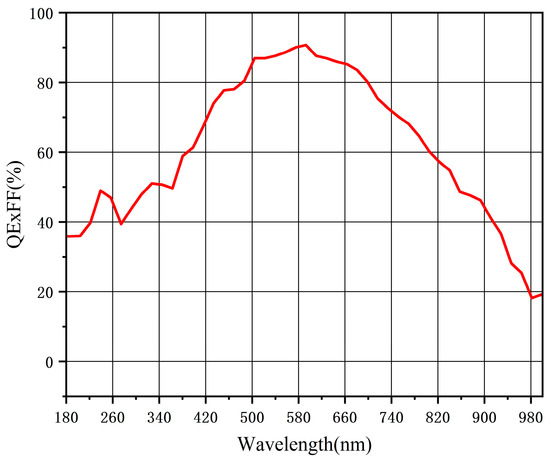
Figure 17.
Quantum efficiency curve of the 4040BSI detector.
3.3. Evaluation Indicators
This article used various evaluation indicators to comprehensively assess the performance of the multi-channel hyperspectral imaging spectrometer system, including modulation transfer function (MTF), spectral smile, and keystone. MTF is defined as the ratio of image modulation to object modulation [44]. It is a function of spatial frequency represented in lp/mm. The larger the area enclosed by the MTF curve and the coordinate axes, the more information the optical system transmits, indicating better imaging quality. A straighter MTF curve suggests better consistency between edge and center imaging in the optical system. A spectral smile is an aberration acting on the direction of spectral dimension, which will cause the center wavelength of each spectral channel to shift, resulting in the output signal of the corresponding pixel of each spectral channel changing [45]. Keystone is an aberration acting in the spatial direction that can cause spectral crosstalk between two adjacent spatial channels [46]. Therefore, the spectral smile and keystone of the imaging spectrometer system should be minimized. Tolerance analysis was conducted for the multi-channel hyperspectral imaging spectrometer system designed in this article. The errors in the process of component processing and assembly and adjustment were introduced into the imaging spectrometer system, the influence of each error on the imaging performance of the optical system of the imaging spectrometer was analyzed, and the tolerances were reasonably allocated [47]. This was performed so that it can not only meet the requirements of imaging quality but also will not lead to the increase of manufacturing cost and the difficulty of assembly and adjustment.
3.3.1. Modulation Transfer Function
MTF can comprehensively reflect the imaging quality of an optical system [48]. Figure 18, Figure 19 and Figure 20 provide the modulation transfer function at the Nyquist frequency of 56 lp/mm for the longwave and shortwave in channels T1, T2, and T3. The results indicate that the MTF values for each channel’s wavelength at the Nyquist frequency of 56 lp/mm are all above 0.7, indicating good image quality and meeting the requirements for imaging quality.
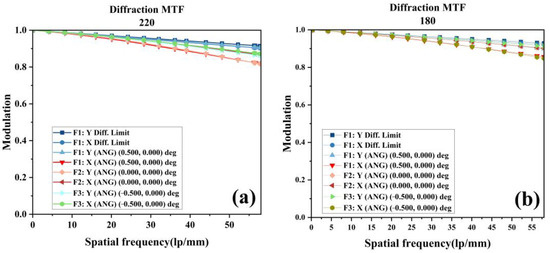
Figure 18.
MTF curves for longwave and shortwave in T1 channel. Note: (a) MTF curve for longwave at 220 nm in T1 channel, Nyquist frequency 56 lp/mm; (b) MTF curve for shortwave at 180 nm in T1 channel, Nyquist frequency 56 lp/mm.
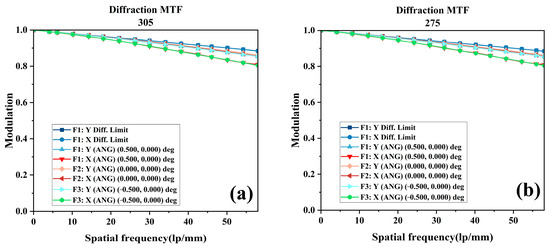
Figure 19.
MTF curves for longwave and shortwave in T2 channel. Note: (a) MTF curve for longwave at 305 nm in T2 channel, Nyquist frequency 56 lp/mm; (b) MTF curve for shortwave at 275 nm in T2 channel, Nyquist frequency 56 lp/mm.
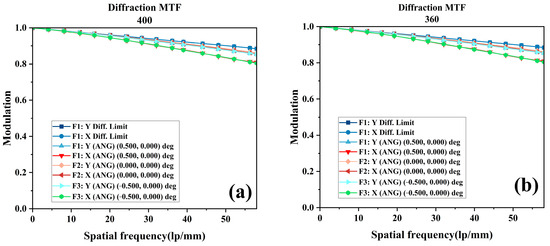
Figure 20.
MTF curves for longwave and shortwave in T3 channel. Note: (a) MTF curve for longwave at 400 nm in T3 channel, Nyquist frequency 56 lp/mm; (b) MTF curve for shortwave at 360 nm in T3 channel, Nyquist frequency 56 lp/mm.
3.3.2. Spectral Smile and Keystone
The spectral smile and keystone are also crucial evaluation metrics for spectral imaging systems. Smile is caused by the inconsistency of the dispersion rate of the spectral device to the different positions of the imaging target [49]. Keystone is caused by inconsistencies in the magnification of different wavelengths of the imaging target [50]. Figure 21 and Figure 22 depict the smile and keystone curves for the multi-channel hyperspectral imaging spectrometer system. As shown in Figure 21, the smile of the system is less than 0.05 μm. Figure 22 indicates that the keystone of the system is less than 0.04 μm. Both metrics meet the usage requirements.
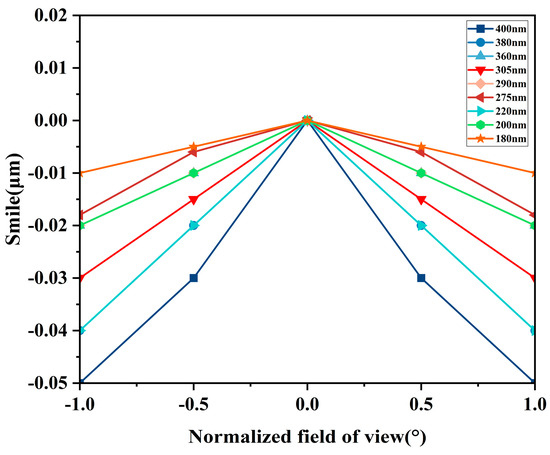
Figure 21.
Smile curve for the multi-channel hyperspectral imaging spectrometer system.
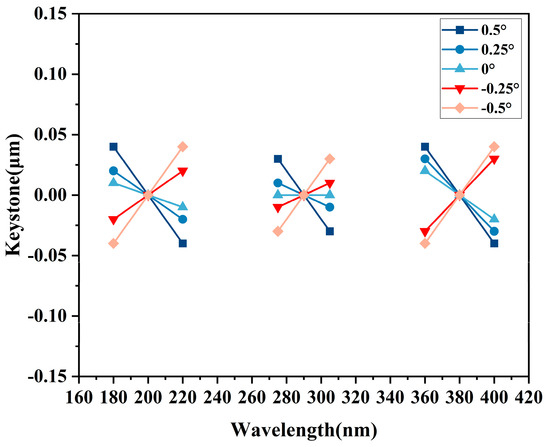
Figure 22.
Keystone curve for the multi-channel hyperspectral imaging spectrometer system.
3.3.3. Tolerance Analysis
Tolerance analysis was conducted on the ultraviolet multi-channel hyperspectral imaging spectrometer system designed in this article. The results of tolerance allocation are shown in Table 4. MTF is utilized as the evaluation criterion for the optical system’s performance throughout the tolerance analysis process, and sensitivity analysis is conducted for all tolerance allocations [51]. Figure 23, Figure 24 and Figure 25 illustrate the tolerance analysis results for longwave and shortwave in different channels. The horizontal axis represents the MTF values, while the vertical axis represents the probability of achieving optical performance corresponding to the indicated MTF values.
Table 4.
Tolerance allocation results.
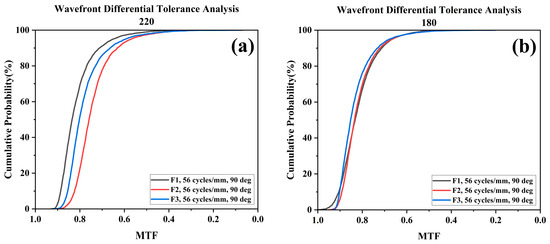
Figure 23.
Tolerance–MTF curves for longwave and shortwave in T1 channel. Note: (a) Tolerance–MTF curve for longwave at 220 nm in T1 channel, Nyquist frequency 56 lp/mm; (b) Tolerance–MTF curve for shortwave at 180 nm in T1 channel, Nyquist frequency 56 lp/mm.
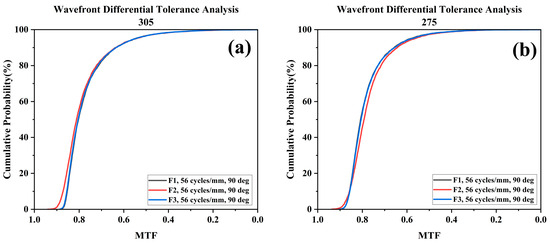
Figure 24.
Tolerance–MTF curves for longwave and shortwave in T2 channel. Note: (a) Tolerance–MTF curve for longwave at 305 nm in T2 channel, Nyquist frequency 56 lp/mm; (b) Tolerance–MTF curve for shortwave at 275 nm in T2 channel, Nyquist frequency 56 lp/mm.
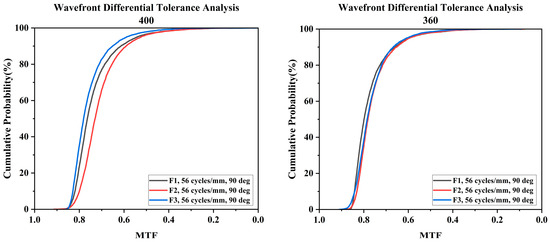
Figure 25.
Tolerance–MTF curves for longwave and shortwave in T3 channel. Note: (a) Tolerance–MTF curve for longwave at 400 nm in T3 channel, Nyquist frequency 56 lp/mm; (b) Tolerance–MTF curve for shortwave at 360 nm in T3 channel, Nyquist frequency 56 lp/mm.
The tolerance analysis results indicate that, assuming all errors in the optical system are within the allowed tolerance ranges, the MTF of the optical system has an 80% probability of reaching 0.7 or higher at various wavelengths and fields of view, meeting the design requirements.
4. Mechanical Structure Design
The overall enveloping design of the ultraviolet multi-channel hyperspectral imaging spectrometer is illustrated in Figure 26. It primarily includes the telescope system, slit, Wynne–Offner spectral imaging system, and focal plane. Through optimized optical and structural layouts, the system is folded into a compact volume. Following a comprehensive optomechanical analysis, an integral framework structure is proposed. The substrate of the mirror should comprise glass–ceramics with good technology and a very small thermal expansion coefficient. Optical components are grouped and mounted on an optical substrate, with the selected substrate material being an aluminum alloy. The main structure of the frame employs aluminum alloy material, and the entire instrument is horizontally installed, with the gravity direction in the X-axis. After multiple rounds of structural optimization and iterative design, the total weight of the instrument is approximately 30 kg.
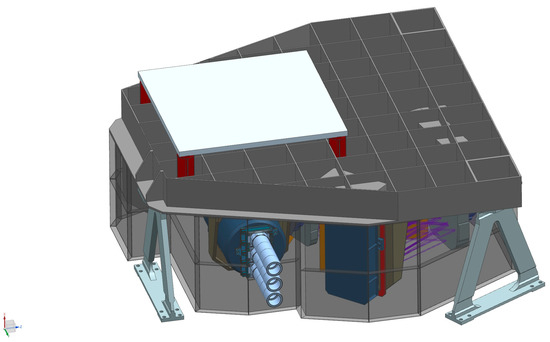
Figure 26.
Enveloping diagram of the overall structure of the ultraviolet multi-channel hyperspectral imaging spectrometer.
5. Discussion
This article proposes a design for a multi-channel hyperspectral imaging spectrometer system based on pupil separation prisms and grating multilevel spectra. The imaging spectrometer system uses pupil separation prisms to divide the entrance pupil of the front telescope system, obtaining multiple sub-pupils. Different sub-pupils can be used for detecting different objects. The pupil separation prisms are coated with bandpass filters that only allow the corresponding spectral bands to pass through, preventing spectral crosstalk between different channels. Light from different channels with the same field of view is imaged to the slit. The presence of the pupil separation prisms ensures that the slit is spatially separated, avoiding spectral overlap. The separated slits correspond to different channels and then enter a multi-channel-coupled spectral imaging system. The working spectral bands of different channels undergo spectral dispersion through different diffraction orders of the same grating, ultimately imaging onto the same detector surface. The overall mechanical structure of the multi-channel hyperspectral imaging spectrometer system was designed to be lightweight. The total weight of the instrument was about 30 kg. The advantages and disadvantages of the multi-channel hyperspectral imaging spectrometer system simulated by using the design method proposed in this article and the existing imaging spectrometer system for atmospheric detection of inner planets are shown in Table 5 below. Through analysis, it is evident that although the designed multi-channel hyperspectral imaging spectrometer system in this article is relatively complex, it possesses significant advantages, such as an ultra-high spectral resolution of 0.15 nm, simultaneous multi-channel detection, and miniaturization. In the future, it can be applied not only to Venus’s atmospheric remote sensing but also to play a role in atmospheric remote sensing on Earth, the sun, and other celestial bodies. Therefore, it holds great importance for further research.
Table 5.
Comparison of advantages and disadvantages of different atmospheric remote sensing instruments.
6. Conclusions
Venus, bearing a striking resemblance to Earth in appearance, mass, and size, has long been considered Earth’s twin. Therefore, the study of the substances within Venus’s atmospheric cloud layers has become a primary objective of Venus exploration. In response to the simultaneous detection requirements of multiple substances in Venus’s atmosphere in the ultraviolet range, this paper presents a multi-channel hyperspectral imaging spectrometer system based on a pupil separation prism and grating multilevel spectra design. While achieving high spectral resolution, the system can simultaneously meet the needs of multiple channels for common detection, providing a tool for the subsequent study of the habitability and development processes of the H2SO4 cloud layer in Venus’s atmosphere. The entire system consists of a telescope system and a spectral imaging system. The collimation system and the imaging system share the same structure, facilitating processing and adjustment, further achieving a compact structure. Through autonomous design and integrated optimization, the results indicate that within the ultraviolet range, the three channels (T1 = 180~220 nm, T2 = 275~305 nm, T3 = 360~400 nm) have a spectral resolution better than 0.15 nm. The system has an F-number of 5, and when the Nyquist frequency is 56 lp/mm, the MTF of all three channels exceeds 0.7, and the RMS radius for all three channels is less than 9 μm. The smile is less than 0.05 μm, and the keystone is less than 0.04 μm, meeting the requirements for imaging quality.
Author Contributions
Conceptualization, X.Z. and B.L.; methodology, X.Z.; software, X.Z.; validation, X.Z., B.L. and G.G.; formal analysis, X.F.; investigation, X.Z.; resources, B.L., X.F. and T.L.; data curation, Y.S.; writing—original draft preparation, X.Z.; writing—review and editing, X.Z. and B.L.; visualization, H.L.; supervision, X.J.; project administration, B.L.; funding acquisition, B.L. All authors have read and agreed to the published version of the manuscript.
Funding
This research was funded by National Key Research and Development Program of China, Earth–Moon Large Dynamic Range High-Precision Imaging Spectrum Technology, grant number 2022YFB3903202; Natural Science Foundation of China, grant number 62205330; Strategic Priority Research Program of the Chinese Academy of Sciences, grant number XDA28050102; and B-type Strategic Priority Program of the Chinese Academy of Sciences, grant number XDB41000000.
Data Availability Statement
No new data were created or analyzed in this study. Data sharing is not applicable to this article.
Conflicts of Interest
The authors declare no conflicts of interest.
References
- Blamont, J.; Sagdeev, R.Z. The VEGA mission. Naturwissenschaften 1984, 71, 295–302. [Google Scholar] [CrossRef]
- Bertaux, J.L.; Nevejans, D. SPICAV on Venus Express: Three spectrometers to study the global structure and composition of the Venus atmosphere. Planet. Space Sci. 2007, 55, 1673–1700. [Google Scholar] [CrossRef]
- Piccialli, A. Cyclostrophic Wind in the Mesosphere of Venus from Venus Express Observations. Ph.D. Thesis, Fakultät für Elektrotechnik, Informationstechnik, Physikder Technischen Universität Carolo-Wilhelmina, Braunschweig, Germany, 2010. [Google Scholar]
- Sánchez-Lavega, A.; Lebonnois, S.; Imamura, T.; Read, P.; Luz, D. The atmospheric dynamics of Venus. Space Sci. Rev. 2017, 212, 1541–1616. [Google Scholar] [CrossRef]
- Barath, F.T.; Barrett, A.H.; Copeland, J.; Jones, D.E.; Lilley, A.E. Mariner II: Preliminary reports on measurements of Venus: Microwave radiometers. Science 1963, 139, 908–909. [Google Scholar] [CrossRef]
- Smith, E.J.; Davis, L., Jr.; Coleman, P.J., Jr.; Sonett, C.P. Mariner II: Preliminary reports on measurements of Venus: Magnetic field. Science 1963, 139, 909–910. [Google Scholar] [CrossRef]
- Reese, D.E.; Swan, P.R. Venera 4 probes atmosphere of Venus. Science 1968, 159, 1228–1230. [Google Scholar] [CrossRef]
- Stewart, R.W. Interpretation of Mariner 5 and Venera 4 data on the upper atmosphere of Venus. J. Atmos. Sci. 1968, 25, 578–579. [Google Scholar] [CrossRef]
- Keldysh, M.V. Venus exploration with the Venera 9 and Venera 10 spacecraft. Icarus 1977, 30, 605–625. [Google Scholar] [CrossRef]
- Grard, R.; Gombosi, T.I.; Sagdeev, R.Z. The Vega missions. ESA Spec. Publ. 1986, 1066, 49–70. [Google Scholar] [CrossRef]
- Lorenz, R.D.; Crisp, D.; Huber, L. Venus atmospheric structure and dynamics from the VEGA lander and balloons: New results and PDS archive. Icarus 2018, 305, 277–283. [Google Scholar] [CrossRef]
- Wilquet, V.; Fedorova, A.; Montmessin, F.; Drummond, R.; Mahieux, A.; Vandaele, A.C.; Villard, E.; Korablev, O.; Bertaux, J.L. Preliminary characterization of the upper haze by SPICAV/SOIR solar occultation in UV to mid-IR onboard Venus Express. J. Geophys. Res. Planets 2009, 114, E9. [Google Scholar] [CrossRef]
- Sánchez, L.; Fedorova, A.; Bertaux, J.L.; Stepanov, A.V.; Kiselev, A.; Kalinnikov, Y.K.; Titov, A.Y.; Montmessin, F.; Dubois, J.P.; Villard, E.; et al. SPICAV IR acousto-optic spectrometer experiment on Venus Express. Planet. Space Sci. 2012, 65, 38–57. [Google Scholar] [CrossRef]
- Nakamura, M.; Imamura, T.; Ishii, N.; Abe, T.; Satoh, T.; Suzuki, M.; Ueno, M.; Yamazaki, A.; Iwagami, N.; Watanabe, S. Overview of Venus orbiter, Akatsuki. Earth Planets Space 2011, 63, 443–457. [Google Scholar] [CrossRef]
- Nakamura, M.; Kawakatsu, Y.; Hirose, C.; Imamura, T.; Ishii, N.; Abe, T.; Yamazaki, A.; Yamada, M.; Ogohara, K.; Uemizu, K.; et al. Return to Venus of the Japanese Venus climate orbiter AKATSUKI. Acta Astronaut. 2014, 93, 384–389. [Google Scholar] [CrossRef]
- Marcq, E.; Jessup, K.L.; Baggio, L.; Encrenaz, T.; Lee, Y.J.; Montmessin, F.; Belyaev, D.; Korablev, O.; Bertaux, J.L. Climatology of SO2 and UV absorber at Venus’ cloud top from SPICAV-UV nadir dataset. Icarus 2020, 335, 113368. [Google Scholar] [CrossRef]
- Barker, E.S. Detection of SO2 in the UV spectrum of Venus. Geophys. Res. Lett. 1979, 6, 117–120. [Google Scholar] [CrossRef]
- Svedhem, H.; Titov, D.V.; McCoy, D.; Lebreton, J.P.; Barabash, S.; Bertaux, J.L.; Drossart, P.; Formisano, V.; Häusler, B.; Korablev, O.; et al. Venus Express—The first European mission to Venus. Planet. Space Sci. 2007, 55, 1636–1652. [Google Scholar] [CrossRef]
- Marcq, E.; Belyaev, D.; Montmessin, F.; Fedorova, A.; Bertaux, J.L.; Vandaele, A.C.; Neefs, E. An investigation of the SO2 content of the venusian mesosphere using SPICAV-UV in nadir mode. Icarus 2011, 211, 58–69. [Google Scholar] [CrossRef]
- Jessup, K.L.; Marcq, E.; Bertaux, J.L.; Mills, F.P.; Limaye, S.; Roman, A. On Venus’ cloud top chemistry, convective activity and topography: A perspective from HST. Icarus 2020, 335, 113372. [Google Scholar] [CrossRef]
- Taylor, F.W. Venus before Venus express. Planet. Space Sci. 2006, 54, 1249–1262. [Google Scholar] [CrossRef]
- Titov, D.V.; Svedhem, H.; McCoy, D.; Lebreton, J.P.; Barabash, S.; Bertaux, J.L.; Drossart, P.; Formisano, V.; Haeusler, B.; Korablev, O.I.; et al. Venus Express: Scientific goals, instrumentation, and scenario of the mission. Cosm. Res. 2006, 44, 334–348. [Google Scholar] [CrossRef]
- Svedhem, H.; Titov, D.V.; Taylor, F.W.; Witasse, O. Venus as a more Earth-like planet. Nature 2007, 450, 629–632. [Google Scholar] [CrossRef] [PubMed]
- Thuillier, G.; Zhu, P.; Snow, M.; Zhang, P.; Ye, X. Characteristics of solar-irradiance spectra from measurements, modeling, and theoretical approach. Light Sci. Appl. 2022, 11, 79. [Google Scholar] [CrossRef] [PubMed]
- Maria, T. Atmospheric trace gas (NO2 and O3) variability in South Korean Coastal Waters, and implications for remote sensing of coastal ocean color dynamics. Remote Sens. 2018, 10, 1587–1606. [Google Scholar] [CrossRef]
- Belyaev, D.; Korablev, O.; Fedorova, A.; Bertaux, J.L.; Vandaele, A.C.; Montmessin, F.; Drummond, R. First observations of SO2 above Venus’ clouds by means of Solar Occultation in the Infrared. J. Geophys. Res. Planets 2008, 113, E5. [Google Scholar] [CrossRef]
- De Clercq, C.; Moreau, V.; Jamoye, J.F.; Marchi, A.Z.; Gloesener, P. ELOIS: An innovative spectrometer design using a free-form grating. In Proceedings of the Optical Systems Design 2015: Optical Design and Engineering VI, Jena, Germany, 7–10 September 2015; SPIE: Bellingham, WA, USA, 2015; Volume 9626, pp. 407–415. [Google Scholar] [CrossRef]
- Bagusat, V.; Kraus, M.; Förster, E.; Thomae, D.; Hönle, T.; Brüning, R.; Hillmer, H.; Brunner, R. Concept and optical design of a compact cross-grating spectrometer. JOSA A 2019, 36, 345–352. [Google Scholar] [CrossRef] [PubMed]
- Zeng, C.; Han, Y.; Liu, B.; Sun, P.; Li, X.; Chen, P. Optical design of a high-resolution spectrometer with a wide field of view. Opt. Lasers Eng. 2021, 140, 106547. [Google Scholar] [CrossRef]
- Titov, D.V.; Svedhem, H.; Koschny, D.; Hoofs, R.; Barabash, S.; Bertaux, J.L.; Drossart, P.; Formisano, V.; Häusler, B.; Korablev, O.; et al. Venus Express science planning. Planet. Space Sci. 2006, 54, 1279–1297. [Google Scholar] [CrossRef]
- Veefkind, J.P.; Aben, I.; McMullan, K.; Förster, H.; De Vries, J.; Otter, G.; Claas, J.; Eskes, H.J.; de Haan, J.F.; Kleipool, Q.; et al. TROPOMI on the ESA Sentinel-5 Precursor: A GMES mission for global observations of the atmospheric composition for climate, air quality and ozone layer applications. Remote Sens. Environ. 2012, 120, 70–83. [Google Scholar] [CrossRef]
- Irizar, J.; Melf, M.; Bartsch, P.; Koehler, J.; Weiss, S.; Greinacher, R.; Erdmann, M.; Kirschner, V.; Perez Albinana, A.; Martin, D. Sentinel-5/UVNS. In Proceedings of the International Conference on Space Optics—ICSO 2018, Chania, Greece, 9–12 October 2018; SPIE: Bellingham, WA, USA, 2019; Volume 11180, pp. 41–58. [Google Scholar] [CrossRef]
- Jakosky, B.M.; Lin, R.P.; Grebowsky, J.M.; Luhmann, J.G.; Mitchell, D.F.; Beutelschies, G.; Priser, T.; Acuna, M.; Andersson, L.; Baird, D.; et al. The Mars atmosphere and volatile evolution (MAVEN) mission. Space Sci. Rev. 2015, 195, 3–48. [Google Scholar] [CrossRef]
- McClintock, W.E.; Schneider, N.M.; Holsclaw, G.M.; Clarke, J.T.; Hoskins, A.C.; Stewart, I.; Montmessin, F.; Yelle, R.V.; Deighan, J. The imaging ultraviolet spectrograph (IUVS) for the MAVEN mission. Space Sci. Rev. 2015, 195, 75–124. [Google Scholar] [CrossRef]
- Jones, A.R.; Wolff, M.; Alshamsi, M.; Osterloo, M.; Bay, P.; Brennan, N.; Bryant, K.; Castleman, Z.; Curtin, A.; DeVito, E.; et al. The Emirates Exploration Imager (EXI) instrument on the Emirates Mars mission (EMM) hope mission. Space Sci. Rev. 2021, 217, 81. [Google Scholar] [CrossRef]
- Holsclaw, G.M.; Deighan, J.; Almatroushi, H.; Chaffin, M.; Correira, J.; Evans, J.S.; Fillingim, M.; Hoskins, A.; Jain, S.K.; Lillis, R.; et al. The emirates Mars ultraviolet spectrometer (EMUS) for the EMM mission. Space Sci. Rev. 2021, 217, 79. [Google Scholar] [CrossRef]
- Zhang, X.; Wang, F.; Wang, W.; Huang, F.; Chen, B.; Gao, L.; Wang, S.; Yan, H.H.; Ye, H.H.; Si, F.Q.; et al. The development and application of satellite remote sensing for atmospheric compositions in China. Atmos. Res. 2020, 245, 105056. [Google Scholar] [CrossRef]
- Xia, C.; Liu, C.; Cai, Z.; Zhao, F.; Su, W.; Zhang, C.; Liu, Y. First sulfur dioxide observations from the environmental trace gases monitoring instrument (EMI) onboard the GeoFen-5 satellite. Sci. Bull. 2021, 66, 969–973. [Google Scholar] [CrossRef] [PubMed]
- Yan, W.; Ren, X.; Liu, J.; Zhang, L.; Chen, W.; Wang, D.; Fu, Q.; Tan, X.; Zhang, X.X.; Ai, H.B.; et al. Topographic Reconstruction of the “Tianwen-1” Landing Area on the Mars Using High Resolution Imaging Camera Images. IEEE Trans. Geosci. Remote Sens. 2022, 60, 4512414. [Google Scholar] [CrossRef]
- Zou, Y.L.; Zhu, Y.; Bai, Y.F.; Wang, L.G.; Jia, Y.Z.; Shen, W.H.; Fan, Y.; Liu, Y.; Wang, C.; Zhang, A.B.; et al. Scientific objectives and payloads of Tianwen-1, China’s first Mars exploration mission. Adv. Space Res. 2021, 67, 812–823. [Google Scholar] [CrossRef]
- Zhu, J.; Zhao, Z.; Liu, Q.; Chen, X.; Li, H.; Tang, S.; Shen, W. Geostationary Full-Spectrum Wide-Swath High-Fidelity Imaging Spectrometer: Optical Design and Prototype Development. Remote Sens. 2023, 15, 396. [Google Scholar] [CrossRef]
- Prieto-Blanco, X.; de la Fuente, R. Compact Offner–Wynne imaging spectrometers. Opt. Commun. 2014, 328, 143–150. [Google Scholar] [CrossRef]
- Tan, F.; Zeng, C.; Ji, Y. Optical design of a novel Wynne-Offner snapshot hyperspectral imaging system. In Proceedings of the Optical Design and Testing XI, Nantong, China, 10–12 October 2021; SPIE: Bellingham, WA, USA, 2021; Volume 11895, pp. 67–74. [Google Scholar] [CrossRef]
- Zhang, J.; Zheng, Y.; Lin, C.; Ji, Z.; Wu, H. Analysis method of the Offner hyperspectral imaging spectrometer based on vector aberration theory. Appl. Opt. 2021, 60, 264–275. [Google Scholar] [CrossRef]
- Ceamanos, X.; Douté, S. Spectral smile correction of CRISM/MRO hyperspectral images. IEEE Trans. Geosci. Remote Sens. 2010, 48, 3951–3959. [Google Scholar] [CrossRef]
- Gao, J.; Jiao, C.; Xiang, G.X.; Lu, Z.; Niu, Y.T. Optical system design of imaging spectrometer with large aperture and high resolution. In Proceedings of the Ninth Symposium on Novel Photoelectronic Detection Technology and Applications, Hefei, China, 21–23 April 2023; SPIE: Bellingham, WA, USA, 2023; Volume 12617, pp. 1068–1073. [Google Scholar] [CrossRef]
- Shen, Z.; Ameta, G.; Shah, J.J.; Davidson, J.K. A comparative study of tolerance analysis methods. J. Comput. Inf. Sci. Eng. 2005, 5, 247–256. [Google Scholar] [CrossRef]
- Saetiew, J.; Sanjae, J.; Meemon, P. Real-time assessment of spectrometer alignment using modulation transfer function (MTF) measurement. Opt. Lasers Eng. 2024, 175, 108021. [Google Scholar] [CrossRef]
- Yamamoto, S.; Tsuchida, S.; Urai, M.; Mizuochi, H.; Iwao, K.; Iwasaki, A. Initial Analysis of Spectral Smile Calibration of Hyperspectral Imager Suite (HISUI) Using Atmospheric Absorption Bands. IEEE Trans. Geosci. Remote Sens. 2022, 60, 5534215. [Google Scholar] [CrossRef]
- Qian, L.L.; Lü, Q.B.; Huang, M.; Cai, Q.S.; Li, B.X. Effect of keystone on coded aperture spectral imaging. Optik 2016, 127, 686–689. [Google Scholar] [CrossRef]
- Liu, X.; Zhou, J.; Wei, L.; Feng, L.; Jing, J.J.; He, X.; Yang, L.; Li, Y. Optical design of Schwarzschild imaging spectrometer with freeform surfaces. Opt. Commun. 2021, 480, 126495. [Google Scholar] [CrossRef]
Disclaimer/Publisher’s Note: The statements, opinions and data contained in all publications are solely those of the individual author(s) and contributor(s) and not of MDPI and/or the editor(s). MDPI and/or the editor(s) disclaim responsibility for any injury to people or property resulting from any ideas, methods, instructions or products referred to in the content. |
© 2024 by the authors. Licensee MDPI, Basel, Switzerland. This article is an open access article distributed under the terms and conditions of the Creative Commons Attribution (CC BY) license (https://creativecommons.org/licenses/by/4.0/).