Article

Multidimensional Evaluation Methods for Deep Learning Models in Target Detection for SAR Images

1
Faculty of Computing, Harbin Institute of Technology, Harbin 150001, China
2
Beijing Institute of Control and Electronics Technology, Beijing 100038, China
*
Author to whom correspondence should be addressed.
Remote Sens. 2024, 16(6), 1097; https://doi.org/10.3390/rs16061097
Submission received: 23 January 2024 / Revised: 8 March 2024 / Accepted: 16 March 2024 / Published: 20 March 2024

Abstract

:
As artificial intelligence technology advances, the application of object detection technology in the field of SAR (synthetic aperture radar) imagery is becoming increasingly widespread. However, it also faces challenges such as resource limitations in spaceborne environments and significant uncertainty in the intensity of interference in application scenarios. These factors make the performance evaluation of object detection key to ensuring the smooth execution of tasks. In the face of such complex and harsh application scenarios, methods that rely on single-dimensional evaluation to assess models have had their limitations highlighted. Therefore, this paper proposes a multi-dimensional evaluation method for deep learning models used in SAR image object detection. This method evaluates models in a multi-dimensional manner, covering the training, testing, and application stages of the model, and constructs a multi-dimensional evaluation index system. The training stage includes assessing training efficiency and the impact of training samples; the testing stage includes model performance evaluation, application-based evaluation, and task-based evaluation; and the application stage includes model operation evaluation and model deployment evaluation. The evaluations of these three stages constitute the key links in the performance evaluation of deep learning models. Furthermore, this paper proposes a multi-indicator comprehensive evaluation method based on entropy weight correlation scaling, which calculates the weights of each evaluation indicator through test data, thereby providing a balanced and comprehensive evaluation mechanism for model performance. In the experiments, we designed specific interferences for SAR images in the testing stage and tested three models from the YOLO series. Finally, we constructed a multi-dimensional performance profile diagram for deep learning object detection models, providing a new visualization method to comprehensively characterize model performance in complex application scenarios. This can provide more accurate and comprehensive model performance evaluation for remote sensing data processing, thereby guiding model selection and optimization. The evaluation method proposed in this study adopts a multi-dimensional perspective, comprehensively assessing the three core stages of a model’s lifecycle: training, testing, and application. This framework demonstrates significant versatility and adaptability, enabling it to transcend the boundaries of remote sensing technology and provide support for a wide range of model evaluation and optimization tasks.

1. Introduction

Target detection technology has now become a key research direction in the analysis of synthetic aperture radar (SAR) images [1]. SAR images, with their unique ability to provide high-quality data under all-weather conditions, as well as various lighting and weather conditions, play a vital role in multiple fields, such as environmental monitoring [2], urban planning [3], and military reconnaissance [4]. However, researchers also face multiple challenges, including resource constraints [5], complex application scenarios [6], the diversity of interference [7], and real-time requirements [8].
To meet the complex needs of specific application scenarios, precise evaluation of model performance has become a key factor in improving task success rates [9]. This evaluation involves quantifying a model’s performance in various scenarios, its ability to handle interference, its resource use efficiency, and the extent to which it meets real-time needs. Through this process, the suitability and efficiency of a model under specific conditions can be judged, thereby guiding targeted improvements. This not only helps to improve model performance but also promotes the development of SAR image target detection technology to meet the growing application demands.
However, despite research progress in the performance evaluation of SAR image target detection models, there is still much unexplored space in this field. Xiao et al. [10] compared a model’s parameter quantity, AP value, accuracy, and recall rate when evaluating algorithm performance, validating the proposed algorithm’s advantages of high precision and light weight. Liu et al. [11] performed performance evaluation and quantitative assessment on the camouflage effect of SAR images, conducting comparative experiments using detection accuracy, recall rate, and detection precision as evaluation standards and assessing the performance and camouflage effect of detection models. Wei et al. [12] proposed an SAR image small-target detection model and evaluated its performance, including the model’s accuracy, the number of targets detected, the number of targets not detected, single-image detection time, and generalization ability. Yasir et al. [13] proposed a multi-scale SAR image target detection model and evaluated its performance, including precision, accuracy, recall rate, F1 value, and FPS, and experimentally verified that the model improved the distinguishability and anti-interference ability of weak and small-scale target detection in SAR images. Ihmeida et al. [14] mainly studied how to improve SAR image despeckling processing through deep learning technology in order to enhance the performance of change detection (CD), using evaluation metrics including overall accuracy (OA) and F1 score, demonstrating the effectiveness of the despeckling model in enhancing change detection performance.
Bouraya et al. [15] conducted comparative experiments on the performance evaluation of various target detection algorithms for the COCO dataset, including AP, AP50, AP75, APS, APM, and APL, and designed a weighted scoring model (WSM) to evaluate these target detection algorithms. Bulut et al. [16] evaluated lightweight target detection models, mainly for low latency requirements and resource-limited scenarios. The models evaluated include YOLOv5-Nano, YOLOX-Nano, YOLOX-Tiny, YOLOv6-Nano, YOLOv6-Tiny, and YOLOv7-Tiny, with evaluation metrics including memory usage, model parameter size, inference time, energy consumption, AP, etc. Stankovic et al. [17] studied the performance evaluation of YOLO models used for the automatic detection of crops and weeds based on detection accuracy for evaluation. The results showed good training performance, reaching about 70% average precision in 100 training sessions. Among them, YOLOv5x performed the best among the studied models, with evaluation metrics including precision, recall rate, mAP0.5, mAP, the number of parameters, etc. Wang et al. [18] evaluated and compared the performance of eight mainstream detection models in bird target detection tasks, using evaluation metrics including mAP, mAP50, mAP75, and FPS, finding that, compared to single-stage target detection models, two-stage target detection models have stronger robustness to changes in bird image foreground scaling and background interference. Heda et al. [19] conducted human detection experiments, verifying the performance of different models in the YOLO family, showing that yolov5 performed best in terms of mAP accuracy, while YOLOv3 was the fastest but slightly less accurate, with evaluation metrics including precision, recall rate, mAP, and detection time.
Gallo et al. [20] built a dataset of weeds and tested YOLOv7, assessing the model’s performance, including with respect to mAP50, recall rate, and accuracy; the experiment showed the potential of the YOLOv7 model in weed detection. Bergstrom et al. [21] considered three main image quality factors—resolution, blur, and noise—and their relationship with the performance of deep learning-based target detection models, studying the impact of these image quality variables on the average precision (mAP) of target detection models, and they evaluated the performance of models trained only on high-quality images, as well as those fine-tuned on low-quality images. Additionally, the authors mapped the main image quality variables to terms used in the General Image-Quality Equation (GIQE)—namely, ground sample distance (GSD), relative edge response (RER), and signal-to-noise ratio (SNR)—and assessed the applicability of the GIQE function form to modeling target detector performance in the presence of significant image distortion. Gordienko et al. [22] studied the performance of target detection on multimodal satellite images using the Vehicle Detection in Aerial Imagery (VEDAI) dataset, adopting the YOLO (You Only Look Once) framework, covering RGB, IR, and RGB + IR modalities, as well as different image sizes ranging from 128 × 128 to 1024 × 1024. The evaluation method included 10-fold cross-validation to ensure the model’s generalization ability, mainly relying on the average precision (mAP) metric, especially [email protected] at an IoU (intersection over union) threshold of 0.5, as well as the mAP range from 0.5 to 0.95; this shows that through this hybrid approach, mAP can be significantly improved at specific image sizes, providing valuable data-driven insights into how to optimize target detection systems. Tarekegn et al. [23] explored the application of deep learning in automatic image preprocessing and target detection, evaluating and comparing three state-of-the-art YOLO models, including YOLOv8, YOLOv7, and YOLOv5. A large number of experiments were conducted using publicly available underwater image datasets, with evaluation metrics including precision, recall rate, mAP50, mAP, FPS, model size, etc. Huo et al. [24] addressed the weakly supervised target detection (WSOD) problem in remote sensing images, proposing a complementary detection network (CDN) and instance difficulty scoring (IDS) method. To evaluate model performance, researchers conducted experiments on the NWPU VHR-10.v2 and DIOR datasets, mainly using mean average precision (mAP) and correct localization (CorLoc) as evaluation metrics. Additionally, compared to existing fully supervised and weakly supervised target detection methods, the proposed method achieved significant improvements in mAP and CorLoc. Despite high computational complexity during training, the inference time was comparable to that yield by comparative methods, indicating good performance and feasibility in practical applications.
Pu et al. [25] proposed an image-to-image translation-based cross-domain learning method for target detection tasks in synthetic aperture radar (SAR) images. To evaluate model performance, the researchers used a variety of standard evaluation metrics, including inception score (IS), Fréchet inception distance (FID), recall, precision, and mean average precision (mAP). The experimental results showed that, compared to traditional data augmentation methods, the proposed method achieved significant improvements in detection accuracy and reduced missed detection rates. Huang et al. [26] proposed a CCDS–YOLO multi-category synthetic aperture radar (SAR) image target detection model. To evaluate model performance, the researchers conducted experiments on the filtered MSAR dataset, using comprehensive evaluation metrics including precision, recall, average precision (AP), mean average precision (mAP), etc. Hindarto et al. [27] conducted a comprehensive evaluation of the performance of two popular deep learning algorithms, ConvDeconvNet and UNET, in underwater fish target detection. The researchers used datasets containing various fish species, considering factors such as detection accuracy, processing speed, and model complexity. The results showed that ConvDeconvNet performed superiorly in terms of detection accuracy, while UNET had a significant advantage in processing speed, making it a viable option for applications requiring real-time performance. The cited study also explored the trade-off between accuracy and speed and emphasized the importance of using diverse datasets for training and testing models, as this significantly affects the overall performance of a model. Hernandez et al. [28] worked on model performance evaluation involving comparing the performance of five different deep learning target detection models in identifying shrapnel in ultrasound images. The evaluation metrics included mean average precision (mAP), intersection over union (IoU), and inference time. These researchers used a dataset containing over 16,000 ultrasound images for training and testing to determine which model maintained high accuracy while having the fastest inference speed. The results showed that the YOLOv7 tiny model performed best in terms of mAP and inference time and was, therefore, chosen as the most suitable model for this application. Tekin et al. [29] studied the performance of small-target detection in regard to aerial images, especially under conditions of degraded image quality (such as noise, motion blur, and raindrops). These researchers used the YOLO series (YOLOv6, YOLOv7, and YOLOv8) target detection models and evaluated their performance on original, degraded, and MPRNet image-enhanced images. The evaluation metrics used included precision, recall, F1 score, and mean average precision (mAP). The experimental results showed that image enhancement significantly improved the quality of target detection for degraded images, especially for small targets. The YOLOv8 model performed best under these conditions.
Ma et al. [30] provided a fair and comprehensive comparison platform for the field of image-based 3D target detection. These researchers built a modularly designed code library, devised robust training schemes, designed an error diagnostics toolbox, and discussed current methods. They conducted an in-depth analysis of the performance of current methods in different settings through these tools and discussed some open questions, such as the differences in conclusions on the KITTI-3D and nuScenes datasets. The evaluation metrics used included mean average precision (mAP), average precision (AP), and 3D IoU, based on different IoU thresholds. Additionally, they proposed the TIDE3D toolbox for the quantitative analysis of detailed features of detection models, including classification errors, localization errors, duplicate errors, background errors, missing errors, ranking errors, etc. Mora et al. [31] evaluated several techniques for accurately extracting 3D object models, combining image-based deep learning target detection and point cloud segmentation. These researchers compared various existing techniques, including bounding box target detection, instance segmentation, and methods for estimating object masks within bounding boxes. They conducted qualitative and quantitative analyses of these techniques using multiple standards, including execution time, intersection over union (IoU), chamfer distance (CD), and the distance between point cloud centers. Liu et al. [32] proposed a lightweight deep learning model named empty road detection (ERD), and in its evaluation, the researchers found that ERD could improve the frame processing rate of EfficientDet, SSD, and YOLOv5 by approximately 44%, 40%, and 10%, respectively. The evaluation metrics used included the model’s accuracy, recall rate, precision, F1 score, and latency with respect to the GPU and CPU. Additionally, the impact of ERD on the frame rate in videos with different proportions of empty frames was also analyzed. Alin et al. [33] evaluated the effects of different data augmentation methods when using the YOLOv5 algorithm in drone target detection. These researchers applied 14 types of data augmentation techniques, including flipping, rotation, cropping, rotation, shearing, hue, blur, grayscale, saturation, brightness, exposure, noise, cropping, and mosaic. After measuring the precision–recall evaluation metrics for each type of data augmentation, the results showed that the mosaic augmentation type provided the highest precision–recall value of 0.993 in drone target detection, performing better than other augmentation types. This study indicates that appropriately selecting data augmentation techniques can significantly enhance target detection performance when using the YOLOv5 algorithm in drone target detection. Wang et al. [34] evaluated the effectiveness of their proposed cross-modal knowledge distillation method (CoLD) in synthetic aperture radar (SAR) image target detection tasks. Specifically, the AP metric was used to assess the model’s overall performance at different IoU thresholds, while AP50 was employed to evaluate the model’s performance at IoU = 0.50; these two metrics collectively reflected the model’s accuracy and generalization ability. Topuz et al. [35] evaluated the effectiveness of YOLO models (YOLOv3, YOLOv5, YOLOv7, and YOLOv8) in detecting mitotic cells in various types of cancer. The evaluation metrics used included intersection over union (IoU), F score (combining precision and recall), and mean average precision (mAP), focusing on their ability to accurately identify mitotic cells in histopathological images. YOLOv8 stood out as the most successful model, showcasing high recall values and robust performance across different cancer types, highlighting its potential in real-time clinical applications. Zihan et al. [36] conducted a meta-analysis to comprehensively evaluate the performance of deep learning in vision-based road damage detection, particularly emphasizing the uncertainty calculation of F1 scores in evaluating deep learning model performance. The cited study used the Delta method to estimate the standard error of the reported F1 scores, thereby calculating the within-study variance, using random effects meta-analysis methods to synthesize the results of multiple studies, providing a comprehensive evaluation of the performance of deep learning models in road damage detection applications. Haimer et al. [37] compared two state-of-the-art target detection models—YOLOv7 and YOLOv8—in terms of detecting potholes in road images. To evaluate these models’ performance, the researchers used multiple target detection metrics, including precision, recall, mean average precision (mAP), F1 score, accuracy, inference time, and confusion matrices. These metrics helped the researchers measure the models’ ability to correctly identify and locate targets (potholes) in images, as well as the models’ performance at different classification thresholds. Through these evaluations, the researchers were able to determine which model offered the best balance between speed and accuracy. Bakir et al. [38] evaluated the robustness of YOLO object detection algorithms in detecting objects in noisy environments. These researchers created four case studies by injecting different proportions of Gaussian noise into the original image dataset to evaluate the YOLOv5 algorithm’s ability to detect objects in noisy images. The evaluation metrics used included the confusion matrix, recall, precision, F1 score, and mean average precision (mAP). The experimental results showed that as the proportion of injected noise increased, the performance of the YOLO algorithm gradually declined, especially when the noise ratio reached 100%, at which point performance significantly decreased, most objects could not be detected, and the detected object labels were also wrong. Mohd et al. [39] evaluated and compared the performance of YOLOv5, YOLOv6, and YOLOv7 models in road defect detection and classification. The evaluation metrics used included the model’s training time, [email protected] (mean average precision), accuracy, and inference speed. The experimental results showed that the YOLOv7 model performed best in terms of [email protected] score, reaching 79.0%, and had the fastest inference speed, processing 255 test images in 0.47 min. Additionally, the cited paper explored the impact of different data augmentation techniques and evaluated the potential of inference and fine-tuning to enhance accuracy. Tummuri et al. [40] evaluated the performance of YOLOv5 (You Look Only Once version 5) in electronic device classification. The evaluation metrics included precision, recall rate, F1 score, and mean average precision (mAP). The research results showed that YOLOv5 excelled in recognition accuracy, with a precision of 95.55%, a recall rate of 95.84%, an F1 score of 96.54%, and an mAP of 94.63%. Additionally, YOLOv5 performed excellently in real-time processing, being capable of processing images at a rate of 45 frames per second, and its mAP in real-time systems was more than twice that of other systems.
In summary, the current stage of target detection model performance evaluation has two main shortcomings: the limitations of single-dimensional evaluation and the lack of a comprehensive evaluation mechanism.
(1)
The limitations of single-dimensional evaluation
In the existing literature, the performance evaluation of target detection models is often limited to the testing phase, neglecting the model’s training and actual application process. This single-dimensional evaluation method fails to fully capture a model’s performance in actual deployment. Especially for SAR image processing, models face different challenges and performance requirements at the training, testing, and application stages. For example, a model may exhibit excellent accuracy during the testing phase but require significant computational resources during training or fail to effectively adapt to new data types and complex scenes when processing actual SAR images. Without single-stage evaluation, we cannot deeply understand the comprehensive performance and applicability of models when dealing with SAR image data.
(2)
The lack of a comprehensive evaluation mechanism
Current evaluation methods often list multiple detection results simply, without providing a comprehensive evaluation of a model’s overall performance or an in-depth analysis of its applicability. The limitation of these methods is that although a model’s performance can be observed from multiple dimensions, there is a lack of a comprehensive performance evaluation system, making it difficult to guide model optimization and practical application decisions. In the field of SAR image applications, whether a model can adapt to different environmental conditions, its robustness in handling high data diversity, and its performance in terms of resource consumption and execution efficiency are key indicators for assessing whether it meets practical application needs. Without a comprehensive evaluation mechanism, it is difficult to fully evaluate the true value and potential application range of models in processing SAR images.
Therefore, to address the limitations of single-dimensional evaluation and the lack of a comprehensive evaluation mechanism in the field of target detection, this paper proposes a multi-dimensional evaluation method for deep learning models used in SAR image target detection. The contributions of this paper are as follows:
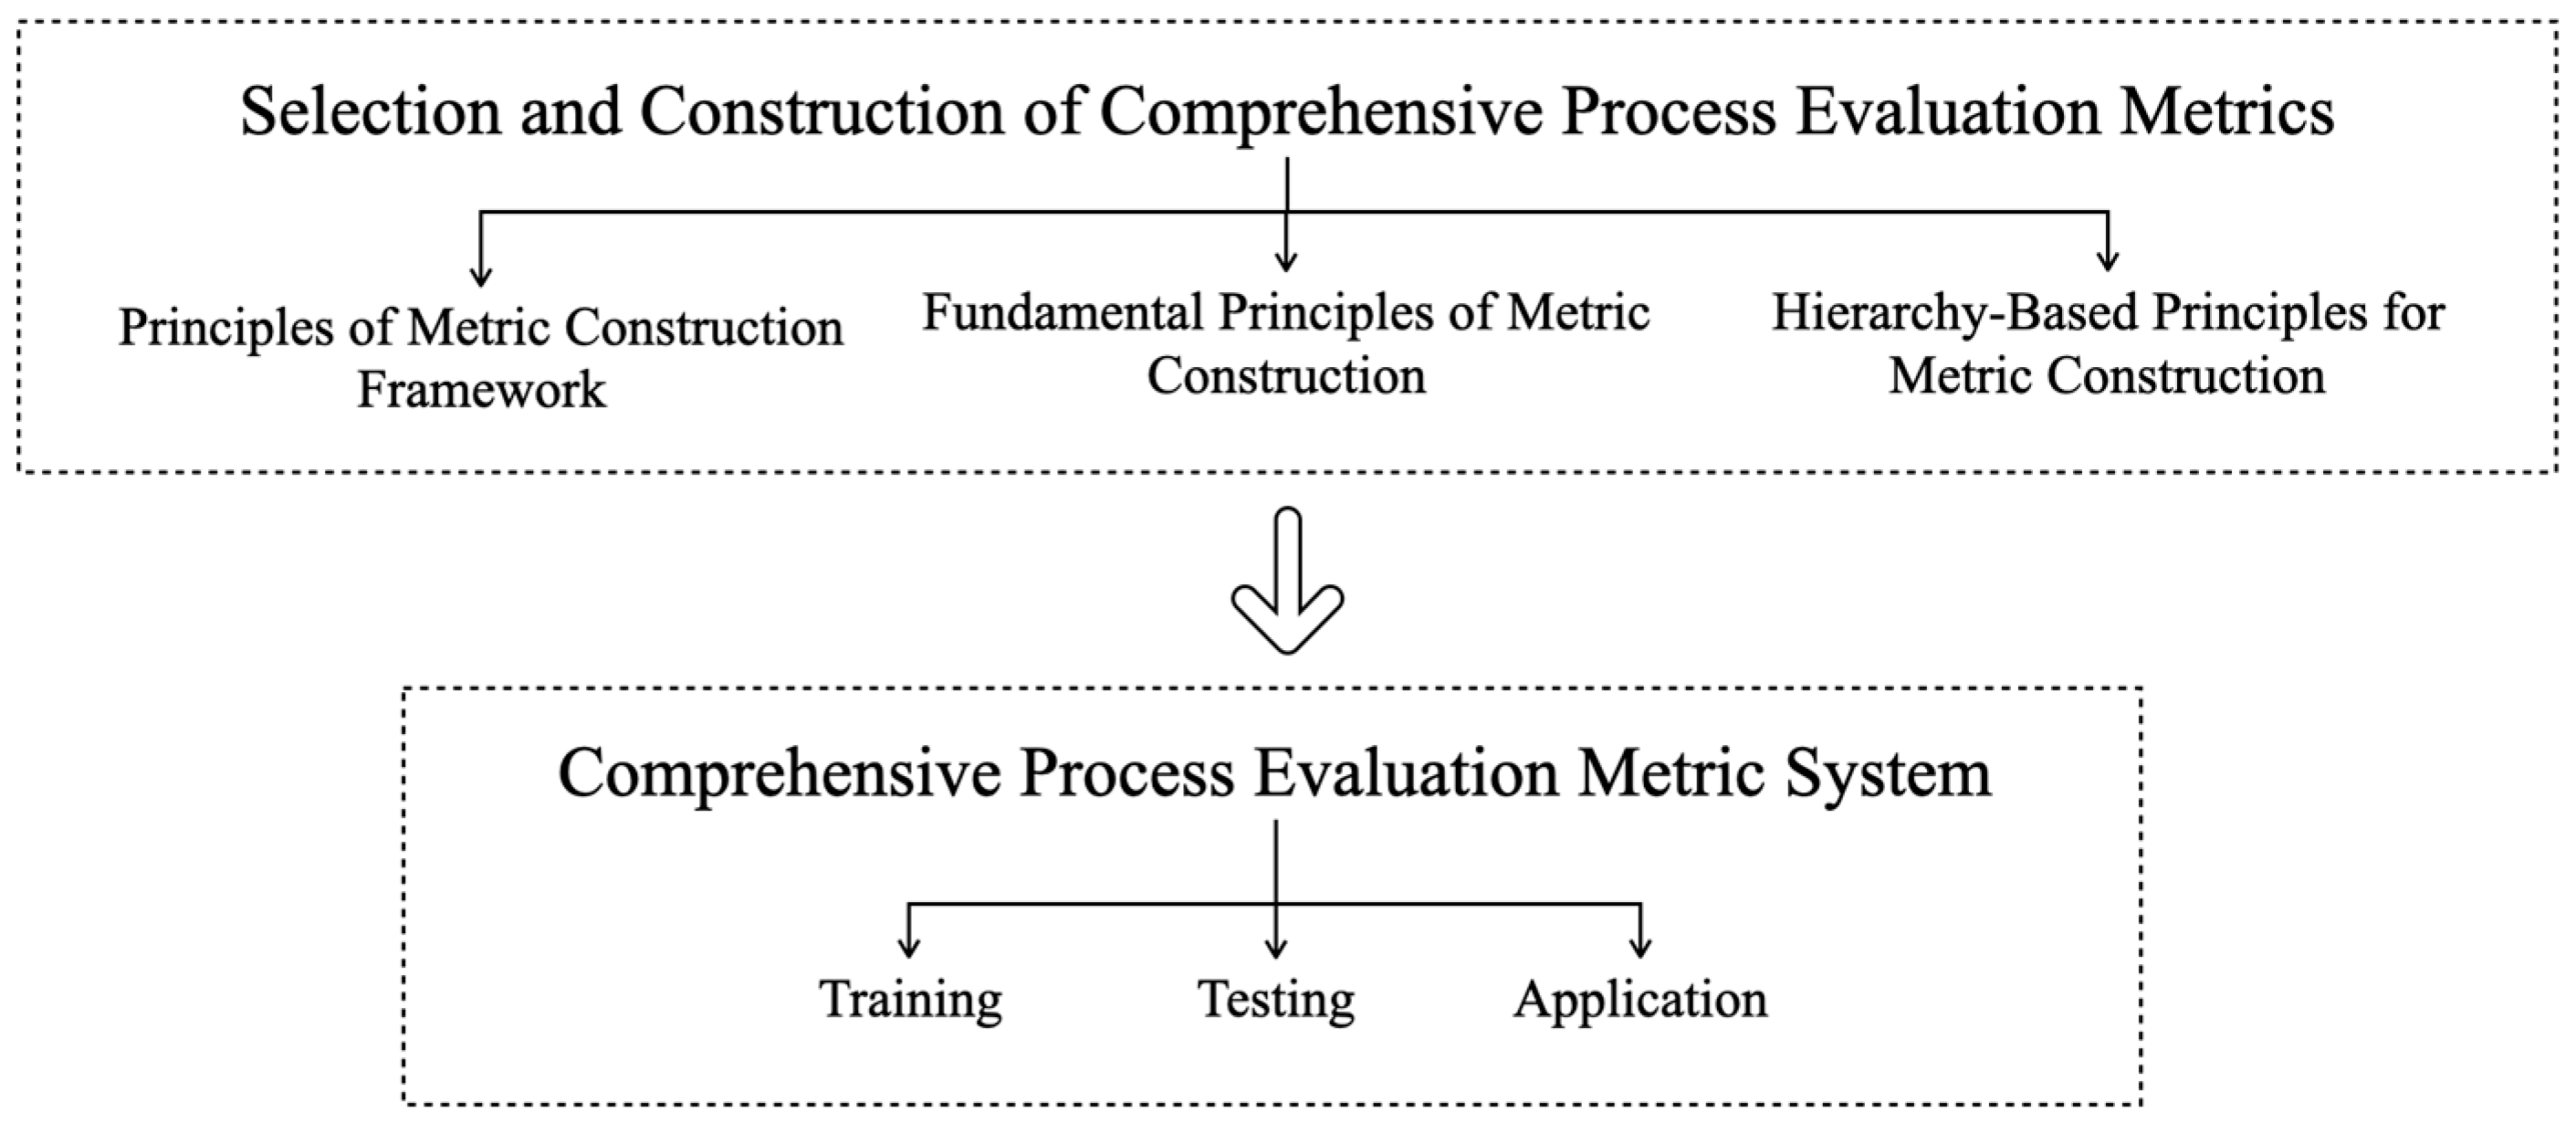
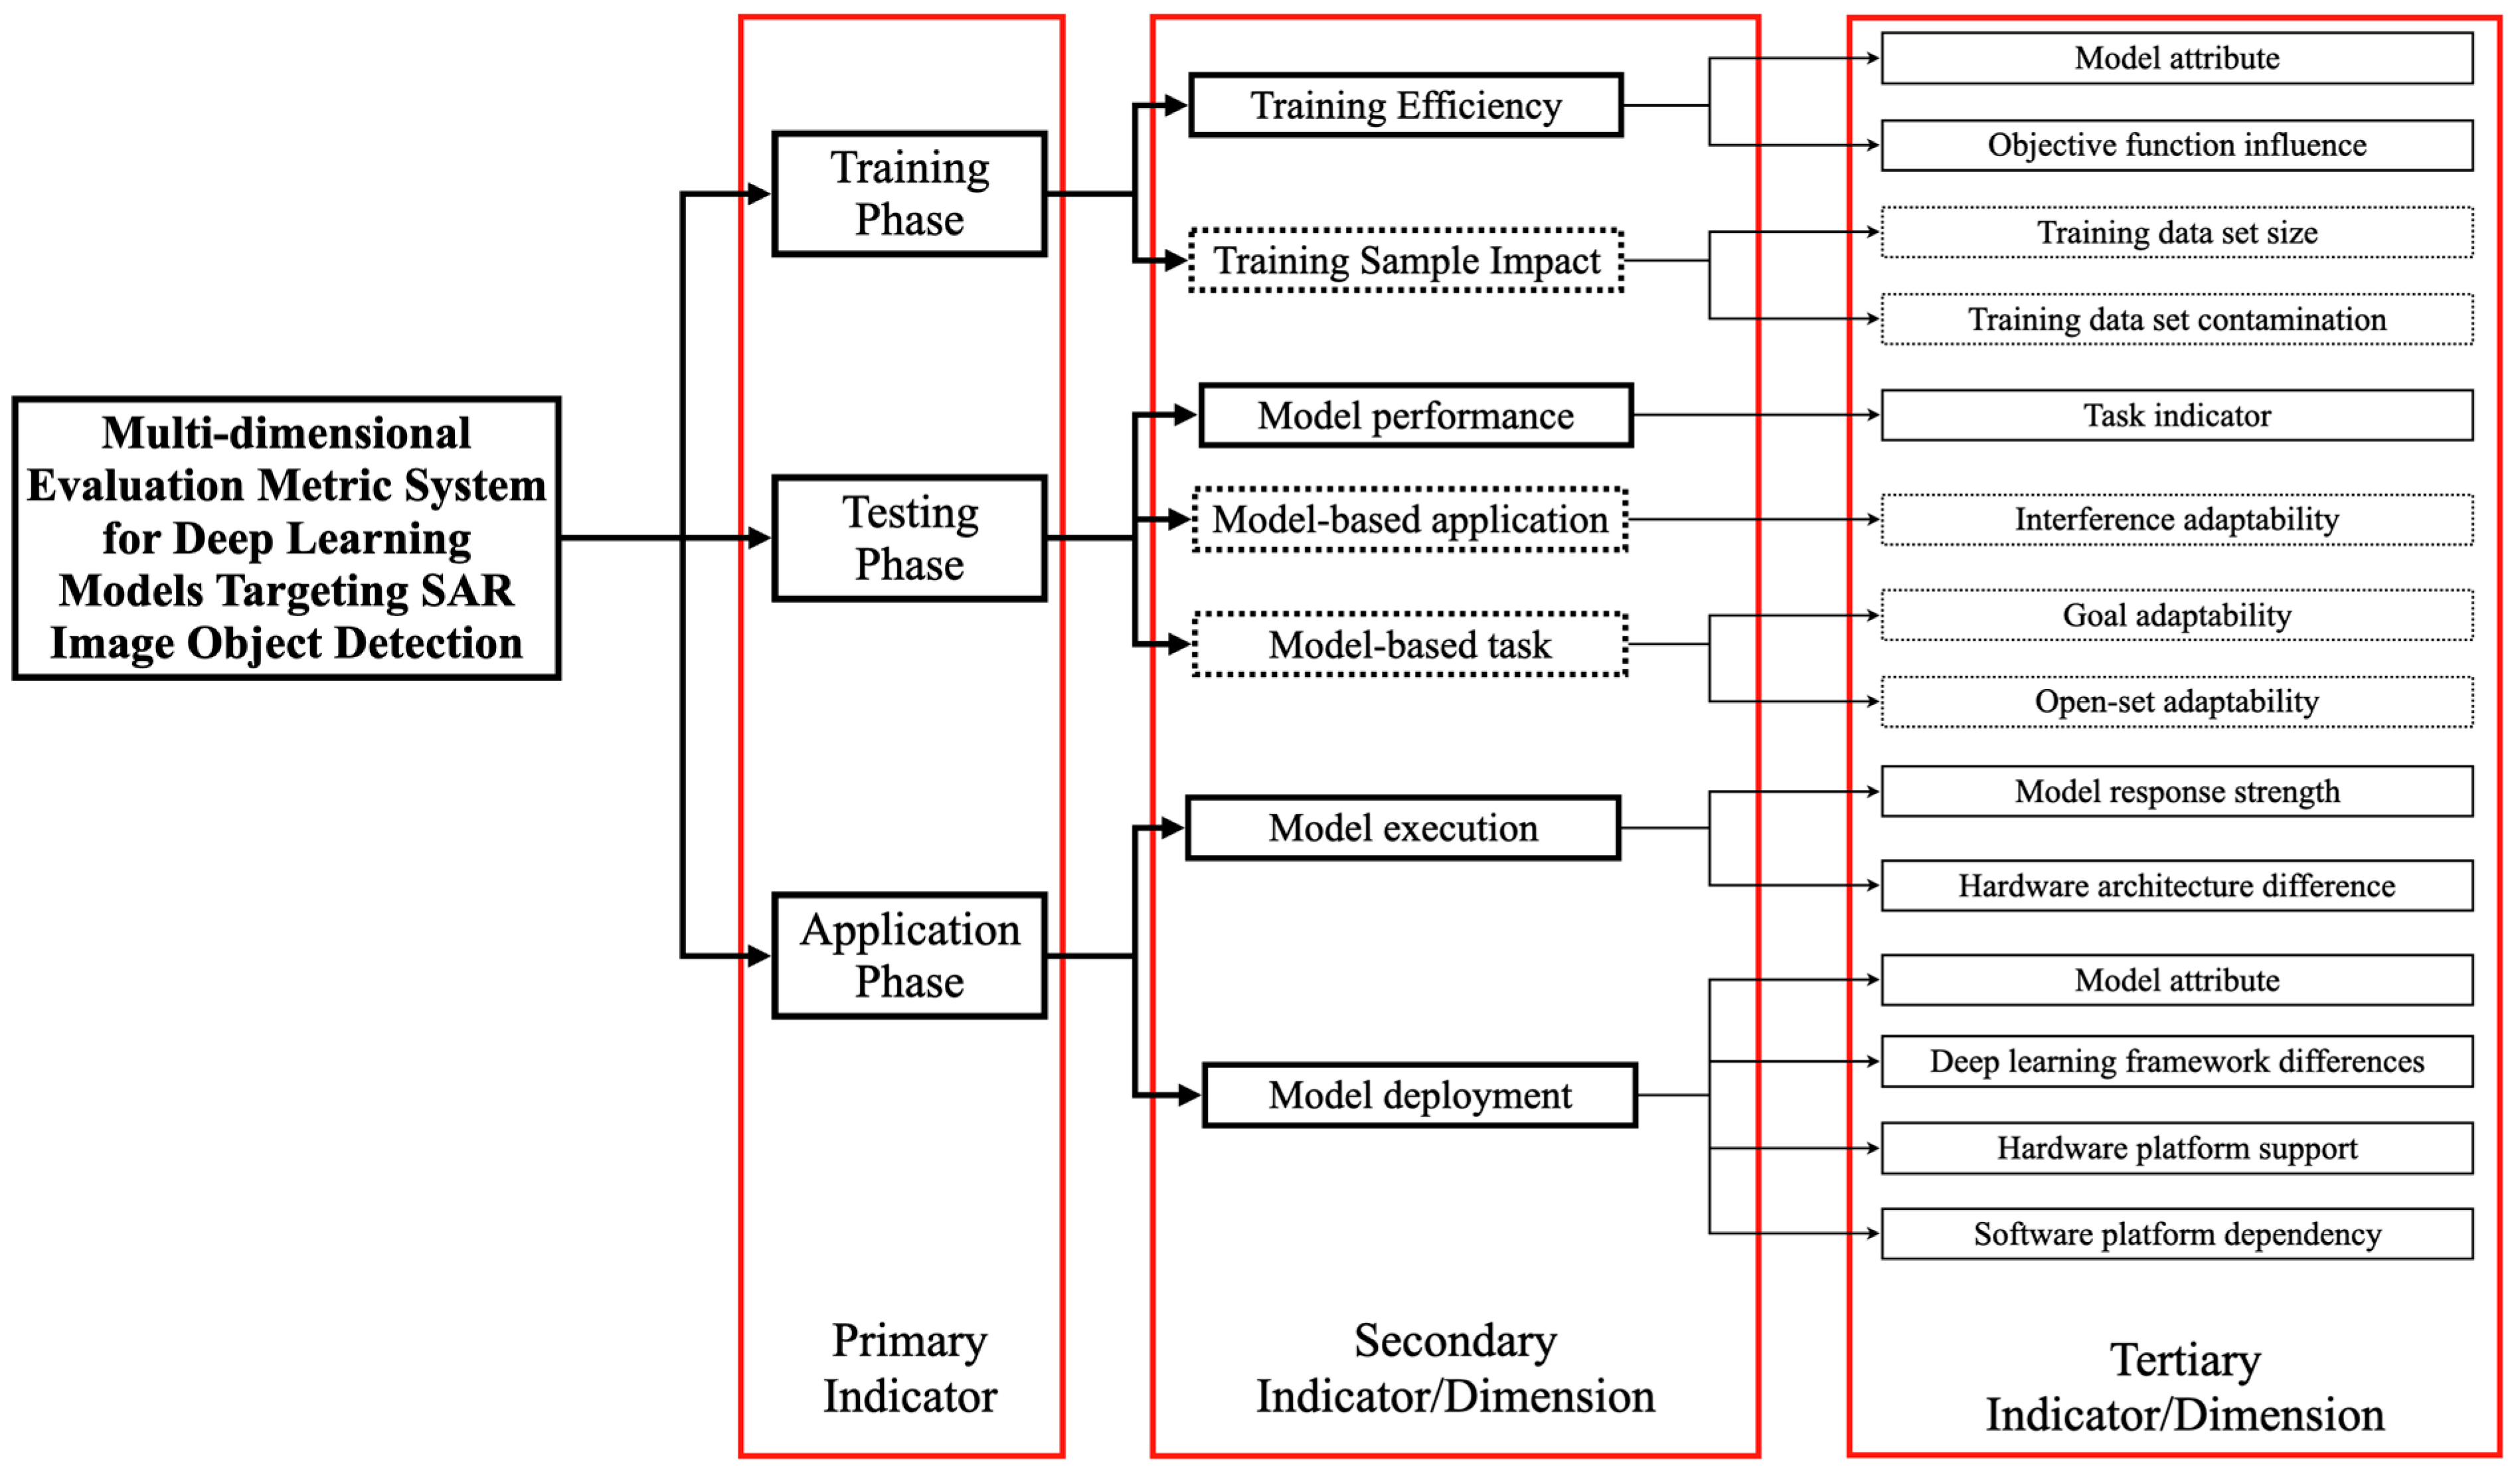
  • Proposing a multi-dimensional evaluation metric system for deep learning models in SAR image target detection, covering the training stage, testing stage, and application stage. The training stage includes training efficiency and training sample impact; the testing stage includes model performance, evaluation based on model application, and evaluation based on model tasks; and the application stage includes evaluation for model operation and model deployment.
  • Proposing a multi-indicator comprehensive evaluation method based on entropy weight correlation scaling, aimed at comprehensively evaluating multi-dimensional indicators, providing a mechanism for balanced and comprehensive evaluation of model performance.
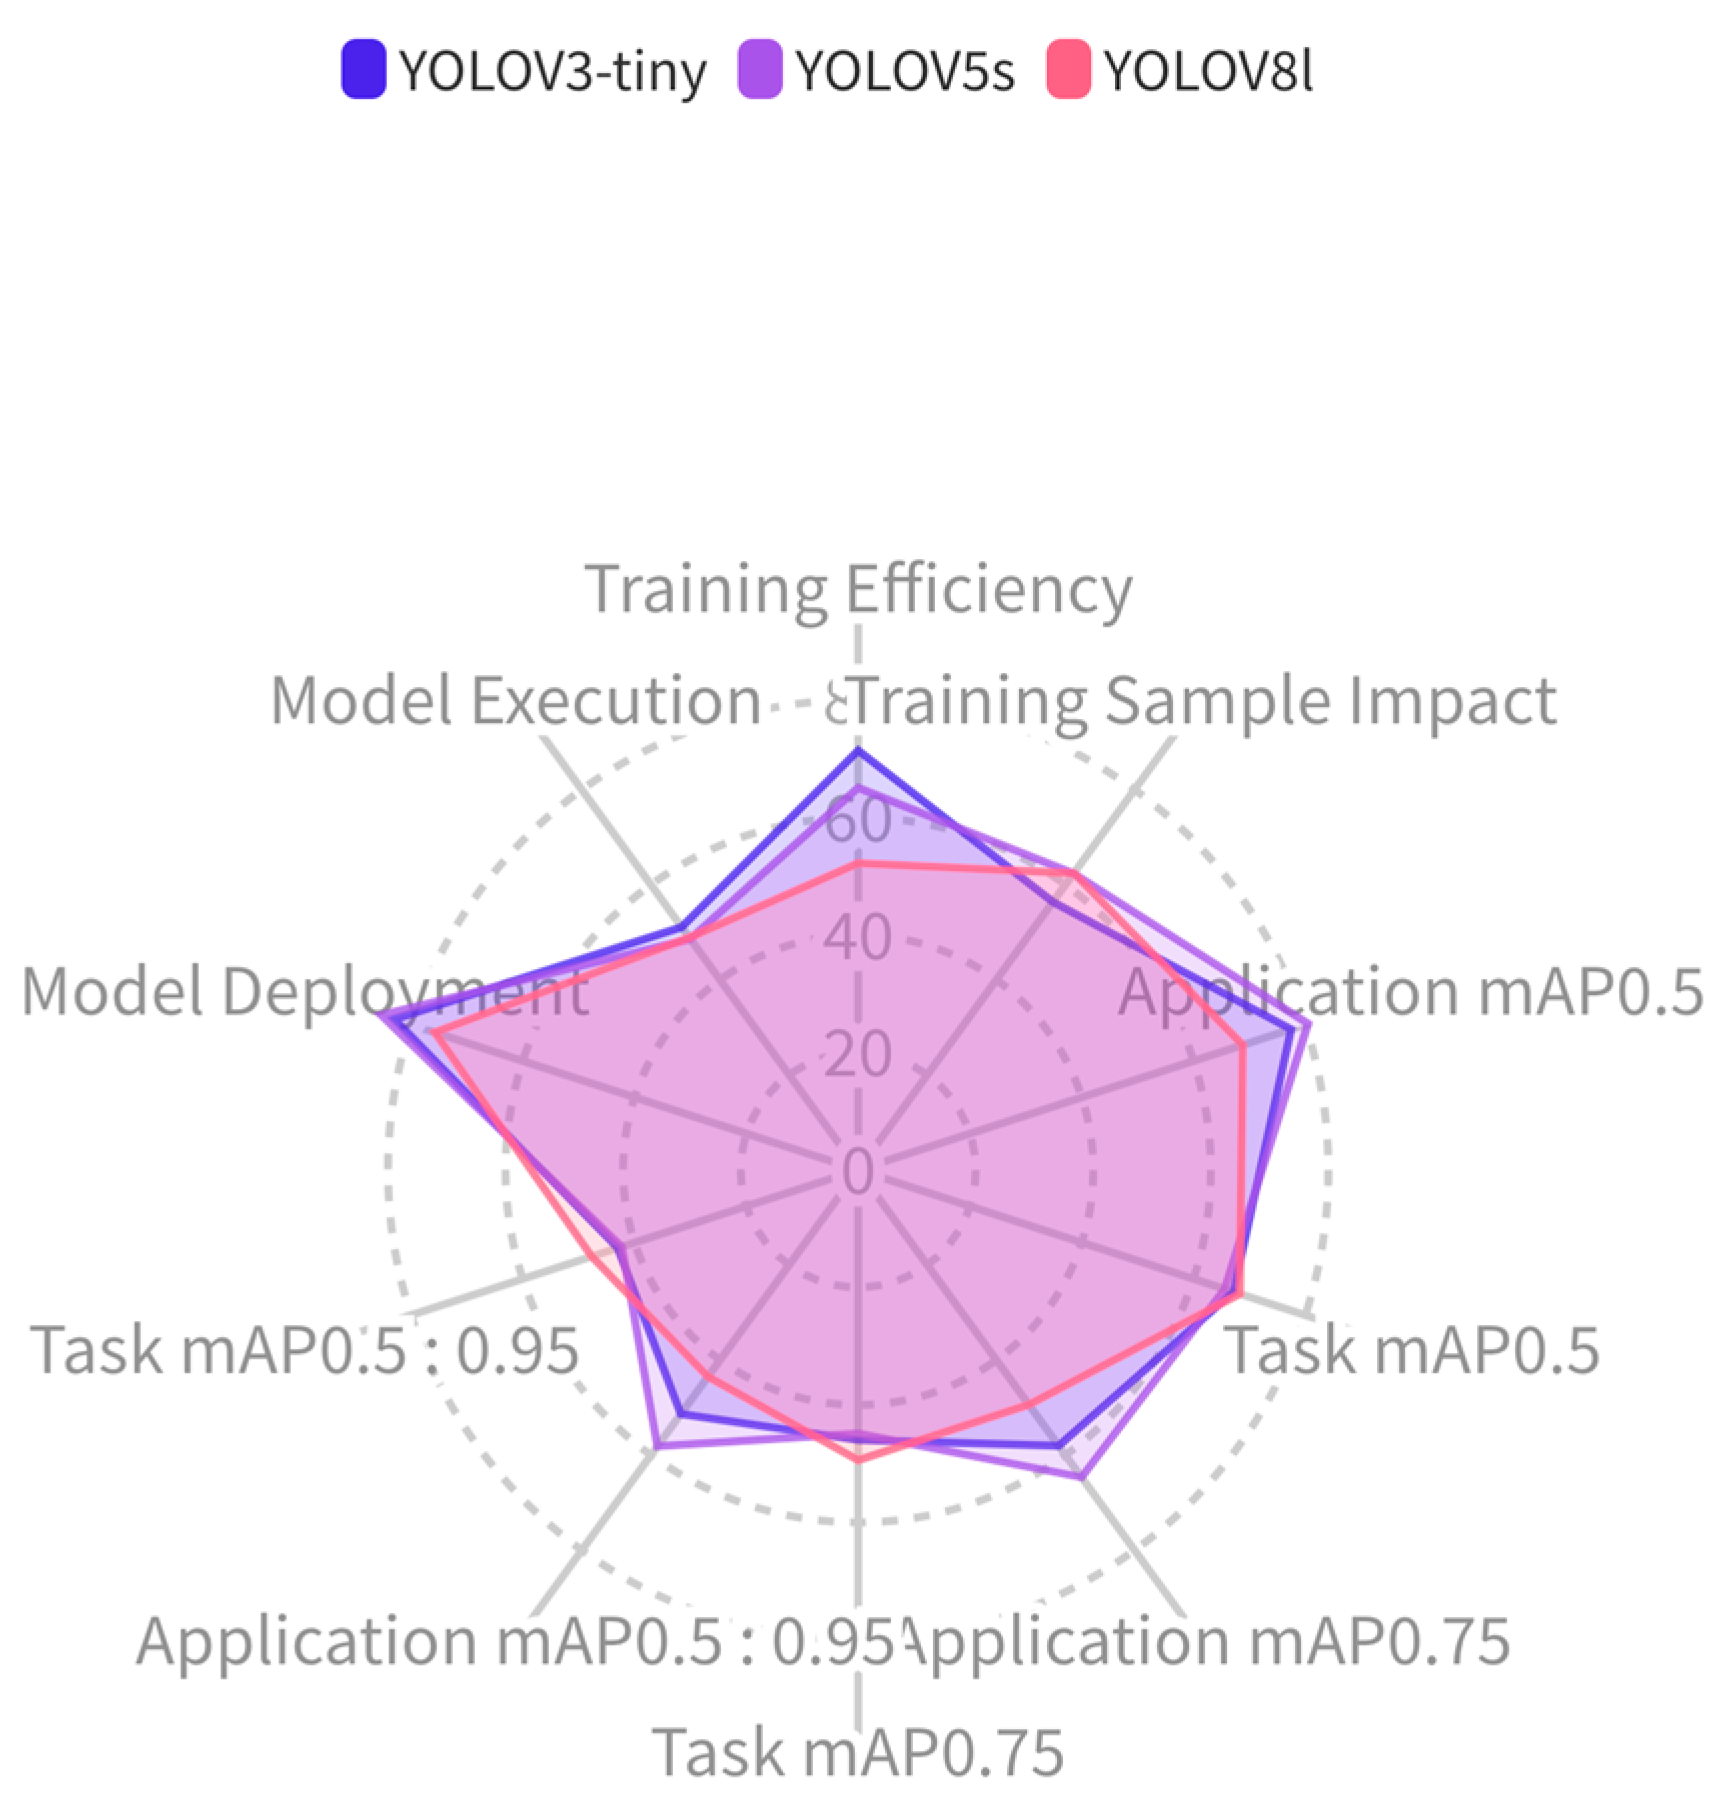
  • Constructing a multi-dimensional deep learning target detection performance profile, presenting the performance of target detection models in a multi-dimensional visual manner.
The remainder of this paper is organized as follows: Section 2 introduces the multidimensional evaluation method for deep learning models aimed at SAR image target detection; Section 3 introduces the multi-indicator comprehensive evaluation method based on entropy-weighted relevance scaling; Section 4 presents the experiments and evaluation results of this paper; and the conclusions of this paper will be given in Section 5.

2. Multidimensional Evaluation Method for Deep Learning Models for Synthetic Aperture Radar Image Target Detection

2.1. The Implications of Multidimensional Evaluation Methods for Deep Learning Models

With the development of artificial intelligence technology, the demand for deep learning models tailored to specific scenarios and application backgrounds is increasing, especially for applications with limited resources, which require specific models to match. Finding ways in which we can comprehensively, objectively, and systematically evaluate a model have become an urgent issue to be addressed on the path of artificial intelligence technology development, and there is still a large gap in the research in this area. Therefore, establishing a complete multi-dimensional evaluation system is very necessary.
The multi-dimensional evaluation method of deep learning, that is, an application-oriented, multi-dimensional evaluation method based on model applicability, aims to provide model decision-makers with reliable, comprehensive, and systematic performance and applicability assessments. Specifically, this evaluation method covers the key stages of deep learning models according to the time dimension, including the training phase, testing phase, and application phase.
The evaluation during the training phase is divided into two aspects: One is the processual representation of the model from the beginning to the end of training, which records the basic evaluation results of model training. The other is the assessment of the impact of different training samples on model performance, including aspects such as the balance, scale, annotation quality, and contamination of the data sample set.
The testing phase evaluation is carried out after model training is completed, consisting of the performance of a large number of tests of different dimensions and intensities to ensure the diversity and comprehensiveness of this phase’s assessment. Typically, the input of the model during the testing phase consists of samples prepared according to testing dimensions, and the output is the model’s test results.
The application phase evaluation assesses the usability of a model intended for deployment on end devices. This phase is closely integrated with the specific application scenarios of the deep learning model, directly reflecting the degree of match between the model and the application tasks, and the model can be adjusted accordingly based on the results of the application phase evaluation.

2.2. Multidimensional Evaluation Method of Deep Learning Models

2.2.1. Principles for Constructing a Multidimensional Evaluation Indicator System for Deep Learning

The construction of an indicator system is a task where “the benevolent see benevolence, and the wise see wisdom”. Different constructors and evaluators of indicator systems will start from different perspectives, building various evaluation indicator systems. Based on the work of this article, the authors have summarized several principles for constructing an evaluation indicator system. Figure 1 shows the process of constructing a multidimensional evaluation system for deep learning models, which is mainly divided into two parts. The first is the selection and construction of indicators for multidimensional evaluation, including principles of the indicator construction framework, basic principles of indicator construction, and hierarchical principles of indicator construction. The second is the multidimensional evaluation indicator system for deep learning, including the training phase, testing phase, and application phase.
In the selection and construction of multidimensional evaluation indicators, we have elaborated on three principles, among which the principles of the indicator construction framework include comprehensiveness and multidimensionality, dynamism, and specificity. The principles for indicator construction are comprehensiveness, systematicness, representativeness, accessibility, distinctiveness, and low overlap. The hierarchical principle of indicator construction indicates that the construction of evaluation indicators should have a certain level of logical distinction.
This multidimensional evaluation system should comprehensively cover all key stages of the model from training to application and integrate the evaluation indicators of each stage to form a layered and progressive structure. In the process of constructing this evaluation system, the key is to not only comprehensively consider the model’s task scope and application environment but also meticulously sort out the logical connections between different levels within the evaluation system. Through this method, evaluation indicators can work synergistically at different levels, ensuring the comprehensiveness and systematicness of the evaluation. Such a methodology not only provides structured guidance for evaluation but also enhances the credibility and practicality of the evaluation results.
(1)
Principles of a Multidimensional Evaluation Index System Framework for Deep Learning Models
(a)
Comprehensiveness and multidimensionality: The multidimensional evaluation index system for deep learning models must be comprehensive and embody multiple dimensions. The primary goal of any evaluation index is to facilitate scientific decision making. Therefore, the construction of this system must comprehensively and multidimensionally reflect the aspects of the evaluated object that are of concern to decision-makers. A well-constructed system enhances credibility and adequately guides decision making.
(b)
Dynamism: The deep learning model’s multidimensional evaluation index system needs to be dynamic. As the model is applied to varying scenarios or tasks, the performance evaluation perspectives and content of interest to decision-makers will change. Consequently, the evaluation index system should also be subjected to necessary adjustments and modifications.
(c)
Targetedness: The multidimensional evaluation index system for deep learning models should be specifically tailored to the different scenarios and tasks for which the model is designed. The same model may require different evaluation systems when applied to varying scenarios and tasks, necessitating a context-specific analysis and the construction of an evaluation system.
(2)
Basic Principles of a Multidimensional Evaluation Index System for Deep Learning Models
(a)
Comprehensiveness: The selection of indicators should be as comprehensive as possible, covering various aspects of deep learning models across time dimensions.
(b)
Systematic approach: The essence of the multidimensional evaluation of deep learning models should be completely reflected. This includes covering key stages of model evaluation and incorporating typical indicators.
(c)
Representativeness: The chosen indicators should be able to reflect the characteristics of a particular dimension and have general applicability.
(d)
Accessibility: The measurement of indicators should be straightforward, and the required data for calculating these indicators should be easily obtainable and reliable, facilitating easy computation.
(e)
Distinctiveness: The indicator system should cover the main aspects of the multidimensional evaluation of deep learning models while also being concise and not overly numerous. There should be clear distinctions between different indicators.
(f)
Low overlap: There should be minimal overlap between evaluation indicators to avoid distortion of the evaluation results.
(3)
Hierarchical Principle in Constructing a Multidimensional Evaluation Index System for Deep Learning Models
In addition, the overall structure of the multidimensional evaluation for deep learning models should possess a certain logical hierarchy. The multidimensional evaluation system of deep learning models includes a tiered structure built around key stages from training to deployment, integrated with evaluation indicators pertinent to each phase. During the construction of the evaluation system, it is essential not only to consider the model’s task scope and application context but also to take into account the overall logical relationships within the evaluation system. This involves adhering to the logical connections between different stages within the index system and constructing evaluation indicators from various perspectives.

2.2.2. Deep Learning Object Detection Model Iterative Development Cycle: Design, Verification, Training, and Deployment

The iterative development and optimization cycle of deep learning object detection models roughly consists of the following stages: a design phase, a design verification phase, model training, training phase evaluation, model performance testing and performance evaluation, application feasibility assessment, and model application. In Figure 2, the red text indicates the key stages of this process—the training phase, testing phase, and application phase. The purple text represents the feedback established during the testing phase and the training phase, while the green text represents the feedback established between the application phase and the design phase. This figure details the critical stages in the iterative optimization process of deep learning models, highlighting the importance of evaluations during the training, testing, and application phases. During the training phase, evaluating the model involves not just assessing basic training outcomes, such as training time, but also evaluating the model’s sensitivity to changes in training samples, including in regard to dataset size and data contamination. The results of this phase will directly impact performance during the testing phase. In the testing phase, the focus is on assessing aspects such as the model’s robustness and generalizability. The test results and the model training phase interact to form a closed-loop mechanism that guides model training. Finally, in the application feasibility assessment phase, this step is crucial for verifying the model’s feasibility and safety in actual deployment. Even if the model performs well during the training and testing phases, its practical value may be significantly reduced if it cannot meet the restrictions of application scenarios, among other factors. If the application scenario’s restrictions are not met, it is necessary to redesign the network and return to the starting point of the design to ensure a complete optimization closed loop. The specific details are as follows.
(1)
Design phase: This is the preliminary stage of model construction, involving theoretical conception, goal setting, model architecture conceptualization, and preliminary selection of algorithms. The main purpose of this phase is to establish a clear research plan and expected model performance goals.
(2)
Design verification phase: At this stage, the model architecture and algorithms proposed in the design verification phase are tested for theoretical feasibility, ensuring they can meet the established research objectives.
(3)
Model training: The designed and validated model is trained using actual training samples.
(4)
Training phase assessment: This assessment evaluates the efficiency of model training and the impact of different training datasets on model performance.
(5)
Model performance testing phase: After training is complete, the model is tested on a predetermined test set to evaluate its generalizability, robustness, and key metrics.
(6)
Testing phase feedback: There is a continuous feedback mechanism during the model’s training and testing that is used to assess its performance. If the performance in the testing phase does not meet requirements, this phase’s feedback will start retraining the model.
(7)
Application feasibility assessment: Before being deployed in real scenarios, the model is assessed to determine its performance in application settings. If it does not meet application requirements, feedback from this stage will return the model to the design phase for necessary adjustments and optimization.
(8)
Model application: Finally, the model is deployed in actual application environments, including servers and mobile devices.
With the development of artificial intelligence technology, the demand for SAR (synthetic aperture radar) image object detection models is increasing, especially in resource-constrained application scenarios, which require specific models to match them. Ways to comprehensively, objectively, and systematically evaluate a model have become an urgent problem to solve on the path of AI technology development, and there is still a large gap in the research in this area.
Therefore, this paper proposes a multidimensional evaluation method for deep learning models aimed at SAR image object detection, focusing on three aspects: training phase assessment, the model performance testing stage, and application feasibility assessment. The goal is to address evaluation issues under the key feedback mechanism in the lifecycles of SAR image object detection models, enabling researchers to accurately measure performance bottlenecks of models and thereby develop more precise model iteration strategies.

2.2.3. Building a Multidimensional Evaluation Index System for Deep Learning Models Aimed at Synthetic Aperture Radar Image Target Detection

In this study, we constructed a multidimensional evaluation indicator system for deep learning models aimed at SAR (synthetic aperture radar) image target detection, as shown in Figure 3. The solid frames represent evaluation indicators, while the dashed frames represent evaluation dimensions. Evaluation indicators refer to the quantification of the model’s performance on a specific task under a single and specific evaluation condition; evaluation dimensions refer to a group of related evaluation conditions organized to reflect the model’s performance under broader and more complex testing conditions.
The indicator system includes three key stages of model performance evaluation: the training phase, the testing phase, and the application phase. Specifically, during the training phase, it mainly divides into two aspects: first, the model’s training efficiency, and second, the influence of training samples. In the assessment of training efficiency, we mainly evaluated the basic attribute results of model training, including the evaluation of model attributes and the impact of the objective function. The evaluation of model attributes includes training time and convergence time; the impact of the objective function includes the degree of loss reduction and the degree of fit. In assessing the influence of training samples, we evaluated the model’s sensitivity to changes in the training dataset, including with respect to the size of the dataset and contamination situations. The evaluation during the testing phase includes model performance, evaluation based on model application, and evaluation based on model tasks. In the part of the evaluation based on model application, we constructed specific interferences for SAR images, covering several common interference types in SAR images. Furthermore, in the evaluation based on model tasks, considering the main object of this article is target detection models, we designed covering target occlusion and the ability to reject unknown targets as two evaluation dimensions. In the application phase, we constructed evaluation indicators based on model operation and model deployment. The evaluation indicators based on model operation mainly include the assessment of hardware architecture differences and model response intensity; the evaluation based on model deployment mainly includes model attributes, software platform dependency, hardware platform support, and differences in deep learning frameworks.
(1)
Training Phase Assessment: Indices and Dimensions
The training phase is the initial critical stage in the assessment of deep learning models. The effectiveness of the training process significantly influences whether a model’s performance aligns with the decision-maker’s expectations. The training phase encompasses the following two secondary indices: ‘Training Efficiency’ and ‘Impact of Training Samples’. Under ‘Training Efficiency’, there are two tertiary indices, and ‘Impact of Training Samples’ includes two evaluation dimensions. The definitions of the metrics during the training phase are outlined in Table 1.
(2)
Testing Phase Assessment: Indices and Dimensions
In the testing phase of the multidimensional evaluation of deep learning models, various testing methods are employed for numerous different model application scenarios and tasks, primarily using a black-box approach. This means testing the model under conditions where the model parameters and the influence of the training dataset are unknown, conducting adversarial tests to assess the model’s performance. The testing phase involves black-box adversarial testing based on each testing dimension, acquiring results for performance and adversarial intensity and thereby assessing the model’s applicability.
The testing phase is structured with two secondary dimensions, ‘Based on Model Application’ and ‘Based on Model Task’, extending downward to include three tertiary dimensions—‘Adaptability to Interference’, ‘Target Adaptability’, and ‘Open Set Adaptability’—as shown in Table 2. Under ‘Adaptability to Interference’, this paper, in conjunction with previous work [41] and considering the characteristics of SAR image samples, constructs evaluation dimensions, mainly comprising dense stripe suppression (DSS), equidistant stripe suppression (ESS), noise suppression (NS), noise convolution modulation interference (NCMI), step frequency shifting interference (SFSI), equidistant false point target strings (EFPTS), and highly realistic false target strings (HRFTS) [42]. Additionally, in the dimension ‘Based on Model Task’, two tertiary dimensions are constructed, ‘Target Adaptability’ and ‘Open Set Adaptability’, which include target occlusion and rejection of unknown targets, respectively.
(3)
Application Phase Assessment Indices
The evaluation outcomes in the application phase significantly determine the degree of alignment between the model and its specific application context. This is particularly crucial when the model is deployed on platforms with limited computational resources. Decision-makers can adjust the model based on the results of this phase’s assessment to ensure compatibility with the application scenario. The construction of the application phase assessment index system, as shown in Table 1, is mainly divided into two categories: model deployment assessment and model operation assessment.
(a)
Model operation assessment: This includes the following two tertiary indices: ‘Hardware Architecture Differences’ and ‘Model Response Intensity’. ‘Hardware Architecture Differences’ primarily focus on computational consistency. ‘Model Response Intensity’ encompasses three quaternary indices: image throughput rate, power consumption, and computational resource utilization rate.
(b)
Model deployment assessment: This primarily includes ‘Model Attributes’, ‘Software Platform Dependency’, ‘Hardware Platform Support’, and ‘Differences in Deep Learning Frameworks’. ‘Model Attributes’ cover aspects such as model size, time complexity, and space complexity.

3. Multi-Indicator Comprehensive Evaluation Method Based on Entropy Weight Correlation Scaling and Complexity Analysis

3.1. Multi-Indicator Comprehensive Evaluation Method Based on Entropy Weight Correlation Scaling

In the multidimensional evaluation of deep learning models for target detection in SAR images, given the complexity of the evaluation indicator system and the diversity of evaluation dimensions, this study proposes a multi-indicator comprehensive evaluation method based on entropy-weighted relevance scaling. This method is termed “relevance scaling” because, in integrating different evaluation indicators, it considers not only the importance of each indicator itself but also the interrelationships between or relevance among indicators. In this way, the method can dynamically adjust the weight of each indicator in the final score, optimizing according to the strength and direction of relationships between indicators. This consideration of relevance helps to reduce the redundant influence of highly correlated indicators, making the evaluation results more accurate and objective while also closely meeting the demands of actual conditions, avoiding the problem of neglecting the interactions between key indicators. By combining objective evaluation results with the relevance between indicators, this method effectively reduces errors that could be introduced by subjective assessment, enhancing the accuracy and objectivity of the evaluation results. The specific evaluation formula is as follows:
S i j = r i j ( λ 1 1 e j j = 1 m   ( 1 e j ) + λ 2 S c o r e m h m m   S c o r e m h m )
In the formula, λ 1 + λ 2 = 1 , and the determination of r i j (i.e., the normative score) is a key step. These scores are based on actual measurement results and are combined with the matrix of expert experiential knowledge to form quantified scores. This method, which combines actual measurements with expert knowledge, ensures that the evaluation process is supported by data and professional judgment, increasing the accuracy and reliability of the evaluation results. There are n samples and m evaluation indicators, where the normative score S i j for the i t h sample’s j t h item is obtained by combining two parts of weights. In the first item, e j is the entropy value of the j t h attribute component, defined as shown in Equation (2), where p i j = x i j * i = 1 n   x i j * , and p i j represents the proportion of the i t h datum under the j t h attribute component. The second item is the relevance scaling factor between evaluation indicators. For each evaluation indicator, its similarity score is denoted by S c o r e m h m , where S c o r e m is the initial similarity score, and h m is the trend coefficient.
e j = k i = 1 n   p i j ln p i j  
For positive indicators x i j , the data normalization operation is as follows:
x i j * = x i j m j M j m j ( i = 1,2 , , n ; j = 1,2 , , m )
For negative indicators x i j , the data normalization operation is as follows:
x i j * = M j x i j M j m j ( i = 1,2 , , n ; j = 1,2 , , m )
where M j = m a x i   x i j ; m j = m i n i   x i j .
In summary, the entropy-weighted relevance scaling method proposed in this study not only integrates objective data and expert knowledge but also, by considering the relevance between evaluation indicators, provides a novel and effective approach to the multidimensional evaluation of deep learning models in the field of SAR image target detection.

3.2. Complexity Analysis

In this study, we propose a multi-indicator comprehensive evaluation method based on entropy weight correlation scaling. To ensure the feasibility of this method in practical applications, we conducted a computational complexity analysis. Assuming the number of evaluation objects is n and the number of indicators is m , the following is a complexity analysis of the main computational steps:
  • Data Normalization
The data normalization step involves performing a normalization operation for each indicator ( n ) for each sample ( m ). This includes calculating the maximum and minimum values for each indicator and converting each indicator value to a standardized form. Since this operation needs to be performed for all evaluation objects, the complexity of data normalization corresponds to O ( n m ) .
2.
Entropy Calculation
In the entropy calculation step, we need to calculate the entropy value for each indicator. This requires summing and performing logarithmic operations for the indicator values of each sample. Since each indicator requires such calculations for all samples, the complexity of entropy calculation also corresponds to O ( n m ) .
3.
Correlation Scaling Factor Calculation
The calculation of the correlation scaling factor constitutes adjusting the mutual influence among indicators. If the similarity score is based on simple statistics, such as the Pearson correlation coefficient, then the complexity of this step also corresponds O ( n m ) , as it involves pairwise comparisons of indicator values for all samples.
4.
Comprehensive Evaluation
The comprehensive evaluation step includes calculating the weight of each indicator and performing a weighted sum. If the weight calculation is based on a simple linear combination, then the complexity of this step also corresponds to O ( n m ) . However, if the weight calculation involves more complex optimization algorithms, the complexity may increase.
5.
Overall Complexity
Considering the above steps, the overall computational complexity of our method mainly depends on the complexities of data normalization, entropy calculation, correlation scaling factor calculation, and comprehensive evaluation. In the most ideal scenario, if all steps are based on simple mathematical operations, then the overall complexity of the method can be considered to correspond to O ( n m ) .

4. Experimental Setup and Analysis

4.1. Dataset and Experimental Configuration

4.1.1. Dataset Introduction

In this experiment, the datasets used were the SAR ship dataset [43] for ships and the SAR aircraft dataset [44] for aircraft, with the ratio of the training set to the validation set and test set being 6:2:2. The SAR ship dataset primarily sources its data from China’s Gaofen-3 SAR data and Sentinel-1 SAR data, comprising 102 Gaofen-3 and 108 Sentinel-1 SAR images, to construct a high-resolution SAR ship target deep learning sample library. Currently, this deep learning sample library contains 43,819 ship slices. Additionally, the aircraft dataset images come from the Gaofen-3 satellite, including 4368 images and 16,463 aircraft target instances, covering seven categories: A220, A320/321, A330, ARJ21, Boeing 737, Boeing 787, and others. For open-set adaptability, the MSTAR dataset [45] was used. The sensor of this dataset is a high-resolution, spotlight-mode synthetic aperture radar with a resolution of 0.3 m × 0.3 m, operating in the X-band and using HH polarization mode. This dataset primarily consists of SAR slice images of stationary vehicles, featuring a variety of vehicle targets captured at different azimuth angles.

4.1.2. Experimental Settings

This experiment was conducted using the Pytorch deep learning framework on the Ubuntu 20.04 system, equipped with an i5-11400H CPU, an RTX3050 GPU, and 16 GB of memory, ensuring efficiency and stability. The chosen models for this study are YOLOz3-tiny, YOLOv5s, and YOLOv8l, which were selected based on the following considerations: First, these models range from lightweight to advanced complexity, facilitating performance evaluation across various computing environments. Second, they represent different developmental stages in the YOLO series in the field of object detection, aiding in analyzing how evolution impacts performance. Third, their adaptability spans a wide range of application scenarios, from real-time processing to high-precision tasks. Fourth, as industry-standard models, the YOLO series serves as a benchmark for performance assessment. Fifth, they cater to the specific needs of SAR imagery, exploring the adaptability of models with varying complexities. The parameter settings for training are shown in Table 3.
During the training phase, the dataset was divided into different levels (L1, L2, and L3) based on the number of samples (90%, 60%, and 30%) and quality (with noise intensities of −5 dB, 0 dB, and 5 dB) to evaluate the impact of training dataset scale and contamination [29]. The testing phase focused on the model’s target adaptability and open-set adaptability. Target adaptability included various degrees of occlusion (30%, 15%, and 5% of the sample area), while open-set adaptability was tested using the MSTAR dataset [28] to assess the model’s performance in detecting unknown targets. This experimental setup is designed to comprehensively evaluate the selected models’ performance and robustness across different scenarios, ensuring the accuracy and reliability of the results. Furthermore, the experimental results of this paper are detailed in Table A1, Table A2, Table A3, Table A4, Table A5 and Table A6 in Appendix A, and the knowledge matrix based on expert experience is elaborated in Table A7 in Appendix A.

4.2. Analysis of Experimental Results

4.2.1. Normalized Scores at Various Stages of Key Phases

The experimental results are shown in Figure 4 and Table 4. In the multidimensional performance profile of the deep learning model for target detection, there are 10 test dimensions: training efficiency, influence of training samples, application mAP0.5, task mAP0.5, application-based mAP0.75, task-based mAP0.75, application-based mAP0.5: 0.95, task-based mAP0.5:0.95, model deployment, and model operation. The models evaluated in the experiment are YOLOv3-tiny, YOLOv5s, and YOLOv8l. In the figure, we can see that the YOLOv3-tiny and YOLOv5s models are stronger than YOLOv8l in the training and application deployment stages, but YOLOv8l is more stable in the testing phase.
From the normative scores and performance profiles, we can see that, in terms of training efficiency during the training phase, YOLOv3-tiny has the highest normative score, which indicates that this model is more efficient in terms of resource consumption and time cost compared to other models. YOLOv5s and YOLOv8l have lower training efficiencies due to their more complex model structures, which require more computational resources and time. In terms of the influence of training samples, YOLOv8l and YOLOv5s score closely, indicating that these two models adapt well to changes in training samples (the size of the training dataset and contamination of the training dataset), showing similar robustness to changes in size and quality of the training dataset, and are superior to YOLOv3-tiny. YOLOv3-tiny scores slightly lower, indicating it is more sensitive to changes in training samples.
In the testing phase, we tested model performance in two dimensions, model application and model task. The test results will be discussed separately.
(1)
Application-based mAP0.5: YOLOv5s scores the highest, indicating strong generalization ability in practical applications and excellent performance in handling external disturbances in various application scenarios.
(2)
Task-based mAP0.5: YOLOv8l scores the highest, indicating it performs better in core detection tasks, such as the precise identification and localization of targets, compared to the other two models.
(3)
Application-based mAP0.75: In the stricter mAP0.75 assessment, YOLOv5s still maintains the lead, indicating that, in applications requiring higher precision, YOLOv5s can still maintain its performance.
(4)
Task-based mAP0.75: YOLOv8l performs best, indicating that, under higher IoU thresholds, YOLOv8l’s adaptability to targets and open-set adaptability are far superior to those of the other two models.
(5)
Application-based mAP0.5:0.95: YOLOv5s performs best when considering various IoU thresholds, which indicates it maintains good detection performance in a range of complex backgrounds and application conditions.
(6)
Task-based mAP0.5:0.95: YOLOv8l shows strong capabilities in handling occlusions and rejecting open-set categories. This evaluation, which measures a model’s performance through the average precision under different IoU thresholds, demonstrates that YOLOv8 can effectively locate and identify targets under a series of strict standards, showing its high precision in complex detection tasks.
In the application phase, YOLOv3-tiny scores highest in model deployment, indicating higher efficiency and convenience in real-world deployment. In terms of model operation, YOLOv3-tiny and YOLOv5s score higher than YOLOv8l, indicating that YOLOv3-tiny and YOLOv5s offer higher operational stability in actual operation compared to YOLOv8l.
In summary, YOLOv5s exhibits strong performance in most test indicators and performs well in various scenarios. YOLOv8l has advantages in high-precision tasks. YOLOv3-tiny excels in deployment and operational efficiency, which may make it the preferred choice for scenarios with limited resources or the need for rapid deployment. The above conclusions can provide reference and guidance for the selection of models in specific application scenarios. If the deployment resources for the SAR image detection model are severely limited and the detection accuracy requirement is not high, then YOLOv3-tiny is more suitable for this scenario. If the SAR image detection application has fewer training samples and severe training dataset contamination and there is a high demand for model detection precision, then YOLOv5s is more suitable. If the deployment resources for the SAR image detection model are abundant, training dataset samples are few, contamination is severe, and there is a demand for stable and accurate detection precision, then YOLOv8l is more suitable.

4.2.2. Normalized Scores for Sub-Indices and Sub-Dimensions

The normative scores for the training phase in the multidimensional evaluation of deep learning models for SAR image target detection are shown in Table 5. It can be seen that, in terms of training efficiency, YOLOv3-tiny and YOLOv5s are superior to YOLOv8l, with the YOLOv3-tiny and YOLOv5s models being particularly prominent in terms of training time and convergence time. Regarding the influence of training samples, YOLOv8l is superior to YOLOv5s and YOLOv3-tiny in most cases, indicating that YOLOv8l can maintain good performance even when the quantity and quality of training samples are poor. The weights of various metrics during the training phase evaluation are shown in Table A8 and Table A9.
The normativity scores during the testing phase are presented in Table 6 and Table 7. In the testing phase, based on the model application part, YOLOv5s performs the best, indicating that this model has better interference adaptability and rejection capability than the other two groups. Among them, in terms of occlusion adaptability, as the IoU proportion decreases, YOLOv8l’s performance is clearly superior to the other two groups. As shown in Figure 5, we present experimental images of samples with various types of interference and their detection results. In this section, we will detail the sample images that have been processed for interference. In terms of model rejection capability, YOLOv3-tiny and YOLOv8l are significantly better than YOLOv5s. The weights of the different metrics in the testing phase evaluation are shown in Table A10, Table A11 and Table A12.
In the application phase, YOLOv3-tiny, due to its smaller model size, is superior in terms of the model deployment dimension to the other two groups, as shown in Table 8. In terms of model operation, YOLOv3-tiny is better than YOLOv5s and YOLOv8l, especially in terms of power consumption, in which the score for YOLOv3-tiny is somewhat lower. Therefore, YOLOv3-tiny is more suitable for deployment in mobile terminals, where computational resources are limited and a certain speed of detection is required. The weights of the various metrics in the application phase evaluation are shown in Table A13.

5. Conclusions

As the application of target detection technology in the SAR image field becomes more widespread, accurately evaluating model performance to meet the complex requirements of specific application scenarios has become a key factor in increasing task success rates. Currently, there are still many gaps in the field of target detection model evaluation. The main issue faced is the limited scope of single evaluation dimensions, which are insufficient for a comprehensive assessment of model performance; simultaneously, there is a lack of a comprehensive evaluation mechanism with which to fully measure a model’s performance.
To address this issue, this paper proposes a multidimensional evaluation method for deep learning models aimed at SAR image target detection. Initially, we constructed a multidimensional evaluation indicator system for deep learning models targeting SAR image target detection based on the overall idea of “using evaluation indicators as the basis and evaluation dimensions as the extension, with both complementing each other”. This system includes key phases of model evaluation—the training phase, testing phase, and application phase. Then, we introduced a multi-indicator comprehensive evaluation method based on entropy weight correlation scaling, combining the objective evaluation results with the correlation among indicators, to provide a balanced and comprehensive evaluation mechanism for model performance. Finally, by integrating expert experience and knowledge matrices, we fused the test results and constructed a multidimensional performance profile for deep learning target detection models, offering an intuitive reference framework for the in-depth evaluation of model performance.
Although our research proposes a multidimensional evaluation method for deep learning models for SAR image target detection tasks, future work will focus on continuing to revise and perfect this multidimensional evaluation indicator system and multi-indicator comprehensive evaluation model. Potential directions for future work include the following: first, collecting and integrating more diverse SAR image data, including images under extreme weather conditions, different time periods, and more complex interference patterns, to improve a model’s generalizability and robustness; second, exploring lightweight model designs and studying model compression and quantization techniques to reduce computational demand and lower deployment costs, making a model more suitable for resource-limited environments; third, researching cross-domain adaptability techniques to enable a model to transfer between and adapt to different SAR image fields, thus improving the model’s universality; and finally evaluating model performance in real-time or near-real-time environments, including processing speed, energy consumption, and latency, to better simulate and meet the needs of actual application scenarios.

Author Contributions

Conceptualization, J.L. and H.L.; methodology, H.L. and P.W.; software, P.W., L.N. and Q.H.; validation, P.W., X.Z. and J.L.; formal analysis, P.W. and H.L.; data curation, P.W.; writing-original draft preparation, H.L. and P.W.; writing-review and editing, P.W., H.L. and Z.X.; funding acquisition, J.L. All authors have read and agreed to the published version of the manuscript.

Funding

This work was supported by the National Natural Science Foundation of China (Grant No. 62271166) and the Interdisciplinary Research Foundation of HIT (No. IR2021104).

Data Availability Statement

In the experiments presented in this paper, three datasets were used. The download links are as follows: The MSTAR dataset can be downloaded from the following link: [https://pan.baidu.com/s/1SAdmYAOHPheAH98CLP9dQg] with the extraction code h2ig. The download link for the SAR-ship-dataset is https://github.com/CAESAR-Radi/SAR-Ship-Dataset. The download link for the SAR-aircraft dataset is https://github.com/hust-rslab/SAR-aircraft-data.

Conflicts of Interest

The authors declare no conflicts of interest.

Appendix A

Table A1. Training phase test results.
Model TypeTraining EfficiencyTest Results
YOLOv3Training Time2.076 h
Convergence Time7473.91 s
Loss Reduction Degree81.79%
Fitment Level1.025
YOLOv5Training Time2.901 h
Convergence Time9888.17 s
Loss Reduction Degree86.64%
Fitment Level1.026
YOLOv8Training Time8.296 h
Convergence Time13.392 s
Loss Reduction Degree89.24%
Fitment Level1.0372
Table A2. Sample quantity and sample quality test results.
Sample Quantity-mAP@[0.5:0.05:0.95] Test Results
ModelL1L2L3
YOLOv3-tiny0.68190.64050.5897
YOLOv5s0.74460.69880.6314
YOLOv8l0.76710.70780.6313
Sample Quality-mAP@[0.5:0.05:0.95]
YOLOv3-tiny0.68190.51680.2205
YOLOv5s0.74460.55930.3228
YOLOv8l0.76710.55860.2631
Table A3. Testing phase test results.
ModelDSSESSNSNCMISFSIEFPTSHRFTS
mAP0.5 Test Results for Each Model
YOLOv3-tiny0.49160.56350.87940.67280.92750.90220.9058
YOLOv5s0.50670.71920.90460.68980.93940.89790.9204
YOLOv8l0.46220.38140.93580.61860.84570.73390.7883
mAP0.75 Test Results for Each Model
YOLOv3-tiny0.37870.28450.58090.49130.76940.72680.7499
YOLOv5s0.42980.42510.68760.53450.81350.7650.7925
YOLOv8l0.32850.24820.68550.39770.61070.53750.5711
mAP0.5:0.95 Test Results for Each Model
YOLOv3-tiny0.32220.28260.52390.44820.66680.63340.66134
YOLOv5s0.392150.418490.59990.499740.717460.682250.712
YOLOv8l0.298550.237910.631980.345120.523420.455440.52171
Table A4. Open-set class adaptability test results.
Object Detection ModelSample QuantityNumber of Unknown Class DetectionsUnknown Class Detection Rate
YOLOv3-tiny27481957.10%
YOLOv5s274894634.42%
YOLOv8l274833512.19%
Table A5. Model execution test results.
ModelModel Size (MB)Deployment Time (h)Operator SupportQuantization Characteristics
YOLOv3-tiny17.7 1.2831000.6822
YOLOv5s14.4 1.7161000.7466
YOLOv8l87.70.61000.7657
Table A6. Model deployment test results.
Model TypeCompute ConsistencyFPSPower Consumption (W)Compute Resource Utilization (%)
YOLOv397.3105.027.358.08
YOLOv598.560.627.541.58
YOLOv899.4589.298.746
Table A7. Expert knowledge matrix.
IndicatorsRange of Test Results and Scoring Rules
Training Time0–0.5 h: 100 points
0.5–1 h: 90 points
1–1.5 h: 80 points
1.5–2 h: 70 points
2–2.5 h: 60 points
2.5–3 h: 50 points
3–4 h: 30 points
>4 h: 20 points
Convergence Time0–5000 s: 100 points
5000–6000 s: 90 points
6000–7000 s: 80 points
7000–8000 s: 70 points
8000–9000 s: 60 points
9000–10,000 s: 50 points
>10,000 s: 40 points
Degree of Loss ReductionLoss reduction percentage is equivalent to percentage score
Degree of Fit100 − (test result − 1) * 100
mAPTest result is equivalent to percentage score
Model Size1–10 MB: 100 points
10–15 MB: 90 points
15–20 MB: 80 points
25–30 MB: 70 points
30–35 MB: 60 points
>35 MB: 40 points
Deployment Time0–0.5 h: 100 points
0.5–1 h: 90 points
1–1.5 h: 80 points
1.5–2 h: 70 points
Operator SupportEquals percentage score
Quantization CharacteristicsQuantized mAP value * 100
Compute ConsistencyTest result * 100
Image ThroughputTest result/reference value (reference is 200)
Power ConsumptionReference value − test result * 10 (reference is 100)
Compute Resource UtilizationReference value − percentage * 100 (reference is 100)

Appendix B

Table A8. Training phase evaluation metric weights.
Level 3 IndicatorLevel 4 IndicatorWeights
Model PropertiesTraining Time0.2689
Convergence Time0.2229
Impact of Objective
Function
Loss Reduction Level0.2283
Fitment Level0.2798
Table A9. Training phase evaluation dimension weights.
Tertiary DimensionQuaternary DimensionWeights
Training Dataset SizeSample Quantity—Level 10.1563
Sample Quantity—Level 20.1731
Sample Quantity—Level 30.1927
Training Dataset Contamination LevelSample Quality—Level 10.1563
Sample Quality—Level 20.1905
Sample Quality—Level 30.1307
Table A10. Test phase evaluation metric weights (mAP0.5).
Tertiary DimensionQuaternary DimensionWeights
Interference AdaptabilityDSS0.1328
ESS0.1240
NS0.1220
NCMI0.1422
SFSI0.1547
EFPTS0.1674
HRFTS0.1567
Objective AdaptabilityOcclusion—Head0.1238
Occlusion—Middle0.1639
Occlusion—Tail0.1599
Small-scale Occlusion—L10.1395
Small-scale Occlusion—L20.1213
Small-scale Occlusion—L30.1255
Open-set AdaptabilityRejection Capability0.1657
Table A11. Test phase evaluation metric weights (mAP0.75).
Tertiary DimensionQuaternary DimensionWeights
Interference AdaptabilityDSS0.1257
ESS0.1280
NS0.1589
NCMI0.1379
SFSI0.1471
EFPTS0.1524
HRFTS0.1497
Objective AdaptabilityOcclusion—Head0.1344
Occlusion—Middle0.1580
Occlusion—Tail0.1188
Small-scale Occlusion—L10.1360
Small-scale Occlusion—L20.1532
Small-scale Occlusion—L30.1528
Open-set AdaptabilityRejection Capability0.1464
Table A12. Test phase evaluation metric weights (mAP0.5:0.95).
Tertiary DimensionQuaternary DimensionWeights
Interference AdaptabilityDSS0.1317
ESS0.1320
NS0.1388
NCMI0.1432
SFSI0.1499
EFPTS0.1547
HRFTS0.1494
Objective AdaptabilityOcclusion—Head0.1383
Occlusion—Middle0.1640
Occlusion—Tail0.1470
Small-scale Occlusion—L10.1412
Small-scale Occlusion—L20.1389
Small-scale Occlusion—L30.1334
Open-set AdaptabilityRejection Capability0.1368
Table A13. Application Phase Evaluation Metric Weights.
Level 2 IndicatorLevel 4 IndicatorWeights
Model ExecutionCompute Consistency0.2200
Image Throughput0.2482
Power Consumption0.2886
Compute Resource Utilization0.2430
Model DeploymentModel Size0.2788
Deployment Time0.1932
Operator Support0.2903
Quantization Characteristics0.2375

References

  1. Zhang, Y.; Hao, Y. A Survey of SAR Image Target Detection Based on Convolutional Neural Networks. Remote Sens. 2022, 14, 6240. [Google Scholar] [CrossRef]
  2. Kumar, D. Urban Objects Detection from C-Band Synthetic Aperture Radar (SAR) Satellite Images through Simulating Filter Properties. Sci. Rep. 2021, 11, 6241. [Google Scholar] [CrossRef]
  3. Liu, J.; Chen, H.; Wang, Y. Multi-Source Remote Sensing Image Fusion for Ship Target Detection and Recognition. Remote Sens. 2021, 13, 4852. [Google Scholar] [CrossRef]
  4. Song, J.; Zheng, Y.; Yuan, L. Understanding and Applications of Synthetic Aperture Radar Images, 1st ed.; Science Press: Beijing, China, 2008; pp. 1–378. [Google Scholar]
  5. Duarte, R.P.; Cruz, H.; Neto, H. Reconfigurable accelerator for on-board SAR imaging using the backprojection algorithm. In Applied Reconfigurable Computing. Architectures, Tools, and Applications; Rincón, F., Barba, J., So, H.K.H., Diniz, P., Caba, J., Eds.; Springer International Publishing: Cham, Switzerland, 2020; pp. 392–401. [Google Scholar]
  6. Huang, Q.; Zhu, W.; Li, Y.; Zhu, B.; Gao, T.; Wang, P. Survey of Target Detection Algorithms in SAR Images. In Proceedings of the IEEE 5th Advanced Information Technology, Electronic and Automation Control Conference (IAEAC), Chongqing, China, 25–27 September 2021. [Google Scholar]
  7. Huang, Y.; Zhang, L.; Li, J.; Tao, M.; Chen, Z.; Hong, W. Machine Learning Methods for SAR Interference Mitigation. In Synthetic Aperture Radar (SAR) Data Applications; Springer Optimization and Its Applications; Springer: Cham, Switzerland, 2022; Volume 199, p. 6. [Google Scholar]
  8. Cruz, H.; Véstias, M.; Monteiro, J.; Neto, H.; Duarte, R.P. A Review of Synthetic-Aperture Radar Image Formation Algorithms and Implementations: A Computational Perspective. Remote Sens. 2022, 14, 1258. [Google Scholar] [CrossRef]
  9. Geng, Z.; Xu, Y.; Wang, B.-N.; Yu, X.; Zhu, D.-Y.; Zhang, G. Target Recognition in SAR Images by Deep Learning with Training Data Augmentation. Sensors 2023, 23, 941. [Google Scholar] [CrossRef] [PubMed]
  10. Xiao, Z.J.; Lin, B.H.; Qu, H.C. Improved SAR Ship Detection Algorithm for YOLOv7. Comput. Eng. Appl. 2023, 59, 243–252. [Google Scholar]
  11. Liu, Q.; Gu, N.W.; Zhang, X.W.; Lu, W.J. Target Detection and Camouflage Effect Evaluation in Ground Environment of SAR Image Based on Deep Learning. Struct. Environ. Eng. 2022, 49, 178–186. [Google Scholar]
  12. Wei, S.J.; Jiang, P.F.; Yuan, Q.Z.; Liu, M.L. Detection and Recognition of SAR Small Ship Objects Using Deep Neural Network. J. Northwest. Polytech. Univ. 2019, 37, 587–593. [Google Scholar] [CrossRef]
  13. Yasir, M.; Liu, S.; Xu, M.; Sheng, H.; Hossain, M.S.; Isiacik, A.T.; Wang, D.; Wan, J.; Dang, K.B. Multi-scale Ship Target Detection Using SAR Images Based on Improved Yolov5. Front. Mar. Sci. 2023, 9, 1086140. [Google Scholar] [CrossRef]
  14. Ihmeida, M.; Shahzad, M. Deep Despeckling of SAR Images to Improve Change Detection Performance. In Artificial Intelligence XL. SGAI 2023. Lecture Notes in Computer Science; Bramer, M.A., Stahl, F.B., Eds.; Springer: Cham, Switzerland, 2023; Volume 14381, pp. 115–126. [Google Scholar]
  15. Bouraya, S.; Belangour, A. Deep Learning Object Detection Models: Evolution and Evaluation. In Proceedings of the 15th International Conference on Digital Image Processing, Nanjing, China, 19–22 May 2023. [Google Scholar]
  16. Bulut, A.; Ozdemir, F.; Bostanci, Y.S.; Soyturk, M. Performance Evaluation of Recent Object Detection Models for Traffic Safety Applications on Edge. In Proceedings of the 2023 5th International Conference on Image Processing and Machine Vision (IPMV ‘23), Macau, China, 13–15 January 2023. [Google Scholar]
  17. Stankovic, L.; Nikolic, T.; Talaška, T.; Długosz, R. Performance Evaluation of YOLO Models for Automatic Crop and Weed Detection. In Proceedings of the 2023 IEEE 33rd International Conference on Microelectronics (MIEL), Nis, Serbia, 16–18 October 2023. [Google Scholar]
  18. Wang, Y.; Zhou, J.; Zhang, C.; Luo, Z.; Han, X.; Ji, Y.; Guan, J. Bird Object Detection: Dataset Construction, Model Performance Evaluation, and Model Lightweighting. Animals 2023, 13, 2924. [Google Scholar] [CrossRef] [PubMed]
  19. Heda, L.; Sahare, P. Performance Evaluation of YOLOv3, YOLOv4 and YOLOv5 for Real-Time Human Detection. In Proceedings of the 2023 2nd International Conference on Paradigm Shifts in Communications Embedded Systems, Machine Learning and Signal Processing (PCEMS), Nagpur, India, 5–6 April 2023. [Google Scholar]
  20. Gallo, I.; Rehman, A.U.; Dehkordi, R.H.; Landro, N.; La Grassa, R.; Boschetti, M. Deep Object Detection of Crop Weeds: Performance of YOLOv7 on a Real Case Dataset from UAV Images. Remote Sens. 2023, 15, 539. [Google Scholar] [CrossRef]
  21. Bergstrom, A.C.; Messinger, D.W. Image Quality and Object Detection Performance of Convolutional Neural Networks. In Proceedings of the Defense + Commercial Sensing, Orlando, FL, USA, 30 April–4 May 2023. [Google Scholar]
  22. Gordienko, N.; Gordienko, Y.G.; Rokovyi, O.; Alienin, O.; Polukhin, A.; Stirenko, S.G. Impact of Mixed Multimodalities and Size Dependence on Performance of Object Detection on Multimodal Satellite Imagery. In Proceedings of the 2023 IEEE International Conference on Big Data (BigData), Sorrento, Italy, 15–18 December 2023. [Google Scholar]
  23. Tarekegn, A.N.; Cheikh, F.A.; Ullah, M.; Sollesnes, E.T.; Alexandru, C.; Azar, S.N.; Erol, E.; Suciu, G. Underwater Object Detection using Image Enhancement and Deep Learning Models. In Proceedings of the 2023 11th European Workshop on Visual Information Processing (EUVIP), Gjøvik, Norway, 11–14 September 2023. [Google Scholar]
  24. Huo, Y.; Qian, X.; Li, C.Y.; Wang, W. Multiple Instance Complementary Detection and Difficulty Evaluation for Weakly Supervised Object Detection in Remote Sensing Images. IEEE Geosci. Remote Sens. Lett. 2023, 20, 1–5. [Google Scholar] [CrossRef]
  25. Pu, X.; Jia, H.; Xu, F. Cross-Domain SAR Ship Detection in Strong Interference Environment Based on Image-to-Image Translation. In Proceedings of the IGARSS 2023—2023 IEEE International Geoscience and Remote Sensing Symposium, Pasadena, CA, USA, 16–21 July 2023. [Google Scholar]
  26. Huang, M.; Liu, Z.; Liu, T.; Wang, J. CCDS-YOLO: Multi-Category Synthetic Aperture Radar Image Object Detection Model Based on YOLOv5s. Electronics 2023, 12, 3497. [Google Scholar] [CrossRef]
  27. Hindarto, D. Performance Comparison of ConvDeconvNet Algorithm vs. UNET for Fish Object Detection. Sink. J. Dan Penelit. Tek. Inform. 2023, 7, 2827–2835. [Google Scholar] [CrossRef]
  28. Hernandez-Torres, S.I.; Hennessey, R.P.; Snider, E.J. Performance Comparison of Object Detection Networks for Shrapnel Identification in Ultrasound Images. Bioengineering 2023, 10, 807. [Google Scholar] [CrossRef] [PubMed]
  29. Tekin, A.; Bozkır, A.S. Enhance or Leave It: An Investigation of the Image Enhancement in Small Object Detection in Aerial Images. J. Inst. Sci. Technol. 2024, 14, 8–17. [Google Scholar] [CrossRef]
  30. Ma, X.; Wang, Y.; Zhang, Y.; Xia, Z.; Meng, Y.; Wang, Z.; Li, H.; Ouyang, W. Towards Fair and Comprehensive Comparisons for Image-Based 3D Object Detection. arXiv 2023, arXiv:2310.05447. [Google Scholar]
  31. Mora, A.; Mendez, A.; Barber, R. Evaluating Techniques for Accurate 3D Object Model Extraction Through Image-Based Deep Learning Object Detection and Point Cloud Segmentation. In Proceedings of the European Conference on Mobile Robots (ECMR), Coimbra, Portugal, 4–7 September 2023. [Google Scholar]
  32. Liu, Y.; Kang, K.-D. Preprocessing via Deep Learning for Enhancing Real-Time Performance of Object Detection. In Proceedings of the 2023 IEEE 97th Vehicular Technology Conference (VTC2023-Spring), Florence, Italy, 20–23 June 2023. [Google Scholar]
  33. Alin, A.Y.; Kusrini; Kusrini; Yuana, K.A. Data Augmentation Method on Drone Object Detection with YOLOv5 Algorithm. In Proceedings of the 2023 Eighth International Conference on Informatics and Computing (ICIC), Manado, Indonesia, 8–9 December 2023. [Google Scholar]
  34. Wang, C.; Ruan, R.; Zhao, Z.; Li, C.; Tang, J. Category-Oriented Localization Distillation for SAR Object Detection and a Unified Benchmark. IEEE Trans. Geosci. Remote Sens. 2023, 61, 5211314. [Google Scholar] [CrossRef]
  35. Topuz, Y.; Yıldız, S.; Varlı, S. Performance analysis of the YOLO series for object detection: Detection of mitosis cells in histopathology images. In Proceedings of the 2023 Medical Technologies Congress (TIPTEKNO), Famagusta, Cyprus, 10–12 November 2023. [Google Scholar]
  36. Zihan, Z.U.A.; Smadi, O.; Tilberg, M.; Yamany, M.S. Synthesizing the Performance of Deep Learning in Vision-Based Pavement Distress Detection. Innov. Infrastruct. Sol. 2023, 8, 299. [Google Scholar] [CrossRef]
  37. Haimer, Z.; Mateur, K.; Farhan, Y.; Madi, A.A. Pothole Detection: A Performance Comparison Between YOLOv7 and YOLOv8. In Proceedings of the 2023 9th International Conference on Optimization and Applications (ICOA), Abu Dhabi, United Arab Emirates, 5–6 October 2023. [Google Scholar]
  38. Bakir, H.; Bakir, R. Evaluating the robustness of YOLO object detection algorithm in terms of detecting objects in noisy environment. J. Sci. Rep. A 2023, 54, 1–25. [Google Scholar] [CrossRef]
  39. Mohd Yusof, N.I.; Sophian, A.; Mohd Zaki, H.F.; Bawono, A.A.; Embong, A.H. Assessing the performance of YOLOv5, YOLOv6, and YOLOv7 in road defect detection and classification: A comparative study. Bull. Electr. Eng. Inf. 2024, 13, 350–360. [Google Scholar] [CrossRef]
  40. Naga Venkata Satya Sirisha, T.S.; Venkata Sai Mada, N.; Haritha, S.; Tumuluru, P.; Rachapudi, V. Evaluating the Performance of YOLO V5 for Electronic Device Classification. In Proceedings of the 2023 Third International Conference on Artificial Intelligence and Smart Energy (ICAIS), Coimbatore, India, 2–4 February 2023. [Google Scholar]
  41. Huang, Y.; Zhao, B.; Tao, M.; Chen, Z.; Hong, W. Review of synthetic aperture radar interference suppression. J. Radars 2020, 9, 86–106. [Google Scholar]
  42. Li, Y.; Huang, D.; Xing, S.; Wang, X. A review of synthetic aperture radar jamming technique. J. Radars 2020, 9, 753–764. [Google Scholar]
  43. Wang, Y.; Wang, C.; Zhang, H.; Dong, Y.; Wei, S. A SAR dataset of ship detection for deep learning under complex backgrounds. Remote Sens. 2019, 11, 765. [Google Scholar] [CrossRef]
  44. Wang, Z.; Kang, Y.; Zeng, X.; Wang, Y.; Zhang, T.; Sun, X. SAR-AIRcraft-1.0: High-resolution SAR aircraft detection and recognition dataset. J. Radars 2023, 12, 906–922. [Google Scholar]
  45. Keydel, E.R.; Lee, S.W.; Moore, J.T. MSTAR Extended Operating Conditions: A Tutorial. In Algorithms for Synthetic Aperture Radar Imagery III; SPIE: Bellingham, WA, USA, 1996. [Google Scholar]
Figure 1. Flow chart of the construction of a multi-dimensional evaluation system for a deep learning model.
Remotesensing 16 01097 g001
Figure 2. Cyclical optimization evaluation process architecture for object detection models. This describes the process of cyclical optimization for object detection models. Initially, the model undergoes design, followed by training and testing. Feedback is established between testing and training, and then the model is subjected to an application feasibility assessment. Feedback between the application feasibility assessment and the design phase is developed.
Remotesensing 16 01097 g002
Figure 3. The construction of a multidimensional evaluation indicator system for deep learning models aimed at SAR image target detection, divided into three levels of indicators. The first-level indicators represent the three key stages of evaluation, the second-level indicators/dimensions represent the main aspects of evaluation in each stage, and the third-level indicators/dimensions represent more specific subdivisions of the main aspects of evaluation at each stage.
Remotesensing 16 01097 g003
Figure 4. Multi-dimensional performance profile diagram for deep learning object detection models.
Remotesensing 16 01097 g004
Figure 5. The detection results for three models are shown, with the first row representing interference images and the remaining rows representing the detection result images of the models, with each column representing the detection results under different interferences. (a) Dense stripe suppression, (b) equidistant stripe suppression, (c) noise suppression, (d) noise convolution modulation interference, (e) step frequency shifting interference, (f) equidistant false point target strings, and (g) highly realistic false target strings.
Remotesensing 16 01097 g005
Table 1. Construction of multi-dimensional evaluation metrics for deep learning models designed for SAR image object detection.
Level 3
Indicator
Level 4
Indicator
Indicator DefinitionIndicator Direction
Model PropertiesTraining TimeThe time elapsed from the start of training to its completionNegative
Convergence TimeThe time taken for the loss function to stabilize from its initial stateNegative
Impact of Objective FunctionLoss Reduction LevelThe measure of the extent to which the loss function decreases during the training process, calculated as a percentage relative to the initial loss valuePositive
Fitment LevelThe measurement of the model’s adaptation to the data, assessed by comparing the performance difference between the model with respect to training and testing data to evaluate whether the model accurately captures the data’s characteristics and patternsNegative
Task MetricsmAPMean average precision (mAP)Positive
Hardware Architecture DifferencesCompute ConsistencyEvaluating whether the model can maintain similar or close computational results when running on different platforms or devicesPositive
Model Response IntensityImage ThroughputThe number of images that the model can process within a unit of timePositive
Power ConsumptionThe amount of electrical energy consumed by the model when operating at full loadNegative
Compute Resource UtilizationThe proportion of computational resources (e.g., CPU, GPU, memory, etc.) occupied by the model during runtimeNegative
Model PropertiesModel SizeThe amount of storage space occupied by the model on an embedded diskNegative
Software Platform DependencyDeployment TimeThe time it takes on an embedded platform from model loading to successfully recognizing the first set of resultsNegative
Hardware Platform SupportOperator SupportThe number of supported operators by the embedded platform for the modelPositive
Differences in Deep Learning FrameworksQuantization CharacteristicsThe performance of the model after quantization operationsPositive
Table 2. Construction of multi-dimensional evaluation aspects for deep learning models used in SAR image object detection.
Tertiary DimensionQuaternary Dimension
Training Dataset SizeSample quantity
Training Dataset Contamination LevelSample quality
Interference AdaptabilityDense Stripe Suppression
Equidistant Stripe Suppression
Noise Suppression
Noise Convolution Modulation Interference
Step Frequency Shift Interference
Equidistant False Point Target Strings
Highly Realistic False Target Strings
Objective AdaptabilityTarget Occlusion
Open-set AdaptabilityUnknown Target Rejection
Table 3. The parameter settings for training.
Parameter NameModel
YOLOv3-TinyYOLOv5sYOLOv8l
Initial learning rate (Ir0)0.010.010.01
Final learning rate (Irf)0.010.010.01
Momentum0.9370.9370.937
Box loss gain0.050.057.5
Classification loss gain0.50.50.5
IoU training threshold0.20.20.2
OptimizerSGDSGDSGD
Image input size640 × 640640 × 640640 × 640
Batches161616
Epochs600600600
Table 4. Scoring of normativity at various stages.
Evaluation PhaseEvaluation Metrics/DimensionsYOLOv3-TinyYOLOv5sYOLOv8l
Training PhaseTraining Efficiency71.3865.0552.22
Training Sample Impact56.3662.3762.44
Testing PhasemAP0.5 for Model Application77.4780.4968.81
mAP0.5 for Model Tasks67.1465.5468.29
mAP0.75 for Model Application58.0464.6549.42
mAP0.75 for Model Tasks45.9544.8749.43
mAP0.5:0.95 for Model Application51.3558.1443.49
mAP0.5:0.95 for Model Tasks43.0342.3147.71
Application PhaseModel Deployment82.9985.3775.75
Model Execution52.3750.5949.82
Table 5. Training phase normativity score: This presents the normalized score of the tested target detection model during the training phase. The calculation process of this score consists of, first, calculating the weight of each indicator through the multi-indicator comprehensive evaluation method based on entropy weight and correlation scaling method proposed in this paper based on the test results. Then, the score is obtained via weighted calculation, according to the quantified scores of the expert knowledge matrix.
Primary IndicatorQuaternary
Indicator/Dimension
YOLOv3-TinyYOLOv5sYOLOv8l
Training EfficiencyTraining Time16.1313.445.37
Convergence Time15.6011.148.91
Degree of Loss Reduction18.6719.7720.37
Degree of Fit20.9820.7017.57
Total Training Efficiency Score71.3865.0552.22
Training Sample ImpactSample Quantity—Level 110.6511.6311.98
Sample Quantity—Level 211.0812.0912.25
Sample Quantity—Level 311.3612.1612.16
Sample Quality—Level 110.6511.6311.98
Sample Quality—Level 29.8410.6510.64
Sample Quality—Level 32.884.213.43
Total Training Sample Impact Score56.3662.3762.44
Table 6. Normativity score during the testing phase.
mAP0.5:0.95
ModelIndicator/
Dimension
YOLOv3-TinyYOLOv5sYOLOv8l
Normalized Score for Model ApplicationDSS4.24455.1663.9329
ESS3.7315.5253.1409
NS7.27518.33058.776
NCMI6.42027.15844.9436
SFSI9.999110.75887.849
EFPTS9.800310.55617.0468
HRFTS9.883410.64057.7967
Total Score for Model Application51.353658.135343.4859
Normalized Score for Model TasksOcclusion—Head3.98014.41734.3273
Occlusion—Middle001.6407
Occlusion—Tail3.12813.56633.6472
Small-scale Occlusion—L16.70267.33837.5092
Small-scale Occlusion—L27.78738.56528.8055
Small-scale Occlusion—L38.71619.45049.7588
Rejection Capability12.7138.974412.0165
Total Score for Model Tasks43.027242.311947.7052
Table 7. Normativity score during the testing phase.
mAP0.5mAP0.75
ModelIndicator/
Dimension
YOLOv3YOLOv5sYOLOv8lYOLOv3YOLOv5sYOLOv8l
Normalized Score for Model ApplicationDSS6.52846.72896.1384.76125.40364.13
ESS6.99258.92464.73283.64365.44423.1787
NS10.733311.040811.42169.232710.928610.8952
NCMI9.56859.81038.79776.77767.37365.4864
SFSI14.348814.532913.083311.321511.97048.9862
EFPTS15.104815.032812.287111.07711.65928.1919
HRFTS14.194714.423512.353411.230211.86818.5525
Total Score for Model Application77.471080.493868.813958.043864.647749.4209
Normalized Score for Model TasksOcclusion—Head9.63410.39739.85791.92442.02341.918
Occlusion—Middle0.00160.00160.0032001.5449
Occlusion—Tail10.751112.575712.49111.23631.34081.2945
Small-scale Occlusion—L110.807811.001210.95437.40498.19428.0173
Small-scale Occlusion—L29.45799.5899.36019.941411.07811.1506
Small-scale Occlusion—L310.990511.032910.976411.973312.726912.7772
Rejection Capability15.500910.942414.651613.47019.508812.7321
Total Score for Model Tasks67.143865.540168.294645.950444.872149.4346
Table 8. Normativity score during the application phase.
Indicators/DimensionsYOLOv3-TinyYOLOv5sYOLOv8l
Model DeploymentModel Size22.3025.0911.15
Deployment Time15.4613.5217.39
Operator Support29.0329.0329.03
Quantization Characteristics16.2017.7318.19
Total Score for Model Deployment82.9985.3775.75
Model ExecutionCompute Consistency21.4021.6721.87
Image Throughput13.037.5211.08
Power Consumption7.797.213.75
Compute Resource Utilization10.1514.1913.12
Total Score for Model Execution52.3750.5949.82
Disclaimer/Publisher’s Note: The statements, opinions and data contained in all publications are solely those of the individual author(s) and contributor(s) and not of MDPI and/or the editor(s). MDPI and/or the editor(s) disclaim responsibility for any injury to people or property resulting from any ideas, methods, instructions or products referred to in the content.

