Article

Three-Dimensional Point Cloud Object Detection Based on Feature Fusion and Enhancement

1
Key Laboratory of Intelligent Perception and Image Understanding of Ministry of Education, Joint International Research Laboratory of Intelligent Perception and Computation, International Research Center for Intelligent Perception and Computation, Collaborative Innovation Center of Quantum Information of Shaanxi Province, School of Artificial Intelligence, Xidian University, Xi’an 710071, China
2
The 54th Research Institute of China Electronics Technology Group Corporation, Shijiazhuang 050081, China
*
Author to whom correspondence should be addressed.
Remote Sens. 2024, 16(6), 1045; https://doi.org/10.3390/rs16061045
Submission received: 1 February 2024 / Revised: 4 March 2024 / Accepted: 13 March 2024 / Published: 15 March 2024
(This article belongs to the Section Urban Remote Sensing)

Abstract

:
With the continuous emergence and development of 3D sensors in recent years, it has become increasingly convenient to collect point cloud data for 3D object detection tasks, such as the field of autonomous driving. But when using these existing methods, there are two problems that cannot be ignored: (1) The bird’s eye view (BEV) is a widely used method in 3D objective detection; however, the BEV usually compresses dimensions by combined height, dimension, and channels, which makes the process of feature extraction in feature fusion more difficult. (2) Light detection and ranging (LiDAR) has a much larger effective scanning depth, which causes the sector to become sparse in deep space and the uneven distribution of point cloud data. This results in few features in the distribution of neighboring points around the key points of interest. The following is the solution proposed in this paper: (1) This paper proposes multi-scale feature fusion composed of feature maps at different levels made of Deep Layer Aggregation (DLA) and a feature fusion module for the BEV. (2) A point completion network is used to improve the prediction results by completing the feature points inside the candidate boxes in the second stage, thereby strengthening their position features. Supervised contrastive learning is applied to enhance the segmentation results, improving the discrimination capability between the foreground and background. Experiments show these new additions can achieve improvements of 2.7%, 2.4%, and 2.5%, respectively, on KITTI easy, moderate, and hard tasks. Further ablation experiments show that each addition has promising improvement over the baseline.

1. Introduction

The continuous emergence and development of 3D sensors have made it increasingly convenient to collect point cloud data in recent years. The growing interest in autonomous driving [1] and intelligent robots [2,3,4,5,6] in academia and industry emphasizes the significance of point cloud processing and 3D scene understanding. Utilizing 3D point cloud semantic segmentation technology enables accurate recognition of objects such as pedestrians, roads, and cars in natural road environments, ensuring safe operations on highways [5]. Point cloud technology in the 3D space preserves the original geometric information and has extensive applications in computer vision and robotics. The application of deep learning gains a lot of attention due to its superior performance in structured data tasks, such as classification, detection, and segmentation [7,8]. Researchers in computer vision [9,10,11,12], robotics, and other fields have recognized the potential of deep learning in analyzing and processing unstructured point cloud data.
Generally, researchers divide point cloud object detection into two major categories: regional proposals and single-shot methods, which are commonly known as two-stage and one-stage methods, respectively [1]. Presently, one-stage methods are mainly used in the industry for real-time performance. Correspondingly, two-stage methods have the advantage of high accuracy and precise regression. Two-stage methods are employed as the primary approach in numerous accuracy-oriented tasks, disregarding the speed factor. Two-stage methods have evolved into a well-established system within point cloud object detection methods.
In two-stage methods, multi-view strategies are traditional 3D information processing methods. Multi-view strategies mix feature information from various view models, such as the LiDAR view and bird’s eye view (BEV) [5,13,14], to generate 3D rotated bounding boxes. On the one hand, performing fusion prior to inference is an obvious method, like AVOD [2]; on the other hand, fusing multiple models can effectively separate a single mode to reduce computing costs. Qi et al. [15] designed a scheme that applies 2D object detection to point cloud space. Liang et al. [16] show that a neural network can hierarchically mix various models to transform models easily in each layer, which leads to a new fusion. Recently, researchers have been exploring new forms of data. Based on the different data utilization methods, point cloud-based technology can be categorized into three main types: projection-based, voxel-based, and non-fusion point cloud data. Projection-based methods project point cloud data into images, such as bird’s-eye-view projection (BEV), and encode them to form 3D candidate boxes [5,13,17,18]. Encoding methods may be different, but they all share the common objective of minimizing the impact of messages in data. Voxel-based convolution is a method of displaying objects or environments in the form of a 3D grid or voxel, which can clearly present the shape information of objects as each voxel has unique properties, such as binary occupancy or continuous point density. VoxelNet [10] is the most classic voxel method. Vote3Deep [6] employs an innovative sparse convolution [19,20] operator to generate convolution layers through feature-based voting. This approach significantly reduces the computational burden of 3D data models, simplifies the computation process, and enhances efficiency. PointNet [21,22] and PointNet++ [23] are representative methods that directly use the original cloud data.
Segmentation-based methods are common measures with two stages to efficiently eliminate background points and generate high-quality proposals, consequently reducing computational expenses. Compared with traditional multi-view technologies [2,21,24], segmentation-based technology can more effectively capture complex scenes, especially in enclosed environments with crowded objects. PointPainting [25] projects LIDAR points onto the output of an image semantic segmentation network and assigns classification scores to each point. PointRCNN [26] primarily leverages the PointNet++ network for foreground–background segmentation, thereby enhancing the detection efficiency.
One-stage methods can be divided directly by the type of input data of the BEV view or point cloud. PIXOR [27] can print input data on point data under the same scale. PIXOR is widely used in various overlooking scenes by decoding reflections to summarize a set of regular calculations of input data. SECOND [28] extends VoxelNet by using sparse convolution to reduce the amount of calculation. Recently, researchers have proposed many mixed methods and achieved profound results: VoteNet [29] combines vote and point cloud object detection; ImVoteNet [30] extracts 2D and 3D feature information to vote better; and Part- A 2 [31] combines voxel convolution and semantic segmentation.
The past two years have witnessed the emergence of hybrid methodologies and innovative approaches. In 2019, Qi et al. introduced VoteNet [30], a novel approach that synergizes traditional voting mechanisms with point cloud detection. This method is designed to generate 3D candidate bounding boxes of a superior quality, significantly enhancing the effectiveness of voting for virtual centroid points of objects within point clouds. Building upon this, in 2020, a groundbreaking voting pipeline named ImVoteNet [32] was proposed. This pipeline ingeniously merges 2D object detection cues with 3D voting mechanisms, aiming to substantially improve the efficiency and accuracy of the voting process.
Based on the above introduction, it is evident that there are still several problems in point cloud detection, particularly in the following aspects. Compressing the dimensions of point clouds into the bird’s eye view (BEV) is a commonly used method to save computational costs. However, this dimension reduction makes it more difficult to extract spatial and semantic features from point clouds. Extracting the required features from the BEV and effectively fusing features at different scales presents challenges. Point clouds consist of discrete points, making it difficult to form significant features when dealing with small objects like pedestrians. Additionally, as the scanning process goes deeper into the point cloud data, the laser beams become increasingly sparse, leading to a lower density of points in distant areas. This introduces a challenge similar to that encountered with small objects. Furthermore, due to the directional nature of the laser emission source, the distribution of captured points in areas facing towards and away from the source is uneven. These defects are illustrated in Figure 1, where (a) and (b) demonstrate the uneven distribution of object surface point clouds due to the scanning direction and angle, resulting in an incomplete representation. Figure 1c represents the sparsity of points in areas with greater depth.
We have further enhanced the baseline neural network architecture, which primarily comprises spatial–semantic feature aggregation (SSFA), supervised contrastive learning (SCL), and a point completion network (PCN). This improvement targets the prevailing technical challenges and aims to diminish the issues previously mentioned. Our specific focus is on the deep integration of spatial and semantic features, along with the fusion of both shallow and deep features within the backbone network. Such integration is designed to overcome the complex feature-related challenges introduced by bird’s eye view (BEV) representations. Furthermore, we have developed a specialized module, positioned subsequent to the multi-heads, that concentrates more effectively on sparse and unevenly distributed points.
The primary content of this dissertation is structured as follows:
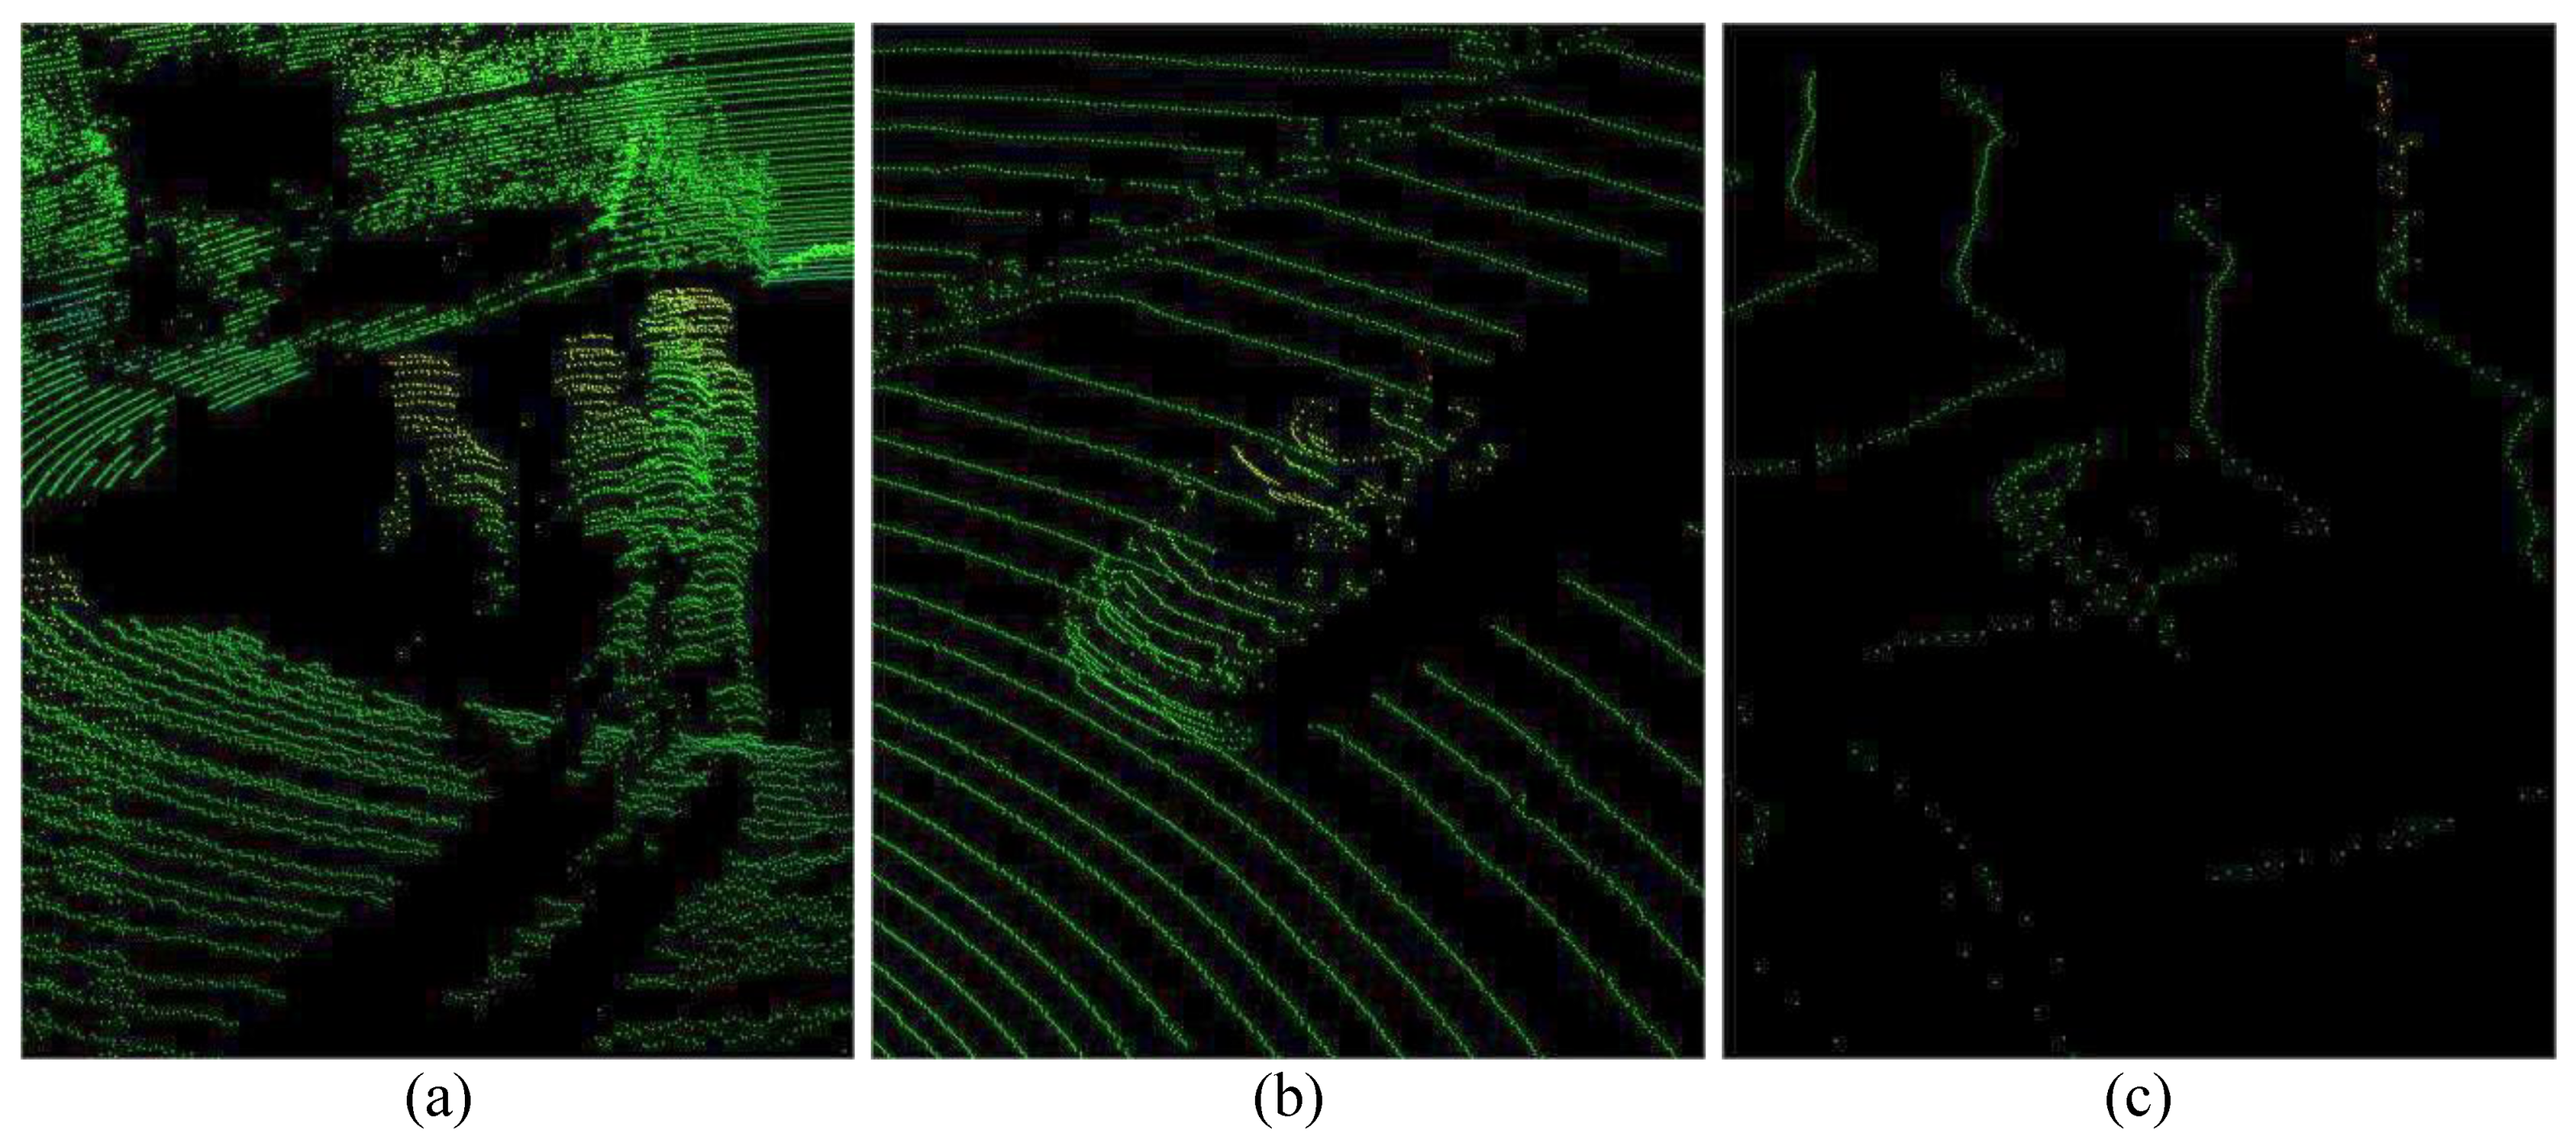
  • In Section 1, we delve into the current state of research in 3D point cloud object detection, identifying key challenges in the field. One notable issue is the difficulty of feature extraction when using bird’s eye view representations. Furthermore, we discuss the limitations posed by the uneven data distribution in point clouds, exacerbated by the significant scanning depth of light detection and ranging (LiDAR) technology. This leads to sparser data in deeper space sectors, challenging the effectiveness of existing detection methods.
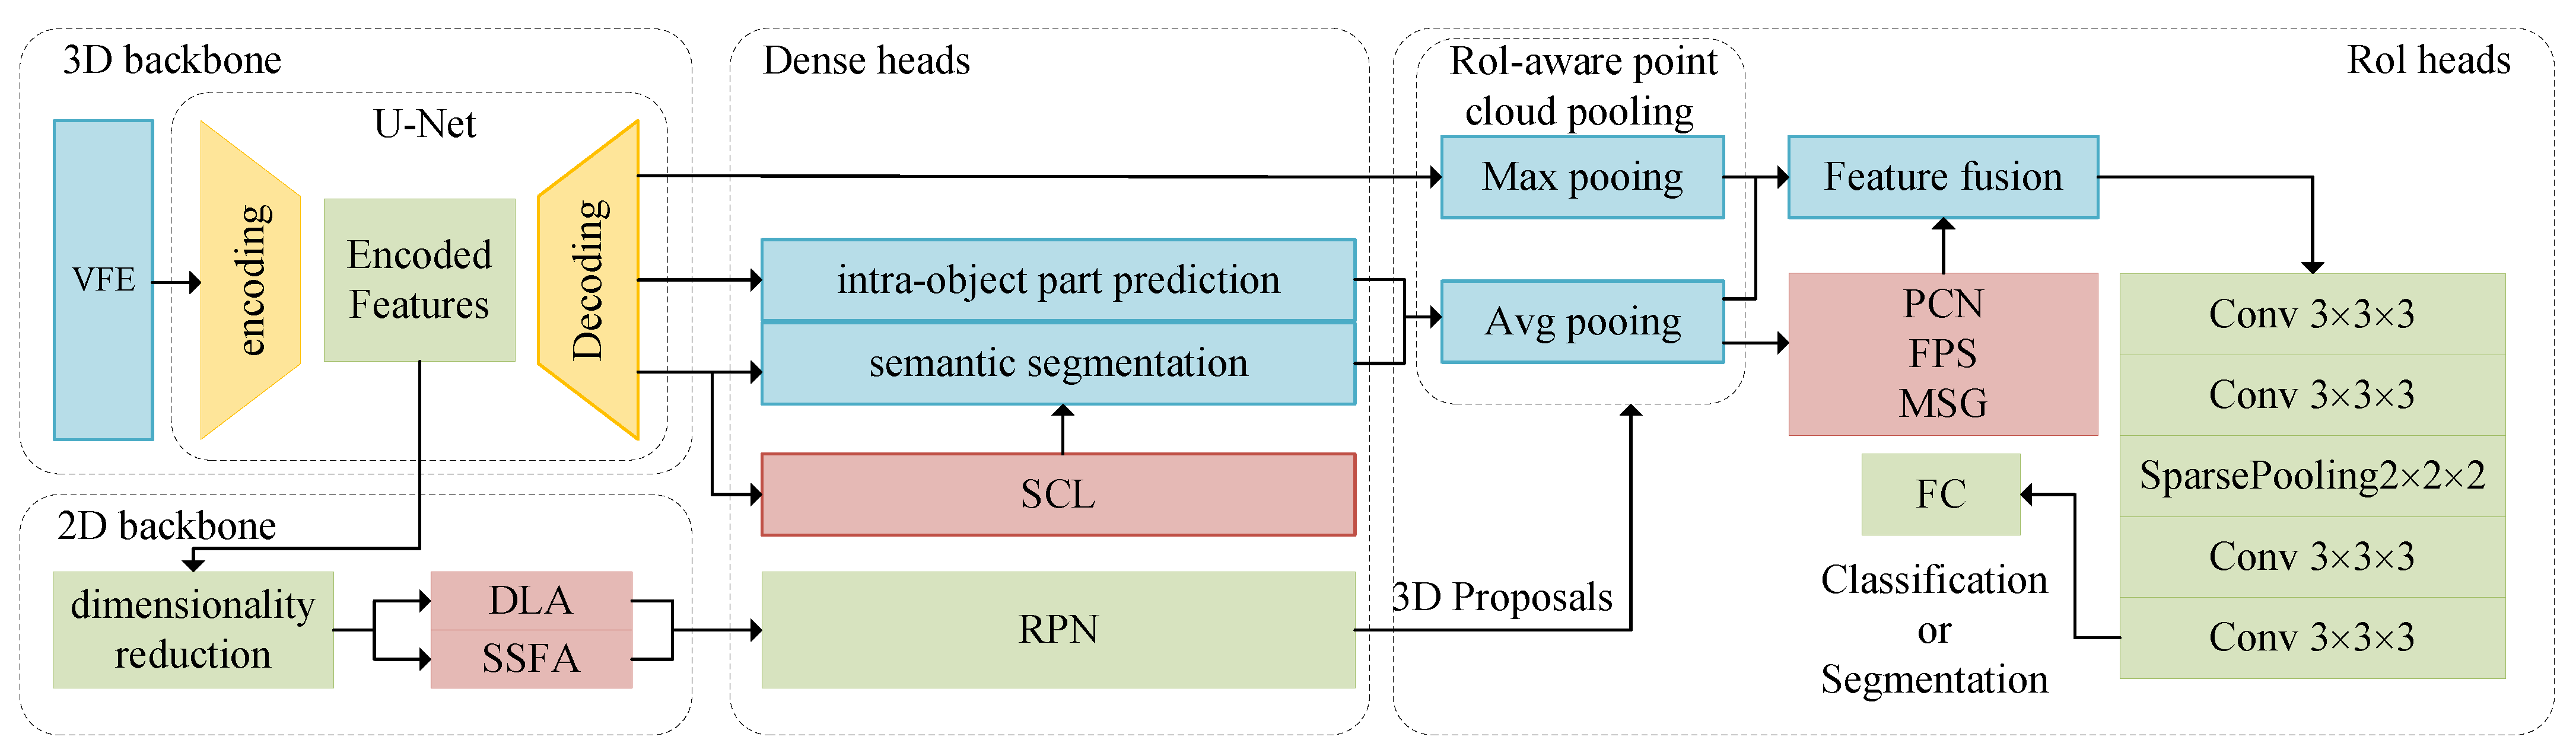
  • Section 2 provides a comprehensive overview of our proposed network. We introduce a detailed schematic of the network structure, focusing on its innovative components: the SSFA, SCL, and PCN modules. Each element is meticulously described, illustrating its specific role and contribution to enhancing the network’s performance in 3D object detection tasks.
  • In Section 3, we present the experimental framework, outcomes, and a detailed analysis of our research. The KITTI dataset serves as the primary basis for our experimentation. We conduct extensive comparative and ablation studies to validate the feasibility and effectiveness of our proposed model. Through these methodologies, our objective is to elucidate the capabilities of the model and explore its applicability in practical, real-world environments.

2. Method

2.1. Architecture

The overall framework is depicted in Figure 2. The red parts are the modules we proposed in the network. The algorithm’s entire process is primarily divided into the following steps. Firstly, a 3D backbone network is constructed using VFE and U-Net to generate voxel features. Subsequently, these feature data are split into two branches. On one hand, they are fed into the Point Head for semantic segmentation and internal location prediction. During semantic segmentation, an additional branch randomly samples 32,000 voxel points, extracting 256 positive and 256 negative samples, which are then utilized for supervised contrastive learning. The loss function associated with this process is combined with the segmentation loss function.
On the other hand, after applying a bird’s eye view (BEV) transformation to the voxel features, they are input into a 2D backbone network [33]. This step encompasses BEV feature extraction through spatial–semantic feature aggregation and the fusion of spatial and semantic features. Subsequently, the extracted two-dimensional features are directed into the Region Proposal Network (RPN) to generate candidate boxes and advance to the second stage.
In the second stage, following RoI-aware pooling, the internal location predictions from the Point Head undergo PCN point completion, followed by Farthest Point Sampling (FPS) and Multi-Scale Grouping (MSG). These predictions are then fused with other features and fed into a fully connected network for classification and regression operations, as depicted in Figure 2. It is noteworthy that since this module is used to enhance auxiliary features and the encoding format is in a voxel form, fine-grained results are not necessary. Instead, coarse-grained outcomes are directly outputted, which also contributes to conserving computational resources.

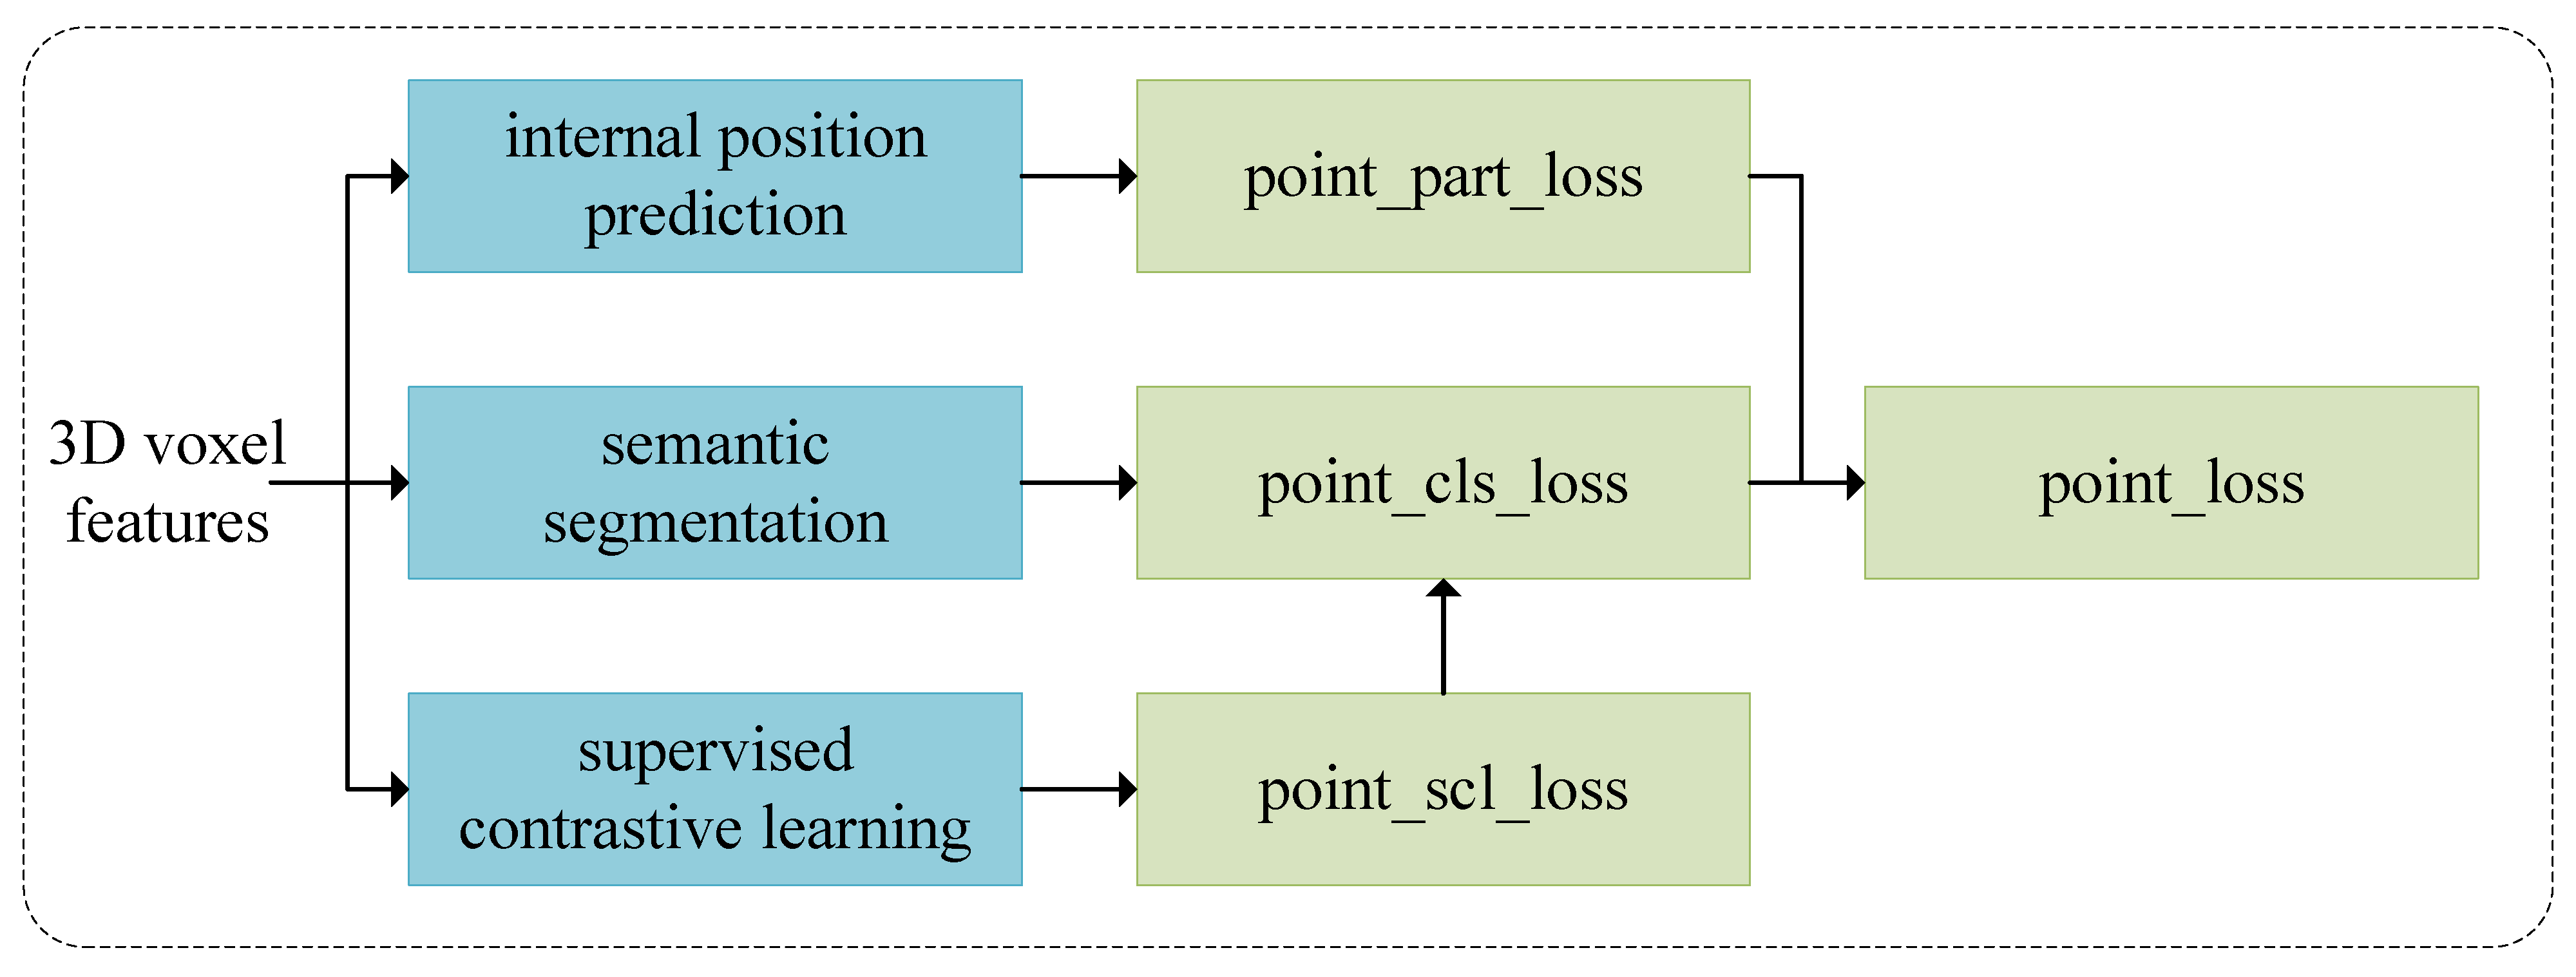
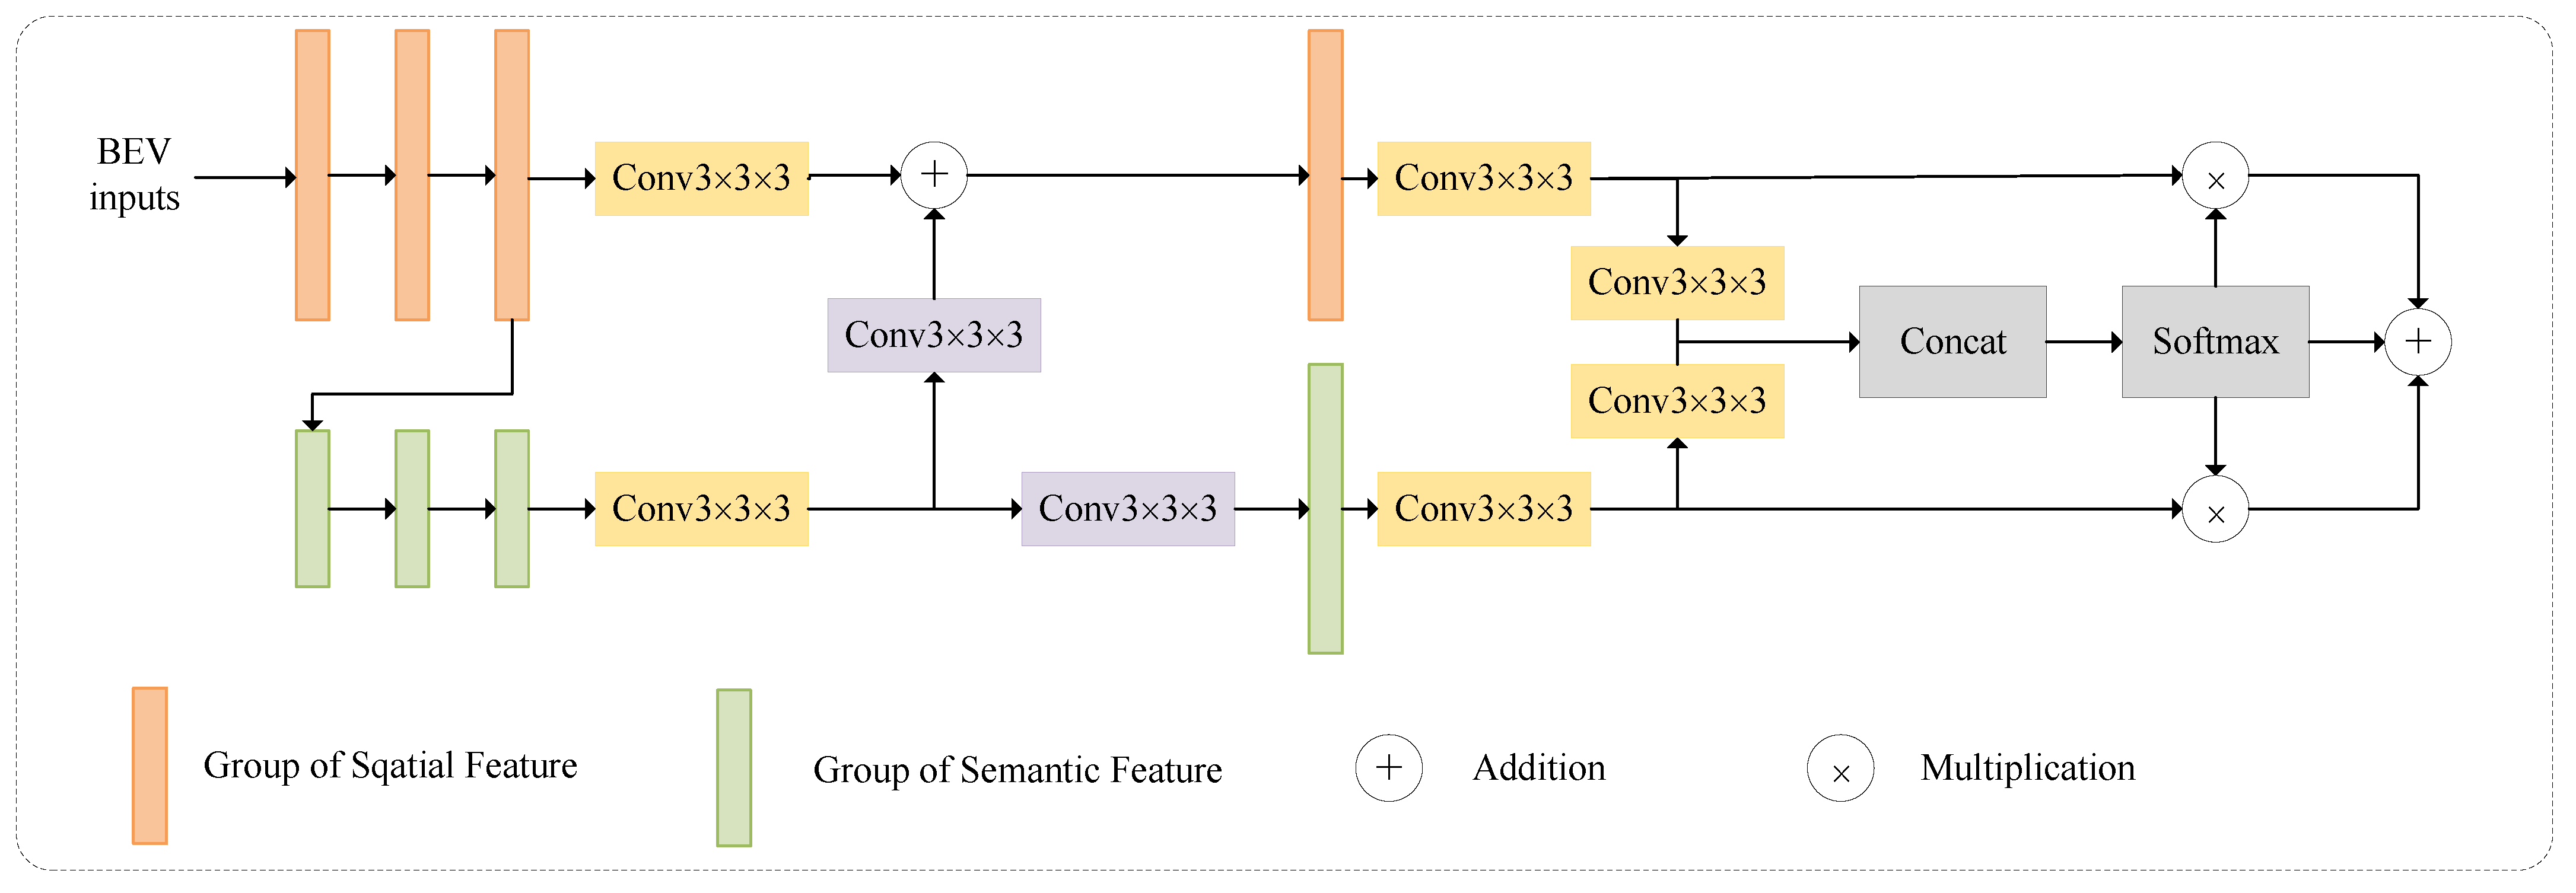
2.2. Spatial–Semantic Feature Aggregation

The SSFA [34] technique excels at adaptively combining abstract deep-layer features with shallow spatial features. After compression though the BEV, the fusion of depth and channel features results in difficulty in extracting spatial and semantic features. And it is also important to consider how to better extract low-level spatial features and high-level abstract semantic features from BEV images and effectively integrate them. Through this method, we can predict bounding boxes and classification confidence more accurately. Specifically, the dimension of the spatial features remains consistent with the input to avoid a loss of spatial feature information. With the convolution neural networks, spatial features can be a guide to reduce the height and width by half while doubling the number of channels. This process is repeatedly carried out to refine the feature representation. Following this, two distinct deconvolution processes are employed to regain dimensions comparable to the original spatial features. The networks then leverage additional convolution and concatenation operations, facilitating a deeper integration and fusion of the extracted features. This approach underscores the intricate balance between dimensionality reduction and feature integration for effective feature representation in neural network architectures.
As depicted in Figure 3, the process of feature fusion involves a series of steps. Initially, the channels of each feature are condensed into a single channel, followed by the compressed results. Subsequently, this combined output undergoes normalization with the softmax function. These normalized data are then partitioned into two distinct BEV attention maps. In the final stage, these BEV attention maps serve as the weighting mechanism for each feature. The features, once weighted, are aggregated, culminating in the effective fusion of semantic and spatial features. This methodology underscores the intricate process of integrating diverse feature sets to enhance the representational capacity of the neural network in interpreting both semantic and spatial dimensions.

2.3. Supervised Contrastive Learning for Semantic Segmentation

In autonomous driving contexts, 3D objects are segmented by annotated 3D bounding boxes, which clearly delineate the object’s location and dimensions while offering semantic masks that provide critical information about the point distribution within these 3D objects. This suggests that the relative position of each foreground point is determined by its proximity to the centroid of its respective bounding box. Addressing this, under the 3D ground truth bounding box supervision, a semantic segmentation network is integrated into the heads in the Part- A 2 framwork. This integration aims to enhance the prediction of precise internal positional data of detected objects.
When dealing with discrete point clouds, particularly in representing small objects like pedestrians, features are not prominent. This issue is particularly evident in the context of LiDAR data used in autonomous driving and other applications. As the depth from the LiDAR sensor increases, the density of the laser-emitted fan-shaped scan area decreases, resulting in a sparser distribution of data points. This phenomenon is more pronounced at deep distances, where the number of points representing distant objects significantly diminishes. Furthermore, the inconsistency in point distribution is exacerbated by the orientation and directionality of the LiDAR emission source, leading to non-uniform point coverage on the surfaces of the detected objects. Such uneven distribution poses challenges in accurately representing and interpreting these objects in 3D space. These issues are illustrated in Figure 1. Panels (a) and (b) demonstrate the uneven distribution of point clouds on object surfaces due to scanning directions and angles, resulting in incomplete object representations. Panel (c) highlights the problem of point sparsity in areas with a greater depth, leading to a similarly incomplete representation.
In scenarios where point clouds exhibit inherent limitations, such as a sparse or uneven distribution of target points leading to inadequate feature distinction, enhanced supervision methods [35] can be adopted to refine semantic segmentation. This approach not only enhances the quality of segmentation but also enables a more precise localization of the internal centers of foreground points. Furthermore, the attributes of contrastive learning render it particularly effective for binary semantic segmentation tasks. This method works by minimizing the distance to positive samples and maximizing the distance to negative samples, thereby improving the discrimination of the segmentation model. The inherent segmentation properties of point cloud labels offer an opportunity for self-supervised learning. This leverages the intrinsic characteristics of the data for improved segmentation accuracy, especially in challenging environments where traditional methods might fall short. Therefore, the SCL method would be introduced during image segmentation, which is shown in the red box in the upper right corner of Figure 2. SCL is shown in Figure 4.
In the proposed approach, we enhance the effectiveness of semantic segmentation by augmenting the conventional classification loss with a supervised contrastive loss. This additional loss component is designed to refine the segmentation process by improving the differentiation capabilities of the model. The integration of supervised contrastive loss operates in tandem with the traditional classification loss, collectively contributing to a more robust and accurate segmentation outcome. The formulation of this combined loss function is delineated as follows [36]:
L o u t s u p = i I L o u t , i s u p = i I 1 | P ( i ) | p P ( i ) l o g e x p ( z i · z p / τ ) a A ( i ) e x p ( z i · z p / τ )
Here, for every sample i, P ( i ) is the set of its positive samples, | P ( i ) | is the number of positive samples, p is one of the positive samples, A ( i ) is the set of negative samples, a is one of the negative samples, and τ is a hyperparameter about temperature.

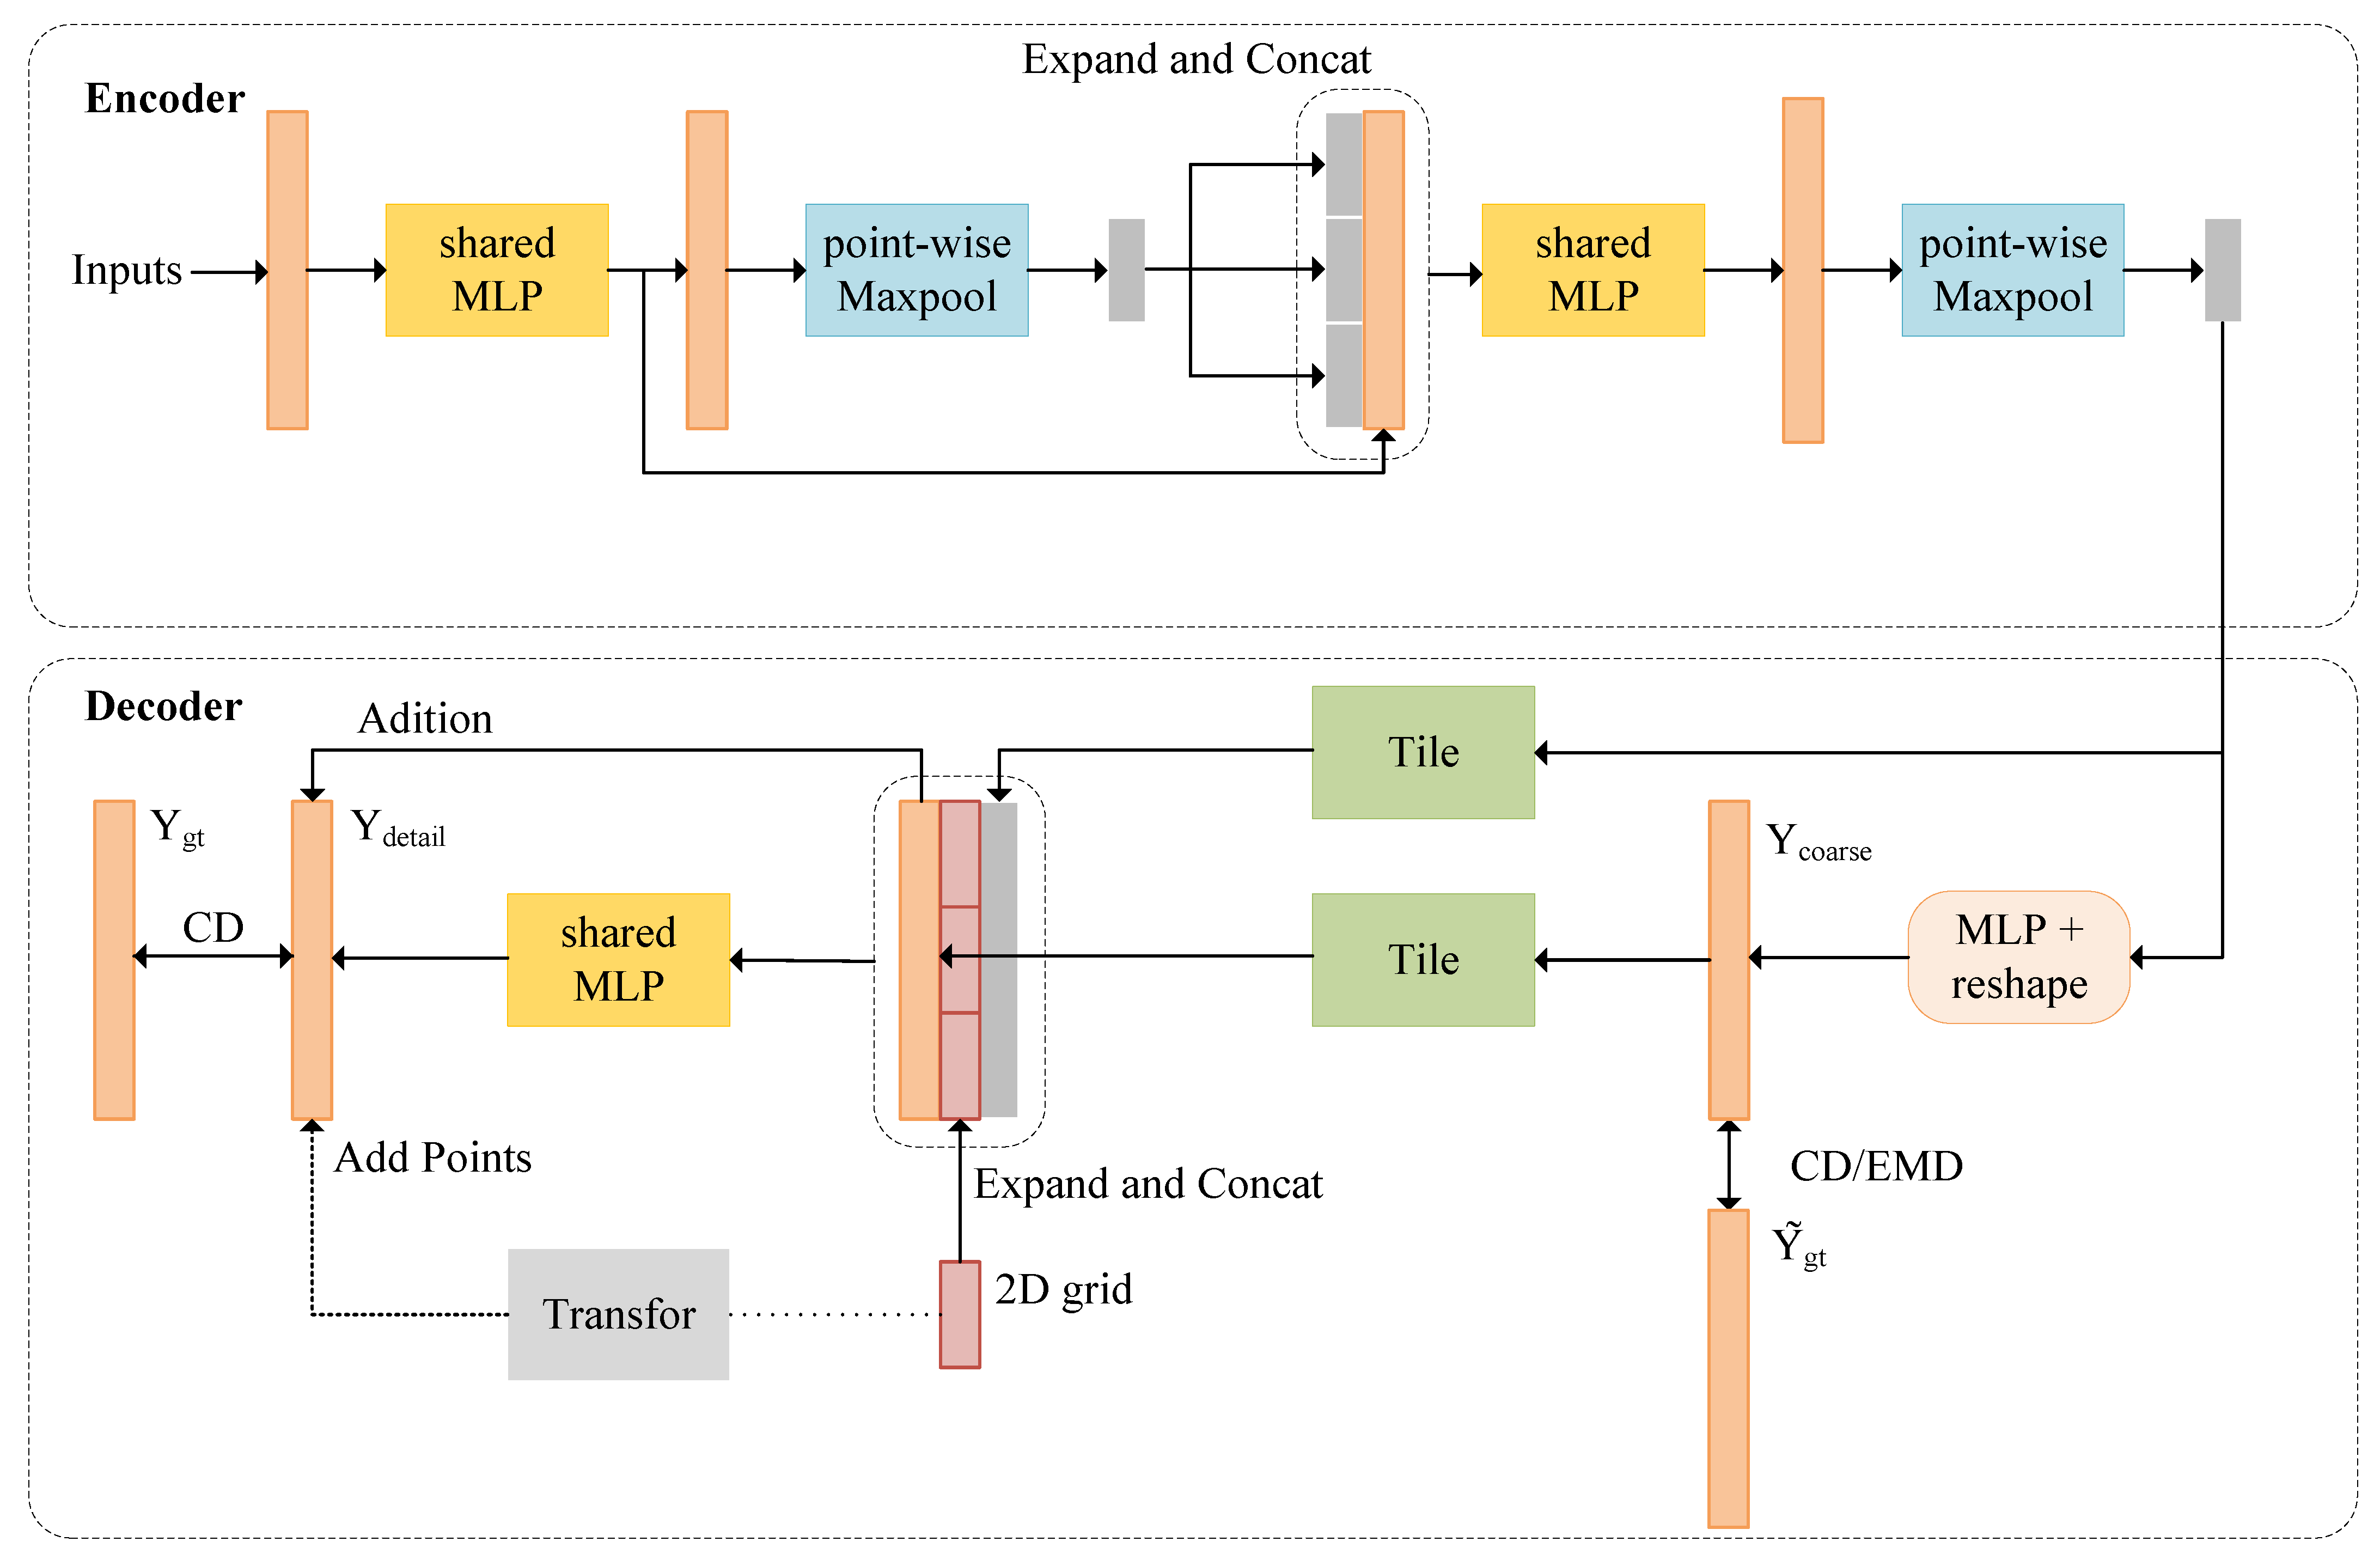
2.4. Point Completion Network

In light of the challenges identified in the preceding section, specifically the uneven distribution and sparsity of target points within point cloud data, we introduce a novel deep learning-based solution aimed at rectifying these data deficiencies. This solution involves the deployment of an encoder–decoder network architecture that facilitates the direct transformation of incomplete point clouds into their completed forms. This process is realized through the implementation of the PCN [37], a specialized network designed initially for the direct processing and completion of point cloud data. This paper extends the functionality of the PCN beyond its original scope, enabling completion at the voxel level. This advancement represents a significant enhancement in the network’s capability to reconstruct detailed and comprehensive point cloud data from partial inputs. The methodology and workflow of the original point cloud network, as applied in this context, are illustrated in Figure 5. This figure provides a visual representation of the network’s process, from the initial input of incomplete point cloud data to the final output of a fully realized point cloud.
The point completion network (PCN) is structured as an encoder–decoder network, designed to process point cloud data. In this architecture, the encoder intakes a point cloud, denoted as X, and maps it to a k-dimensional feature vector. Subsequently, the decoder takes this k-dimensional feature vector and reconstructs coarse ( Y c o u r s e ) and fine ( Y d e t a i l ) granularity types of point clouds. The network’s training is governed by a loss function, which quantifies the deviation between a benchmark point cloud and the encoder’s output. This is then utilized for network optimization via backpropagation. A distinctive aspect of the PCN, setting it apart from traditional autoencoders, is its lack of compulsion to preserve input points in its output. Contrarily, the PCN is engineered to learn a transformational projection from a space characterized by local observations to a space encapsulating complete shape representations. The formulation of the loss function, which is integral to this learning process, is articulated as follows:
l ( Y c o u r s e , Y d e t a i l , Y g t ) = d 1 ( Y c o u r s e , Y ˜ g t ) + α × d 2 ( Y d e t a i l , Y g t )
Here d 1 and d 2 are the functions to measure the distance of output Y c o u r s e , Y d e t a i l , which are balanced by α . The point completion network is utilized as an auxiliary module in the model, rather than as the main backbone. Placed after the global pooling step, the module is oriented more towards the extraction of global features than local ones. It is also important to note that the computational cost of fine-grained features is a non-negligible factor. Hence, the weighting factor α is set to a lower value in practical implementation.

3. Experimental Setup and Results Analysis

3.1. KITTI Dataset Introduction

In this research, we aim to evaluate the efficacy of our proposed algorithm in the context of point cloud detection. The KITTI dataset, renowned for its extensive use and prominence in the autonomous driving domain, is chosen for our experimental analysis. KITTI is a real-image dataset, which covers a variety of scenes, including urban, rural, and highway scenes, featuring images with up to 15 vehicles and 30 pedestrians, alongside varied depth occlusions and truncations. The dataset encompasses 389 stereo images and optical flow maps, 39.2 km of visual odometry sequences, and over 200,000 3D annotated objects [38], all captured at a 10 Hz sampling rate and synchronized. Classified primarily into categories like ‘road’, ‘city’, ‘residential’, ‘campus’, and ‘person’, the dataset is further detailed for 3D object detection with labels for cars, vans, trucks, pedestrians (including sitting), cyclists, trams, and miscellaneous. The KITTI dataset offers a comprehensive platform for testing in realistic autonomous driving scenarios. Our study primarily focuses on the detection of three key object categories prevalent in most point cloud datasets within the realm of autonomous driving: cars, cyclists, and pedestrians. This selective approach aligns with the typical object detection tasks encountered in autonomous driving road scenarios and provides a focused framework for assessing the algorithm’s performance in detecting these specific object types.
The training and test files of the KITTI dataset primarily comprise four components: two-dimensional RGB image files (image), three-dimensional point cloud binary files (velodyne), camera calibration matrix files (calib), and label files (label). Figure 6a showcases an example of a two-dimensional RGB image file from the KITTI dataset. Figure 6b,c illustrate the visualization of the three-dimensional point cloud binary file, which corresponds to the RGB image above. The visualization includes (b) the point cloud from an oblique angle and (c) a visualization from another perspective.
The training and test files in the dataset consist of 7481 image samples in the train file and 7518 image samples in the test file. However, due to reasons such as missing labels in the test file, this paper follows the official random division method, dividing the files in train into 3712 training sets and 3769 test sets. The experimental accuracy of this paper will be tested on the test set.

3.2. Evaluation Metrics

In the realm of point cloud detection, the integration of RGB images, RGB-D depth images, and laser-generated point clouds facilitates the classification of objects along with the determination of their dimensions (length, width, height) and rotational angles in a three-dimensional context. The model’s accuracy is quantifiably assessed by constructing a confusion matrix based on a binary classification system that delineates the accuracy and errors in inspecting specific item types. This approach employs several key technical indicators, such as the precision–recall curve for qualitative accuracy analysis and the average precision (AP) metric for a quantitative assessment, as per reference [39]. Furthermore, Average Orientation Similarity (AOS) serves as a crucial indicator in the orientation detection of objects, comparing detection results with the ground truth.
Point cloud detection accuracy is typically categorized into four distinct classes, with the ‘3D’ category being prevalently utilized due to its comprehensive reflection of the detection box’s accuracy. These categories include the following:
  • bbox—accuracy of the 2D detection box;
  • BEV—accuracy within the bird’s eye view (BEV) perspective;
  • Three-dimensional—accuracy of the 3D detection box;
  • AOS—accuracy in detecting the target’s rotational angle.
Additionally, the detection framework evaluates the average precision (AP) of each category under varying degrees of difficulty (easy, moderate, and hard), based on factors such as occlusion levels of the annotated bounding boxes, for instance, the car AP @0.7 0.7 0.7 metric, where AP denotes the average precision and 0.7 specifies the minimum Intersection over Union (IoU) threshold.
The IoU is a pivotal metric for gauging the overlap extent between two areas. The model is deemed accurate in target detection when the IoU exceeds certain thresholds (0.3 or 0.5), and below these thresholds, targets are classified as invalid. Precision and recall are crucial in this context, with the former indicating the proportion of relevant items retrieved and the latter representing the proportion of relevant items that are actually detected. The computation of the AP is intrinsically linked to these metrics, averaging the precision values across the precision–recall curve.
In recent developments, the KITTI leaderboard has transitioned to an 11-point Interpolated Average Precision (IAP) format (AP|R11), where R11 ranges from 0 to 1 in increments of 0.1. However, this approach, which includes a value of 0, can artificially inflate the average precision by approximately 9%. To counteract this and provide a more authentic performance assessment, a new 40-point IAP (AP|R40) has been introduced, adjusting the metric and leaderboard by excluding the value of 0 and reducing dense interpolation predictions fourfold. This results in a more rigorous and accurate evaluation of detection capabilities. The R40 scale extends from 1/40 to 1, and the formula for calculating AP precision under this scale is as follows:
A P | R N = 1 N r R N m a x r ˜ r ρ ( r ˜ )
where ρ ( r ) is the recall accuracy. For experiments of point cloud detection on the KITTI dataset, A P | R 40 is used as the evaluation metric to assess the performance of the proposed method.

3.3. Experimental Setup

The experimental setup detailed in this paper is carried out in an environment as delineated in Table 1, comprising specific software and hardware configurations. The programming language adopted for the experiments is Python, utilizing the open-source Pytorch library as the foundational framework. The network model is developed on the OpenPCDet platform, a specialized framework for 3D detection tasks.
In terms of model training parameters, the batch size is configured to be 2 and the total number of training epochs to 40. The optimization algorithm selected for this study is adam_onecycle, accompanied by a weight decay setting of 0.01 and a momentum parameter of 0.9. The loss functions implemented were binary cross-entropy loss and SmoothL1 loss. The SCL loss is initially weighted at 0.1, significantly higher compared to the semantic segmentation loss. To address this, an epoch-based weight decay mechanism is applied, progressively reducing the SCL loss weight to 0.01. The learning rate for the model training is established at 0.01. In the dual-stage process involving the tasks of classification, regression, and angle loss calculation, a uniform weight of 1.0 is assigned to each component.
This configuration underscores a comprehensive approach to model training, balancing the intricacies of loss function weighting with the overarching goals of the experiment. The selection of Python and Pytorch, along with the utilization of OpenPCDet, demonstrates a commitment to leveraging advanced and open-source technologies for enhancing the efficacy and precision of 3D object detection models.

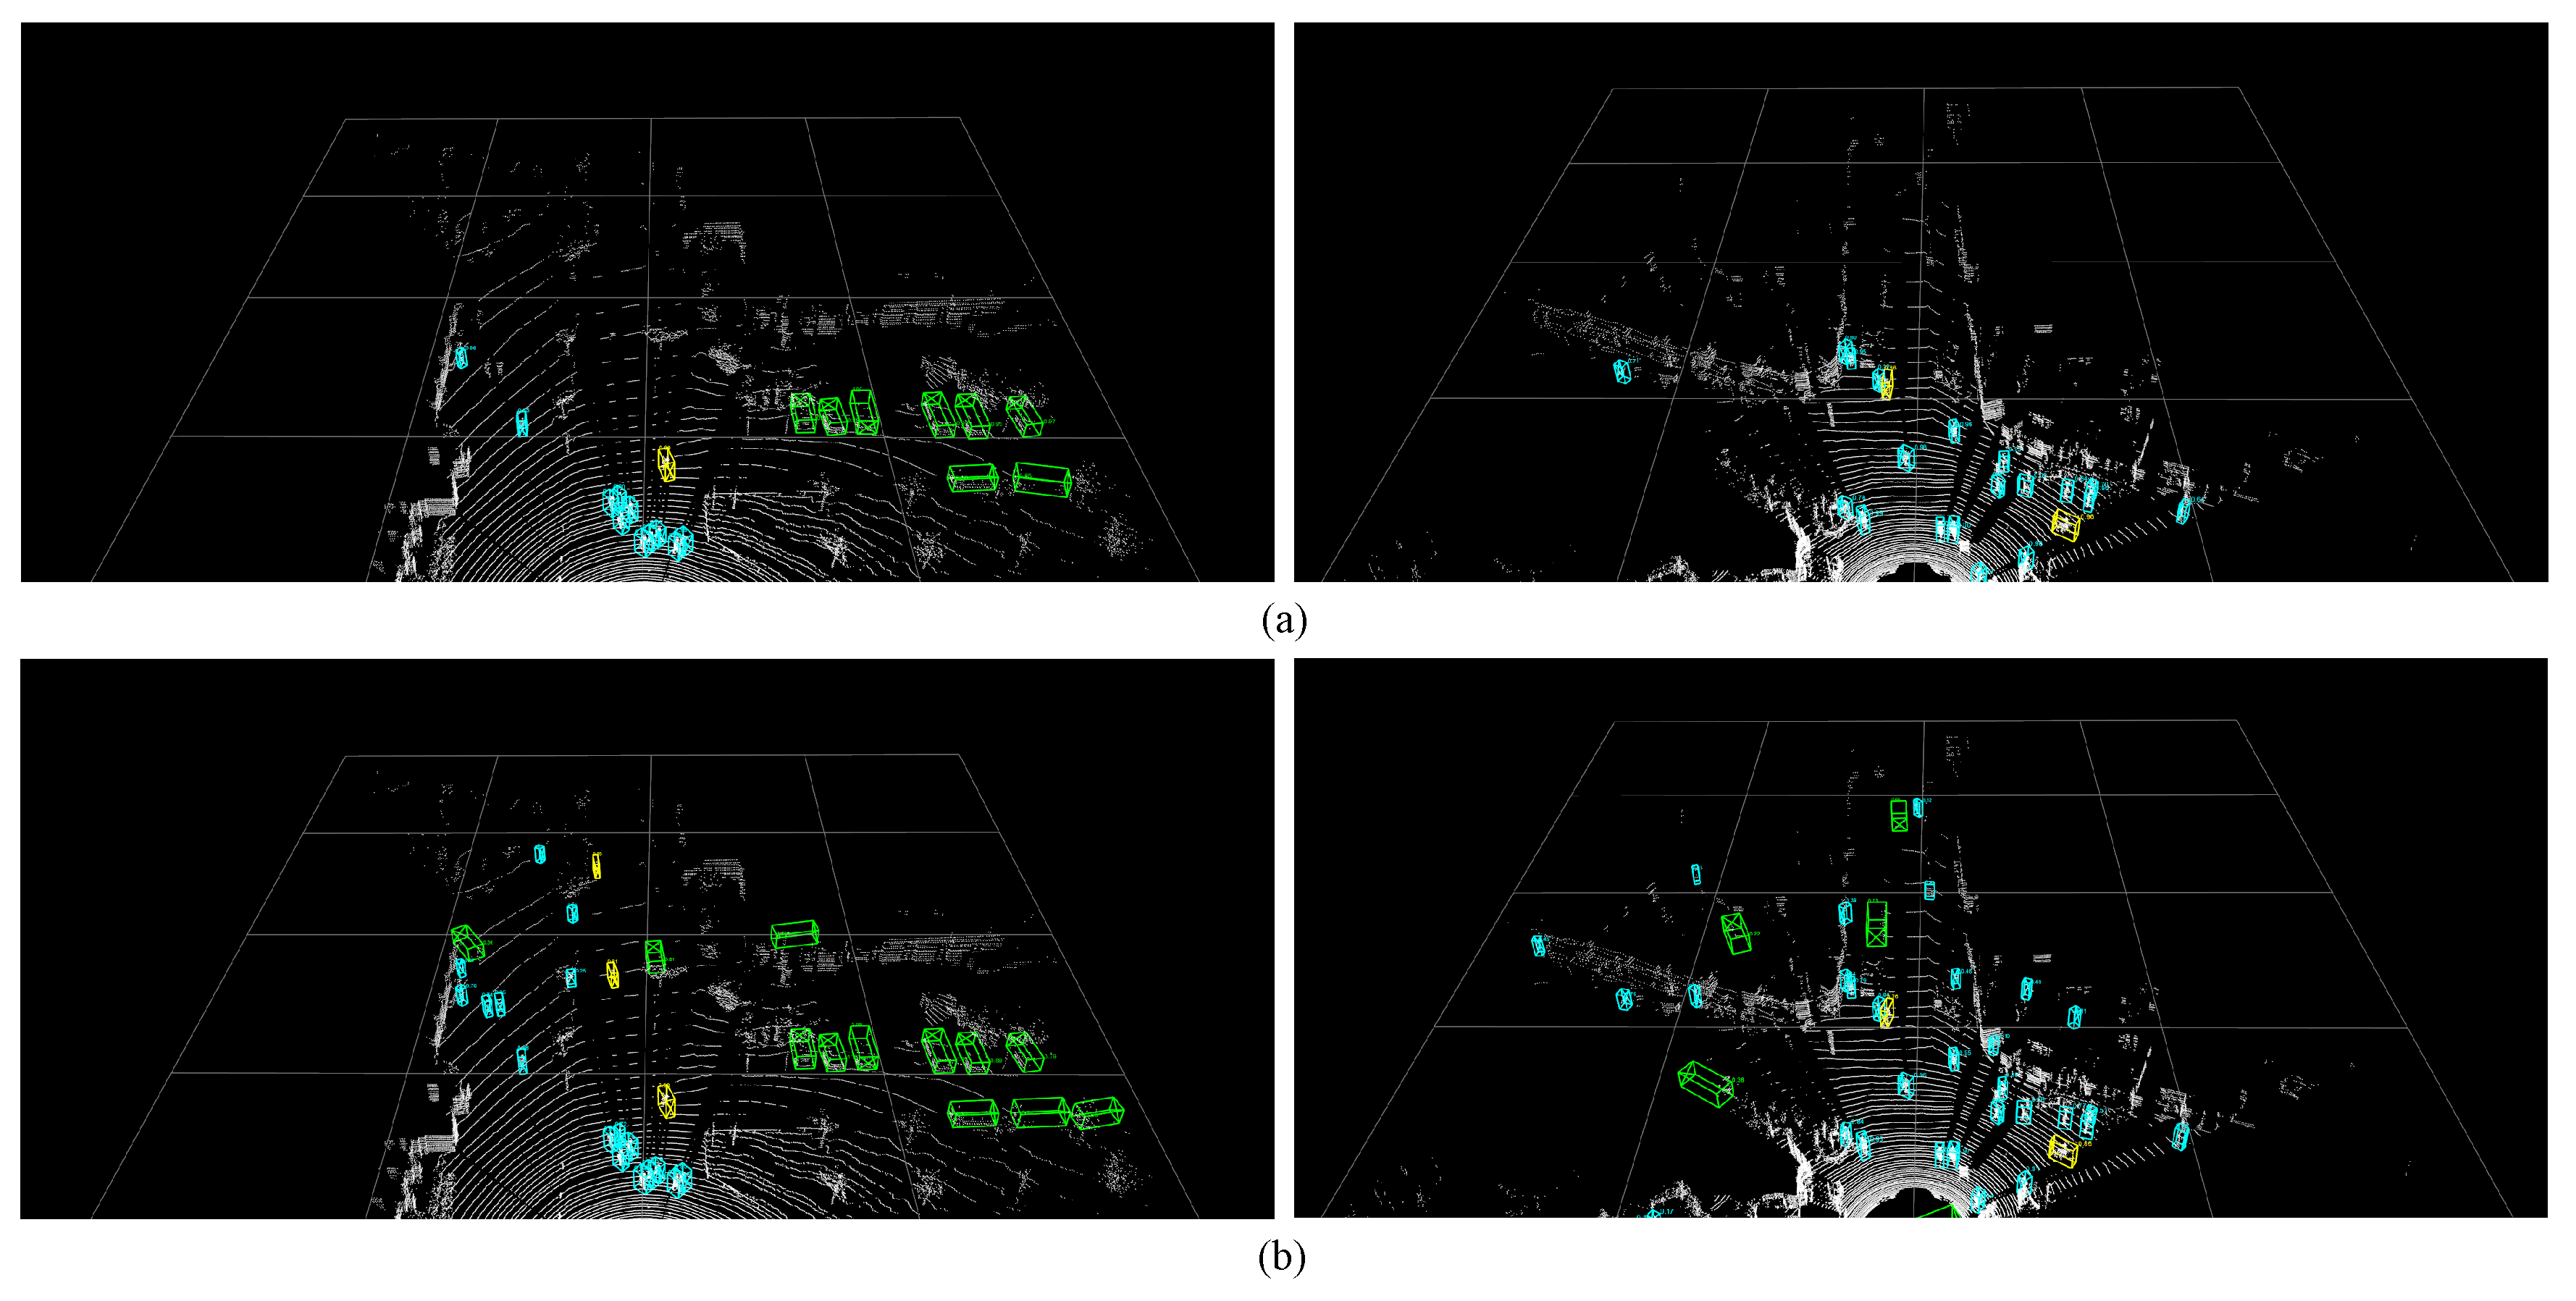
3.4. Experimental Results

In this study, we have conducted a comprehensive analysis of multiple esteemed point cloud detection algorithms, utilizing the KITTI dataset for benchmarking. Our focus is on evaluating the algorithms based on AP|R40 criteria across three levels of target difficulties, with specific attention on their 3D assessment metrics. The findings of these evaluations are meticulously documented in Table 2 and Table 3. Table 2 presents the experimental results of AP40% under different categories, while Table 3 shows the performance across various classification difficulties within the KITTI dataset. Table 4 provides an overview of an ablation study conducted to verify the feasibility of the various modules added. In order to validate the efficacy of the enhanced model integrating spatial semantic feature fusion and auxiliary features, as proposed in this study, we engaged multiple classical point cloud detection algorithms for model training. Subsequently, the algorithm developed in this study was subjected to rigorous testing and comparative experiments on the KITTI dataset.
A portion of the experimental results is illustrated in Figure 7. Figure 7a shows the schematic diagram of the baseline Part- A 2 results, while Figure 7b presents the schematic diagram of the results of our module, including SSFA, SCL, and the PCN. In these figures, vehicle detections are denoted by green boxes, bicycle detections by yellow boxes, and pedestrian detections by blue boxes.

3.5. Results Analysis

Table 2 presents the evaluation results of different methods on the KITTI dataset regarding category mean accuracy under different difficulty levels. The proposed enhanced model based on spatial semantic feature fusion and auxiliary features shows a better performance in terms of category mean accuracy across different difficulty levels, demonstrating its stronger generalization ability in the two-stage 3D detection task. The results in both tables indicate that the proposed algorithm outperforms the baseline algorithm Part- A 2 in terms of overall performance and efficiency, further validating the effectiveness of the proposed method. Notably, our method demonstrates the capability to effectively detect objects in challenging scenarios characterized by sparse point clouds and areas with point cloud deficiencies, especially in remote or distant regions, which is shown in Figure 7. This illustrates the robustness and adaptability of the algorithm in handling diverse and complex detection environments. This adaptability is particularly significant in scenarios where point clouds are less dense or incomplete, as is often the case in remote sensing and autonomous driving contexts. The ability of the proposed method to maintain detection accuracy under these conditions is a testament to the effectiveness of the spatial semantic feature fusion and auxiliary feature enhancement techniques employed.
Table 3 presents the evaluation results of different methods on the KITTI dataset regarding category mean accuracy under different difficulty levels. An in-depth analysis of the results presented in Table 3 reveals that the model we proposed, centered around spatial–semantic feature fusion and auxiliary feature enhancements, excels in its average performance across various categories and levels of difficulty. The proposed enhanced model based on spatial semantic feature fusion and auxiliary features shows a better performance in terms of category mean accuracy across different difficulty levels, demonstrating its stronger generalization ability in the two-stage 3D detection task. The results shown in both tables confirm that the proposed algorithm exceeds the performance of the baseline algorithm Part- A 2 in overall terms, further validating the effectiveness of the proposed method. The results, as showcased in Figure 7, not only demonstrate the practical applicability of our method but also highlight its potential to set a new benchmark in the field of point cloud detection. By outperforming the baseline algorithm, especially in challenging detection scenarios, the proposed method opens avenues for more accurate and reliable object detection in various applications, including but not limited to autonomous vehicles and urban planning. The successful implementation of this method on the KITTI dataset, a standard benchmark in the field, further reinforces the validity and robustness of our approach.
Table 4 outlines a set of ablation studies. These studies indicate that the individual application of each of the three different modules contributes to the enhancement of the algorithm’s performance to varying degrees. It is noteworthy that the improvement in accuracy, compared to the original baseline algorithm, is primarily observed in more challenging scenarios. Furthermore, in conjunction with Table 2, our method demonstrates a superior performance in detecting smaller and more challenging targets, confirming the robustness and adaptability of our algorithm model when tackling complex detection challenges, particularly in addressing targets characterized by sparse and irregular feature distribution. Furthermore, the results of ablation experiments elucidate a crucial aspect of our methodology: the progressive incorporation of our specialized modules consistently enhances the accuracy of the system.

4. Conclusions

In the realm of point cloud processing, challenges persist despite the advent of various methods, including those based on deep learning. A primary issue is the uneven distribution of point clouds from LiDAR scans, where an increased depth leads to sparser scans and inconsistent scales. This complicates feature extraction and correlation, particularly during the dimension reduction process for creating bird’s eye view (BEV) images. The reduction in dimensions hampers spatial and semantic feature extraction and integration across scales. Additionally, the discrete nature of point clouds and increasing sparsity with depth impede small target detection, such as pedestrians.
To address these issues, our study introduces a mechanism combining spatial–semantic feature aggregation with auxiliary feature enhancement. The spatial–semantic feature aggregation (SSFA) module effectively merges low-level spatial and high-level semantic features, improving the target box prediction and classification confidence. We enhance segmentation results using supervised contrastive learning (SCL) and strengthen positional features with a point completion network (PCN). The experimental results suggest that the method we proposed has alleviated the detection issues with small-scale and sparse targets.
In our paper, we have provided perspectives and directions for addressing some of the challenges in 3D object detection, but there remain several areas for further explorations.
A significant challenge in point cloud processing is the fusion of features from different perspectives, such as bird’s eye view (BEV) features, original RGB image features, voxel features, original point cloud features, and features from other angle mappings. Effectively integrating these diverse feature sets can offer a variety of solutions and insights for point cloud detection tasks. Although this paper only explores the dataset of original point cloud features, it is anticipated that fusing multiple features could lead to superior performance outcomes.
Furthermore, the exploration to address the issue of insufficient features in point cloud detection is still ongoing. While our method has shown significant improvements for targets with moderate feature deficiencies, its impact on targets with extremely sparse point features remains limited. Therefore, identifying and solving the detection of objects with widespread point deficiencies or uneven distribution continues to be a key area for future research. On one hand, designing a superior network structure to learn more in-depth voxel features is one approach; on the other hand, considering the use of spatial information enhancement modules to predict the complete shape of objects could improve the expression of informational features.

Author Contributions

Methodology, Z.Y., Y.L. and Y.C.; Resources, L.J. and R.S.; Software, Z.Y. and Z.O.; Writing, Z.O. and G.L. All authors have read and agreed to the published version of the manuscript.

Funding

This work was supported in part by the National Natural Science Foundation of China under Grants 62101517 and 62176200; in part by the Research Project of SongShan Laboratory under Grant YYJC052022004; in part by the Natural Science Basic Research Program of Shaanxi under Grant No.2022JC-45; and in part by the Fund for Foreign Scholars in University Research and Teaching Programs (the 111 Project).

Data Availability Statement

The KITTI dataset is accessible through [38].

Acknowledgments

The authors express sincere gratitude to all reviewers and editors for their diligent contributions and insightful feedback, which significantly enhanced the quality and impact of our paper.

Conflicts of Interest

All authors of this paper hereby declare that there are no direct or indirect financial relationships, personal connections, or interests that could be perceived as influencing the results and conclusions of this research. We affirm that no entity or individual involved in this study provided any form of funding, services, equipment, or other support that could be construed as causing a conflict of interest. This research is entirely the result of the authors’ independent efforts, and all data and findings were generated impartially and objectively, free from any commercial, financial, or other external influences.

Abbreviations

L o u t s u p supervised contrastive losses
bdescription of b
L o u t , i s u p the loss with the ith data
ithe ith data
Ithe set of data
P ( i ) the set of positive samples
| P ( i ) | the number of positive samples
pone of the positive sample
A ( i ) the set of negative samples
aone of the negative samples
τ temperature
l ( · ,   · ,   · ) loss in PCN
Y c o u r s e output of course
Y d e t a i l output of detail
Y g t ground truth
Y ˜ g t subsample ground
d 1 ( · ) distance function
d 2 ( · ) distance function
α a hyperparameter for trading off d 1 and d 2
R N AP accuracy
A P | R N with point number N, the AP accuracy
Npoint numbers
rthe recall
ρ ( · ) the accuracy of recall

References

  1. Arnold, E.; Al-Jarrah, O.Y.; Dianati, M.; Fallah, S.; Oxtoby, D.; Mouzakitis, A. A Survey on 3D Object Detection Methods for Autonomous Driving Applications. IEEE Trans. Intell. Transport. Syst. 2019, 20, 3782–3795. [Google Scholar] [CrossRef]
  2. Ku, J.; Mozifian, M.; Lee, J.; Harakeh, A.; Waslander, S.L. Joint 3D Proposal Generation and Object Detection from View Aggregation. In Proceedings of the 2018 IEEE/RSJ International Conference on Intelligent Robots and Systems (IROS), Madrid, Spain, 1–5 October 2018; pp. 1–8. [Google Scholar]
  3. Zeng, Y.; Hu, Y.; Liu, S.; Ye, J.; Han, Y.; Li, X.; Sun, N. RT3D: Real-Time 3-D Vehicle Detection in LiDAR Point Cloud for Autonomous Driving. IEEE Robot. Autom. Lett. 2018, 3, 3434–3440. [Google Scholar] [CrossRef]
  4. Khanh, T.T.; Hoang Hai, T.; Nguyen, V.; Nguyen, T.D.T.; Thien Thu, N.; Huh, E.-N. The Practice of Cloud-Based Navigation System for Indoor Robot. In Proceedings of the 2020 14th International Conference on Ubiquitous Information Management and Communication (IMCOM), Taichung, Taiwan, 3–5 January 2020; pp. 1–4. [Google Scholar]
  5. Yu, S.-L.; Westfechtel, T.; Hamada, R.; Ohno, K.; Tadokoro, S. Vehicle Detection and Localization on Bird’s Eye View Elevation Images Using Convolutional Neural Network. In Proceedings of the 2017 IEEE International Symposium on Safety, Security and Rescue Robotics (SSRR), Shanghai, China, 11–13 October 2017; pp. 102–109. [Google Scholar]
  6. Engelcke, M.; Rao, D.; Wang, D.Z.; Tong, C.H.; Posner, I. Vote3Deep: Fast Object Detection in 3D Point Clouds Using Efficient Convolutional Neural Networks. In Proceedings of the 2017 IEEE International Conference on Robotics and Automation (ICRA), Singapore, 29 May–3 June 2017; pp. 1355–1361. [Google Scholar]
  7. Leibe, B.; Leonardis, A.; Schiele, B. Robust Object Detection with Interleaved Categorization and Segmentation. Int. J. Comput. Vis. 2008, 77, 259–289. [Google Scholar] [CrossRef]
  8. Ronneberger, O.; Fischer, P.; Brox, T. U-Net: Convolutional Networks for Biomedical Image Segmentation. In Medical Image Computing and Computer-Assisted Intervention—MICCAI 2015; Navab, N., Hornegger, J., Wells, W.M., Frangi, A.F., Eds.; Lecture Notes in Computer Science; Springer International Publishing: Cham, Switzerland, 2015; Volume 9351, pp. 234–241. ISBN 978-3-319-24573-7. [Google Scholar]
  9. Liu, W.; Anguelov, D.; Erhan, D.; Szegedy, C.; Reed, S.; Fu, C.-Y.; Berg, A.C. SSD: Single Shot MultiBox Detector. In Computer Vision—ECCV 2016; Leibe, B., Matas, J., Sebe, N., Welling, M., Eds.; Lecture Notes in Computer Science; Springer International Publishing: Cham, Switzerland, 2016; Volume 9905, pp. 21–37. ISBN 978-3-319-46447-3. [Google Scholar]
  10. Zhou, Y.; Tuzel, O. VoxelNet: End-to-End Learning for Point Cloud Based 3D Object Detection. In Proceedings of the 2018 IEEE/CVF Conference on Computer Vision and Pattern Recognition, Salt Lake City, UT, USA, 18–23 June 2018; pp. 4490–4499. [Google Scholar]
  11. Redmon, J.; Farhadi, A. YOLO9000: Better, Faster, Stronger. In Proceedings of the 2017 IEEE Conference on Computer Vision and Pattern Recognition (CVPR), Honolulu, HI, USA, 21–26 July 2017; pp. 6517–6525. [Google Scholar]
  12. Redmon, J.; Divvala, S.; Girshick, R.; Farhadi, A. You Only Look Once: Unified, Real-Time Object Detection. In Proceedings of the 2016 IEEE Conference on Computer Vision and Pattern Recognition (CVPR), Las Vegas, NV, USA, 27–30 June 2016; pp. 779–788. [Google Scholar]
  13. Beltran, J.; Guindel, C.; Moreno, F.M.; Cruzado, D.; Garcia, F.; De La Escalera, A. BirdNet: A 3D Object Detection Framework from LiDAR Information. In Proceedings of the 2018 21st International Conference on Intelligent Transportation Systems (ITSC), Maui, HI, USA, 4–7 November 2018; pp. 3517–3523. [Google Scholar]
  14. Simon, M.; Milz, S.; Amende, K.; Gross, H.-M. Complex-YOLO: An Euler-Region-Proposal for Real-Time 3D Object Detection on Point Clouds. In Computer Vision—ECCV 2018 Workshops; Leal-Taixé, L., Roth, S., Eds.; Lecture Notes in Computer Science; Springer International Publishing: Cham, Switzerland, 2019; Volume 11129, pp. 197–209. ISBN 978-3-030-11008-6. [Google Scholar]
  15. Qi, C.R.; Liu, W.; Wu, C.; Su, H.; Guibas, L.J. Frustum pointnets for 3d object detection from rgb-d data. In Proceedings of the 2018 IEEE/CVF Conference on Computer Vision and Pattern Recognition (CVPR), Salt Lake City, UT, USA, 18–23 June 2018; pp. 918–927. [Google Scholar]
  16. Liang, M.; Yang, B.; Wang, S.; Urtasun, R. Deep Continuous Fusion for Multi-Sensor 3D Object Detection. In Computer Vision—ECCV 2018; Ferrari, V., Hebert, M., Sminchisescu, C., Weiss, Y., Eds.; Lecture Notes in Computer Science; Springer International Publishing: Cham, Switzerland, 2018; Volume 11220, pp. 663–678. ISBN 978-3-030-01269-4. [Google Scholar]
  17. Mohapatra, S.; Yogamani, S.; Gotzig, H.; Milz, S.; Mader, P. BEVDetNet: Bird’s Eye View LiDAR Point Cloud Based Real-Time 3D Object Detection for Autonomous Driving. In Proceedings of the 2021 IEEE International Intelligent Transportation Systems Conference (ITSC), Indianapolis, IN, USA, 19–22 September 2021; pp. 2809–2815. [Google Scholar]
  18. He, K.; Gkioxari, G.; Dollar, P.; Girshick, R. Mask R-CNN. In Proceedings of the 2017 IEEE International Conference on Computer Vision (ICCV), Venice, Italy, 22–29 October 2017; pp. 2980–2988. [Google Scholar]
  19. Graham, B.; Engelcke, M.; Maaten, L.V.D. 3D Semantic Segmentation with Submanifold Sparse Convolutional Networks. In Proceedings of the 2018 IEEE/CVF Conference on Computer Vision and Pattern Recognition, Salt Lake City, UT, USA, 18–23 June 2018; pp. 9224–9232. [Google Scholar]
  20. Dai, X.; Li, M.; Zhai, P.; Tong, S.; Gao, X.; Huang, S.; Zhu, Z.; You, C.; Ma, Y. Revisiting Sparse Convolutional Model for Visual Recognition. arXiv 2022, arXiv:2210.12945. [Google Scholar]
  21. Chen, X.; Ma, H.; Wan, J.; Li, B.; Xia, T. Multi-View 3D Object Detection Network for Autonomous Driving. In Proceedings of the 2017 IEEE Conference on Computer Vision and Pattern Recognition (CVPR), Honolulu, HI, USA, 21–26 July 2017; pp. 6526–6534. [Google Scholar]
  22. Charles, R.Q.; Su, H.; Kaichun, M.; Guibas, L.J. PointNet: Deep Learning on Point Sets for 3D Classification and Segmentation. In Proceedings of the 2017 IEEE Conference on Computer Vision and Pattern Recognition (CVPR), Honolulu, HI, USA, 21–26 July 2017; IEEE: Honolulu, HI, USA, 2017; pp. 77–85. [Google Scholar]
  23. Qi, C.R.; Yi, L.; Su, H.; Guibas, L.J. Pointnet++: Deep hierarchical feature learning on point sets in a metric space. In Proceedings of the 31st International Conference on Neural Information Processing Systems, Long Beach, CA, USA, 4–9 December 2017; pp. 5099–5108. [Google Scholar]
  24. Ren, S.; He, K.; Girshick, R.; Sun, J. Faster R-CNN: Towards Real-Time Object Detection with Region Proposal Networks. IEEE Trans. Pattern Anal. Mach. Intell. 2017, 39, 1137–1149. [Google Scholar] [CrossRef] [PubMed]
  25. Vora, S.; Lang, A.H.; Helou, B.; Beijbom, O. PointPainting: Sequential Fusion for 3D Object Detection. In Proceedings of the 2020 IEEE/CVF Conference on Computer Vision and Pattern Recognition (CVPR), Seattle, WA, USA, 13–19 June 2020; pp. 4603–4611. [Google Scholar]
  26. Shi, S.; Wang, X.; Li, H. PointRCNN: 3D Object Proposal Generation and Detection From Point Cloud. In Proceedings of the 2019 IEEE/CVF Conference on Computer Vision and Pattern Recognition (CVPR), Long Beach, CA, USA, 15–20 June 2019; pp. 770–779. [Google Scholar]
  27. Yang, B.; Luo, W.; Urtasun, R. PIXOR: Real-Time 3D Object Detection from Point Clouds. In Proceedings of the 2018 IEEE/CVF Conference on Computer Vision and Pattern Recognition, Salt Lake City, UT, USA, 18–23 June 2018; pp. 7652–7660. [Google Scholar]
  28. Yan, Y.; Mao, Y.; Li, B. SECOND: Sparsely Embedded Convolutional Detection. Sensors 2018, 18, 3337. [Google Scholar] [CrossRef] [PubMed]
  29. Yang, Z.; Sun, Y.; Liu, S.; Jia, J. 3DSSD: Point-Based 3D Single Stage Object Detector. In Proceedings of the 2020 IEEE/CVF Conference on Computer Vision and Pattern Recognition (CVPR), Seattle, WA, USA, 13–19 June 2020; pp. 11037–11045. [Google Scholar]
  30. Qi, C.R.; Litany, O.; He, K.; Guibas, L. Deep Hough Voting for 3D Object Detection in Point Clouds. In Proceedings of the 2019 IEEE/CVF International Conference on Computer Vision (ICCV), Seoul, Republic of Korea, 27 October–2 November 2019; pp. 9276–9285. [Google Scholar]
  31. Shi, S.; Wang, Z.; Shi, J.; Wang, X.; Li, H. From Points to Parts: 3D Object Detection from Point Cloud with Part-Aware and Part-Aggregation Network. IEEE Trans. Pattern Anal. Mach. Intell. 2020, 43, 2647–2664. [Google Scholar] [CrossRef] [PubMed]
  32. Qi, C.R.; Chen, X.; Litany, O.; Guibas, L.J. ImVoteNet: Boosting 3D Object Detection in Point Clouds With Image Votes. In Proceedings of the 2020 IEEE/CVF Conference on Computer Vision and Pattern Recognition (CVPR), Seattle, WA, USA, 13–19 June 2020; pp. 4403–4412. [Google Scholar]
  33. Dettmers, T.; Minervini, P.; Stenetorp, P.; Riedel, S. Convolutional 2D Knowledge Graph Embeddings. In Proceedings of the AAAI’18: AAAI Conference on Artificial Intelligence, New Orleans, LA, USA, 2–7 February 2018; Volume 32. [Google Scholar] [CrossRef]
  34. Zheng, W.; Tang, W.; Chen, S.; Jiang, L.; Fu, C.-W. CIA-SSD: Confident IoU-Aware Single-Stage Object Detector From Point Cloud. AAAI 2021, 35, 3555–3562. [Google Scholar] [CrossRef]
  35. Chen, T.; Kornblith, S.; Norouzi, M.; Hinton, G. A simple framework for contrastive learning of visual representations. In Proceedings of the 37th International Conference on Machine Learning, Virtual, 13–18 July 2020; pp. 1597–1607. [Google Scholar]
  36. Khosla, P.; Teterwak, P.; Wang, C.; Sarna, A.; Tian, Y.; Isola, P.; Maschinot, A.; Liu, C.; Krishnan, D. Supervised contrastive learning. Adv. Neural Inf. Process. Syst. 2020, 33, 18661–18673. [Google Scholar]
  37. Yuan, W.; Khot, T.; Held, D.; Mertz, C.; Hebert, M. Pcn: Point completion network. In Proceedings of the 2018 International Conference on 3D Vision (3DV), Verona, Italy, 5–8 September 2018; pp. 728–737. [Google Scholar]
  38. Geiger, A.; Lenz, P.; Urtasun, R. Are We Ready for Autonomous Driving? The KITTI Vision Benchmark Suite. In Proceedings of the 2012 IEEE Conference on Computer Vision and Pattern Recognition, Providence, RI, USA, 16–21 June 2012; pp. 3354–3361. [Google Scholar]
  39. Everingham, M.; Eslami, S.M.A.; Van Gool, L.; Williams, C.K.I.; Winn, J.; Zisserman, A. The Pascal Visual Object Classes Challenge: A Retrospective. Int. J. Comput. Vis. 2015, 111, 98–136. [Google Scholar] [CrossRef]
  40. Lang, A.H.; Vora, S.; Caesar, H.; Zhou, L.; Yang, J.; Beijbom, O. PointPillars: Fast Encoders for Object Detection From Point Clouds. In Proceedings of the 2019 IEEE/CVF Conference on Computer Vision and Pattern Recognition (CVPR), Long Beach, CA, USA, 15–20 June 2019; pp. 12689–12697. [Google Scholar]
Figure 1. Semantic segmentation based on supervised contrastive learning: (a) uneven point cloud distribution; (b) incomplete point cloud representation; (c) Sparse point cloud representation.
Remotesensing 16 01045 g001
Figure 2. Enhanced model based on auxiliary features.
Remotesensing 16 01045 g002
Figure 3. The overall framework of SSFA.
Remotesensing 16 01045 g003
Figure 4. Semantic segmentation based on supervised contrastive learning.
Remotesensing 16 01045 g004
Figure 5. Basic process of dot completion network.
Remotesensing 16 01045 g005
Figure 6. Visualization of 3D point cloud binary files from another angle: (a) example of RGB image files from the KITTI dataset; (b) visualization of 3D point cloud binary files from a general oblique angle; (c) visualization of 3D point cloud binary files from another angle.
Remotesensing 16 01045 g006
Figure 7. Visualization of detection results: (a) results of the baseline Part- A 2 ; (b) results of our module, including SSFA, SCL, and the PCN.
Remotesensing 16 01045 g007
Table 1. Software and hardware environment for the experiments.
Hardware environmentCPUIntel Xeon (R) CPU E5-2678 @
2.50 GHz × 48
GPUNVIDIA GeForce GTX 1080 8 GB
Software environmentOSLinux Ubuntu 18.04.5 LTS
LanguagePython 3.7.4
PlatformPytorch 1.7.0
3D detection platformOpenPCDet 0.5.2
CUDACUDA 10.1
The Intel Xeon CPU E5-2678 was manufactured by Intel Corporation, headquartered in Santa Clara, California, United States. The NVIDIA GeForce GTX 1080 8GB was produced by NVIDIA Corporation, also based in Santa Clara, California, United States.
Table 2. Performance comparison of different methods on different categories within the KITTI dataset.
MethodCar AP@Pedestrian AP@Cyclist AP@
0.7 0.7 0.7 0.5 0.5 0.5 0.5 0.5 0.5
CaDDN [12]27.7821.3818.6215.4513.0211.8810.859.760.09
VoxelNet [10]82.4770.1165.7349.4843.6942.5068.2253.3650.37
PointPillar [40]86.7477.2174.4755.3248.8044.5079.2161.9058.15
SECOND [28]90.0580.7077.9155.8251.1346.4382.7865.1761.08
PointRCNN [26]88.7875.5172.9369.4060.2552.7890.2770.2565.75
Part- A 2 [31]91.5082.0779.8866.1259.0453.3189.9173.5069.28
Ours91.7482.2279.8271.8464.8259.1692.1874.7870.73
The bold data represent the best-performing experimental results in all comparative experiments.
Table 3. Performance comparison of different methods across different difficulty levels within the KITTI dataset.
MethodEasyModerateHardAvg.
CaDDN [12]18.0214.7213.2015.31
VoxelNet [10]66.7266.7252.5358.33
PointPillar [40]73.7562.6459.0465.14
SECOND [28]76.2265.6661.8167.90
PointRCNN [26]82.8268.6763.8271.77
Part- A 2 [31]82.5171.5467.4973.85
Ours85.2573.9469.9076.37
The bold data represent the best-performing experimental results in all comparative experiments.
Table 4. The ablation experiments of the model on the KITTI dataset.
MethodEasyModerateHardAvg.
None82.5171.5467.4973.85
SCL83.1572.0968.2274.49
PCN83.6172.3468.3974.78
PCN + SCL84.0972.7869.1175.32
PCN + SCL + SSFA85.2573.9469.9076.37
The bold data represent the best-performing experimental results in all comparative experiments.
Disclaimer/Publisher’s Note: The statements, opinions and data contained in all publications are solely those of the individual author(s) and contributor(s) and not of MDPI and/or the editor(s). MDPI and/or the editor(s) disclaim responsibility for any injury to people or property resulting from any ideas, methods, instructions or products referred to in the content.

