Abstract
We present an evaluation of different deep learning and machine learning approaches for tree health classification in the Black Forest, the Harz Mountains, and the Göttinger Forest on a unique, highly accurate tree-level dataset. The multispectral UAV data were collected from eight forest plots with diverse tree species, mostly conifers. As ground truth data (GTD), nearly 1500 tree polygons with related attribute information on the health status of the trees were used. This data were collected during extensive fieldwork using a mobile application and subsequent individual tree segmentation. Extensive preprocessing included normalization, NDVI calculations, data augmentation to deal with the underrepresented classes, and splitting the data into training, validation, and test sets. We conducted several experiments using a classical machine learning approach (random forests), as well as different convolutional neural networks (CNNs)—ResNet50, ResNet101, VGG16, and Inception-v3—on different datasets and classes to evaluate the potential of these algorithms for tree health classification. Our first experiment was a binary classifier of healthy and damaged trees, which did not consider the degree of damage or tree species. The best results of a 0.99 test accuracy and an F1 score of 0.99 were obtained with ResNet50 on four band composites using the red, green, blue, and infrared bands (RGBI images), while VGG16 had the worst performance, with an F1 score of only 0.78. In a second experiment, we also distinguished between coniferous and deciduous trees. The F1 scores ranged from 0.62 to 0.99, with the highest results obtained using ResNet101 on derived vegetation indices using the red edge band of the camera (NDVIre images). Finally, in a third experiment, we aimed at evaluating the degree of damage: healthy, slightly damaged, and medium or heavily damaged trees. Again, ResNet101 had the best performance, this time on RGBI images with a test accuracy of 0.98 and an average F1 score of 0.97. These results highlight the potential of CNNs to handle high-resolution multispectral UAV data for the early detection of damaged trees when good training data are available.
1. Introduction
The Federal Ministry of Food and Agriculture (BMEL) is providing 900 million euros as part of a funding program to reward forest ecosystem services and climate-adapted forest management until 2026 [1]. This illustrates the immense importance of forests for our environment and climate, which comprise carbon sequestration, soil protection, water retention, and sustainable wood utilization, as well as ecological and recreational value. According to the results of the 2017 carbon inventory as part of the Federal Forest Inventory of the Johann Heinrich von Thünen Institute, 1230 million tons of carbon are currently bound in living trees in Germany, with the sustainable utilization of wood and the resulting tree regrowth further multiplying carbon sequestration over time. These forests cover 32% or 11.4 million hectares of Germany’s total land area [2].
Pressing problems for these large forest areas result from degradation due to drought, storm damage, and bark beetles as stated in the Forest Condition Survey 2022 [3]: Only 21% of the surveyed trees have no crown damage, 44% of the crowns are classified in the warning level (light damage) and 35% of the trees show significant crown defoliation (medium or heavy damage). This remains the highest level of damage since records began in the 1980s. According to the Federal Statistical Office of Germany, the most common reason for felling is tree mortality due to bark beetle infestation. In 2022, about 45 million cubic meters of wood were harvested from German forests, of which about 27 million cubic meters were felled due to bark beetle infestation [3].
Recent bark beetle infestations and the resulting forest losses in Germany are comparable to other regions in Europe, e.g., in the Czech Republic, where bark beetle populations triggered a drought-induced dynamic comparable to the situation in the Harz mountain between 2017 and 2023. Hlasny et al. give a historical overview of the bark beetle dynamic in European countries from 1945 to 2020 and note an increasing infestation intensity, especially in Austria, Bavaria, and the Czech Republic [4], which adds to the increasing drought stress due to climate change. In Canada, annual losses of CAD 1274 million induced by bark beetles (Dendroctonus ponderosae) were reported [5]. In the United States, bark beetle infestations led to a financial loss of USD 1500 million annually [6]. Other causes of damage can be storms or drought without bark beetle infestation. Experts estimate that about 500,000 hectares of forest in Germany alone will have to be reforested in the next few years due to forest damage [7].
Bark beetle-induced forest damage is a secondary calamity related to drought stress due to the weakening of tree resilience as a result of the prolonged lack of water. Trees confronted with drought stress cannot produce enough resin to fight the beetles in their bore holes. Therefore, drought and beetle calamities are interdependent and intensify each other, thus leading to the growing beetle population’s ability to also attack healthy trees. The respective tree symptoms of drought and beetle attack can overlap in a stand, thereby showing, e.g., defoliation due to drought stress before and during discoloration due to beetle attacks.
The reliable detection of these symptoms in both aforested and established stands is a central aspect for forest monitoring in order to prevent the deforestation of large areas. The early detection of infestation and the subsequent implementation of measures is a key factor for successfully managing insect-induced damage [8], as early measures can prevent the spread of the beetle population into healthy forest areas. The problems highlighted for Germany have been investigated in many different scenarios and for various forest types worldwide, e.g., by [9] for a forest area in Greece with a detection accuracy of tree health conditions of more than 90% or by [10] for the qualitative classification of Norway spruces, to name a few. Modern data collection using multispectral UAVs and artificial intelligence provides great potential for this early detection. For example, Minařík et al., 2021 [11] have shown that the combination of multispectral data and CNNs is promising for bark beetle monitoring, with a kappa value of 0.92 using CNNs on data from a Czech forest. The composition of multiple building blocks, such as convolutional layers, pooling layers, and fully connected layers, allows CNNs to learn adaptively based on neighborhood information and not purely on the spectral domain, thus resulting in their success in image classification tasks [12]. Our study evaluates different deep learning approaches for tree health classification under drought stress and initial bark beetle infestation compared to traditional machine learning on multispectral UAV data and spatially highly accurate ground truth data from three different forests collected during extensive fieldwork in Germany.
2. State of the Art in Forest Monitoring
There is a wide variety of remote sensing applications in forestry, ranging from tree species classification to tree health classification or biomass estimations. Recent advances in hardware (multispectral and LiDAR sensors on UAVs) and algorithms such as deep CNNs have led to new approaches to these topics. In this section, we provide a brief overview with respect to the data used to address these topics, as well as the algorithms used for classification tasks related to the present study.
2.1. Overview of Data Products Used in Forest Monitoring
One common and usually least expensive data collection method for forest monitoring is acquiring satellite imagery from various platforms. Data from the U.S. Geological Survey’s (USGS) Landsat missions or the European Space Agency’s (ESA) Sentinel-2 missions are freely available for download. The Landsat mission reaches back to the 1970s and is, therefore, well suited for time series analysis. Both missions provide data in the visible and infrared spectrum and are well suited for vegetation analysis. Immitzer et al., 2016 [13] achieved significantly higher accuracies for tree species classification using Sentinel-2 data in comparison to Landsat 8 data due to the lower spatial resolution of Landsat 8. Wessel et al., 2018 [14] have also demonstrated the potential of Sentinel-2 data and classical machine learning methods such as SVMs and RFs for tree species classification. Dalponte et al., 2022 [15] classified the drought-induced outbreak of the European spruce bark beetle from Sentinel-2 data using SVMs. They noted, however, that the data from the Sentinel-2 satellite were limited by their spatial resolution. The size of a 10 m by 10 m pixel may contain more than one tree, and is thus not suitable for classification tasks at the tree-level.
Other widely investigated data sources are LiDAR data and RADAR data. The interested reader is referred to a review by [16]. These datasets are often fused with multispectral data for classification tasks to improve accuracy. While point cloud data help to segment single trees, multispectral data are used to extract information about tree health. For example, Windrim et al., 2020 [17] classified the health status of individual trees using multispectral orthophotos combined with photogrammetric point clouds using machine learning. Li et al., 2021 [18] use different ResNet and DenseNet models to detect and classify four tree species from multisource data. Briechle et al., 2021 [19] also used a ResNet-based architecture to classify tree species and to detect standing dead trees. All three papers showed good results and clearly highlight that point clouds, in combination with multispectral data, are well suited for these tasks. However, obtaining these datasets and labeling the training data are a huge drawback with respect to larger-scale forest applications. Hyperspectral data provide more information that is valuable for vegetation analysis in the spectral range, as hundreds to thousands of narrow (10–20 nm) bands are mapped. An example of this is provided by [20], who successfully performed a loss-of-vitality detection of trees under induced drought stress using the RFs algorithm on hyperspectral data and derived vegetation indices. In another work by [21], hyperspectral UAV images were analyzed using a 3D-CNN for tree species identification. Similar to LiDAR data, hyperspectral UAV data collection is not yet feasible for large areas. Additionally, hyperspectral data contain lots of redundancy, and extensive feature engineering or data reduction techniques are necessary to successfully use this type of data.
Huo et al., 2021 and Abdullah et al., 2018 [22,23] have both investigated the impact of the European spruce bark beetle on forests, and they conclude that vegetation stress is well visible in the near-infrared (NIR) and shortwave infrared (SWIR) bands. Lehmann et al., 2015 [24] also state that the NIR bands have great potential in the assessment of forest health, thereby agreeing with [25], who found great potential of the red edge band in the context of the early detection of vegetation stress caused by bark beetle infestation. This was also confirmed by [26] in their study on the detection of vegetative stress in the plant growth cycle and by the work of [27]. Thus, the red, red edge, and near-infrared regions are very important for forest vitality assessment and were also used in this study, while the ground sample distance (GSD) in this study was very small in order to obtain a more precise vitality estimation. This should allow for an earlier detection of drought stress and associated bark beetle infestation, which would allow for the prevention of a gradation and successive large forest area losses. Bárta et al., 2022 [28] used data collected at a high spatial accuracy, comparable to our data, for trees infested with bark beetles in the Czech Republic and used spectral indices and time series for early detection. The authors highlighted the importance of vegetation indices for early detection.
2.2. Tree Health Classification from Multispectral UAV Data Using Machine Learning and Deep Learning
Classical machine learning algorithms such as random forests algorithms (RFs) or support vector machines (SVMs) are widely used on remote sensing data for tree species and tree health classification. Ecke et al., 2022 [29] provide a review of UAV applications for tree health classification that highlights the potential of these applications but also the shortcomings, such as an under-representation of long-term monitoring or data fusion approaches (e.g., hyperspectral data, LiDAR, etc.). For a detailed overview of UAV studies, the reader is referred to this review. Guerra-Hernandez et al., 2021 [30] developed an approach for monitoring the health of priority riparian forests. Four classes of damage were defined and classified using RFs and a simple and robust three-step logistic modeling approach. Kampen et al., 2019 [27] also used RFs for tree species classification and tree health analysis on multispectral data. The results of the health classification showed that infested or physiologically stressed trees could be detected well.
Abdollahnejad et al., 2020 and Fraser et al., 2021 [31,32] used SVMs for forest health classification based on UAV data. In both studies, relatively good but not outstanding results were obtained (overall accuracy between 65 and 85%). Another approach using SVMs is provided by [33], who sampled individual tree crowns in a Bulgarian coniferous forest, classified them by species, and assessed their health status. The error-correcting output codes (ECOCs) method was applied to the SVM algorithm to solve the binary class problem. The authors were able to reliably classify the vital status of trees with 95% accuracy using multispectral and RGB images.
During recent years, deep neural networks such as CNNs have attracted a lot of attention in the remote sensing community and in the field of UAV-based tree health (and species) classification (Ecke et al., 2022). For example, Natesan et al., 2019 [34] performed a ResNet-based tree species classification on RGB images from UAV data with an overall accuracy of 80 percent. They also concluded that the accuracy increases significantly with increasing amounts of images. Sylvain et al., 2019 [35] achieved good results using VGG16 for mapping dead wood, decidious, and coniferous trees in a mixed forest in Canada. The works of [11,36] focus on the detection of bark beetle damage on trees using customized CNNs on multispectral imagery. There are several studies using ResNet variants [18,19,37], VGG16 [37,38], and Inception-v3 [39] models on different forestry-related tasks with good results; therefore, these three models have also been evaluated in this work.
Another approach is instance segmentation with, for example, Mask R-CNN [40]. A pretrained CNN such as ResNet is usually used as the backbone network. Lin 2021 [41] used applied Mask R-CNN for the instance segmentation of different tree species. Similarly, Chiang et al., 2020 [42] performed a forest health diagnosis for a study area in Scotland using Mask R-CNN. Dead trees were detected with an accuracy of 54%. One major problem with the presented approaches is the availability of accurately labeled and georeferenced data. Forest inventories usually only provide the composition of trees in a certain radius (decameter), thus making classification at the tree-level impossible. This study is based on a highly accurate dataset collected during extensive fieldwork that allows for the evaluation of advanced machine learning algorithms at the tree-level.
This study is based on a unique dataset of high-resolution multispectral data obtained by UAVs during extensive fieldwork in 2022 and 2023, including ground truth data, e.g., on tree crown vitality, collected at a high spatial accuracy using a mobile application and a base–rover GNSS in different forest stands in Germany. Highly accurate ground truth data are of utter importance for machine learning and many datasets, such as forest inventory data, which lack the accuracy needed for training good models at the individual tree level. Many studies work at the tree stand level rather than at the individual tree level and/or only use samples from a single location that limits the generalization of AI-based approaches. A good review on the limitations with respect to tree species is provided by [43]. Our goal is to evaluate advanced CNNs to classify the health status of tree crowns of different sites in Germany. To this end, we conducted extensive experiments with respect to the obtained data, the applied algorithms, and the experimental settings of the classification to optimize the results and to evaluate the limitations of our approaches. The long-term motivation behind this approach is to evaluate the AI-based methods for the detection of drought stress and related early bark beetle infestation-induced early forest vitality loss on single tree crown level at high resolution in order to contribute to the long-term maintenance of forest health.
3. Materials and Methods
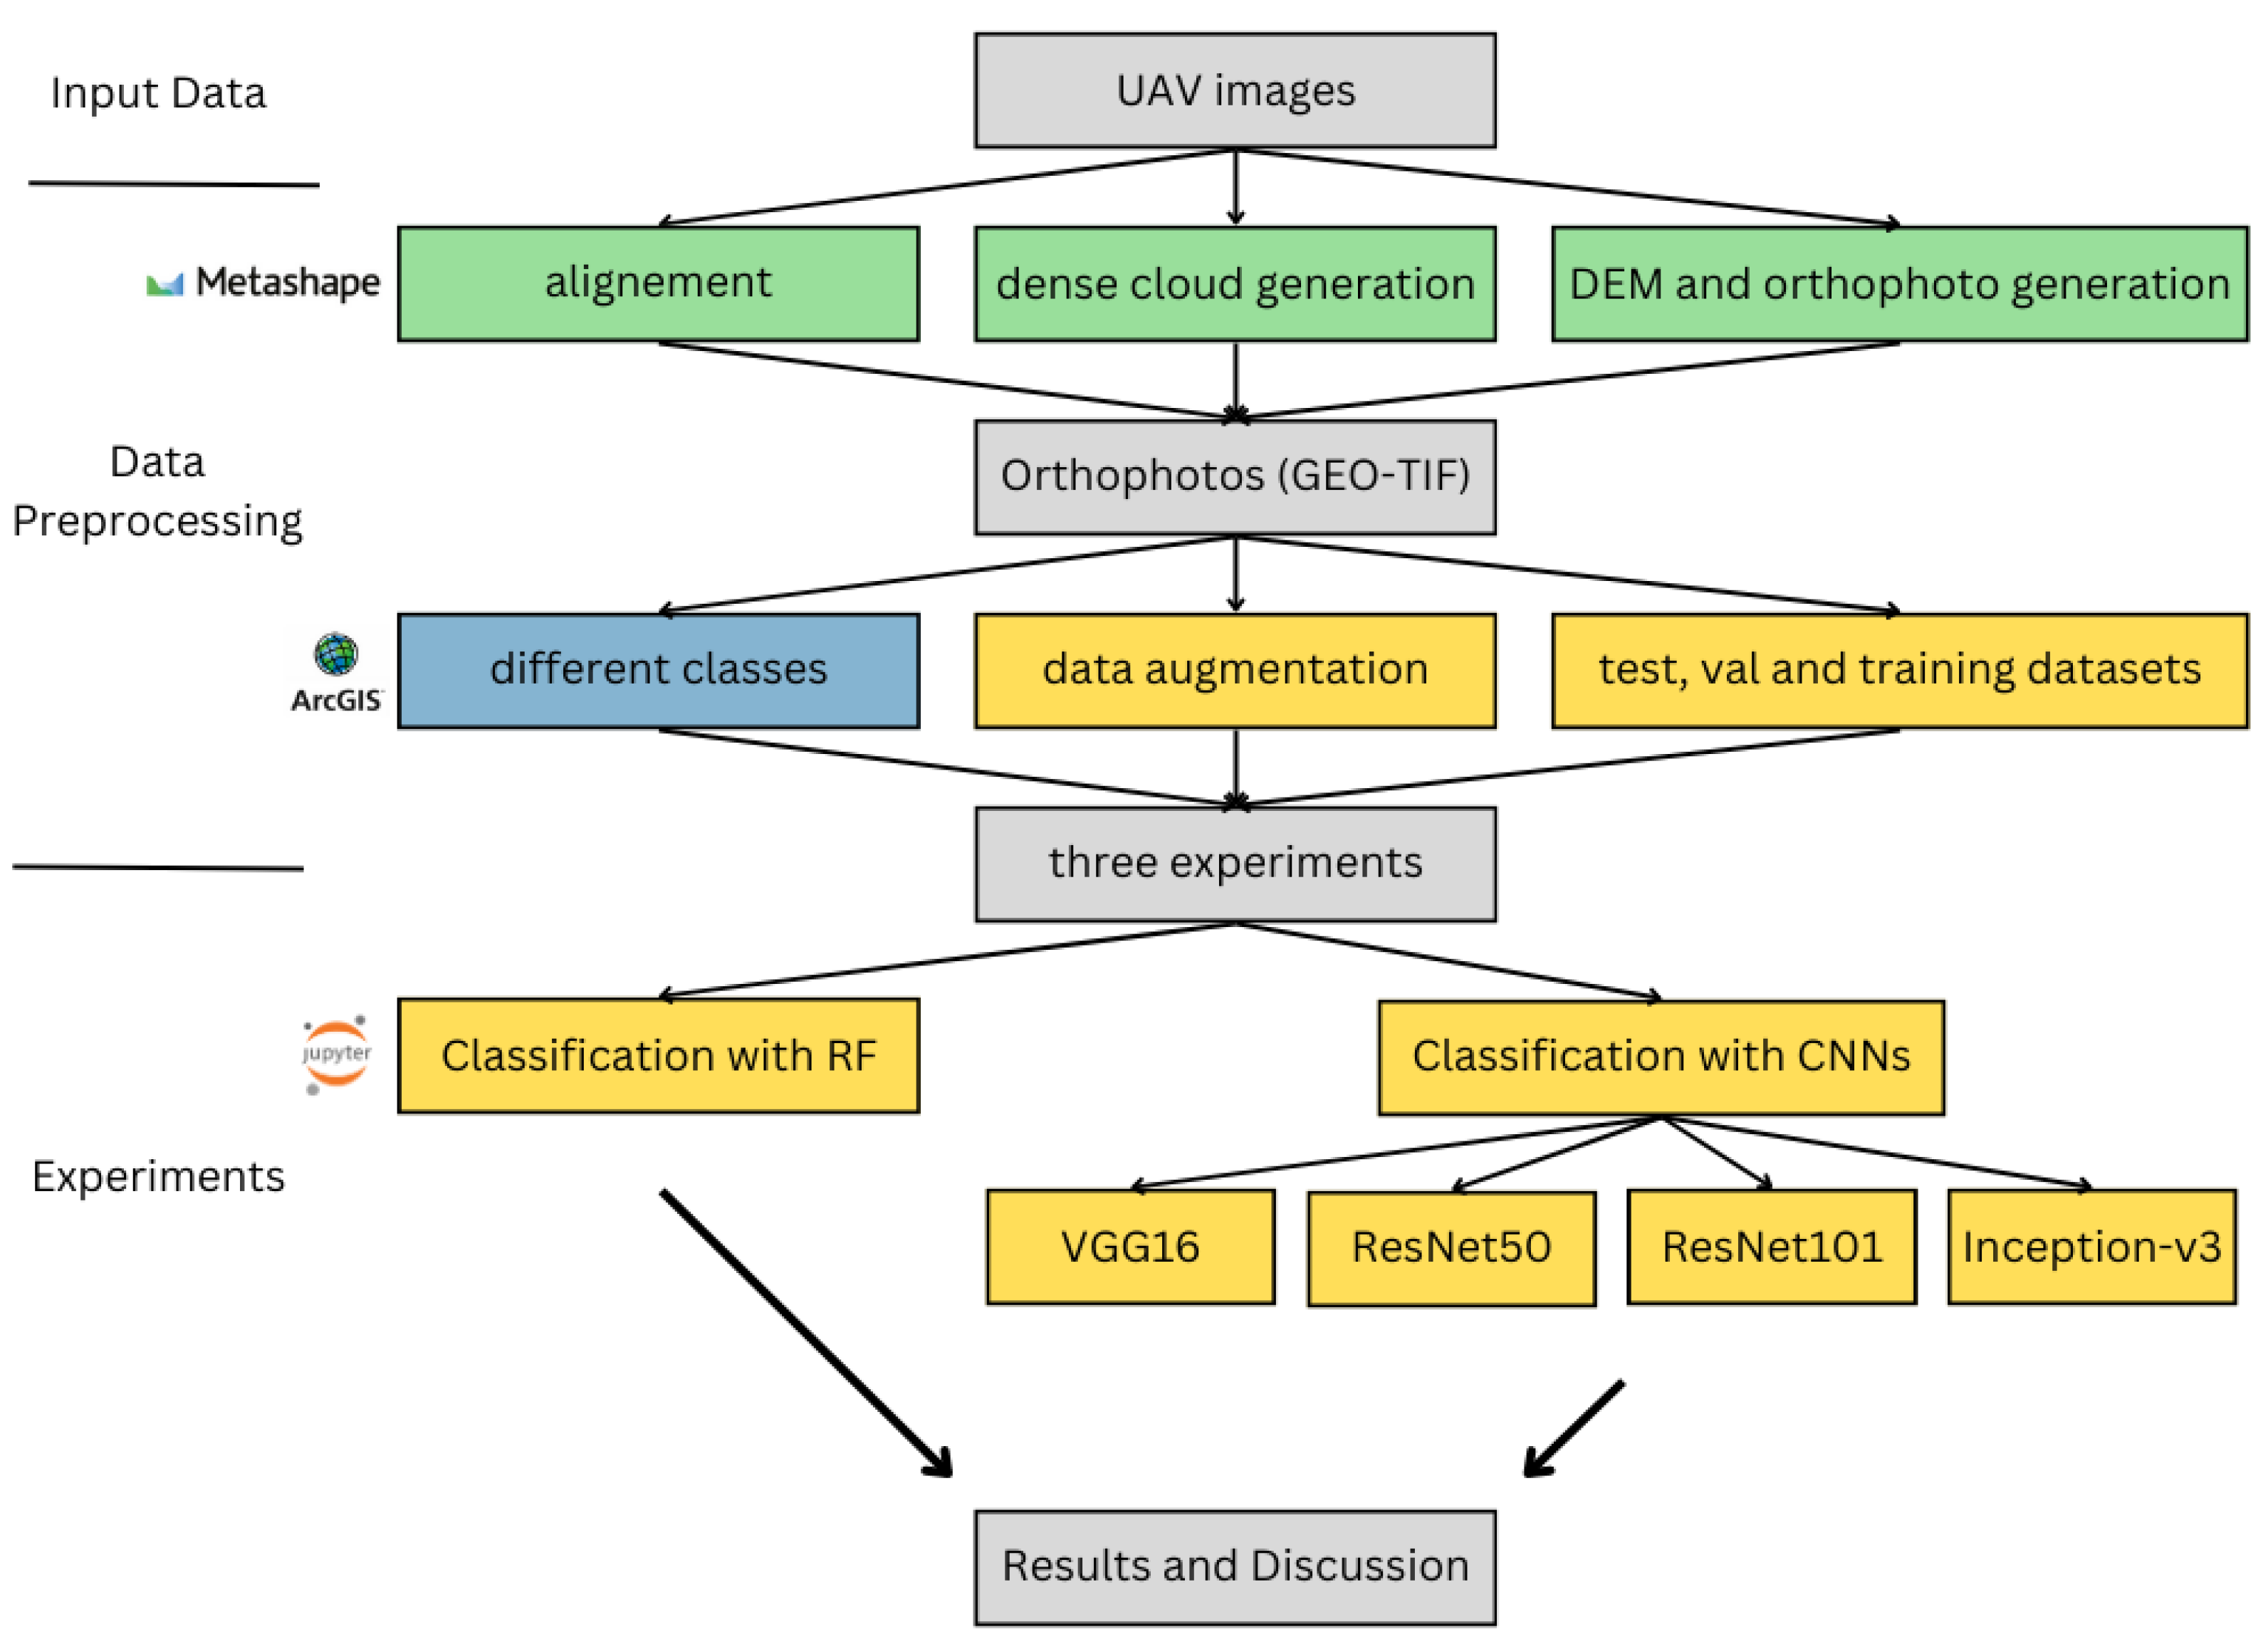
Figure 1 shows a flowchart of the overall workflow for this study. In this section, we will first describe the study area and fieldwork conducted during the past three years, followed by the methods used for data preprocessing and analysis.

Figure 1.
Presentation of the workflow of this study: the steps created with Agisoft Metashape software vs. 1.7.3 are colored in green, the steps created with ArcGIS Pro vs. 3.1 are colored in blue, and the steps created with Jupyter Notebook vs. 6.4.2 are colored in yellow.
3.1. Study Area and Available Data
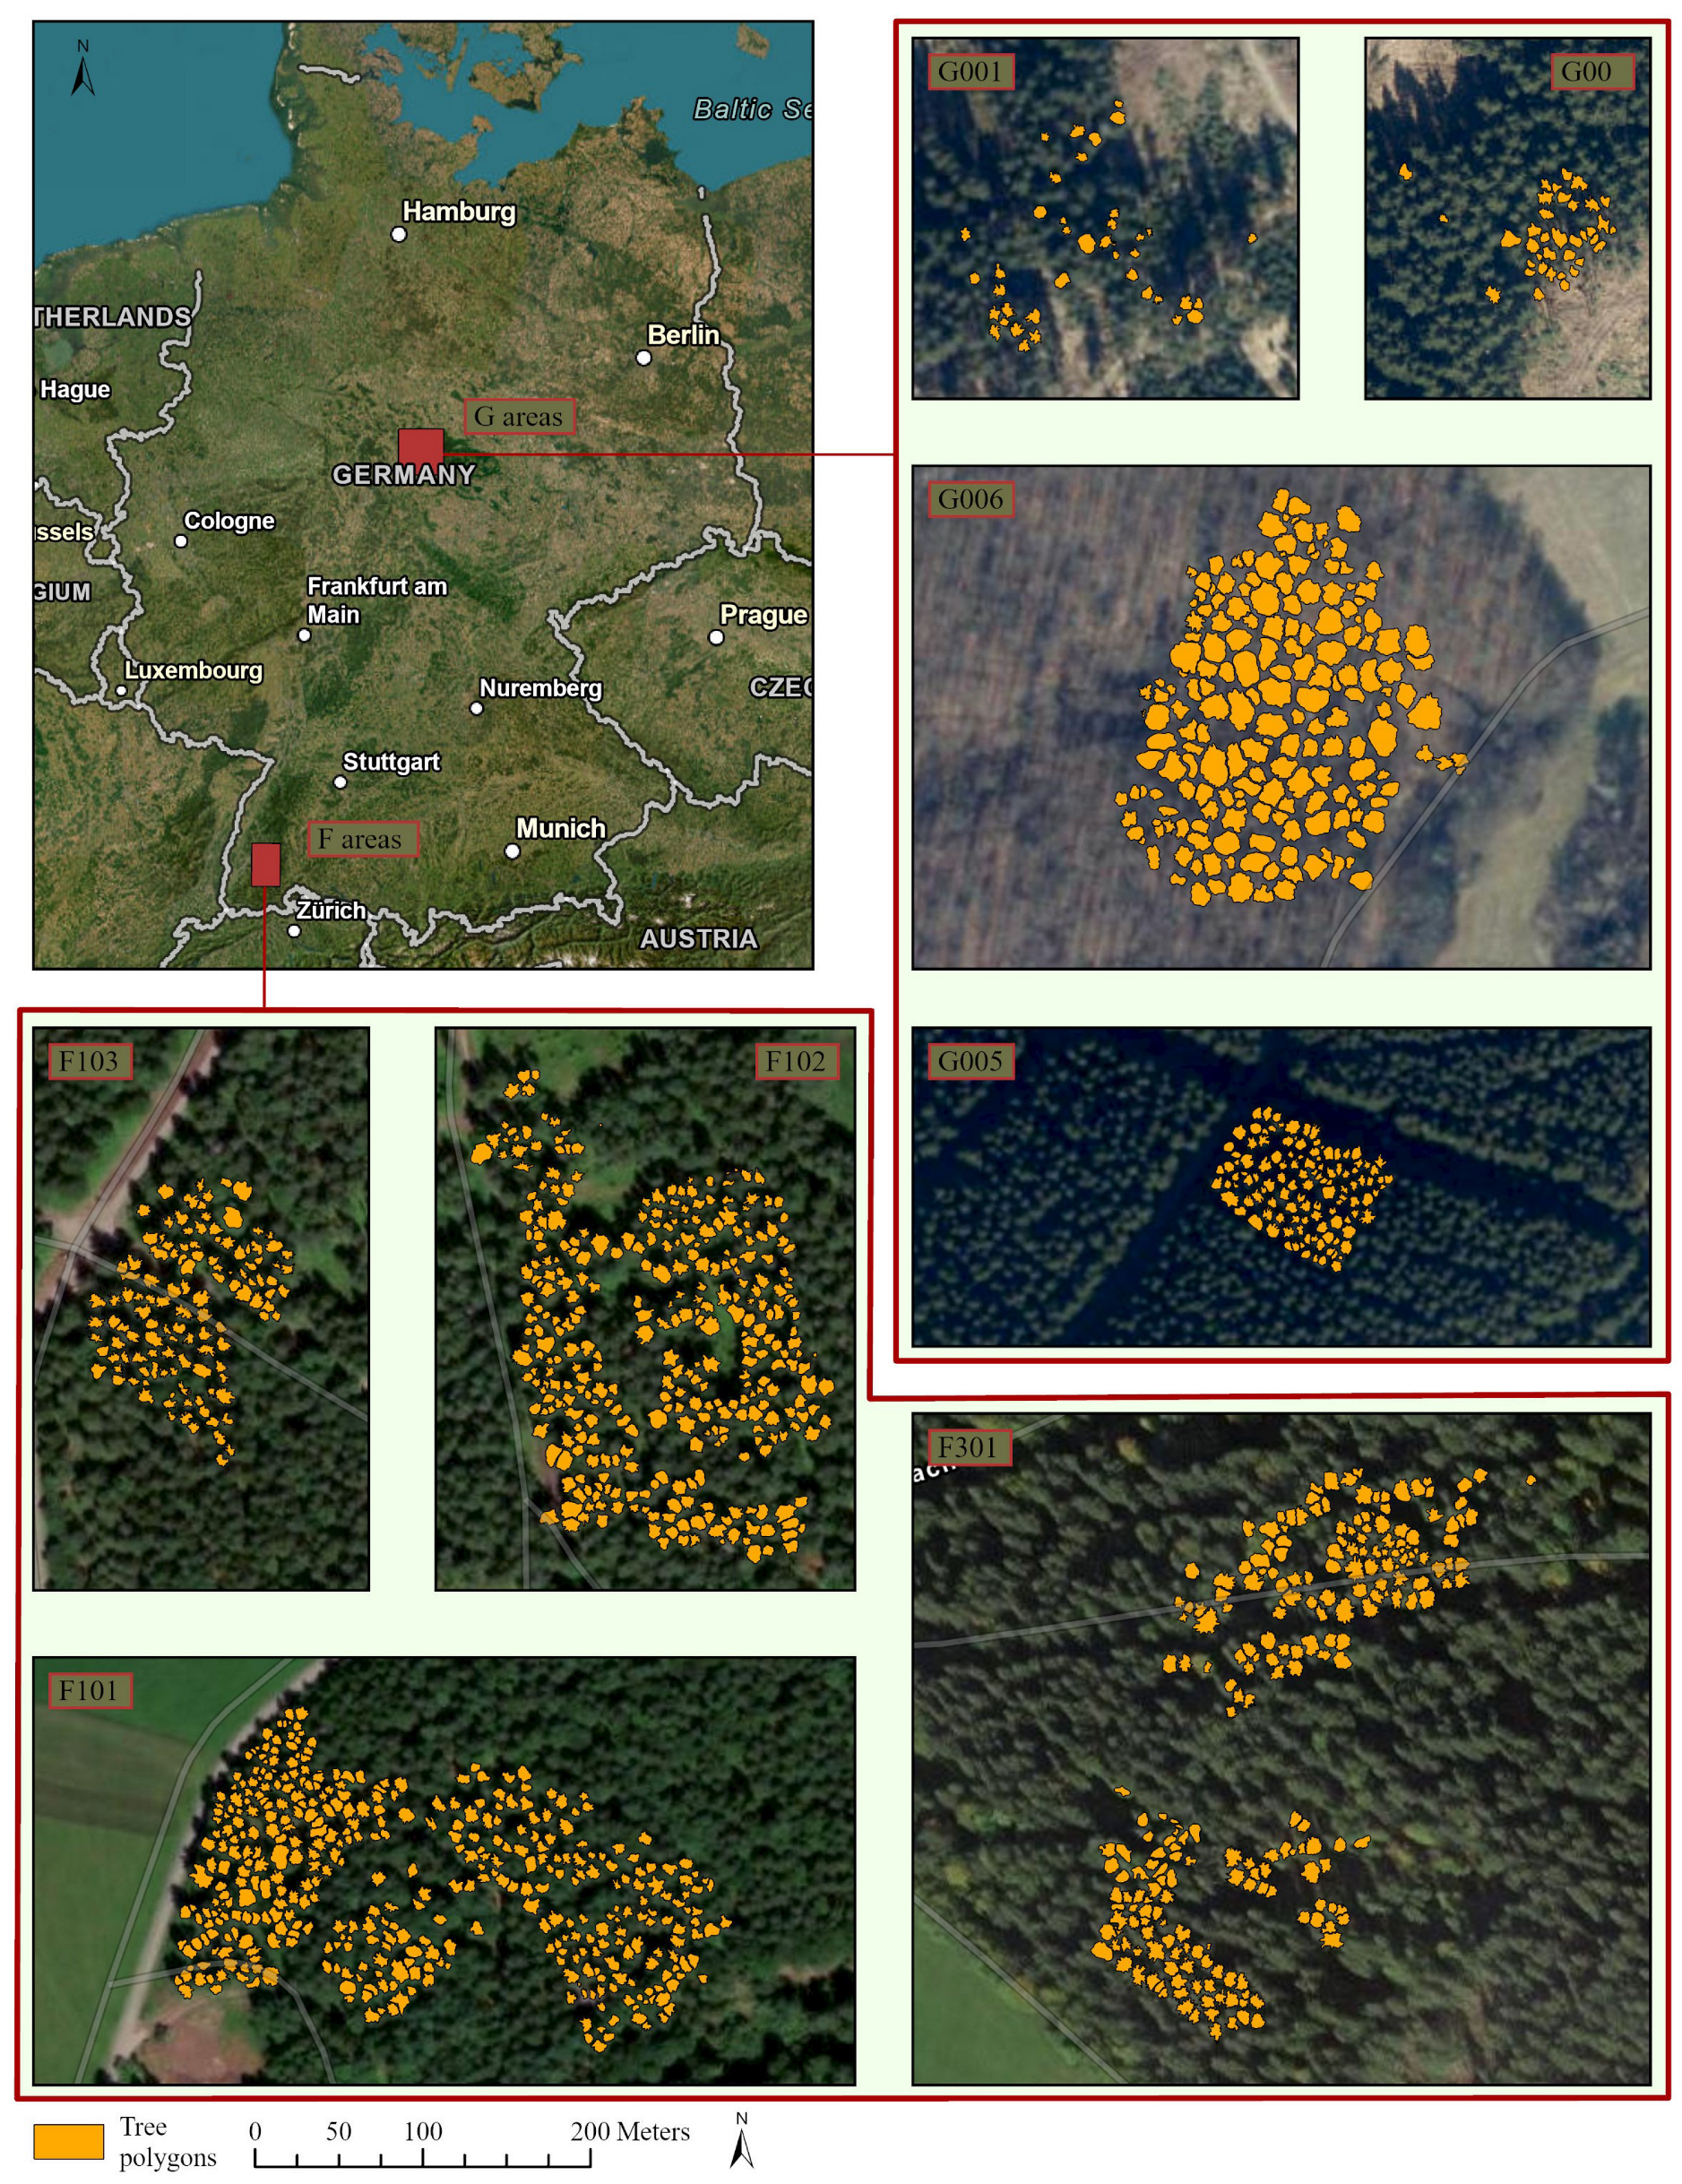
The study area comprises two regions in Germany: the Black Forest in the southwest of Baden-Wuerttemberg (F areas in Figure 2) and the Harz region, also including one forest area near Göttingen in Lower Saxony (G areas in Figure 2). Each area comprises several forest plots where the data were collected. Data collection took place throughout the year, and more than 30 vitality and stem wood quality parameters were recorded. For this study, the overall crown vitality classification was used as dependent variable. The main vitality loss factor was drought-induced defoliation, while drought-induced discoloration of leaves or needles also occurred. Bark beetle infestation on the stem was associated with the two main drought stress symptoms, but the evaluation of stem parameters was not the subject of this study. The crown vitality classification consisted of a combined assessment of both main crown vitality loss factors and resulted in the definition of four distinct crown vitality categories: healthy, light, medium, and heavy damage (Figure 3). With one of the two factors being described as “light”, the resulting overall class is light damage, with both factors being positive, the assigned class is “medium damage”. The same decision rule was used to assign the “heavy damage” class. Two staff members were intensively trained on the task and double-checked among each other to achieve repeatable assessment results. The UAV flight campaign in the Harz area was conducted during the same week as the ground assessment because of rapidly advancing forest vitality loss that did not allow for a delay. The Black Forest stands were more stable, and the time lag between ground survey and drone flight was one to three weeks. Only stands with early damage symptoms were investigated in this study in order to assess the potential of early forest stand stabilizing measures according to the legally binding principles of integrated plant protection. Thus, no conifer tree showing the yellow or even red crown stage, which is the intense discoloration that appears weeks to a month after a bark beetle infestation, was included in the study. However, the spruce trees in the Harz region especially showed drought-induced needle loss at crown level and bark beetle infestation at stem level. All plots included in the study are shown at the same scale in Figure 2 and are labeled as F101, F102, F103, and F301 (Black Forest area) and G006, G001, G004, and G005 for Göttingen and the Harz region, respecively. All sampled trees are listed in Table 1.

Figure 2.
Study area: Location in Germany and tree polygons on each plot (author’s illustration, Esri).
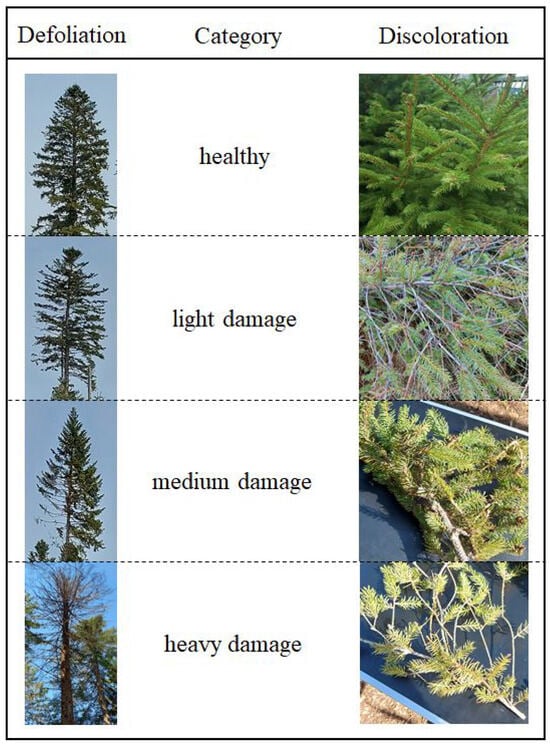
Figure 3.
Classification criteria for tree health status in the field.

Table 1.
Number of segmented trees for each subsection split into deciduous and coniferous trees and total.
The plots in the Black Forest are dominated by conifers and consist mainly of spruce. A few larches or white firs can also be found. The few deciduous trees are sycamore maple and beech trees. The three subareas from the Harz region are also dominated by spruce trees. The fourth area from the Göttinger Forest contains more deciduous trees, mainly beech and oak. In total, spruce trees make up almost three quarters of all sampled trees and are particularly susceptible to bark beetle gradation due to their flat root system, which makes them particularly vulnerable to severe drought stress induced by climate change [44].
During fieldwork, each tree was individually located using a base–rover RTK-GPS (Zenith 35 Pro, Geomax AG, Widnau, Zwitzerland), and data were collected using a mobile application (con terra GmbH, Münster, Germany). Information about the tree class, tree species, diameter at breast height (BHD), health status of the trunk and crown, and symptoms of damage or disease were recorded for each tree. All data were collected during extensive fieldwork in the years 2022 and 2023. The tree polygons shown in Figure 2 were derived from the ground truth data (GTD) (see Section 3.2).
UAV data were collected in parallel during 2022 and 2023 at a flight height of 15 to max 50 m above crown level using a DJI Matrice 300 RTK drone system (DJI, Shenzhen, China). The picture overlap was set to 90 percent front and 80 percent side. The flight speed was 1 m/s to enhance picture sharpness. A Micasense RedEdge MX camera (AGEagle Aerial Systems Inc., Wichita, USA) was used in parallel with a MicaSense Altum multispectral camera (AGEagle Aerial Systems Inc., Wichita, USA). The first camera had a ground sample distance (GSD) of 1.04–3.47 cm at 15–50 m above ground level (AGL). The second camera had a GSD of 0.65–2.16 cm at 15–50 m AGL. An additional thermal sensor in the second camera recorded pictures at a GSD of 10.17–33.9 cm at 15–50 m AGL. The spectral characteristics and resolutions of all sensors are listed in Table 2.
Table 2.
Bands with number, name, center wavelength in nm, and bandwidth in nm of the RedEdge MX and the MicaSense Altum sensors (Ag Eagle Aerial Systems Inc., Wichita, KS, USA 2020).
3.2. Data Preprocessing
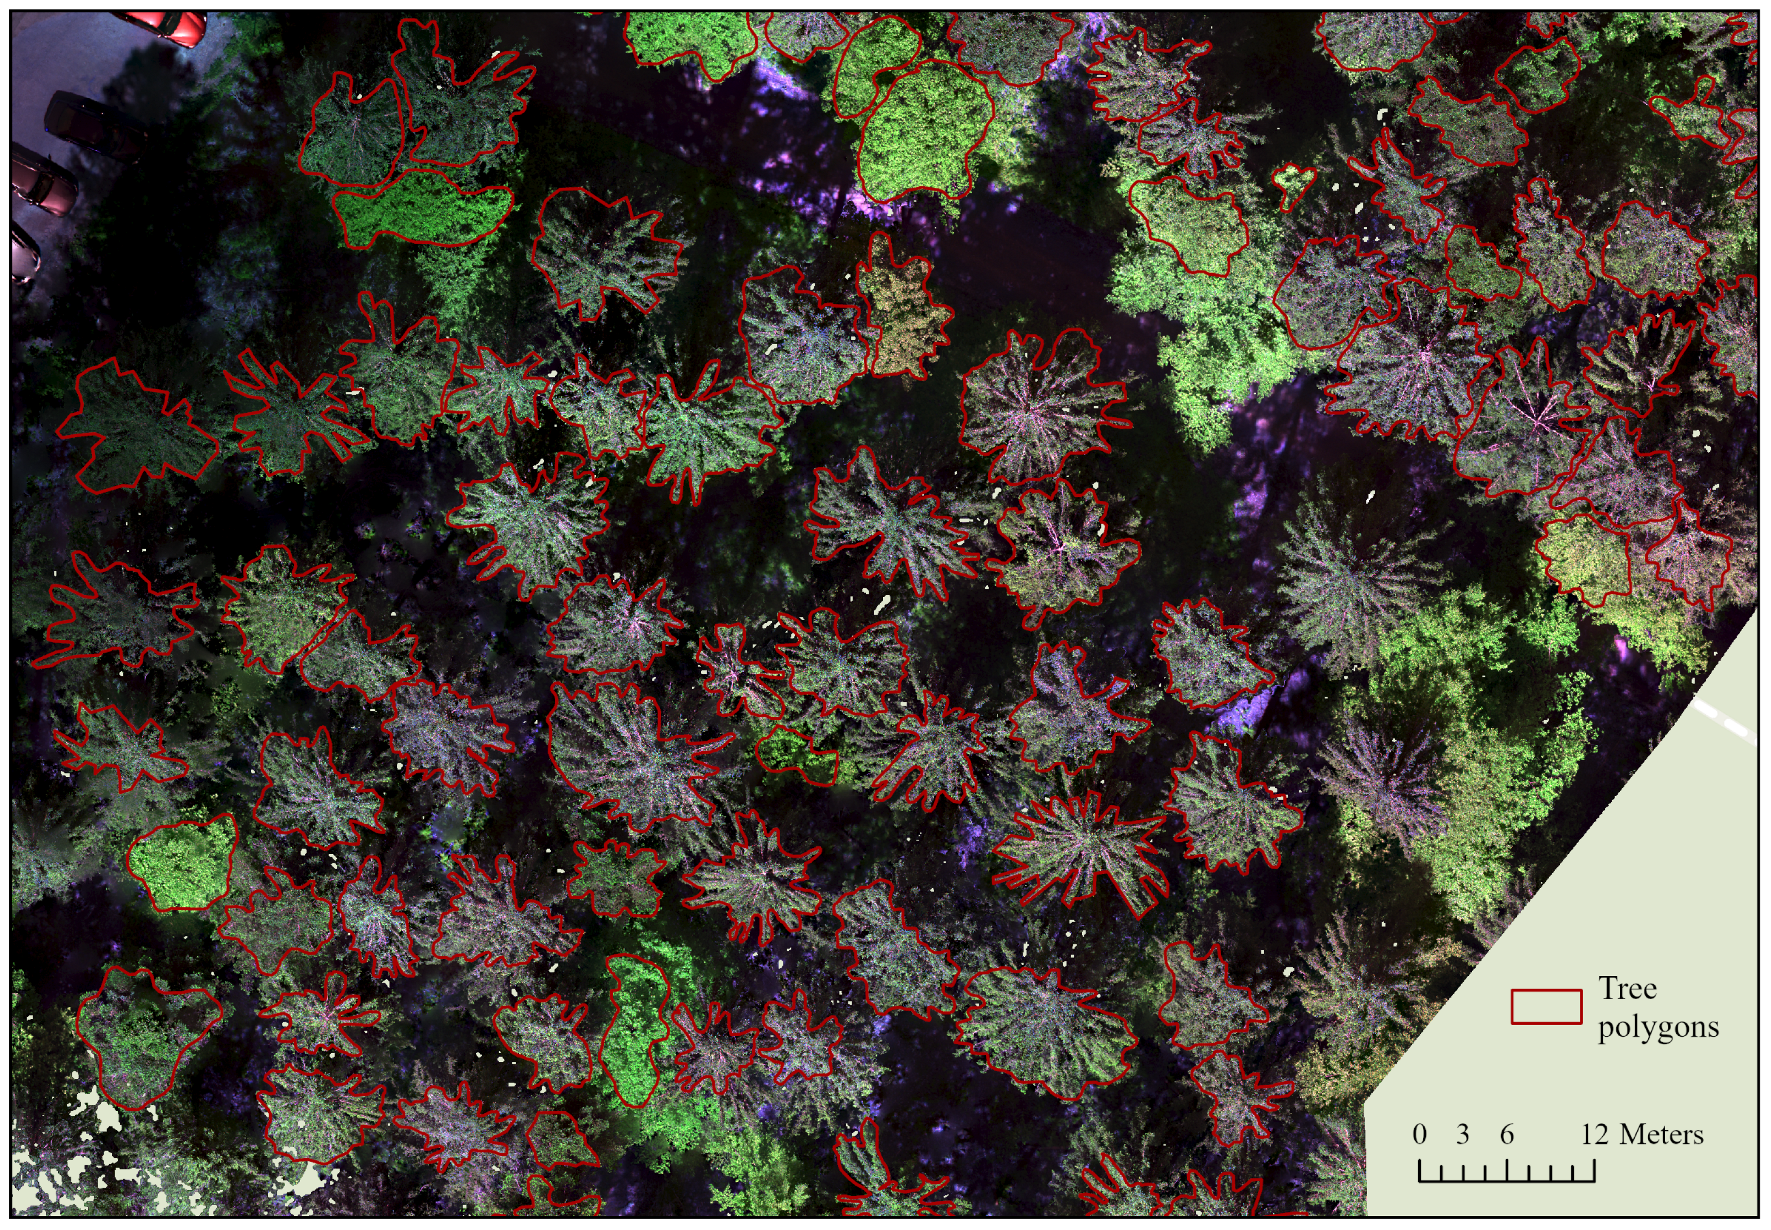
In the first step, orthophotos for the individual forest areas were generated from the UAV flight images using the software Agisoft Metashape (Agisoft LCC, St. Petersburg, Russia). The workflow comprised alignment, dense cloud generation, DEM generation, and orthophoto generation. The respective parameters were optimized in previous trials. An example of an orthophoto with corresponding labels is shown in Figure 4. The images were exported as GEO-TIF files and contained spectral information from the five or six bands, depending on the camera. Only the first five bands were taken into account in this study, as images from both cameras were to be processed together, and the models can only learn to generalize from comparable camera settings. The correct crown extent for each tree collected using our mobile application was then manually digitized in ArcGIS Pro to create accurate and high-quality training data. In total, 1473 single-tree segments were generated for the eight plots (see Table 1).
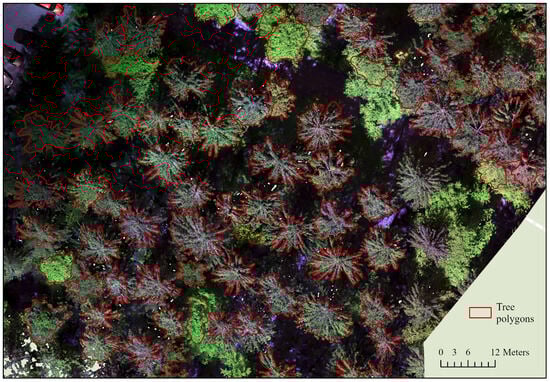
Figure 4.
Section of area F103 as an example of the matching of the segmented polygons to the generated multispectral orthophotos (authors illustration, Esri).
To evaluate how well different degrees of damage and different tree types (decidious vs. coniferous) can be classified, we created three different datasets, exported corresponding tiles and labels for each set, and conducted extensive preprocessing (compare Table 3). The tiles were created from the orthopotos and converted into Python arrays for deep learning. As this is done by converting pixel values into cells of a Python array, the different spatial resolution does not pose a problem, but will provide more variability to the algorithm to better learn spatial features at slightly different scales. This also corresponds well to the practical requirements in the field, where a robust analysis towards different resolutions is needed, because tree heights can differ in one stand, and slopes will always have an effect on the GSD in the orthophotos. (1) The first dataset was for binary classification between damaged and healthy trees, without consideration of degree of damage or tree species. (2) For a second experiment, we created a dataset with three classes to reflect the degree of damage: light, heavy, or no damage. (3) For our final experiment, we created four classes with coniferous (healthy/damaged) and deciduous (healthy/damaged) trees. To create the datasets, we used the “Export Training Data for Deep Learning” tool in ArcGIS Pro (ESRI, California, United States) with the following parameters: a tile size of 512 × 512, a stride of 256, the ImageNet metadata format, and the Bounding Box option. Further preprocessing was conducted using Python in a Jupyter Notebook environment. Data were first split into training, validation, and test data (70, 20, and 10 percent, respectively). As the classes were unevenly distributed, this could have led to poor modeling results (e.g., [45]). To avoid this problem, we performed geometric data augmentation on the underrepresented classes: Images from the training dataset were randomly rotated 90, 180, or 270 degrees and also flipped horizontally to acquire a more balanced dataset. All data were normalized, and additional vegetation indices (NDVI, NDVIre) were calculated to test whether models performed well using vegetation indices instead of raw data (compare Equations (1) and (2)). Figure 5 shows an NDVI image (a) and an NDVIre image (b) for a damaged tree sample.
Table 3.
Statistics for the datasets: number of images for the different classes in the training, validation, and test datasets after data augmentation.
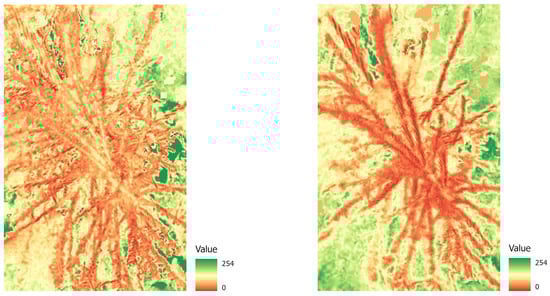
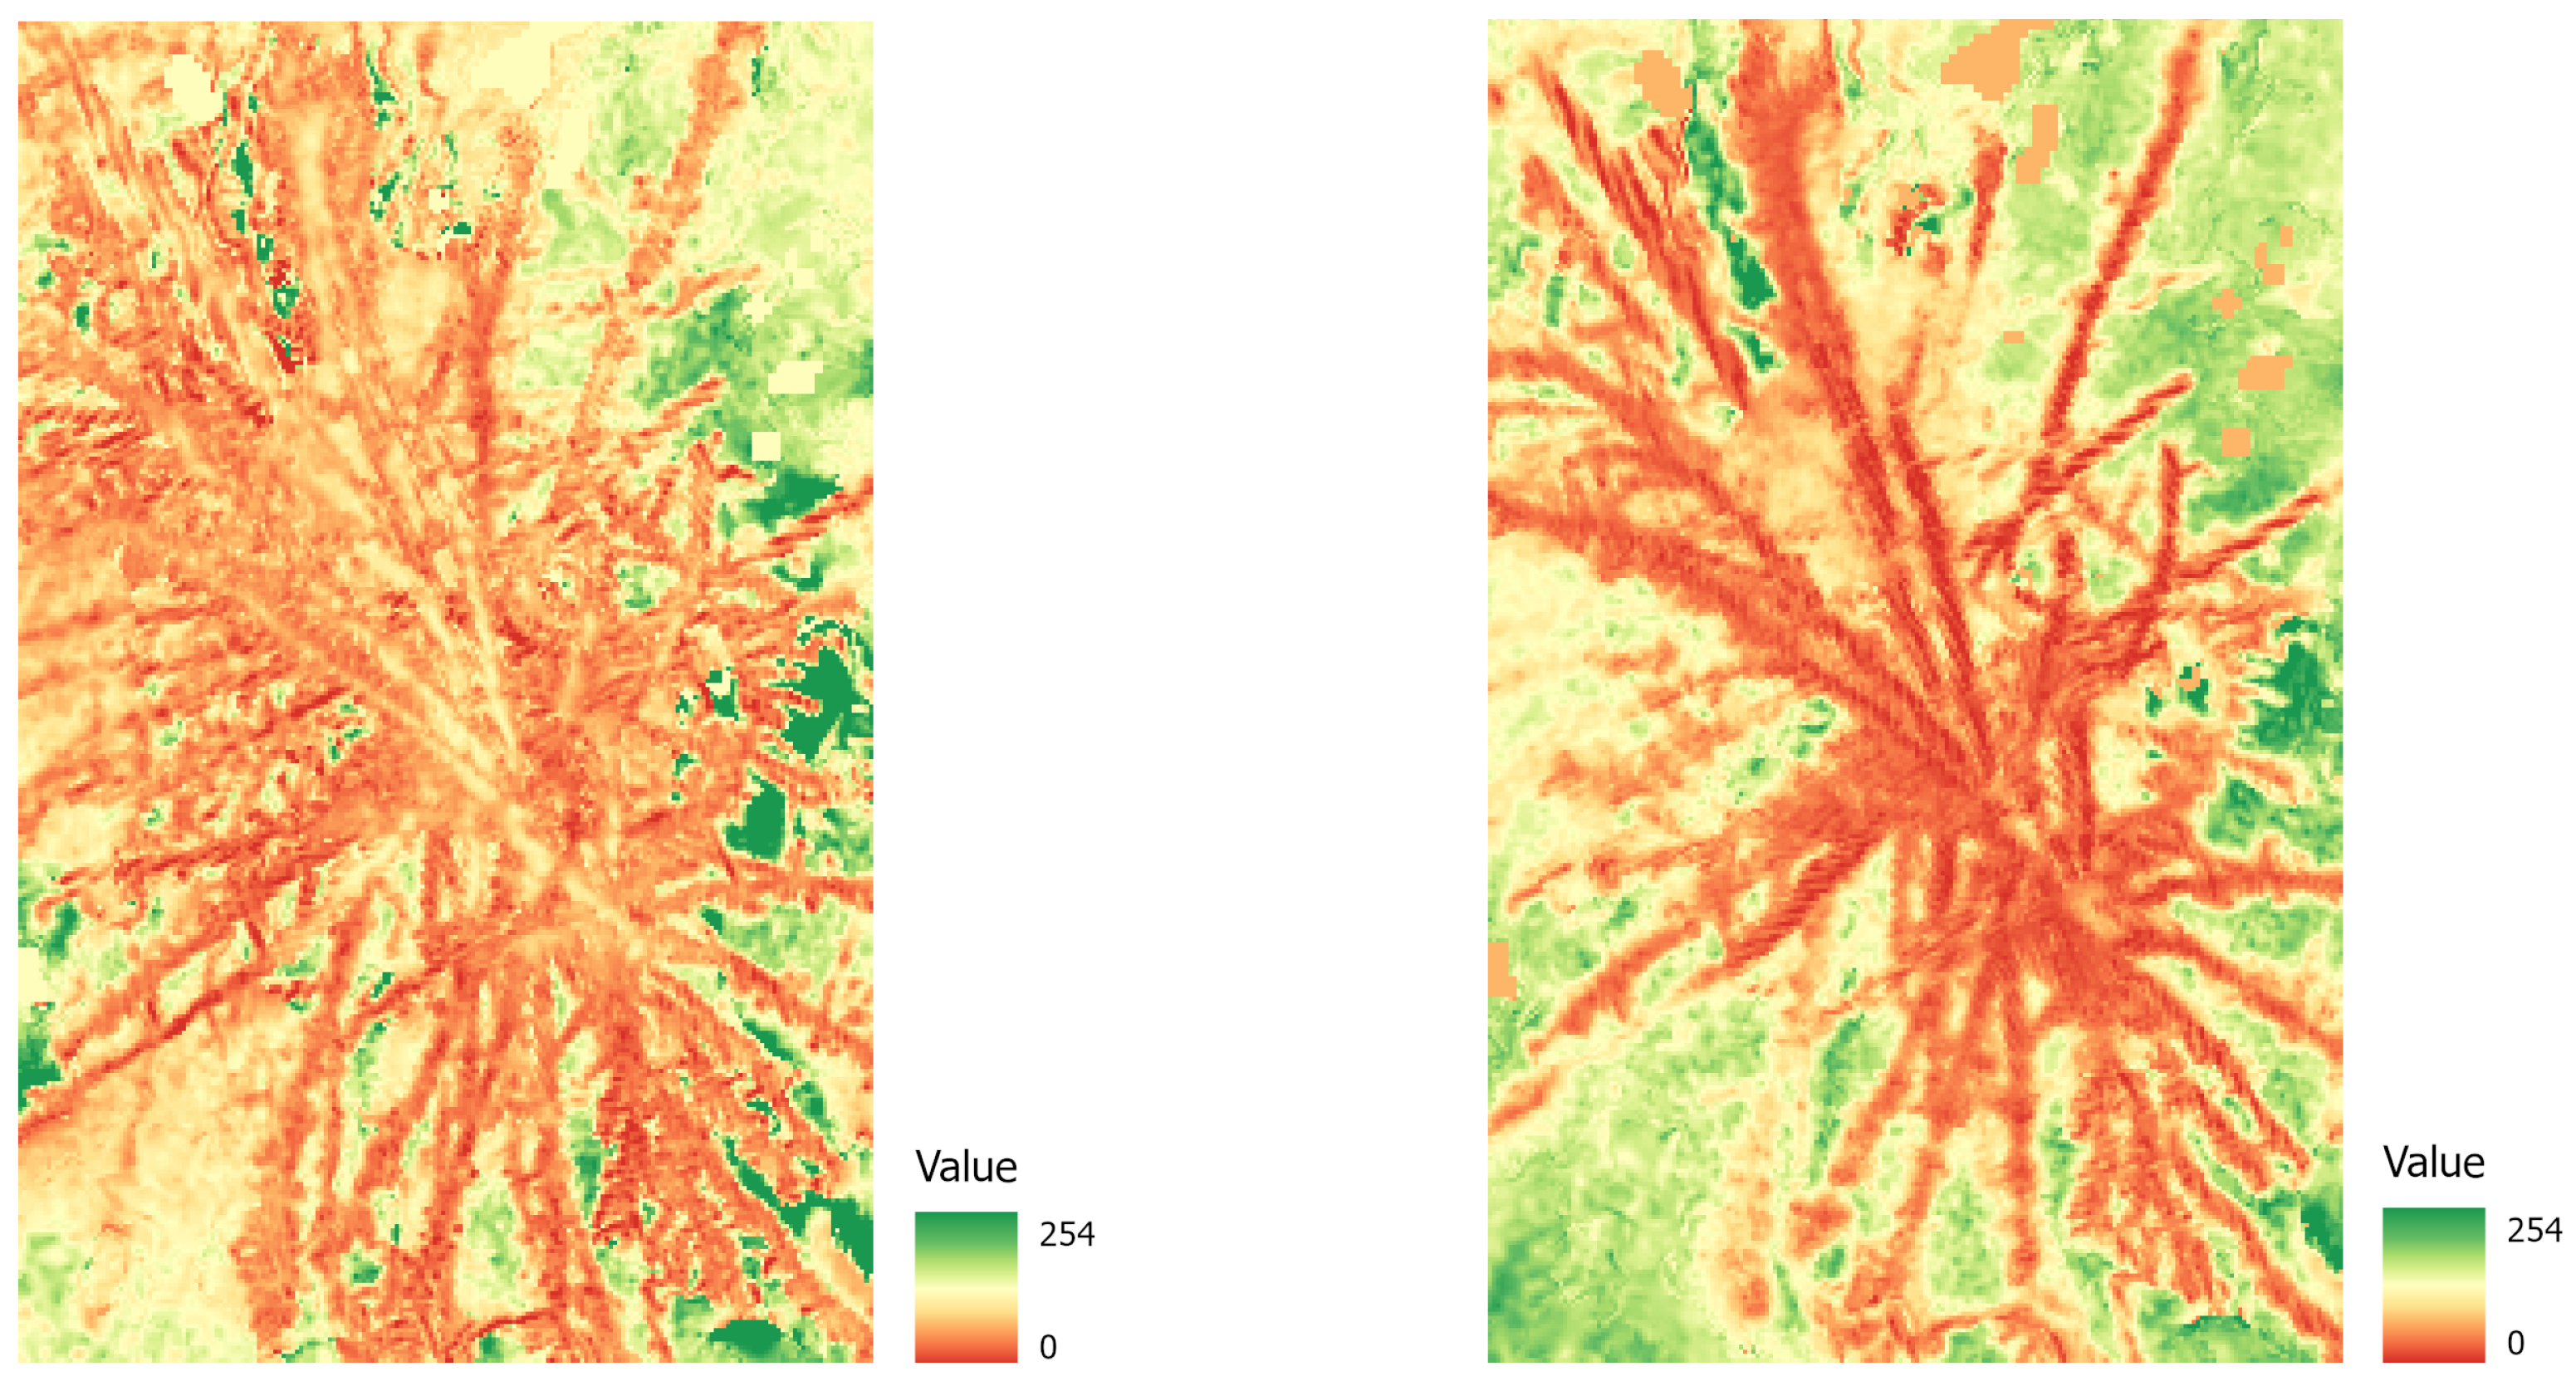
Figure 5.
Example of a damaged tree crown: NDVI image (left) and NDVIre image (right). Note that values of all bands are scaled from 0 to 254 (conversion to 8 bit).
3.3. Experiments Using Different CNNs and Random Forests for Tree Health Classification
Based on the the three different datasets described in the previous section, we conducted several experiments using classical machine learning (RFs), as well as different CNN architectures (ResNet50, VGG16, and Inception-v3). We used the RFs class of the sklearn library, PyTorch, and torchvision as libraries for deep learning. All experiments were coded in Jupyter Notebooks and can be reproduced on new data. Processing was conducted on a sysGen/devCUBE Deep-Learning Workstation with two NVIDIA RTX A6000 GPUs (sysGen, Am Hallacker 48, 28327 Bremen). An overview of all experiments and parameters used is shown in Table 4. Hyperparameter tuning was done using the validation data to assess the accuracies. The test dataset was only used for reporting the final results.
Table 4.
All experiments with the parameters used for each dataset.
We chose the RFs algorithm [46], as it is a widely and successfully used ensemble classifier that is well suited for a comparison with deep CNNs. While it is very flexible and robust due to its structure, a major challenge is that it is a time-intensive process. We used grid search for hyperparameter tuning and the results using the best set of parameters are reported in Table 4. The RFs classifier was used as binary classifier and for assessing damage on deciduous vs. coniferous trees on (1) RGBI images, (2) on NDVI, and (3) on NDVIre images. One of the most commonly used models is VGG16, which was originally proposed by [47]. The VGG16 architecture is based on very small 3 × 3 convolution filters and has 16 weighted layers. We used the pretrained model from the PyTorch library. Hyperparameter tuning was performed using grid search. A batch size of 64 and a learning rate of 0.001 were used to train the model. We only used VGG16 for binary classification, as results were not comparable to other architectures.
Furthermore, several experiments were conducted using ResNet [48]. These models address the problem of accuracy degradation when stacking multiple layers by using building blocks and the so-called bottleneck building blocks, which are used for ResNet50 and deeper architectures. These blocks cause the activation of one layer to be added to the output of a later layer. Other advantages of the model include its stability and effectiveness, especially when dealing with small datasets. It can be trained relatively quickly compared to other CNNs [49]. We used the pretrained (ImageNet dataset [50]) ResNet50 and ResNet101 models from the open source library PyTorch [51]. Hyperparameter tuning was performed using grid search. The best parameters were chosen for the final model. All experiments on the three different datasets are listed in Table 4.
The third architecture investigated is the Inception-v3 model. It was proposed in the work Rethinking the Inception Architecture for Computer Vision [52] and has a total of 42 layers. The main features of the model are small and asymmetric convolutions, the use of auxiliary classifiers, and grid size reduction of the feature maps. The model is built from different convolution layers, pooling layers, inception blocks, and a softmax classifier. We conducted all experiments (Table 4) using the Pytorch implementation of the model using grid search for hyperparameter tuning. Experiments included training on RGBI, NDVI, and NDVIre images for binary classification. Parameters used for each experiment are listed in Table 4.
4. Results
In this section, we present the results from all the machine learning experiments described in the previous section following the same order. All the results are summarized in Table 5, Table 6 and Table 7 (binary classification, tree health and species classification, and degree of damage). Confusion matrices are shown in Figure 6, Figure 7 and Figure 8.
4.1. Binary Classification
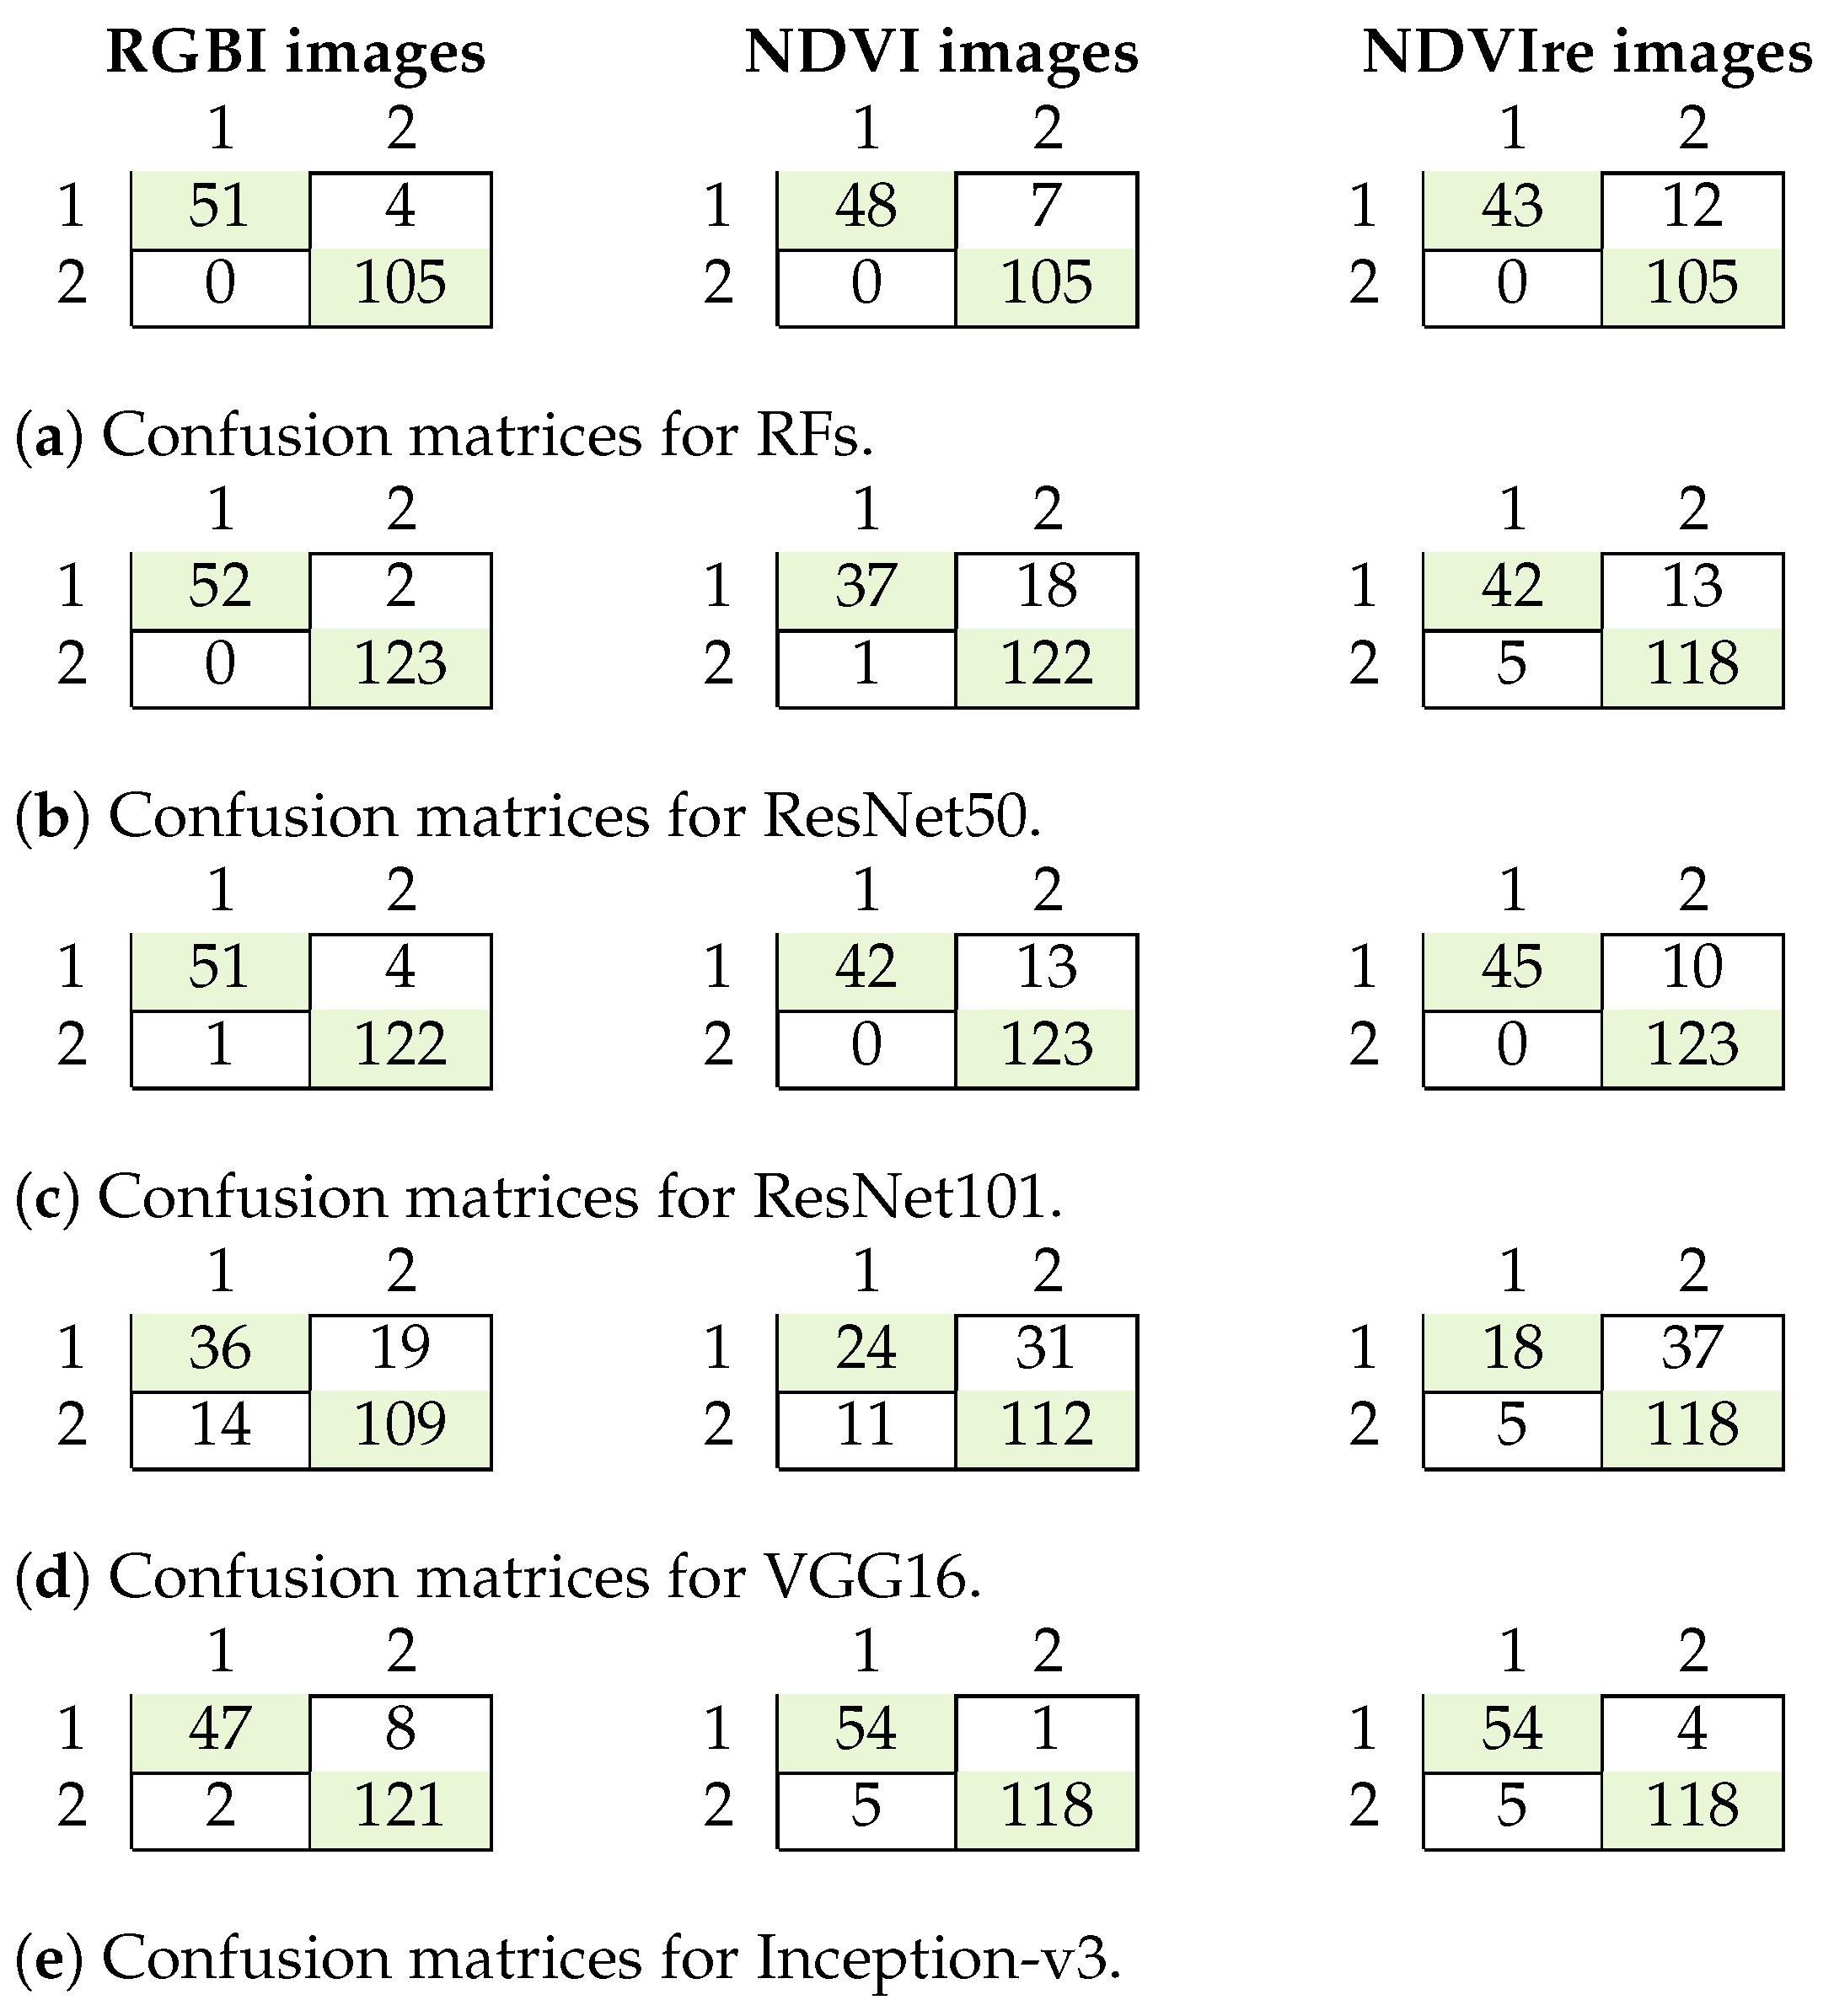
The results for all the experiments are summarized in Table 5, and the confusion matrices are shown in Figure 6. The RFs algorithm performed well on the detection of damaged trees, with an overall accuracy and F1 score of around 0.9 for all input datasets. Its precision and recall were both high, though not all damaged trees were detected (recall between 0.78 and 0.93), and some healthy trees were wrongly classified as damaged. This was particularly true for the experiment using the NDVIre images instead of RGBI data, with a recall of only 0.78. The best results were achieved using the RGBI images, with an F1 score of 0.97. These results were only surpassed by ResNet50 and ResNet101, with F1 scores of 0.99 and 0.97 on the RGBI data, respectively. For the NDVI and NDVIre input data, the F1 scores dropped to around 0.8 for ResNet50. VGG16 had the worst performance on all the datasets, with a maximum F1 score of 0.78 using RGBI images, which was worse for all other datasets. The precision and recall were both inferior to the RFs algorithm and all other CNNs, with a maximum precision of 0.72 for detecting damaged trees. As VGG16 showed the lowest performance for binary classification with many misclassified samples, it was excluded in further experiments.
Table 5.
Results for the binary classification with all models and data.
Table 5.
Results for the binary classification with all models and data.
| Model | Data | Accuracy | Precision Damage | Recall Damage | Average F1 Score |
|---|---|---|---|---|---|
| RF | RGBI | 0.97 | 1.00 | 0.93 | 0.97 |
| NDVI | 0.96 | 1.00 | 0.87 | 0.95 | |
| NDVIre | 0.93 | 1.00 | 0.78 | 0.91 | |
| VGG16 | RGBI | 0.81 | 0.72 | 0.65 | 0.78 |
| NDVI | 0.76 | 0.69 | 0.44 | 0.69 | |
| NDVIre | 0.76 | 0.78 | 0.33 | 0.66 | |
| ResNet50 | RGBI | 0.99 | 1.00 | 0.96 | 0.99 |
| NDVI | 0.89 | 0.97 | 0.67 | 0.86 | |
| NDVIre | 0.90 | 0.89 | 0.76 | 0.88 | |
| ResNet101 | RGBI | 0.97 | 0.98 | 0.93 | 0.97 |
| NDVI | 0.93 | 1.00 | 0.76 | 0.91 | |
| NDVIre | 0.94 | 1.00 | 0.82 | 0.93 | |
| Inception-v3 | RGBI | 0.94 | 0.96 | 0.85 | 0.93 |
| NDVI | 0.97 | 0.92 | 0.98 | 0.96 | |
| NDVIre | 0.95 | 0.91 | 0.93 | 0.94 |
For Inception-v3, the overall test accuracies and F1 scores were high, with more than 0.93 for all datasets. The precision values for damaged trees were 0.96, 0.92, and 0.91, respectively, thereby indicating only some misclassified healthy trees. The recalls were 0.85, 0.98, and 0.93, respectively, thus indicating that not all damaged trees were detected. As Inception-v3 showed slightly worse results than ResNet, it was also not further investigated. The accuracies were similar for the different input datasets.
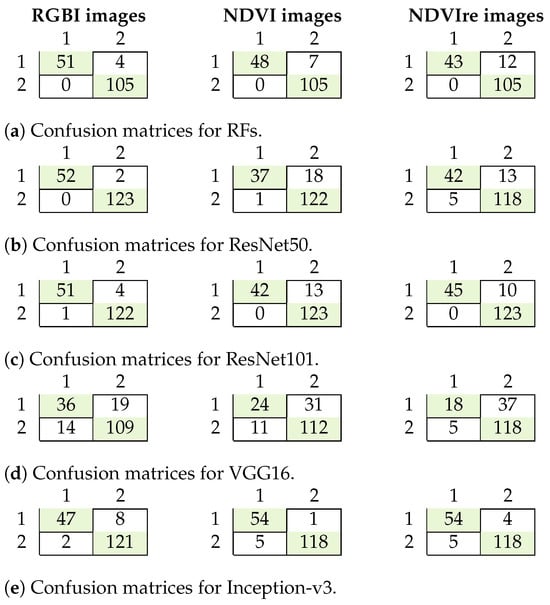
Figure 6.
Confusion matrices for binary classification with RFs (a), ResNet50 (b), ResNet101 (c), VGG16 (d), and Inception-v3 (e) 1: healthy trees; 2: damaged trees.
Figure 6.
Confusion matrices for binary classification with RFs (a), ResNet50 (b), ResNet101 (c), VGG16 (d), and Inception-v3 (e) 1: healthy trees; 2: damaged trees.
4.2. Tree Health and Species Classification
The results for tree health and species classification are summarized in Table 6, and confusion matrices are shown in Figure 7. The best results with an F1 score of more than 0.9 were achieved using ResNet50 and 101 on the NDVI data. This is in contrast to the previous classification task, where ResNet perfomed better on RGBI data and the F1 score was only 0.81 for that classification task. The RFs classifier had the worst performance, with a maximum F1 score of only 0.78. Erroneous classification occurred with the deciduous trees that were not well represented in the dataset. This was also where the other classifiers showed misclassification in the test data (Figure 7).
Table 6.
Results for tree health and species classification with all invstigated models and data.
Table 6.
Results for tree health and species classification with all invstigated models and data.
| RF | ResNet50 | ResNet101 | |||||||
|---|---|---|---|---|---|---|---|---|---|
| RGBI | NDVI | NDVIre | RGBI | NDVI | NDVIre | RGBI | NDVI | NDVIre | |
| Accuracy | 0.88 | 0.84 | 0.85 | 0.91 | 0.99 | 0.61 | 0.93 | 0.97 | 0.99 |
| Average F1 Score | 0.78 | 0.73 | 0.68 | 0.81 | 0.98 | 0.62 | 0.81 | 0.98 | 0.99 |
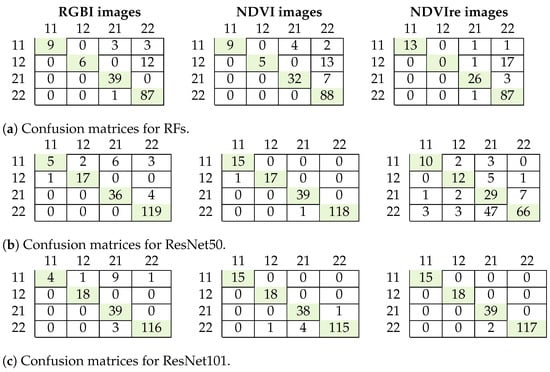
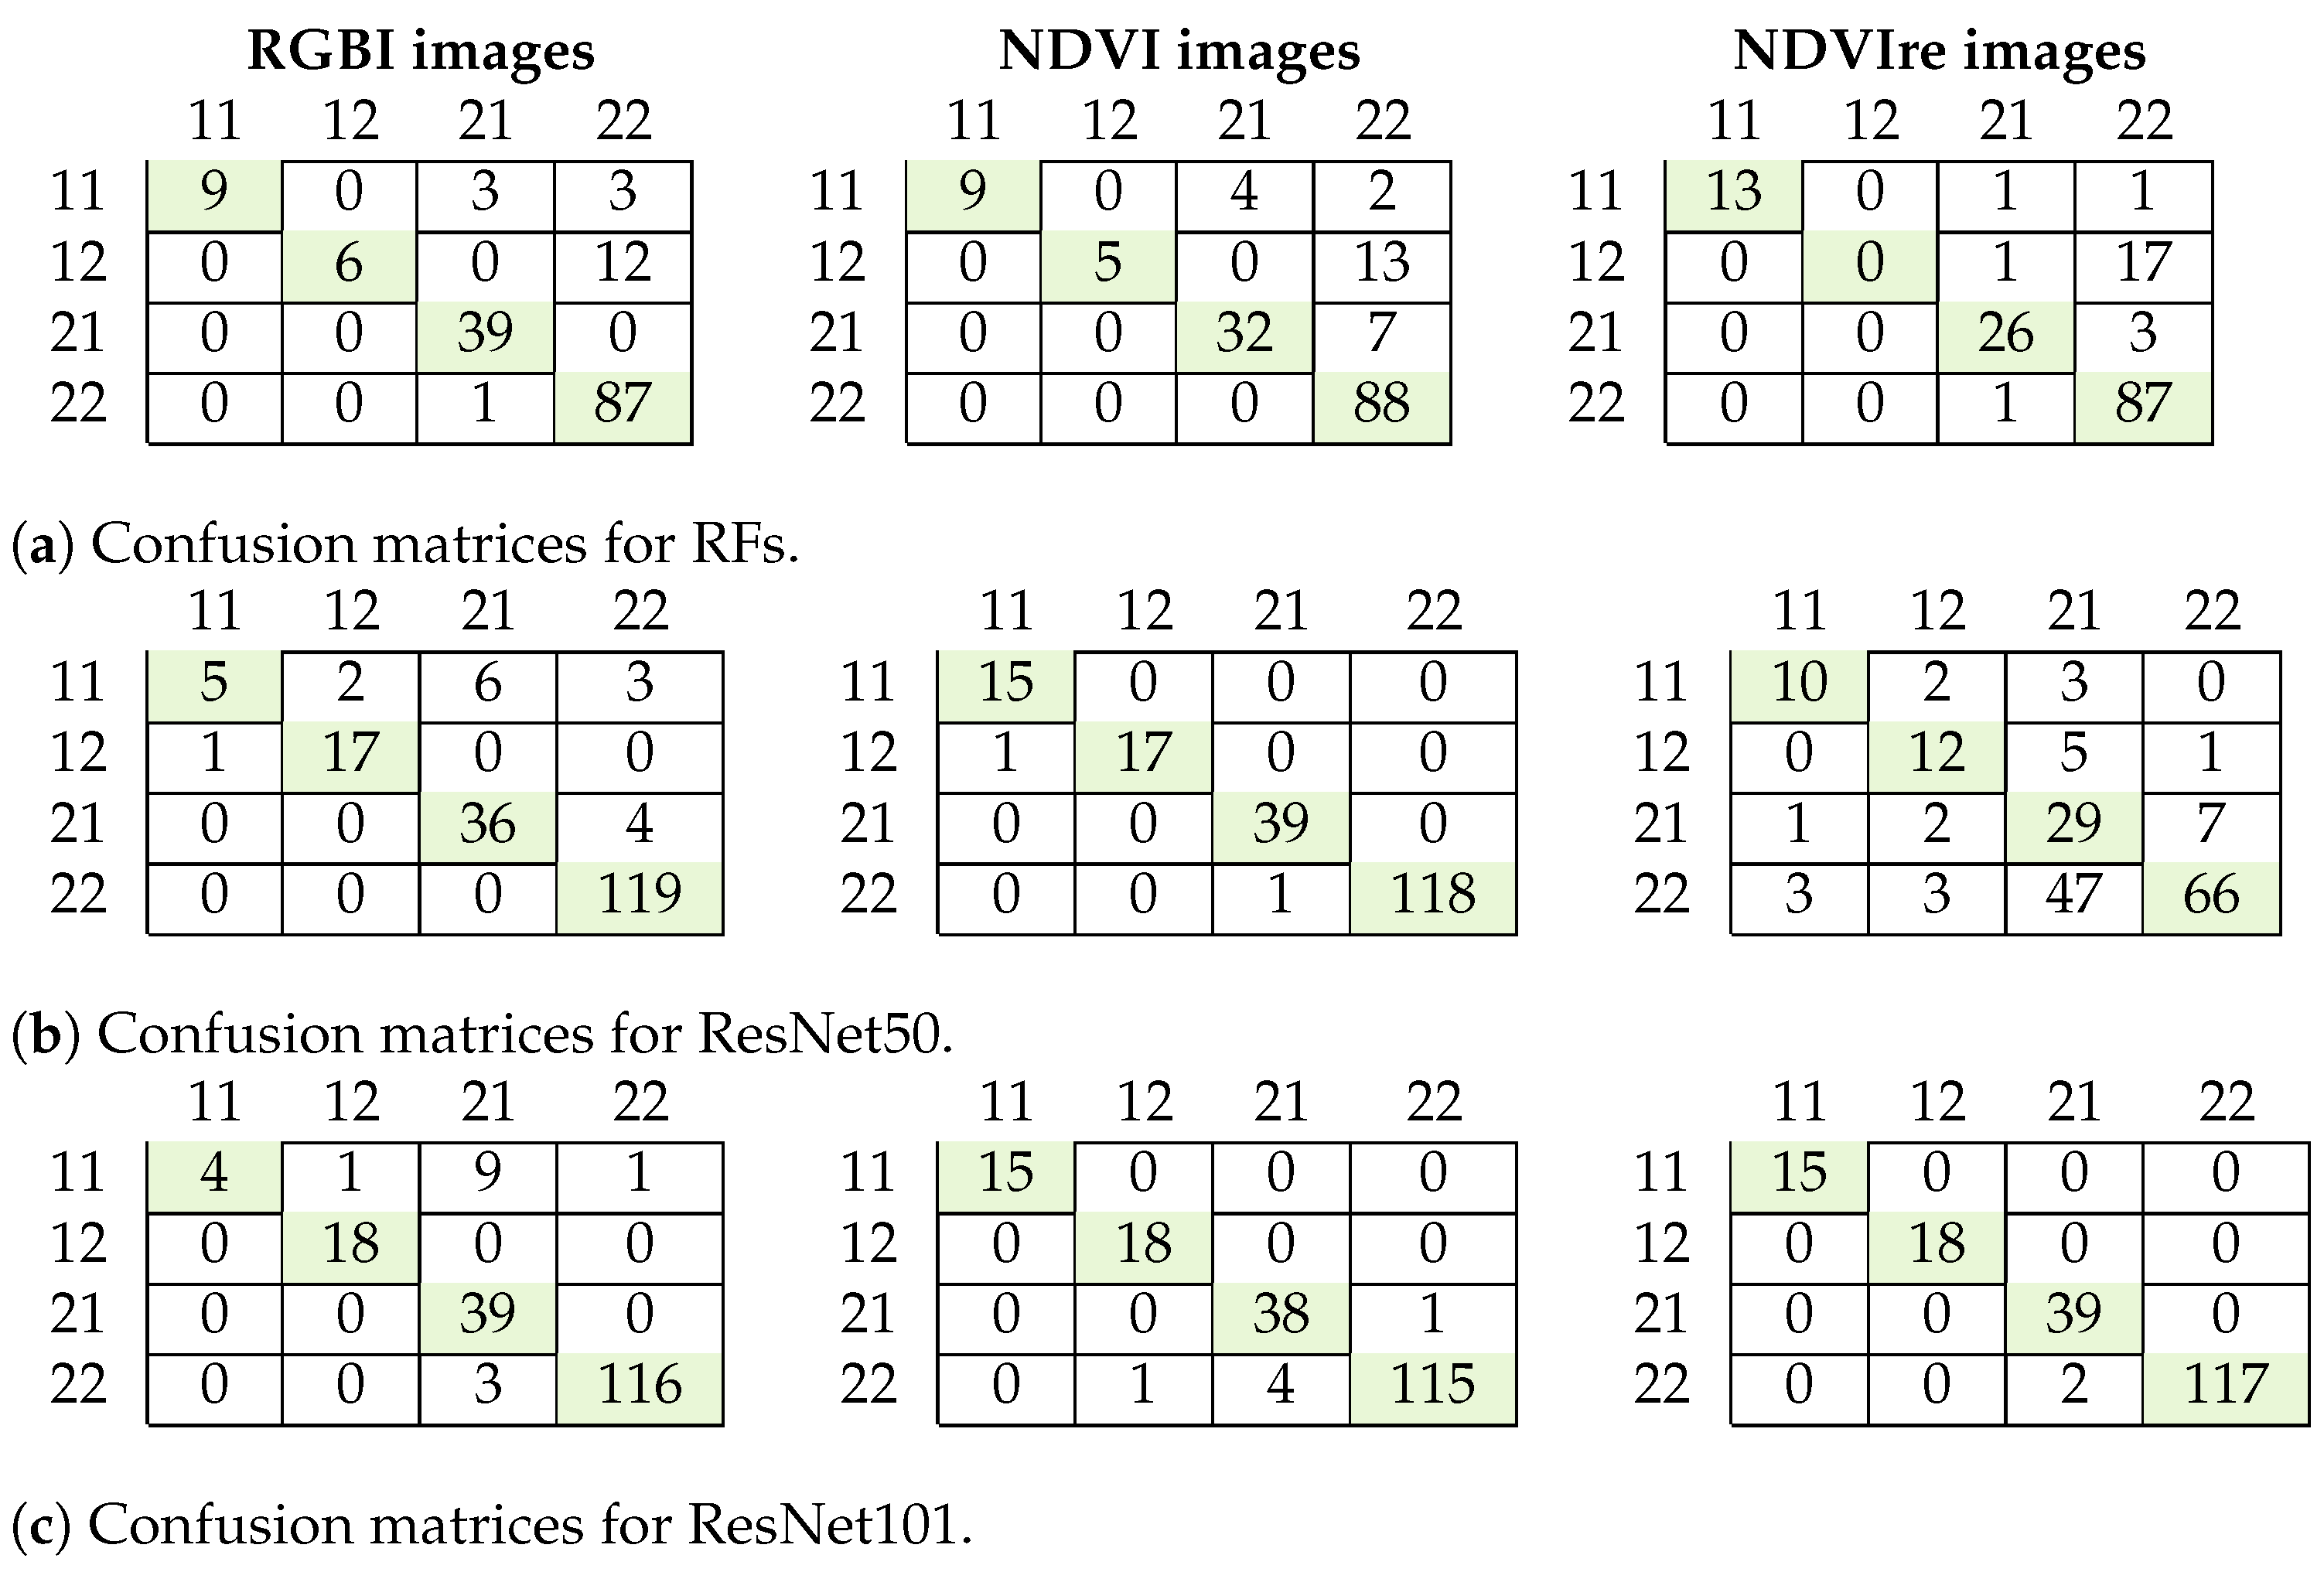
Figure 7.
Confusion matrices for tree health and species classification for the RFs algorithm (a), ResNet50 (b) and ResNet101 (c). 11: damaged deciduous trees; 12: healthy deciduous trees; 21: damaged coniferous trees; 22: healthy coniferous trees.
Figure 7.
Confusion matrices for tree health and species classification for the RFs algorithm (a), ResNet50 (b) and ResNet101 (c). 11: damaged deciduous trees; 12: healthy deciduous trees; 21: damaged coniferous trees; 22: healthy coniferous trees.
4.3. Classification of the Degree of Damage
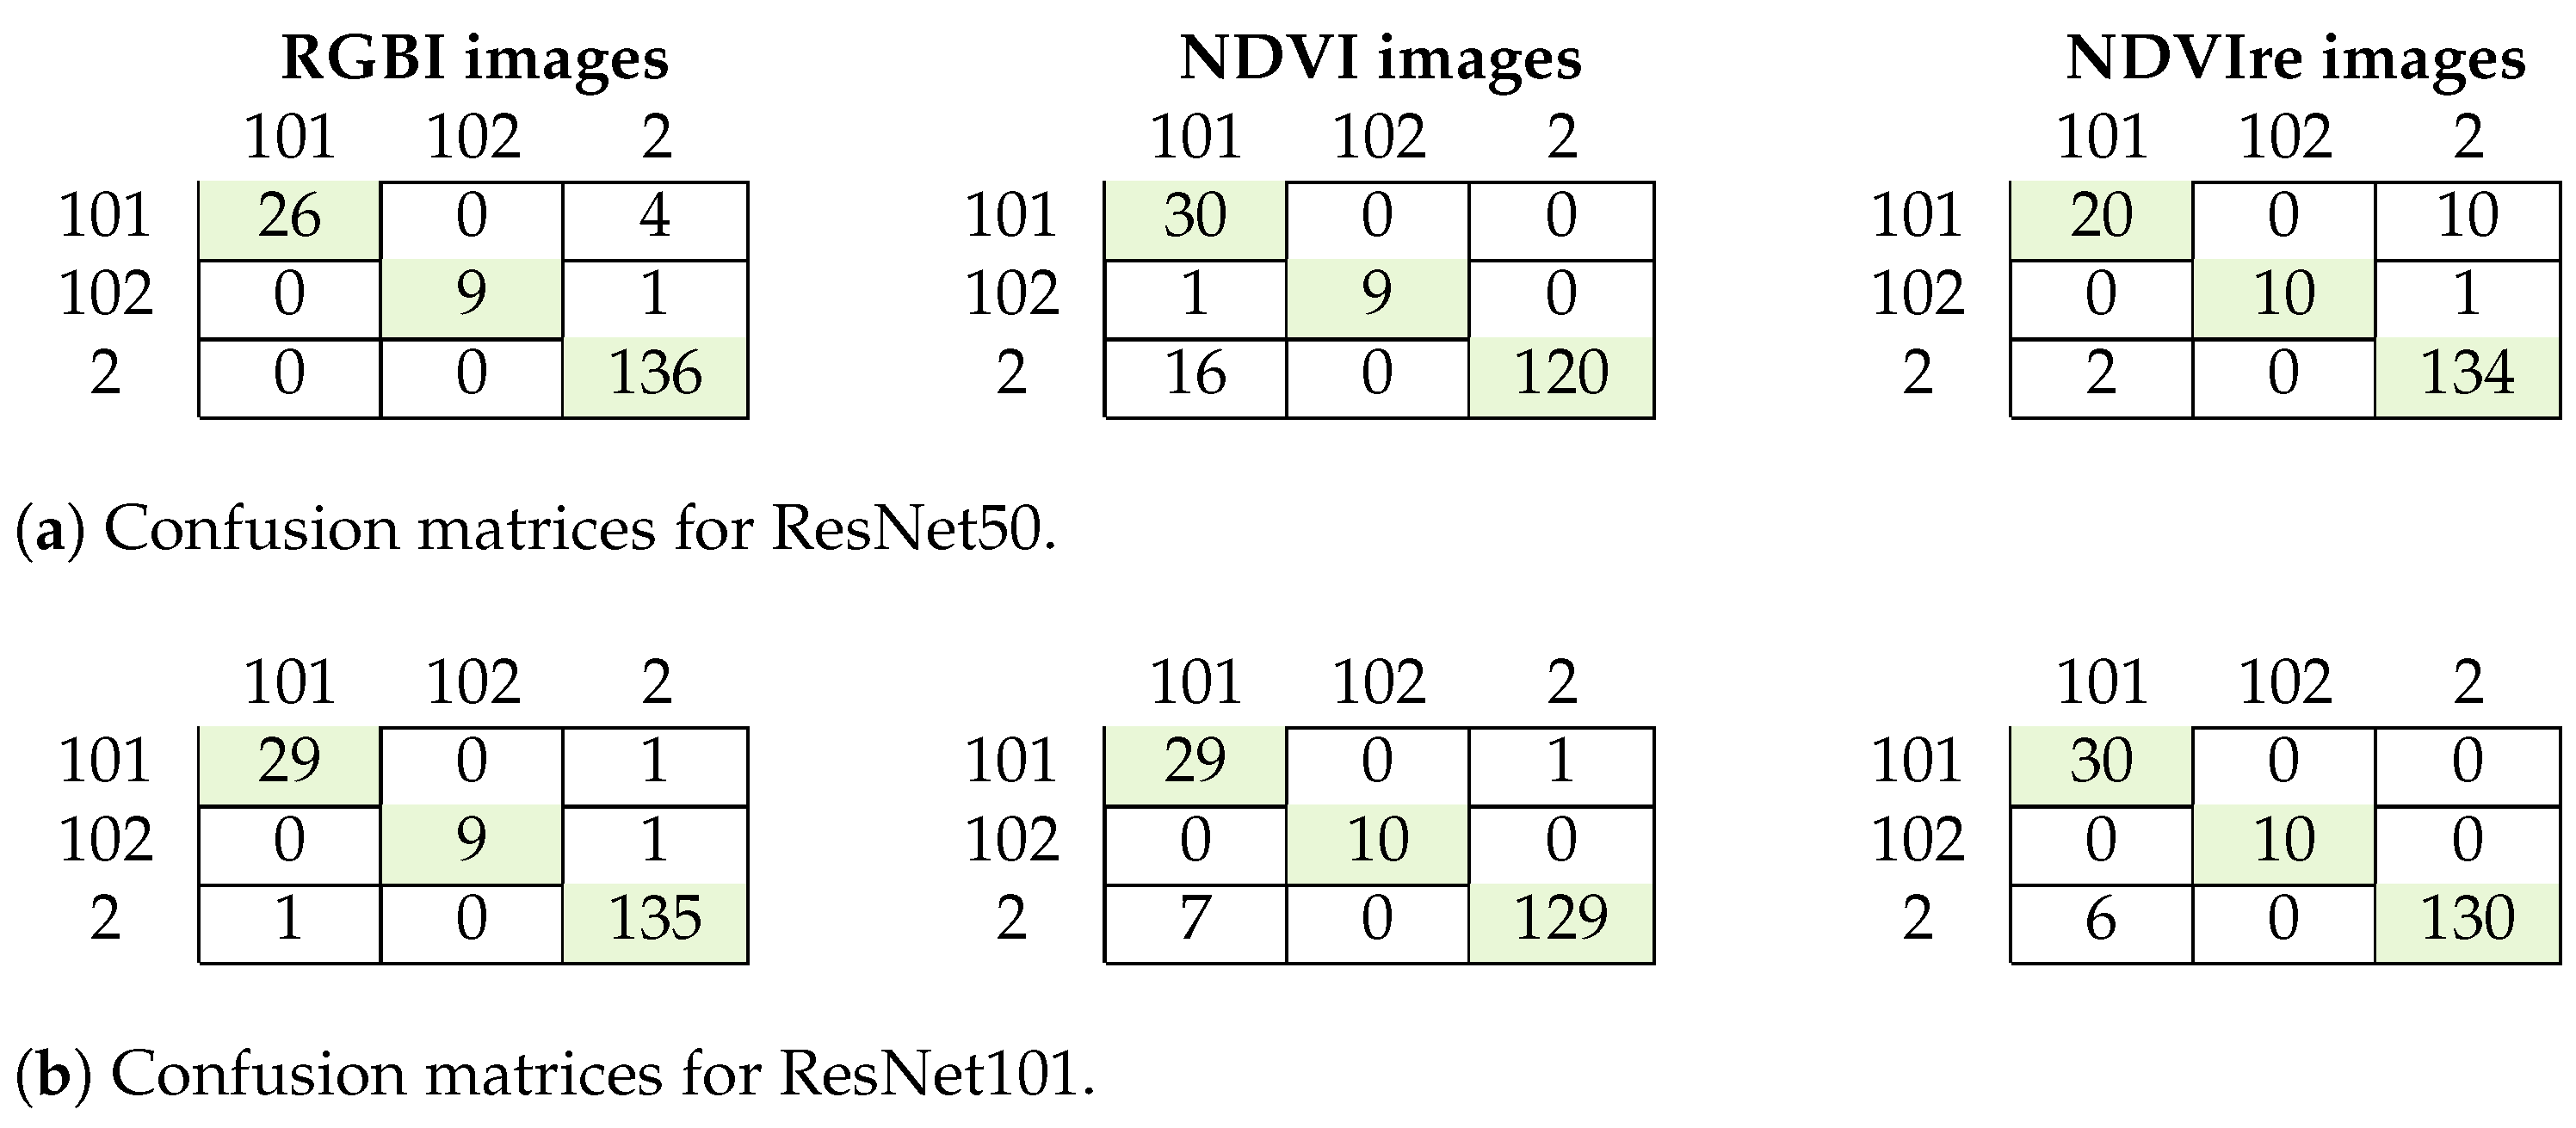
The results for our experiments aiming at further distinguishing the degree of damage are summarized in Table 7 and Figure 8. The best results were achieved using the RGBI images and ResNet101. Both of the tested algorithms performed well with some misclassification, especially for the NDVIre images. The best F1 scores were 0.95 and 0.97, respectively. Misclassification occurred mostly between healthy and lightly damaged trees and only once between light and moderate damage (Figure 8), thus indicating that there might not be a strong distinction between the degree of damage of some samples with light damage that sometimes resemble healthy trees.
Table 7.
Results for degree of damage classification with all investigated models and data.
Table 7.
Results for degree of damage classification with all investigated models and data.
| ResNet50 | ResNet101 | |||||
|---|---|---|---|---|---|---|
| RGBI | NDVI | NDVIre | RGBI | NDVI | NDVIre | |
| Accuracy | 0.97 | 0.90 | 0.93 | 0.98 | 0.95 | 0.97 |
| Average F1 Score | 0.95 | 0.89 | 0.91 | 0.97 | 0.95 | 0.96 |
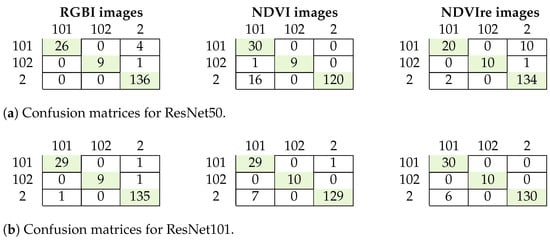
Figure 8.
Confusion matrices for the classification of the degree of damage for ResNet50 (a) and ResNet101 (b). 101: light damaged trees; 102: medium or heavily damaged trees; 2: healthy trees.
Figure 8.
Confusion matrices for the classification of the degree of damage for ResNet50 (a) and ResNet101 (b). 101: light damaged trees; 102: medium or heavily damaged trees; 2: healthy trees.
5. Discussion
In this section, we will first evaluate and discuss our approach and subsequently compare our results to other studies.
5.1. Tree Health Assessment
Tree species classification and tree health assessment are the focus of recent research on forest management due to the increasing tree health degradation in forest stands. Tree species classification combined with tree health assessment can support short interval monitoring of tree species fitness (e.g., drought stress, bark beetle infestations) in selected areas. This will improve the reaction time for foresters and allow them to evaluate the effect of forest management strategies such as the mixing of conifer stands with deciduous trees for increased resilience against disease and water shortages. The results of this study are promising for these tasks, as the differentiation between coniferous and deciduous trees, as well as the differentiation between healthy and damaged trees, was mostly successful. Even the combined approach (Figure 7) allows for a very good differentiation, especially using ResNet101 on NDVIre images or ResNet50 on NDVI images. Further studies could investigate the correlation between stem vitality (bark beetle bore holes, resin flow) and crown vitality (used in this study) in order to predict bark beetle infestation despite a green stage tree crown.
5.2. AI-Based Data Analysis
In general, the results for all the performed experiments, with the exception of VGG16, are quite promising, with high F1 scores and precision rates (mostly between 0.8 and 0.9). However, even though extensive fieldwork was conducted and a very high-quality dataset was collected during several years and from different German forests, the amount of data is still not very high for advanced CNNs. This is especially true for the damaged class and the deciduous trees, where we saw moderate to strong class imbalances. Merging data from two different UAV sensors with slightly different parameters, as well as the different areas in Germany, contribute to a better generalization of the models, even though some classes are highly underrepresented such as damaged deciduous trees. This is where we see most classification errors as data augmentation cannot counteract that much class imbalance (in the original dataset, there were only 157 damaged and 175 healthy deciduous trees out of a total of almost 2000 trees). Having additional data for these classes would allow to train a model with a higher reliability to correctly predict the deciduous tree classes. More fieldwork in broadleaf-dominated forests would be necessary to train models with better performance of simultaneously evaluating damage and tree species. ResNet approaches work well for damaged spruce trees and to some degree for deciduous trees, especially when using NDVI images (Figure 7). More and diverse ground truth data would also allow us to confirm or discard the conclusions drawn from the data presented in this study, as the very good results shown in Figure 7 and Figure 8 indicate strong adaption of the algorithm to this particular dataset (forest structure, tree types, sensor resolutions…). A larger dataset from many different forest areas and varying data recording methods might include a wider variety of features of different tree species at various states of health, and, therefore, allow to apply the trained model on larger and diverse forest areas. Additionally, developing a second architecture for reliable crown segmentation is necessary to avoid the time-consuming process of digitizing the tree crowns manually, which is presently being investigated.
With respect to the degree of damage, it is hard to assess the degree of crown damage doing fieldwork in the forest. It is not necessarily the case that strong damage at lower parts of the tree (e.g., yhr trunk) is reflected in the same way at crown level, which is the only level that can be learned by the CNNs without also including active systems such as LiDAR sensors. Thus, some misclassification in the labels might happen and lead to erroneous training samples.
With respect to the different algorithms used, we saw high performance for the RFs algorithm for the binary classification problem, but not for tree species and tree health. Here, CNNs performed much better, probably due to the feature extractors that are capable of detecting patterns such as the structure of the crown and the leaves that is very distinct for spruce or deciduous trees, respectively. Surprisingly though, VGG16 i not perform well at all even for the binary classification problem. Out of 55 damaged trees, only 36 were correctly identified; 19 were incorrectly identified as healthy, and 14 out of 123 healthy trees were missed. The model was thus not further evaluated.
Another aspect that influences the classification quality of AI algorithms is the spatial resolution of the orthophotos. It is well known that a loss of tree vitality causes a shift in the crown reflection spectra due to the decrease in chlorophyll activity [53]. However, the effect can be local in the beginning, thereby being restricted to one or few branches and their respective needles or leaves. A low-resolution orthophoto with a GSD of >25 cm would not display this spectral shift due to the overlap of healthy neighbor branches. Thus, in our study, we processed GSDs between 0.65–3.47 cm, which, in theory, would allow us to resolve single leaves or needles and is still a realistic minimum resolution for orthophotos considering the long processing times [37]. However, the square shaped pixels are not suitable for visualizing small and complex shapes like spike shaped needles or species-specific shaped leaves from different perspectives. Therefore, the information used by the AI algorithms was locally generalized to twig shapes, which still allows the detection of local discoloration. While RFs only uses spectral information, CNNs can exploit the distinct geometric differences between relatively even shaped conifer crowns with their large twigs extending from the center and unevenly shaped deciduous tree crowns with their branched twigs that form a comparably complex crown structure and thus perform better on species classification. As a high spatial resolution, as well as avoiding artefacts, is paramount for the performance of CNNs, future research might avoid the use of orthophotos and focus on analyzing single pictures instead. This could avoid geometric distortion and information loss [54], but it would require adapted UAV mission planning and data collection strategies. Considering the cost of the data acquisition and data processing used in this study, the process has to be optimized for large forest areas. With our hardware, flight time per ha and orthophoto processing time per ha consumed 2 h and 2–3 days, respectively. Applying such time-consuming methods on a complete forest district in Germany with an average of 1500 ha is unrealistic. Therefore, our study shows the potential for further exploiting forest health assessment and tree species classification, but technical development has to yield faster and optimized data acquisition and processing methods for large area monitoring at high resolution, e.g., by fully automated single-picture recording and analysis [54]. Additionally, as already mentioned, the automatic segmentation of tree crowns is necessary to speed up the process of labelling more data.
5.3. Comparison of the Results to Other Studies
The results of our study agree well with other works such as [11,35,54], that also used RGB or RGBI images for tree health or species classification. Saarinen et al., 2018 [55] also found that red edge information and vegetation indices are particularly suited for evaluating tree health. The use of vegetation indices was also investigated by [31,56,57] for stress and disease detection of trees with kappa coefficients above 0.9, which are comparable to our results. In contrast to our results, Sylvain et al., 2019 [35] achieved excellent model performance with a VGG16-based structure. The authors used a similar four class differentiation between healthy and dead trees, as well as between deciduous and coniferous trees. Their superior results may be attributed to the use of a larger dataset of approximately 300,000 trees. Li et al., 2021 [18] achieved an OA of more than 90% using ResNet on Worldview and LiDAR data for tree species classification, while RFs performed worse (86% OA), thus agreeing with our findings that feature extraction plays a crucial role in tree species and health classification tasks. Similarly, Guerra-Hernandez et al. found that RFs in a similar setting with two classes delivers good results, but shows a decrease in performance when adding more classes such as species [30]. However, in their work, the differentiation for two classes was made between healthy and dead trees or for four additional classes with two categories of defoliated trees. The decrease in accuracy compared to ResNet architectures is possibly due to the lack of feature extractors that make CNNs so successful in many computer vision tasks.
6. Conclusions
The results of our study highlight the potential of deep CNNs for the early detection of tree damage based on RGBI data collected by highly flexible UAVs. However, these architectures require large amounts of highly accurate and well-balanced datasets. The distribution of our study area in several regions in Germany, as well as the combination of two camera systems, allows the algorithms to learn to generalize well on new, similar datasets. However, to achieve this on a national level, a much larger dataset is required, and efforts should be made to standardize data collection methods and to provide a large, countrywide benchmark dataset. As sensor systems and UAVs become cheaper, multitemporal monitoring of HotSpots in forests using these devices becomes feasible and could provide a cost-effective way of early detection and, thus, can hinder the spread of forest pests, e.g., bark beetles.
As described in the methods section, the current study only considered and used the health status of the tree crowns. However, the GTD also includes attributes about the health status of the tree trunks. Future research can focus on evaluating the limits of detecting such damage, possibly by using the data fusion of multispectral and LiDAR data to obtain more structural information from lower levels of forest stands.
Author Contributions
Conceptualization, M.B., S.P. and M.P.; methodology, M.B. and J.A.; software, M.B. and J.A.; formal analysis, J.A.; writing—original draft preparation, M.B., J.A. and S.P.; supervision, M.B., S.P. and M.P.; fieldwork, S.P., M.P. and T.N. All authors have read and agreed to the published version of the manuscript.
Funding
This research was funded by the Federal Ministry of Research and Education (BMBF) in Germany under grant number 02WDG014A.
Data Availability Statement
The data presented in this study are not available and still used for further research.
Acknowledgments
We would like to thank Maximilian Hell for his support with coding errors during the experiments. Additionally, we thank two unknown reviewers for their helpful comments that have lead to improving the paper.
Conflicts of Interest
Author Melanie Brandmeier was employed by the company Esri Deutschland GmbH. The remaining authors declare that the research was conducted in the absence of any commercial or financial relationships that could be construed as a potential conflict of interest.
Abbreviations
The following abbreviations are used in this manuscript:
| AGL | Above Ground Level |
| BMEL | The Federal Ministry of Food and Agriculture |
| CNN | Convolutional Neural Network |
| CO2 | Carbon Dioxide |
| ECOC | Error-Correcting Output Codes |
| ESA | European Space Agency |
| FLOPs | Floating Point Operations |
| GPS | Global Positioning System |
| GSD | Ground Sample Distance |
| GTD | Ground Truth Data |
| NDVI | Normalized Difference Vegetation Index |
| NDVIre | Red Edge Normalized Difference Vegetation Index |
| NIR | Near-Infrared |
| OA | Overall Accuracy |
| RFs | Random Forests |
| RGB | Red, Green, and Blue |
| RGBI | Red, Green, Blue, and Infrared |
| SVM | Support Vector Machine |
| SWIR | Shortwave Infrared |
| UAV | Unmanned Aerial Vehicle |
| USGS | U.S. Geological Survey |
References
- BMEL. Förderprogramm Klimaangepasstes Waldmanagement; BMEL: Berlin, Germany, 2023.
- Johann Heinrich von Thünen-Institut. Wald in Deutschland—Wald in Zahlen. Ergebnisse der Kohlenstoffinventur 2017; Johann Heinrich von Thünen-Institut: Braunschweig, Germany, 2017. [Google Scholar]
- BMEL. Ergebnisse der Waldzustandserhebung 2022; BMEL: Berlin, Germany, 2022.
- Hlásny, T.; König, L.; Krokene, P.; Lindner, M.; Montagné-Huck, C.; Müller, J.; Qin, H.; Raffa, K.; Schelhaas, M.J.; Svoboda, M.; et al. Bark Beetle Outbreaks in Europe: State of Knowledge and Ways Forward for Management. Curr. For. Rep. 2021, 7, 1–28. [Google Scholar] [CrossRef]
- Corbett, L.; Withey, P.; Lantz, V.; Ochuodho, T. The economic impact of the mountain pine beetle infestation in British Columbia: Provincial estimates from a CGE analysis. For. Int. J. For. Res. 2015, 89, 100–105. [Google Scholar] [CrossRef]
- Dale, V.; Joyce, L.; Mcnulty, S.; Neilson, R.; Ayres, M.; Flannigan, M.; Hanson, P.; Irland, L.; Lugo, A.; Peterson, C.; et al. Climate Change and Forest Disturbances. BioScience 2001, 51, 723. [Google Scholar] [CrossRef]
- BMEL. Massive Schäden—Einsatz für die Wälder; BMEL: Berlin, Germany, 2023.
- Bavarian State Institute of Forestry. Borkenkäferjahr 2022; Bavarian State Institute of Forestry: Freising, Germany, 2022. [Google Scholar]
- Barmpoutis, P.; Stathaki, T.; Kamperidou, V. Monitoring of Trees’ Health Condition Using a UAV Equipped with Low-cost Digital Camera. In Proceedings of the ICASSP 2019—2019 IEEE International Conference on Acoustics, Speech and Signal Processing (ICASSP), Brighton, UK, 12–17 May 2019; pp. 8291–8295. [Google Scholar] [CrossRef]
- Brovkina, O.; Cienciala, E.; Surový, P.; Janata, P. Unmanned aerial vehicles (UAV) for assessment of qualitative classification of Norway spruce in temperate forest stands. Geo-Spat. Inf. Sci. 2018, 21, 12–20. [Google Scholar] [CrossRef]
- Minařík, R.; Langhammer, J.; Lendzioch, T. Detection of Bark Beetle Disturbance at Tree Level Using UAS Multispectral Imagery and Deep Learning. Remote Sens. 2021, 13, 4768. [Google Scholar] [CrossRef]
- Albawi, S.; Mohammed, T.A.; Al-Zawi, S. Understanding of a convolutional neural network. In Proceedings of the 2017 International Conference on Engineering and Technology (ICET), Antalya, Turkey, 21–23 August 2017; pp. 1–6. [Google Scholar] [CrossRef]
- Immitzer, M.; Vuolo, F.; Einzmann, K.; Ng, W.T.; Böck, S.; Atzberger, C. Verwendung von multispektralen Sentinel-2 Daten für die Baumartenklassifikation und Vergleich mit anderen Satellitensensoren. In Proceedings of the Dreiländertagung der DGPF, der OVG und der SGPF, Bern, Switzerland, 8–9 June 2016; Volume 25. [Google Scholar] [CrossRef]
- Wessel, M.; Brandmeier, M.; Tiede, D.; No, N. Evaluation of Different Machine Learning Algorithms for Scalable Classification of Tree Types and Tree Species Based on Sentinel-2 Data. Remote Sens. 2018, 10, 1419. [Google Scholar] [CrossRef]
- Dalponte, M.; Solano-Correa, Y.T.; Frizzera, L.; Gianelle, D. Mapping a European Spruce Bark Beetle Outbreak Using Sentinel-2 Remote Sensing Data. Remote Sens. 2022, 14, 3135. [Google Scholar] [CrossRef]
- Lausch, A.; Erasmi, S.; King, D.J.; Magdon, P.; Heurich, M. Understanding Forest Health with Remote Sensing-Part II—A Review of Approaches and Data Models. Remote Sens. 2017, 9, 129. [Google Scholar] [CrossRef]
- Windrim, L.; Carnegie, A.J.; Webster, M.; Bryson, M. Tree Detection and Health Monitoring in Multispectral Aerial Imagery and Photogrammetric Pointclouds Using Machine Learning. IEEE J. Sel. Top. Appl. Earth Obs. Remote Sens. 2020, 13, 2554–2572. [Google Scholar] [CrossRef]
- Li, H.; Hu, B.; Li, Q.; Jing, L. CNN-Based Individual Tree Species Classification Using High-Resolution Satellite Imagery and Airborne LiDAR Data. Forests 2021, 12, 1697. [Google Scholar] [CrossRef]
- Briechle, S.; Krzystek, P.; Vosselman, G. Silvi-Net—A dual-CNN approach for combined classification of tree species and standing dead trees from remote sensing data. Int. J. Appl. Earth Obs. Geoinf. 2021, 98, 102292. [Google Scholar] [CrossRef]
- Einzmann, K.; Atzberger, C.; Pinnel, N.; Glas, C.; Böck, S.; Seitz, R.; Immitzer, M. Early detection of spruce vitality loss with hyperspectral data: Results of an experimental study in Bavaria, Germany. Remote Sens. Environ. 2021, 266, 112676. [Google Scholar] [CrossRef]
- Nezami, S.; Khoramshahi, E.; Nevalainen, O.; Pölönen, I.; Honkavaara, E. Tree Species Classification of Drone Hyperspectral and RGB Imagery with Deep Learning Convolutional Neural Networks. Remote Sens. 2020, 12, 1070. [Google Scholar] [CrossRef]
- Huo, L.; Persson, H.J.; Lindberg, E. Early detection of forest stress from European spruce bark beetle attack, and a new vegetation index: Normalized distance red & SWIR (NDRS). Remote Sens. Environ. 2021, 255, 112240. [Google Scholar] [CrossRef]
- Abdullah, H.; Darvishzadeh, R.; Skidmore, A.K.; Groen, T.A.; Heurich, M. European spruce bark beetle (Ips typographus, L.) green attack affects foliar reflectance and biochemical properties. Int. J. Appl. Earth Obs. Geoinf. 2018, 64, 199–209. [Google Scholar] [CrossRef]
- Lehmann, J.R.K.; Nieberding, F.; Prinz, T.; Knoth, C. Analysis of Unmanned Aerial System-Based CIR Images in Forestry—A New Perspective to Monitor Pest Infestation Levels. Forests 2015, 6, 594–612. [Google Scholar] [CrossRef]
- Abdullah, H.; Skidmore, A.K.; Darvishzadeh, R.; Heurich, M. Timing of red-edge and shortwave infrared reflectance critical for early stress detection induced by bark beetle (Ips typographus, L.) attack. Int. J. Appl. Earth Obs. Geoinf. 2019, 82, 101900. [Google Scholar] [CrossRef]
- Wiefels, A.; Baroja, C. Red Edge Detects Vegetative Stress Earlier in Plant Growth Cycle; Section: Geospatial Technologies; MundoGEO Team: Curitiba, Brazil, 2022. [Google Scholar]
- Kampen, M.; Lederbauer, S.; Mund, J.P.; Immitzer, M. UAV-Based Multispectral Data for Tree Species Classification and Tree Vitality Analysis. In Proceedings of the Dreiländertagung der DGPF, der OVG und der SGPF, Vienna, Austria, 20–22 February 2019; Volume 28. [Google Scholar]
- Bárta, V.; Hanuš, J.; Dobrovolný, L.; Homolová, L. Comparison of field survey and remote sensing techniques for detection of bark beetle-infested trees. For. Ecol. Manag. 2022, 506, 119984. [Google Scholar] [CrossRef]
- Ecke, S.; Dempewolf, J.; Frey, J.; Schwaller, A.; Endres, E.; Klemmt, H.J.; Tiede, D.; Seifert, T. UAV-Based Forest Health Monitoring: A Systematic Review. Remote Sens. 2022, 14, 3205. [Google Scholar] [CrossRef]
- Guerra-Hernández, J.; Díaz-Varela, R.A.; Ávarez González, J.G.; Rodríguez-González, P.M. Assessing a novel modelling approach with high resolution UAV imagery for monitoring health status in priority riparian forests. For. Ecosyst. 2021, 8, 61. [Google Scholar] [CrossRef]
- Abdollahnejad, A.; Panagiotidis, D. Tree Species Classification and Health Status Assessment for a Mixed Broadleaf-Conifer Forest with UAS Multispectral Imaging. Remote Sens. 2020, 12, 3722. [Google Scholar] [CrossRef]
- Fraser, B.T.; Congalton, R.G. Monitoring Fine-Scale Forest Health Using Unmanned Aerial Systems (UAS) Multispectral Models. Remote Sens. 2021, 13, 4873. [Google Scholar] [CrossRef]
- Safonova, A.; Hamad, Y.; Dmitriev, E.; Georgiev, G.; Trenkin, V.; Georgieva, M.; Dimitrov, S.; Iliev, M. Individual Tree Crown Delineation for the Species Classification and Assessment of Vital Status of Forest Stands from UAV Images. Drones 2021, 5, 77. [Google Scholar] [CrossRef]
- Natesan, S.; Armenakis, C.; Vepakomma, U. Resnet-Based Tree Species Classification Using UAV Images. Int. Arch. Photogramm. Remote Sens. Spat. Inf. Sci. 2019, XLII-2-W13, 475–481. [Google Scholar] [CrossRef]
- Sylvain, J.D.; Drolet, G.; Brown, N. Mapping dead forest cover using a deep convolutional neural network and digital aerial photography. ISPRS J. Photogramm. Remote Sens. 2019, 156, 14–26. [Google Scholar] [CrossRef]
- Safonova, A.; Tabik, S.; Alcaraz-Segura, D.; Rubtsov, A.; Maglinets, Y.; Herrera, F. Detection of Fir Trees (Abies sibirica) Damaged by the Bark Beetle in Unmanned Aerial Vehicle Images with Deep Learning. Remote Sens. 2019, 11, 643. [Google Scholar] [CrossRef]
- Nguyen, H.T.; Lopez Caceres, M.L.; Moritake, K.; Kentsch, S.; Shu, H.; Diez, Y. Individual Sick Fir Tree (Abies mariesii) Identification in Insect Infested Forests by Means of UAV Images and Deep Learning. Remote Sens. 2021, 13, 260. [Google Scholar] [CrossRef]
- Abu-zanona, M.; Elaiwat, S.; Younis, S.; Innab, N.; Kamruzzaman, M.M. Classification of Palm Trees Diseases using Convolution Neural Network. Int. J. Adv. Comput. Sci. Appl. 2022, 13. [Google Scholar] [CrossRef]
- Mamdouh, N.; Khattab, A. Olive Leaf Disease Identification Framework using Inception V3 Deep Learning. In Proceedings of the 2022 IEEE International Conference on Design & Test of Integrated Micro & Nano-Systems (DTS), Cairo, Egypt, 6–9 June 2022; pp. 1–6. [Google Scholar] [CrossRef]
- He, K.; Gkioxari, G.; Dollár, P.; Girshick, R. Mask R-CNN. In Proceedings of the 2017 IEEE International Conference on Computer Vision (ICCV), Venice, Italy, 22–29 October 2017; pp. 2980–2988. [Google Scholar] [CrossRef]
- Lin, Y.L. Semi-Automatic Classification of Tree Species Using a Combination of RGB Drone Imagery and Mask RCNN: Case Study of the Highveld Region in Eswatini. Master’s Thesis, Universidade Nova de Lisboa, Lisbon, Portugal, 2021. [Google Scholar]
- Chiang, C.Y.; Barnes, C.; Angelov, P.; Jiang, R. Deep Learning-Based Automated Forest Health Diagnosis From Aerial Images. IEEE Access 2020, 8, 144064–144076. [Google Scholar] [CrossRef]
- Fassnacht, F.E.; Latifi, H.; Stereńczak, K.; Modzelewska, A.; Lefsky, M.; Waser, L.T.; Straub, C.; Ghosh, A. Review of studies on tree species classification from remotely sensed data. Remote Sens. Environ. 2016, 186, 64–87. [Google Scholar] [CrossRef]
- Bavarian State Forestry. Fichtenwälder in Bayern und ihre Biodiversität-LWF-Wissen 80; Bavarian State Forestry: Bavaria, Germany, 2013. [Google Scholar]
- Shorten, C.; Khoshgoftaar, T.M. A survey on Image Data Augmentation for Deep Learning. J. Big Data 2019, 6, 60. [Google Scholar] [CrossRef]
- Breiman, L. Random Forests. Mach. Learn. 2001, 45, 5–32. [Google Scholar] [CrossRef]
- Simonyan, K.; Zisserman, A. Very Deep Convolutional Networks for Large-Scale Image Recognition. arXiv 2014, arXiv:1409.1556. [Google Scholar] [CrossRef]
- He, K.; Zhang, X.; Ren, S.; Sun, J. Deep Residual Learning for Image Recognition. In Proceedings of the 2016 IEEE Conference on Computer Vision and Pattern Recognition (CVPR), Las Vegas, NV, USA, 27–30 June 2016; pp. 770–778. [Google Scholar] [CrossRef]
- Liu, S.; Bai, L.; Hu, Y.; Wang, H. Image Captioning Based on Deep Neural Networks. MATEC Web Conf. 2018, 232, 01052. [Google Scholar] [CrossRef]
- Deng, J.; Dong, W.; Socher, R.; Li, L.J.; Li, K.; Li, F.-F. ImageNet: A large-scale hierarchical image database. In Proceedings of the 2009 IEEE Conference on Computer Vision and Pattern Recognition, Miami, FL, USA, 20–25 June 2009; pp. 248–255. [Google Scholar] [CrossRef]
- Pytorch. Models and Pre-Trained Weights—Torchvision 0.15 Documentation. Available online: https://pytorch.org/vision/0.15/ (accessed on 19 November 2023).
- Szegedy, C.; Vanhoucke, V.; Ioffe, S.; Shlens, J.; Wojna, Z. Rethinking the Inception Architecture for Computer Vision. arXiv 2015, arXiv:1512.00567. [Google Scholar] [CrossRef]
- Main, R.; Cho, M.A.; Mathieu, R.; O’Kennedy, M.M.; Ramoelo, A.; Koch, S. An investigation into robust spectral indices for leaf chlorophyll estimation. ISPRS J. Photogramm. Remote Sens. 2011, 66, 751–761. [Google Scholar] [CrossRef]
- Egli, S.; Höpke, M. CNN-Based Tree Species Classification Using High Resolution RGB Image Data from Automated UAV Observations. Remote Sens. 2020, 12, 3892. [Google Scholar] [CrossRef]
- Saarinen, N.; Vastaranta, M.; Näsi, R.; Rosnell, T.; Hakala, T.; Honkavaara, E.; Wulder, M.A.; Luoma, V.; Tommaselli, A.M.G.; Imai, N.N.; et al. Assessing Biodiversity in Boreal Forests with UAV-Based Photogrammetric Point Clouds and Hyperspectral Imaging. Remote Sens. 2018, 10, 338. [Google Scholar] [CrossRef]
- Minařík, R.; Langhammer, J. Use of a Multispectral Uav Photogrammetry for Detection and Tracking of Forest Disturbance Dynamics. Int. Arch. Photogramm. Remote Sens. Spat. Inf. Sci. 2016, XLI-B8, 711–718. [Google Scholar] [CrossRef]
- Dash, J.P.; Watt, M.S.; Pearse, G.D.; Heaphy, M.; Dungey, H.S. Assessing very high resolution UAV imagery for monitoring forest health during a simulated disease outbreak. ISPRS J. Photogramm. Remote Sens. 2017, 131, 1–14. [Google Scholar] [CrossRef]

Disclaimer/Publisher’s Note: The statements, opinions and data contained in all publications are solely those of the individual author(s) and contributor(s) and not of MDPI and/or the editor(s). MDPI and/or the editor(s) disclaim responsibility for any injury to people or property resulting from any ideas, methods, instructions or products referred to in the content. |
© 2024 by the authors. Licensee MDPI, Basel, Switzerland. This article is an open access article distributed under the terms and conditions of the Creative Commons Attribution (CC BY) license (https://creativecommons.org/licenses/by/4.0/).