Article

Convective Properties and Lightning Activity in Different Categories of Thunderstorms over the Beijing Area during Five Warm Seasons

1
Key Laboratory of Middle Atmosphere and Global Environment Observation (LAGEO), Institute of Atmospheric Physics, Chinese Academy of Sciences, Beijing 100029, China
2
Collaborative Innovation Center on Forecast and Evaluation of Meteorological Disaster (CICFEMD), Nanjing University of Information Science & Technology, Nanjing 210044, China
3
State Key Laboratory of Severe Weather, Chinese Academy of Meteorological Sciences, Beijing 100081, China
*
Author to whom correspondence should be addressed.
Remote Sens. 2024, 16(3), 447; https://doi.org/10.3390/rs16030447
Submission received: 27 December 2023 / Revised: 9 January 2024 / Accepted: 20 January 2024 / Published: 24 January 2024
(This article belongs to the Section Atmospheric Remote Sensing)

Abstract

:
Based on comprehensive observations, including total lightning, Doppler radar, precipitation, and other meteorological data, the variations in thunderstorm properties and lightning activity of different categories for thunderstorms over the Beijing area during five warm seasons were investigated. According to the morphology of radar echo, thunderstorms were classified into five categories, including single convective cells, multi-cells, linear mesoscale convective system (MCS), nonlinear MCS, and weak convective precipitation system (WCPS). The diurnal variability of lightning, thunderstorm occurrence, and precipitation showed late-afternoon maxima, with the peak time of lightning frequency occurring before that of precipitation. Despite WCPS having the lowest lightning frequency, the percentage of +CG/CG was the highest with large peak currents. The convective available potential energy (CAPE) of linear MCS, multi-cells, nonlinear MCS, single cells, and WCPS categories followed a pattern from largest to smallest. Meanwhile, warm cloud depth (WCD) exhibited a smaller value in the well-organized thunderstorm categories and a larger value in the WCPS. The topographic forcing mechanism and large wind gradient along mountain slopes facilitated convection occurrence and enhancement, further promoting lightning production. Meanwhile, the nocturnal convection mechanism significantly impacted the activity of nonlinear MCS and WCPS.

1. Introduction

Many criteria have been established for classifying thunderstorms, such as strength, precipitation intensity, and thunderstorm morphologies [1,2,3,4,5]. According to the classification of radar morphology, thunderstorms can be divided into different morphologies, such as isolated cells, cluster cells, linear MCS (Mesoscale Convective System), and nonlinear MCS. Additionally, linear MCS can be further subdivided into several types, including no stratiform region (NS), leading line with trailing stratiform region (TS), parallel stratiform region (PS), leading stratiform region (LS), bow echo (BE), embedded line (EL), and so on [3,4,6,7].
In recent years, the lightning activity of different categories of thunderstorms has been surveyed. Carey and Rutledge [1] conducted the differentiation of thunderstorms into severe storms with hail or tornado and nonsevere storms. Their research revealed notable differences in cloud-to-ground lightning flashes (CG lightning) between severe and nonsevere storms. According to high/low convective rainfall rates (HR/LR) and high/low CG lightning frequencies (HL/LL), Xia et al. [2] considered CG lightning as a threshold and classified MCSs into four categories: HRHL, HRLL, LRHL and LRLL over North China. They pointed out that different environmental factors varied among different types. Based on the intensity of radar reflectivity, thunderstorms were categorized as high radar reflectivity (HRR) and moderate radar reflectivity (MRR). HRR storms produced more lightning flashes than MRR storms but with fewer CG flashes [8]. The difference in the graupel content might influence the electrification disparities between these two storm types.
However, studies on lightning activity of different morphologies for thunderstorms are relatively scarce. Parker et al. [9] examined the CG lightning activity of three archetypes of linear MCS (TS, LS, and PS), suggesting that the unique electrical character contributed to the differences in lightning activity. Furthermore, Liu et al. [10] extended the investigation to total lightning flashes and highlighted the variations in lightning and convective factors among these three linear MCSs. Makowski et al. [11] explored the lightning characteristics of five different classification MCSs, including symmetric TS, asymmetric TS, LS, symmetric evolving to asymmetric (SA), and unclassifiable MCS. The results showed that symmetric TS and SA exhibited higher lightning frequencies than asymmetric TS and unclassifiable MCS. The abovementioned studies revealed that the diversity of lightning activity was primarily attributed to the differences in convective characteristics of different categories of MCSs.
Noninductive charging is considered to be the primary electrification mechanism of thunderstorms [12,13,14]. Laboratory studies have identified riming electrification as the primary charge separation mechanism between graupel-ice crystal collisions with supercooled liquid water (SLW) and updrafts. Under different liquid water contents and temperatures, the same category of hydrometeors (i.e., graupel) can obtain different polarity charges [12,13]. Consequently, the relationships among lightning, dynamics, and microphysics are complex and demonstrate various characteristics. Some thunderstorms exhibit low lightning frequency accompanied by heavy precipitation, while others have high lightning frequency with light precipitation [2]. CG lightning is predominantly negative polarity (-CG lightning) in most thunderstorms [15,16]. However, some specific storm types and environmental conditions can give rise to anomalous charge structures, resulting in high percentages of positive cloud-to-ground lightning (+CG lightning) [17,18,19].
Lightning activity is inherently associated with the dynamics, microphysics, and electrification of thunderstorms. Usually, thunderstorms characterized by high convective available potential energy (CAPE) values are associated with frequent lightning activity [2]. The stronger updraft accelerates the growth of graupel particles and ice crystals and then increases their collision rates [14,20]. Therefore, lightning activity is closely related to specific humidity [21,22], warm cloud depth (WCD) [23,24], wind shear [25,26], radar volume [10,27], graupel and ice volumes [28], and updraft [29,30]. Therefore, different morphologies of thunderstorms may demonstrate different convective properties, environmental factors, and lightning activity.
Previous research on lightning activity has been limited to case studies or a specific type of thunderstorm [10,16,31,32,33,34]. Case studies offer valuable insights into the lightning activity of individual thunderstorms, but there is considerable variability in their lightning activity. Statistical analyses of lightning activity and convective characteristics under different thunderstorm morphologies are quite few. In addition, limited studies have been confined to CG lightning, representing only a fraction of the total lightning activity [2,9] or specific types of thunderstorms [10,11]. Therefore, this needs to be clarified in our understanding of the lightning activity of different thunderstorm categories. Moreover, some specific questions remain unanswered, such as what are the characterized features of the different categories of thunderstorms and what are the underlying thermodynamic mechanisms that lead to differences in lightning activity?
A comprehensive, coordinated observation has been conducted over the Beijing area during the warm seasons from 2015 to 2019 (from May to September). The lightning activity and convective properties of different categories of thunderstorms were investigated based on the high spatial accuracy of CG and intra-cloud lightning (IC lightning) flashes, S-band Doppler radar, precipitation, and other meteorological data. The motivation of this study is to understand the variations in convective properties and lightning activity of different thunderstorm classifications and to further explore the underlying thermodynamic mechanisms that lead to the differences in thunderstorm occurrence and lightning activity. The results will provide effective warning indicators for the convective evolution of different categories of thunderstorms and lightning trends forecast.

2. Data and Methodology
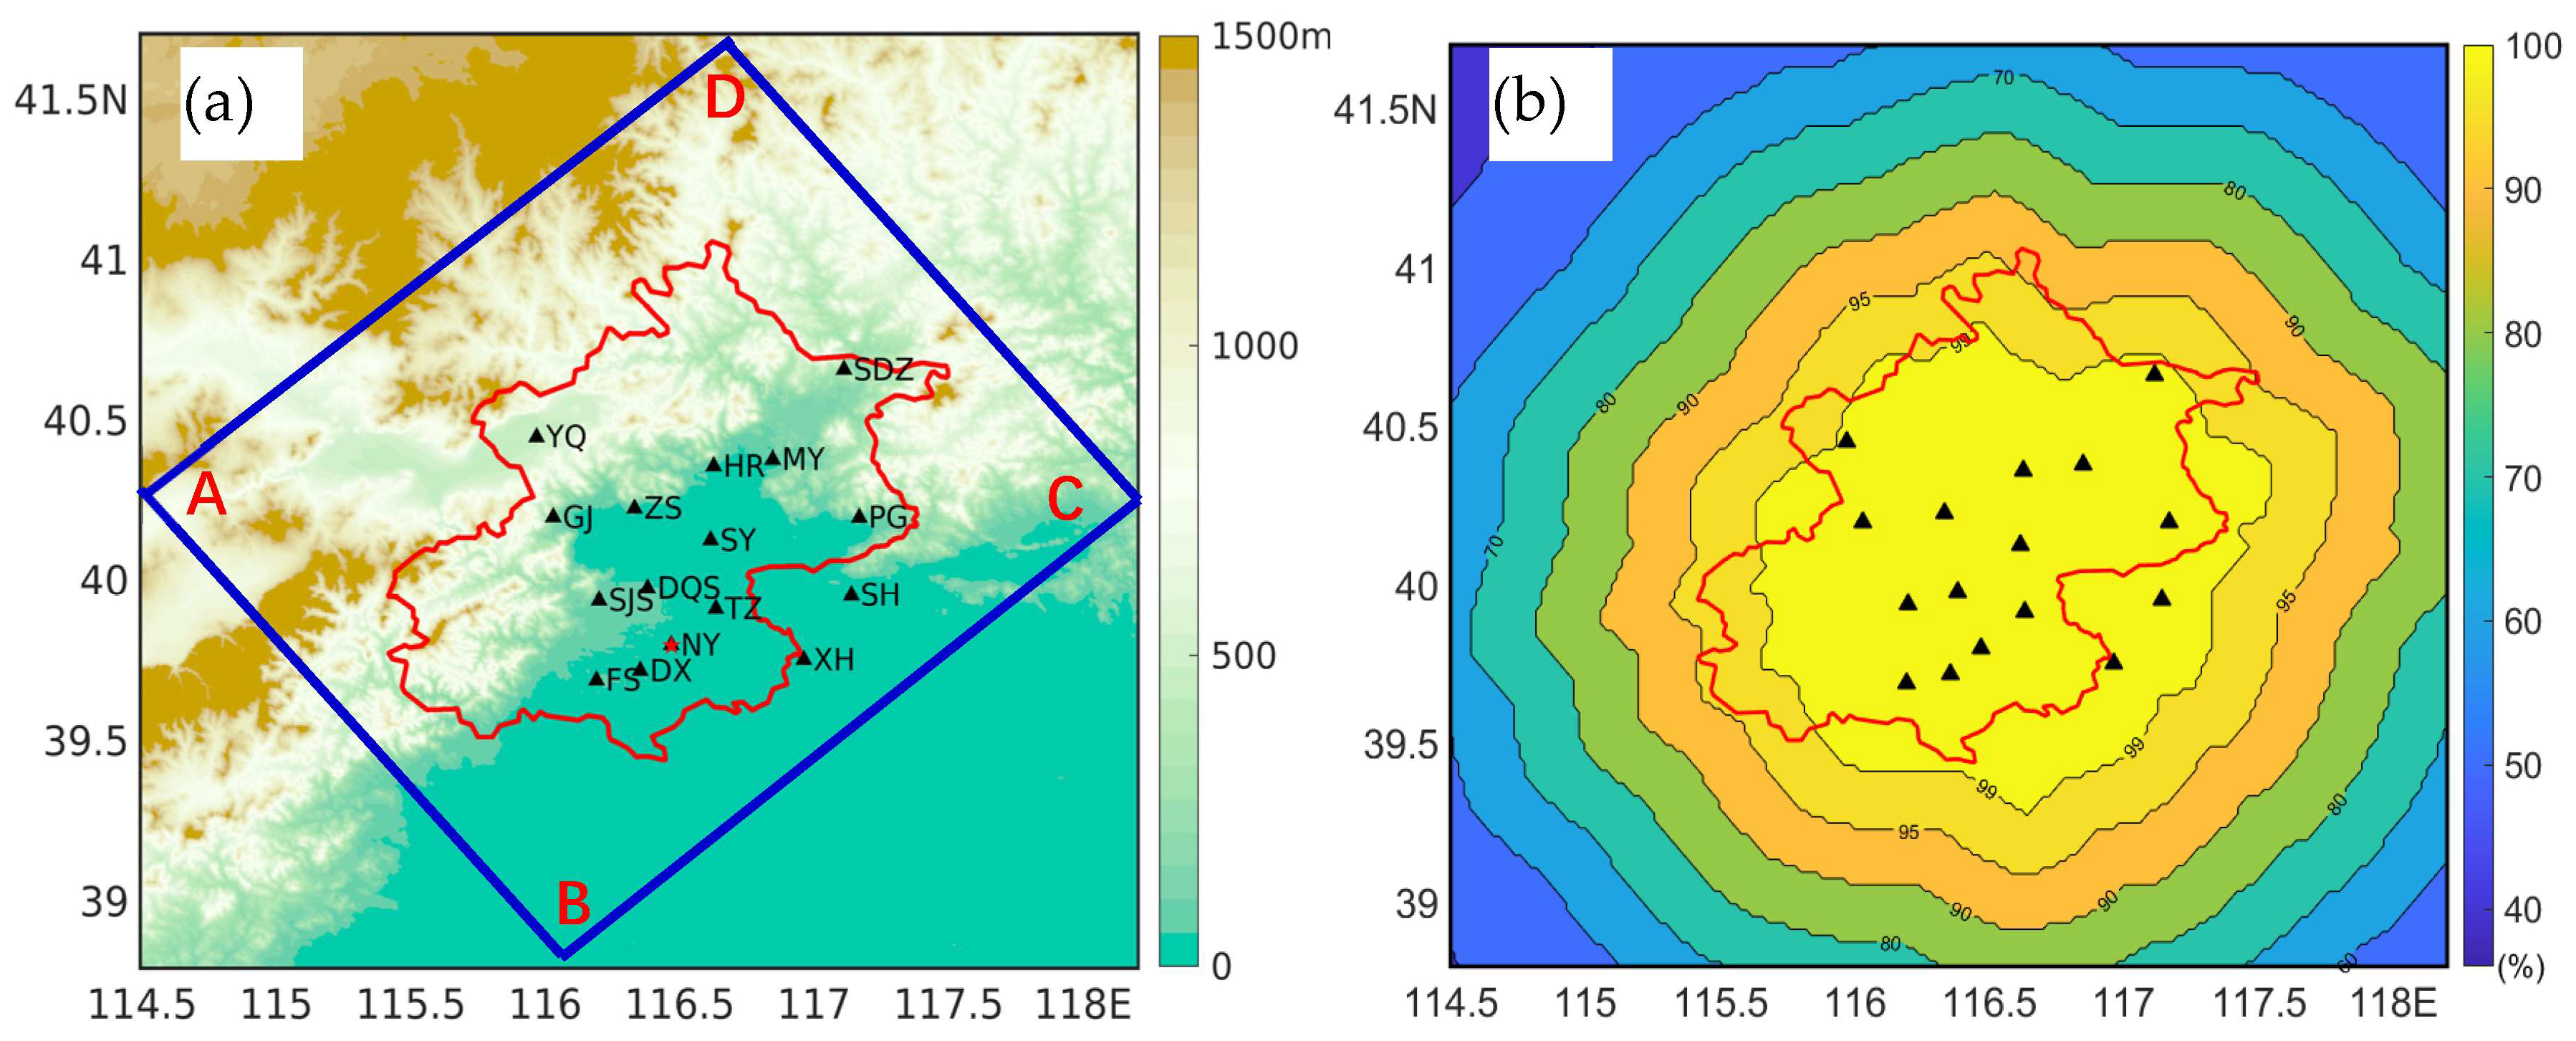
2.1. Study Region

The study region is the Beijing area (red boundary in Figure 1a) and its surrounding areas, which are characterized by a complex terrain surrounded by three-directional (northern, northwestern, and eastern) mountains and adjacent to a southeastern plain and the Bohai Sea (Figure 1a). The interaction between northwesterly cold and southeasterly warm moist airflows facilitates the initiation of thunderstorms. During the summertime, most thunderstorms originate from the northwest mountains and propagate toward the southeast plain. As these thunderstorms propagate downward from the mountains, the intensity of thunderstorms gradually strengthens due to the influence of cold air and water vapor supply [35,36]. Furthermore, the combined effect of mountain–valley winds and the local circulation further promotes the development of convection [37,38].

2.2. Beijing Broadband Lightning Network

In this study, the lightning data are obtained from the three-dimensional Broadband Lightning Network (BLNET), which is capable of detecting lightning activity across the entire study region. The BLNET consists of 16 stations, each one equipped with a fast electric field change meter, a slow electric field change meter, and a magnetic antenna [39]. Two- and three-dimensional lightning radiation sources are retrieved from low-frequency bands (1.5 kHz–2 MHZ) to determine the positions of lightning events. The time-to-arrival (TOA) positioning algorithm is employed to locate the lightning position by analyzing the time difference in lightning signals arriving at different stations. To accurately determine the location of lightning radiation sources, a combination of the Chan algorithm [40] and the Levenberg–Marquardt methods is adopted [41,42]. The Chan algorithm provides the initial value, and the Levenberg–Marquardt method is applied through multiple iterations to obtain the optimal solution. Compared with other lightning location algorithms [43,44], the combined algorithm in this study guarantees more rapid and more effective lightning location. Wang et al. [39] provided a detailed description of the combined lightning location algorithm. In addition, the detection efficiency of BLNET is obtained through a theoretical calculation, as depicted in Figure 1b. The theoretical detection efficiency of total lightning is 95% and reaches 99% in the center of BLNET, with a horizontal error of less than 200 m and a vertical error of less than 500 m [45].
In order to obtain an accurate lightning location, lightning data are selected by quality control criteria and grouped according to specific rules. Lightning radiation sources occurring within a range of 10-km range and a 500-ms (millisecond) window are considered as a single flash. If a single flash is located only by one lightning radiation source, the isolated lightning source is excluded. The signal of lightning pulses is required to be simultaneously detected by at least four stations. The position of IC lightning is determined based on the location of the first lightning radiation. The position of CG lightning is regarded as the location of the first return stroke. The return strokes with positive and negative polarities are defined as +CG and −CG lightning, respectively. To avoid misclassification of intense or long-distance IC regarded as +CG lightning, +CG return stroke with a current of less than 10 kA is determined as IC lightning [46]. Additionally, four different thresholds of the peak current of CG lightning (Ip) are classified, including |Ip| < 50 kA, 50 kA < |Ip| < 75 kA, 75 kA < |Ip| < 100 kA, and |Ip| > 100 kA.

2.3. Radar Data

Radar data are obtained from the S-band Doppler radar located at 116.5°E, 39.8°N (red star in Figure 1), with a radius of 230 km, provided by the Beijing Meteorological Administration. Nine elevation angles from 0.5° to 19.6° are operationally scanned every 6 min, providing the radar reflectivity and radial velocity over the study region. A bilinear interpolation algorithm is used to convert the raw radar data into a rectangular coordinate system with a horizontal resolution of 0.01° × 0.01°and a vertical resolution of 0.5 km. The composite radar reflectivity, which represents the maximum of the reflectivity detected in a vertical column of the thunderstorm, is used in this study. According to the morphologies of radar echoes, thunderstorms are classified into five different categories.

2.4. Other Meteorological Data

The European Centre for Medium-Range Weather Forecasts (ECMWF) ERA-5 reanalysis data from the years 2015 to 2019 are used, which has a horizontal spatial resolution of 0.125 × 0.125 and a 6-hourly temporal resolution, associated with 37 vertical levels ranging from 1000 hPa to 1 hPa within 25-hPa intervals (www.ecmwf.int/en/forecasts/dataset/ecmwf-reanalysis-v5 (accessed on 1 January 2023)). The dataset is used to analyze the synoptic background of thunderstorms and to examine the variations in different categories of thunderstorms.
Radiosonde measurements are obtained from the Beijing Meteorological Administration by three daily launches (0800, 1400, and 2000 LT) on each thunderstorm day. The convective properties, including CAPE, CIN, 0–6 km wind shear, and warm-cloud depth (WCD), are obtained from the closest sounding time relative to the thunderstorm’s maturation period. If a thunderstorm occurs directly between two radiosonde observations, the sounding with the larger CAPE is chosen. WCD is determined as the height between the LCL (Lifting Condensation Level) and the height of the freezing level (0 °C height) [47].
The precipitation data are obtained from 367 automatic weather stations (AWS) in the study region. The accumulated precipitation of every selected thunderstorm is calculated by all related AWS stations and averaged within 1 h.

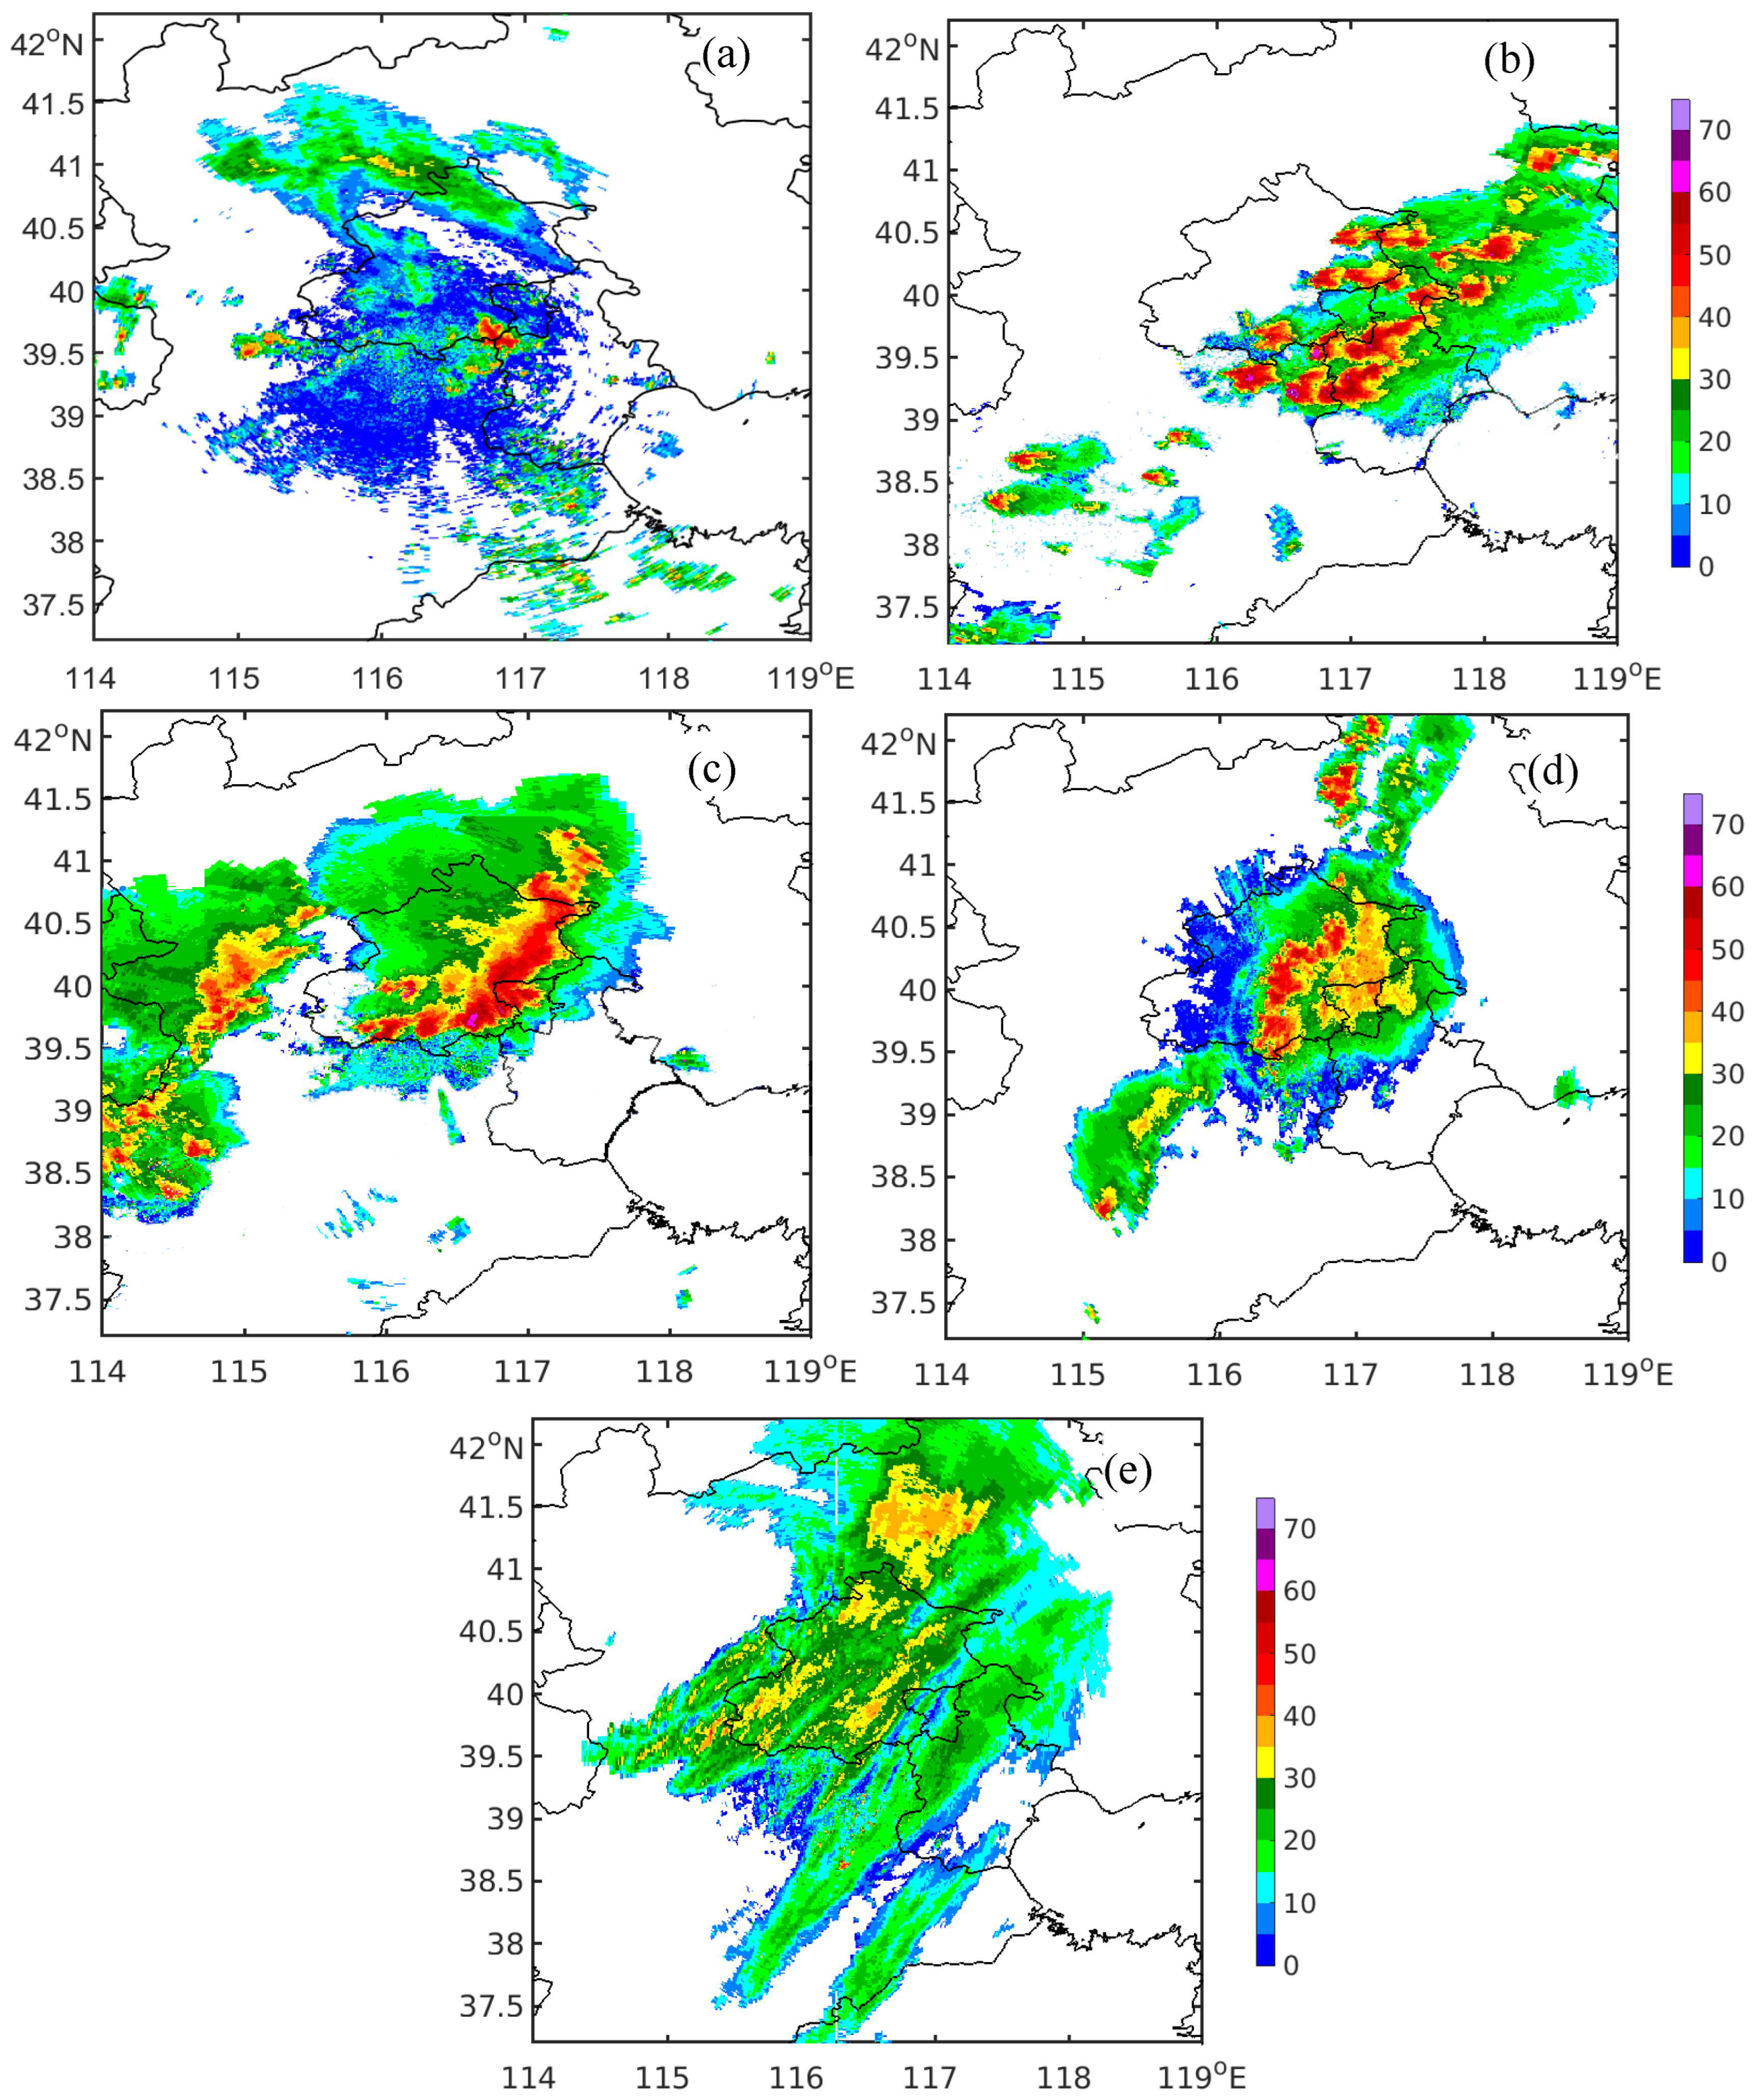
2.5. Thunderstorm Identification and Definition

According to the lightning activity and the morphologies of radar echoes, thunderstorms generated over the study region are categorized into five categories, including single convective cells, multi-cells, linear MCS, nonlinear MCS, and WCPS, as illustrated in Figure 2. The classification is primarily based on the criteria proposed by Gallus et al. [4]; however, various linear MCS modes are simplified into a single category, and the category of WCPS is introduced in our study. Most thunderstorms generated in the study region are influenced by cold vortexes and deep troughs, especially at the 500 hPa level. In order to guarantee the uniform synoptic background of thunderstorms, typhoon-influenced thunderstorms, which are quite rare in the study area, are excluded. The classification of thunderstorm morphology relies on objective identification by some specific rules and subjective determination. The categorization of the involved cases is mainly determined by the radar morphology; i.e., when the area of radar echo exceeds 10 km × 10 km, thunderstorms are continuously observed for at least 30 min (five radar observational times), and at least ten lightning flashes are required for simultaneous lightning observations during this period. Although this method may exclude some very weak thunderstorms and introduce small biases into the statistical analysis, it must be emphasized that this filtering method avoids the influence of noise. Thunderstorms must pass over the study region for most of their life cycle. If only a small part of the thunderstorm sweeps over the study area, this case is excluded from the statistical analysis. The method of thunderstorm tracking involves identifying the area with the highest radar reflectivity as the core of the thunderstorm. Subsequently, the area around the core is systematically scanned with a radius of 5 km and gradually expanded. This iterative process continues until the intensity of the specific radar echo fades. In addition, a range of radar reflectivity thresholds is progressively expanded from the highest radar reflectivity to 15 dBZ in descending order to determine the area of radar echo with different thresholds. The precipitation and lightning involved for each tracking thunderstorm are matched in the same period. A single cell is defined as an isolated convective cell with a maximum radar echo of at least 40 dBZ during its entire lifetime. It usually has a short lifetime and presents an irregular circular shape. If two or more single cells are present simultaneously and the convective cells are separated at the edges (defined as distinct radar echo boundary of 15 dBZ), they are classified as separated single cells. Since supercells do not occur frequently, isolated supercells are classified as single cells. Multi-cells usually comprise several or a group of convective cells, forming a cluster distribution with a distinguishable strong radar echo. If different convective cells continuously form and vanish, they are still defined as the same multi-cells. Linear MCS is characterized by a vigorous convective line comprising a series of strong convective cells adjacent to a large-scale stratiform region with weak radar reflectivity. In this study, the convective line required radar reflectivity greater than 40 dBZ to maintain at least 75 km. In addition, the ratio of length to width of the convective line is required to be at least 4:1, and the morphology of the convective line is required to persist for at least 30 min. The morphology of nonlinear MCSs typically exhibits circular or elliptical shapes, with the convective region connected to the stratiform region where the strong radar echoes (greater than 40 dBZ) are organized in a connected but nonlinear manner. The area of nonlinear MCS is required to be greater than 100 km. As shown in Figure 2d, the WCPS is characterized by the large scale of stratiform precipitation region with low lightning flash rates and long lifetimes. The maximum radar reflectivity sporadically reaches 40 dBZ and scatters in the relatively weak convective region. In contrast, the stratiform region must be at least ten times larger than the convective area.
Thunderstorms may convert from one mode to another. Therefore, the classification mainly depends on the radar morphology at the mature stage. Once a thunderstorm is defined in a specific category, all subsequent reports of thunderstorm from the initial to the dissipating stage are assigned to the same category. Furthermore, additional rules are applied to the thunderstorm classification as they convert to different types. The following rules are as follows. (1) Contacts between the 30 dBZ radar reflectivity boundaries of two neighboring convective cells are considered the beginning of the merger [48]. (2) If a new convective cell merges into an existing convective storm, or if different new cells merge, the associated lightning activity is included in the classification. (3) If one category of thunderstorm dissipates or a new convective system transforms into another, the classification will be separated into two distinct categories. These rules are adopted to consider the development of thunderstorms and ensure accurate classification throughout their lifecycle. After the initial objective definition, the classification is subjectively reviewed to ensure accuracy and consistency.

3. Results

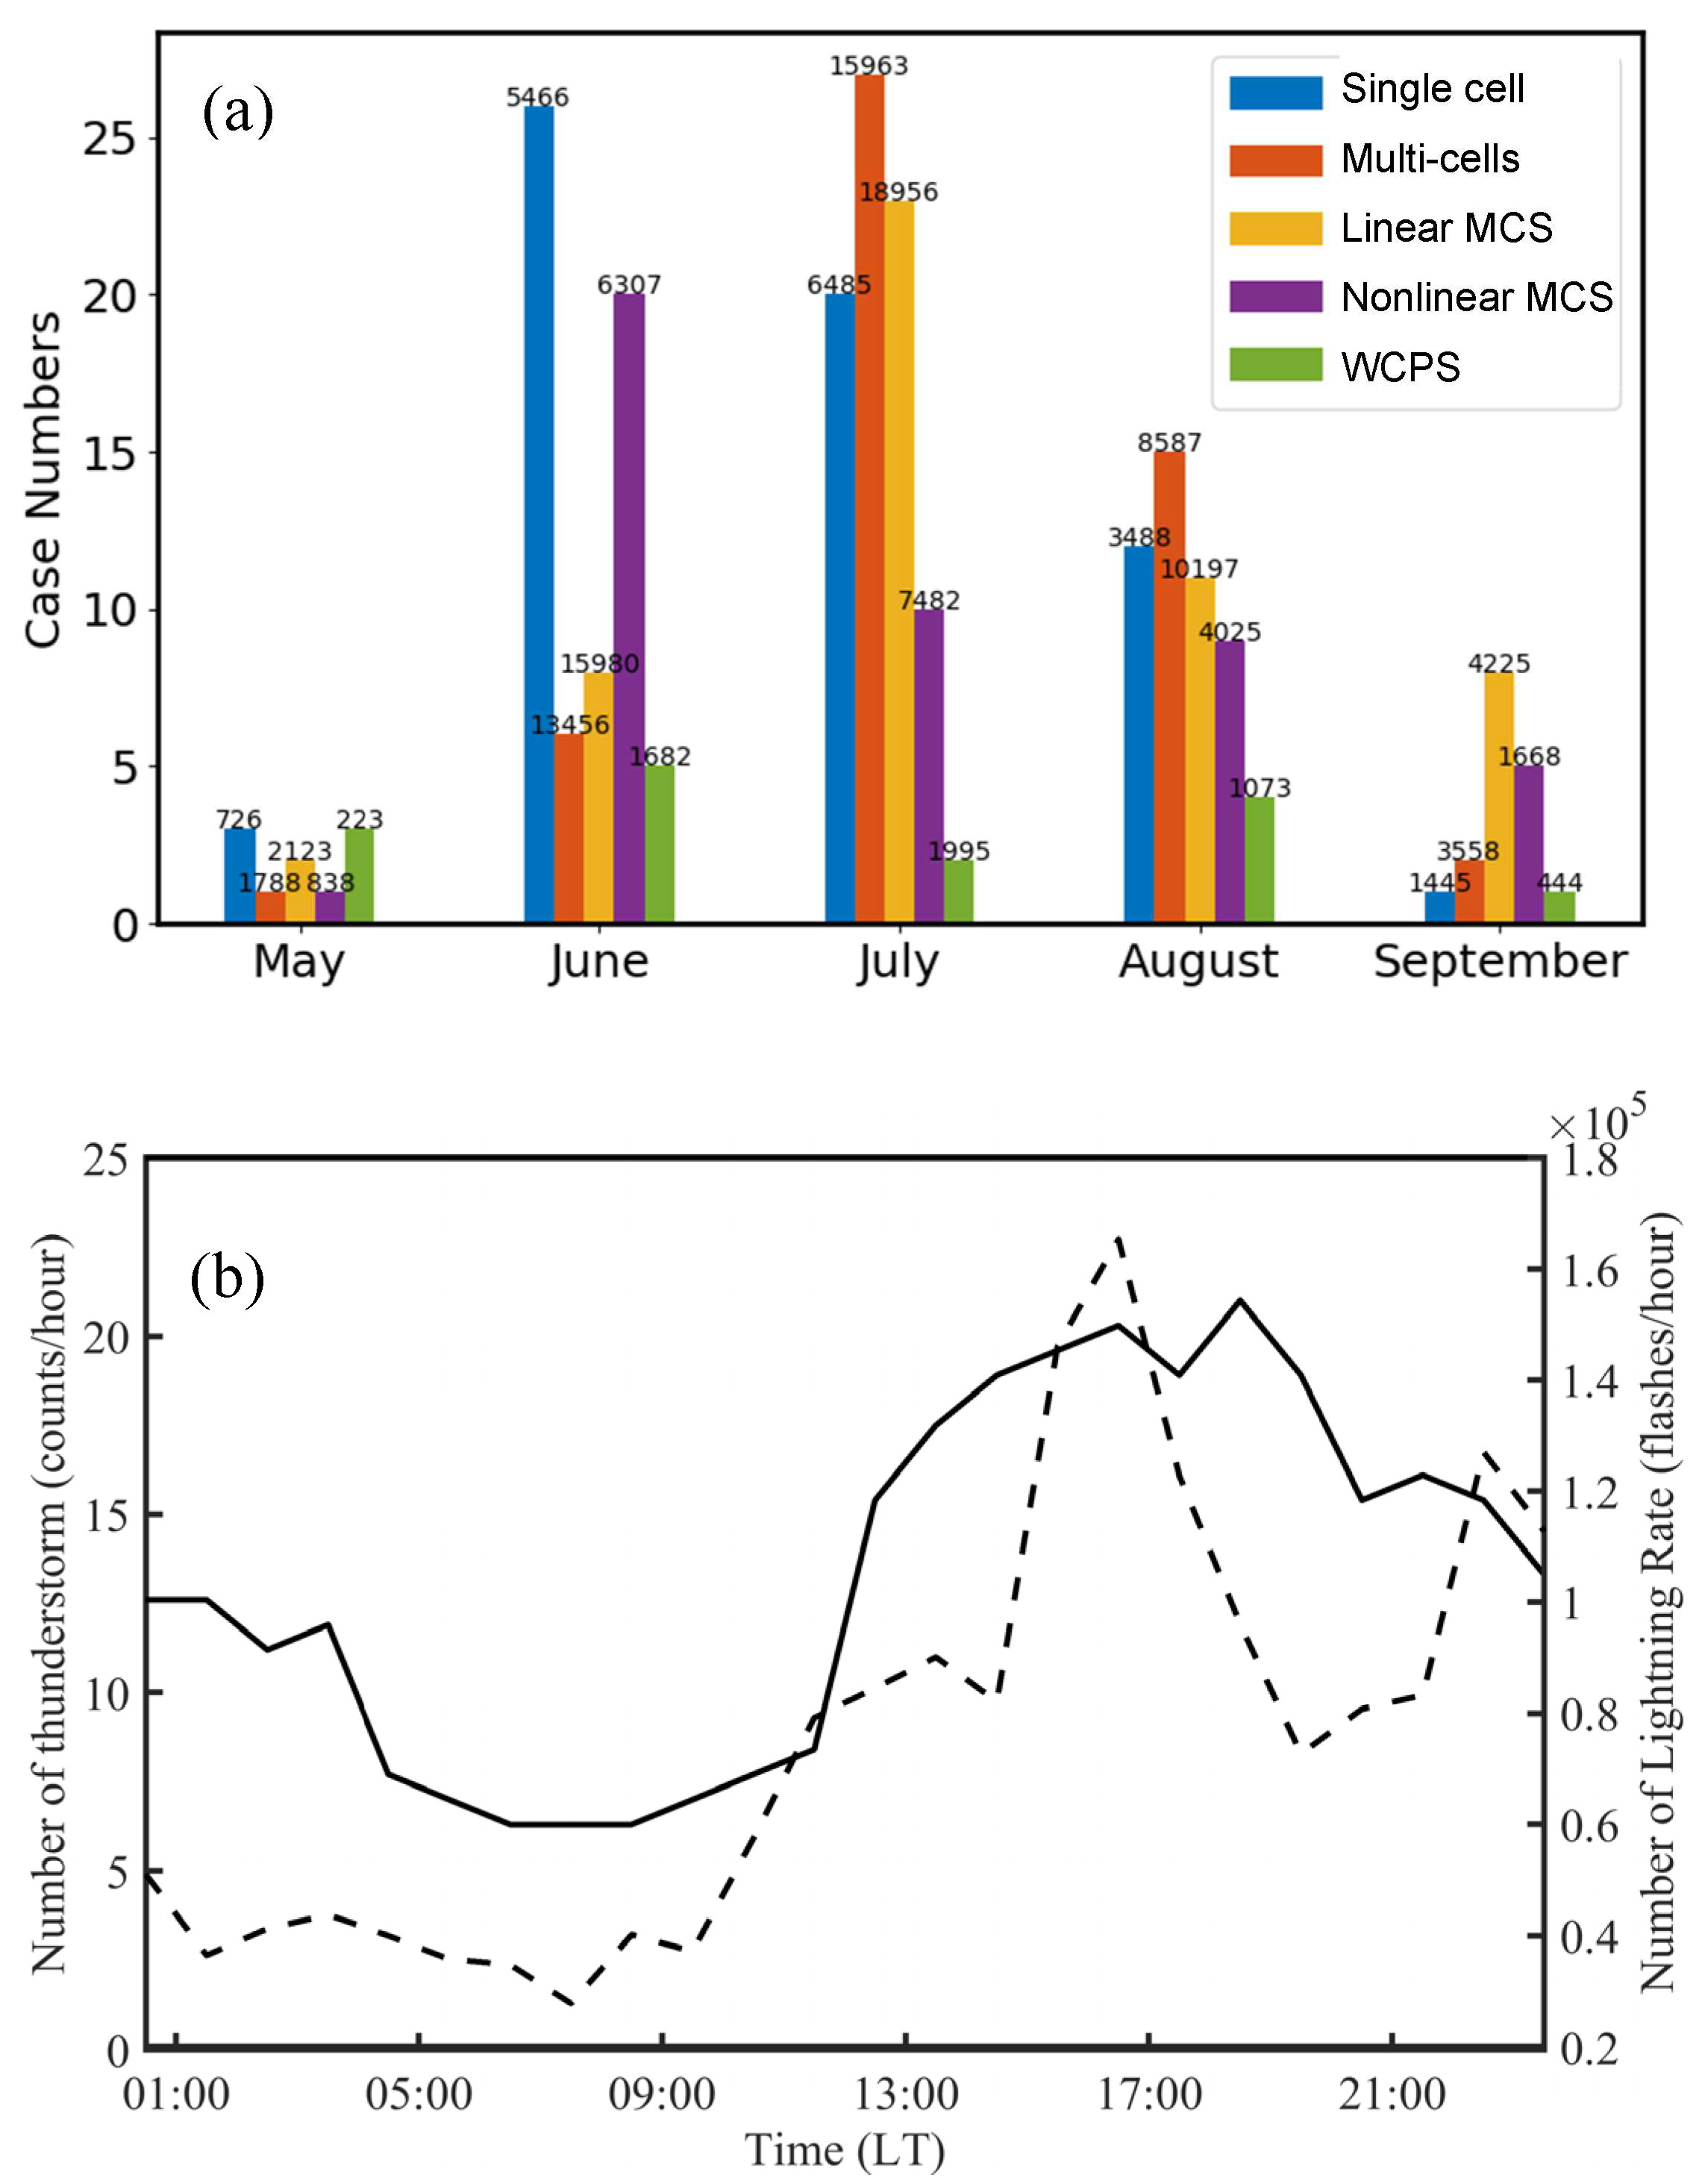
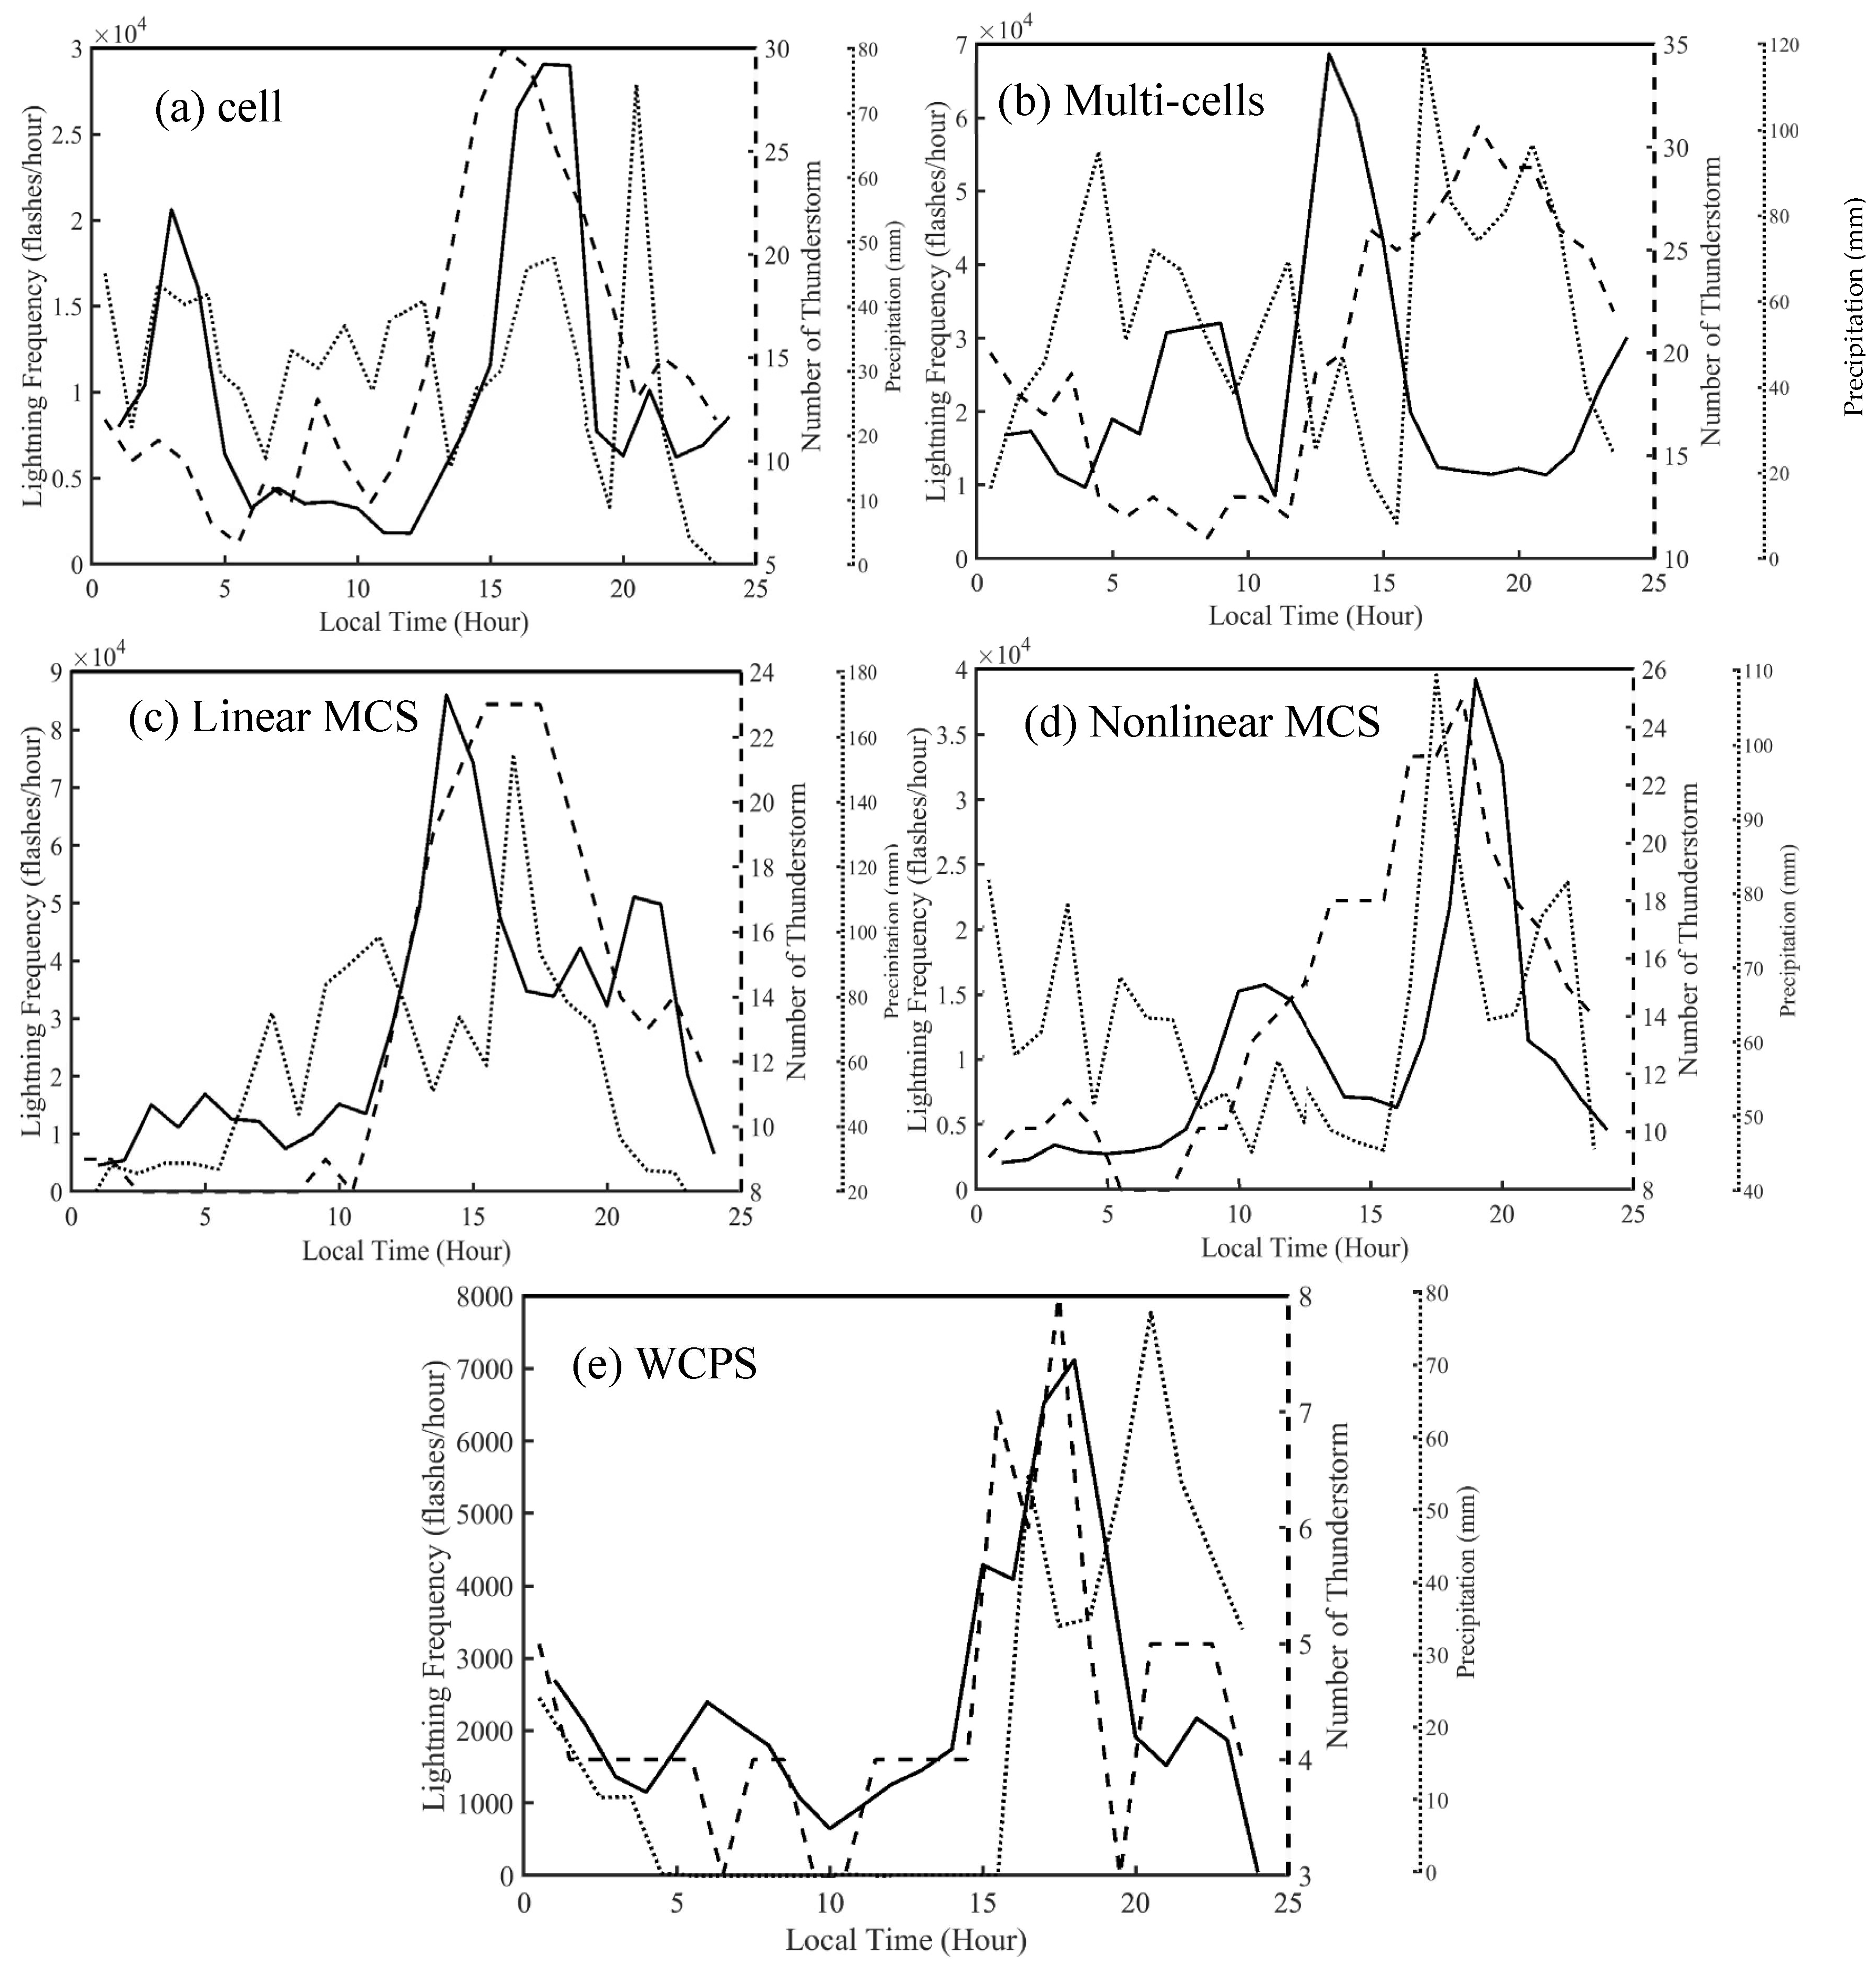
3.1. The Characteristics of Thunderstorm Occurrences and Lightning Activity

A total of 223 thunderstorms occurred during five warm seasons from May to September. The monthly number of thunderstorms and lightning showed that 40% of thunderstorms occurred in July (Figure 3a). Long-duration and well-organized convective systems accounted for a large percentage of thunderstorm occurrences and a high frequency of lightning flashes, especially in June and July, which accounted for 68% of total lightning. Multi-cells and linear MCSs were the main contributors to the occurrence of total lightning flashes. The diurnal variation in thunderstorm occurrence and lightning frequency generally exhibited a unimodal distribution (Figure 3b). The number of thunderstorms was recorded hourly. Thunderstorms manifested inactive in the morning (05:00 LT–10:00 LT) and gradually increased in the afternoon, reaching a maximum around 19:00 LT. Usually, the atmosphere is relatively stable in the early morning, resulting in fewer thunderstorm occurrences and weaker lightning activity. With the enhancement of solar radiation, the atmosphere boundary layer gradually accumulates highly unstable energy, and the convection tends to initiate along the mountains, gradually strengthening in the afternoon as it propagates toward the southeastern plains and lasts until the evening with high occurrence. Lightning frequency was the lowest in the morning and experienced a sharp increase in the afternoon, reaching its peak around 17:00 LT. Both the thunderstorm occurrence and lightning frequency remained high from afternoon to night, with the peak of lightning frequency preceding that of thunderstorm numbers. Nocturnal convection (20:00–04:00 LT) accounted for a significant proportion of thunderstorm occurrences, resulting in frequent lightning. The number of thunderstorms and lightning frequency decreased gradually from night to early morning.
Because the lightning generated by each category of thunderstorm manifests differently, the occurrence of each category of thunderstorm cannot be directly proportional to the overall percentage of lightning activity (Figure 4). Single cells occurred most frequently but contributed relatively little to lightning activity (Figure 4. Although single cells are the most common type, they have short lifetimes, and sometimes, different cells appear simultaneously. Multi-cells account for a significant proportion of thunderstorm occurrence and lightning activity, occupying approximately 35% of the total. Linear MCSs are characterized by long duration, strong convection, and the highest percentage of lightning among the five categories of thunderstorms. Nonlinear MCSs possess a relatively high occurrence but less lightning activity. In contrast, WCPS has the lowest occurrence and the least lightning activity.

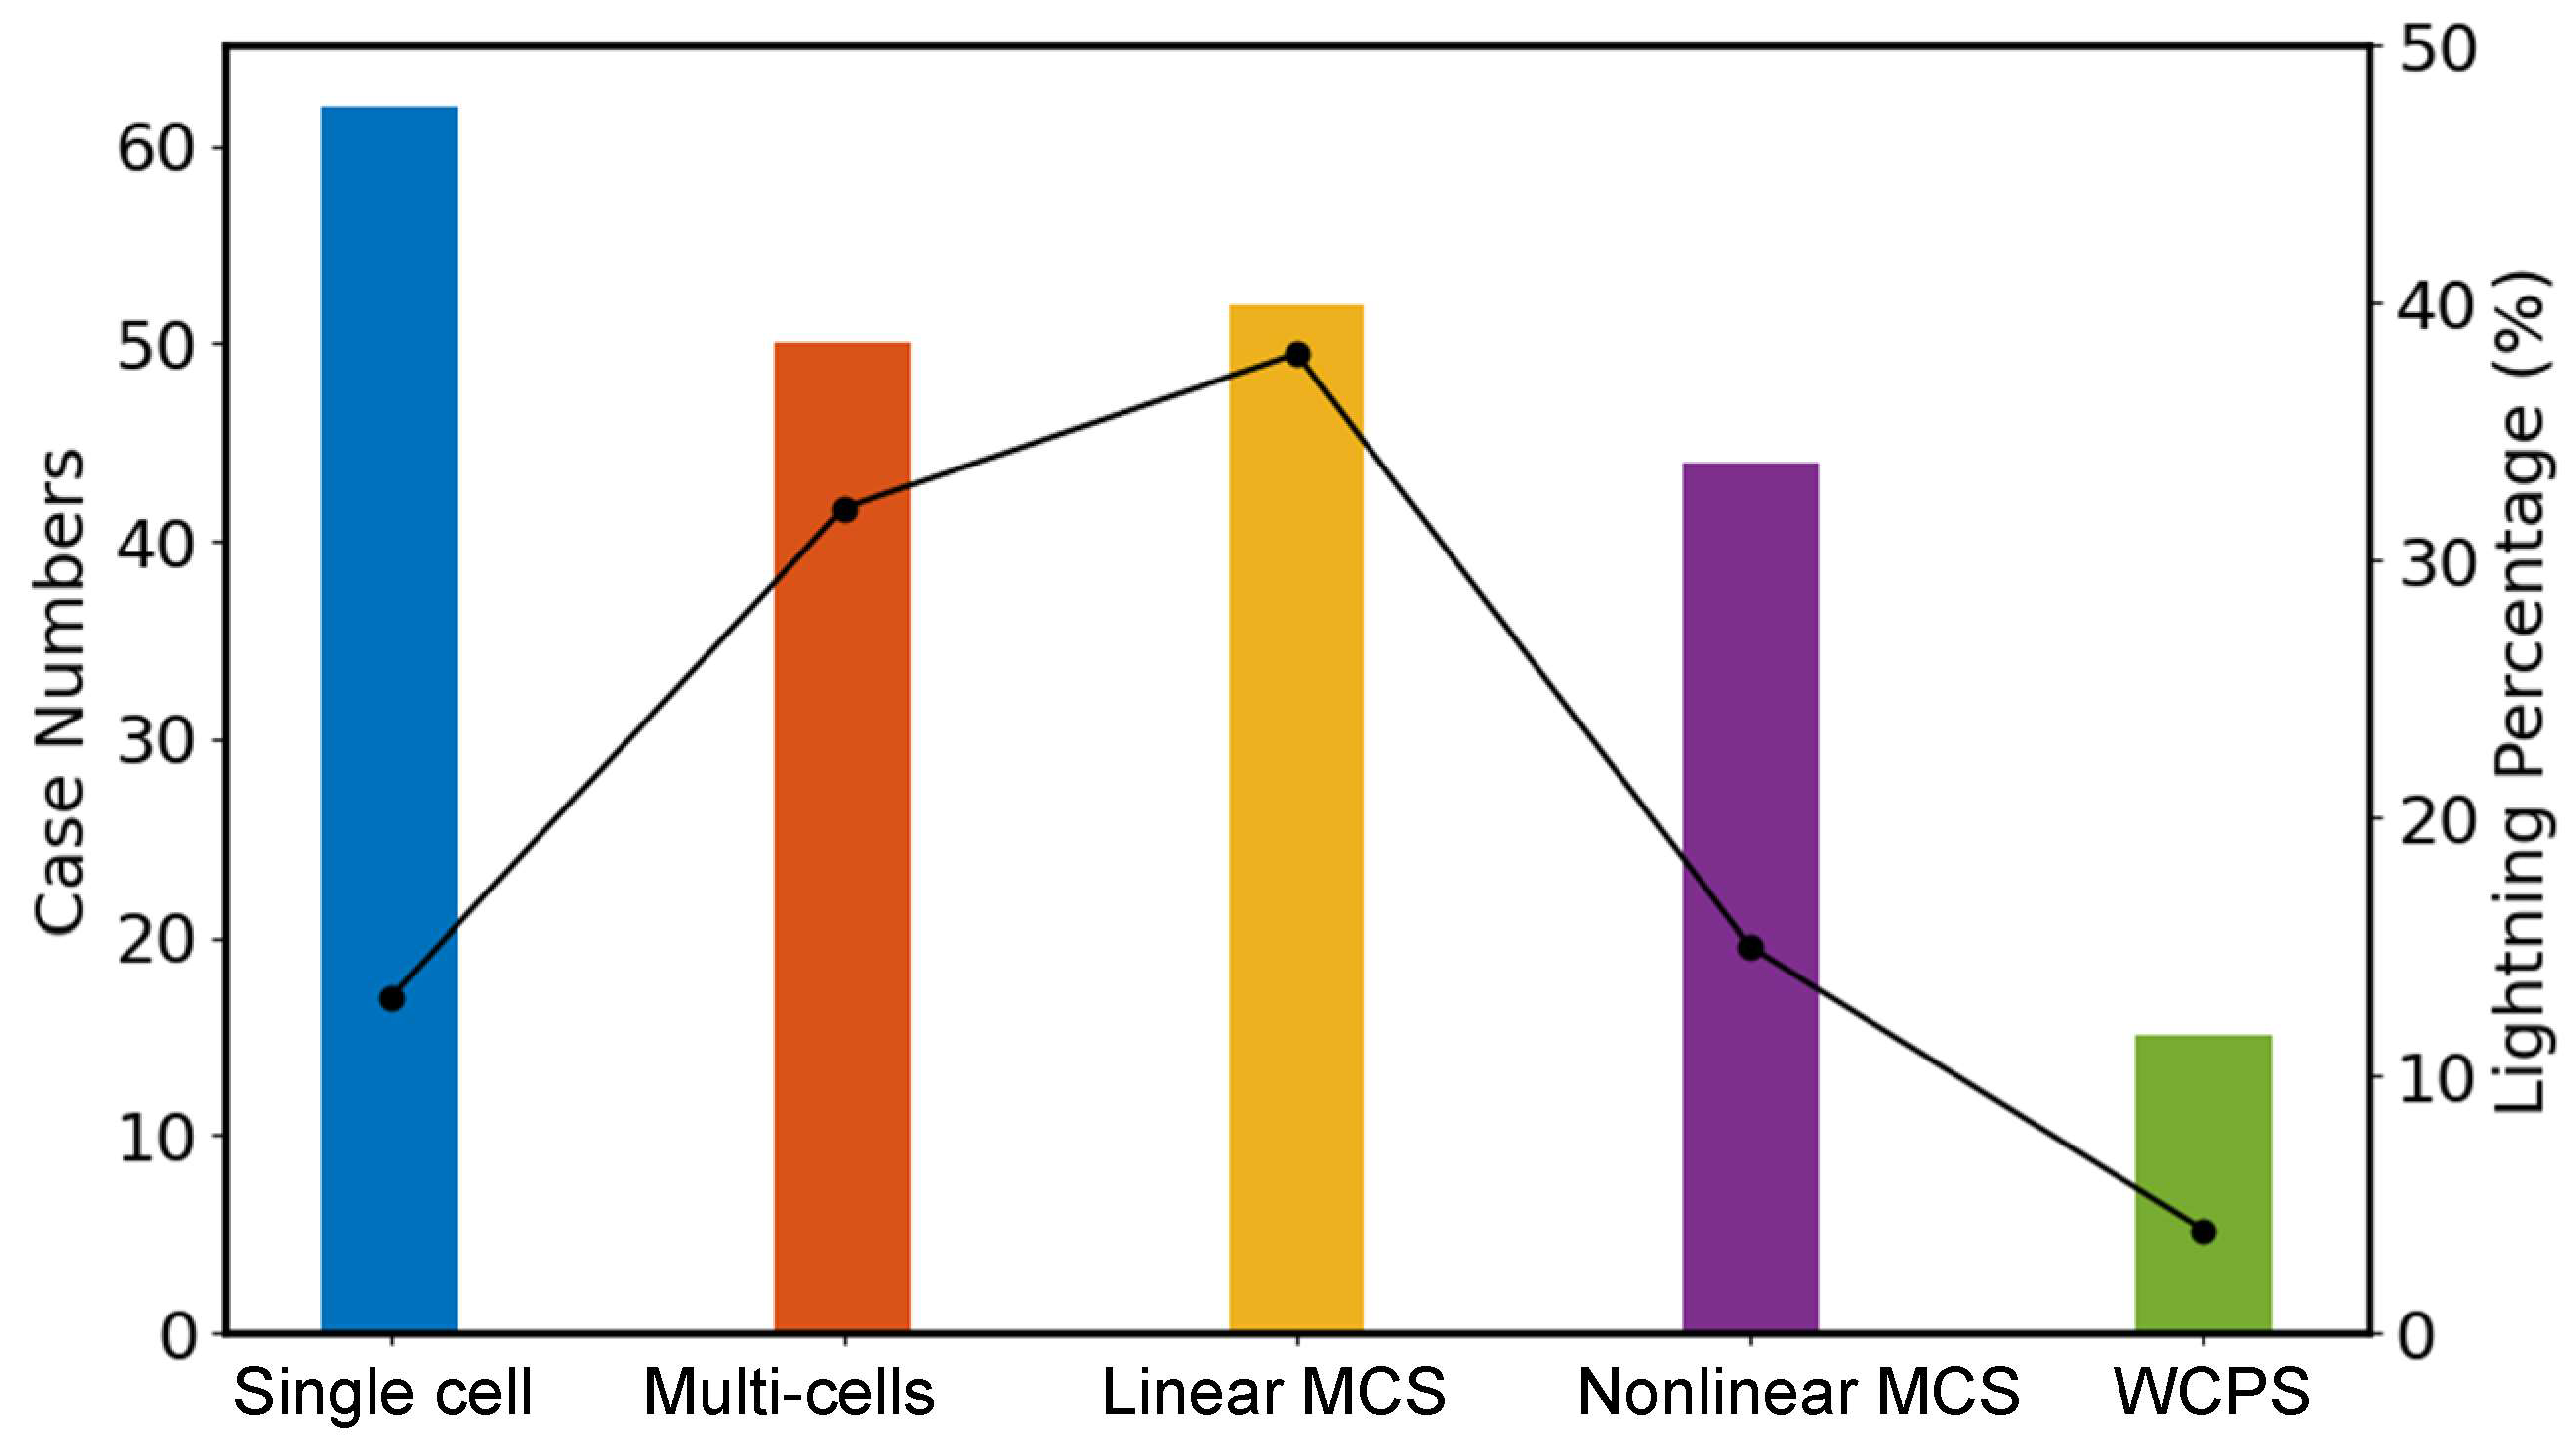
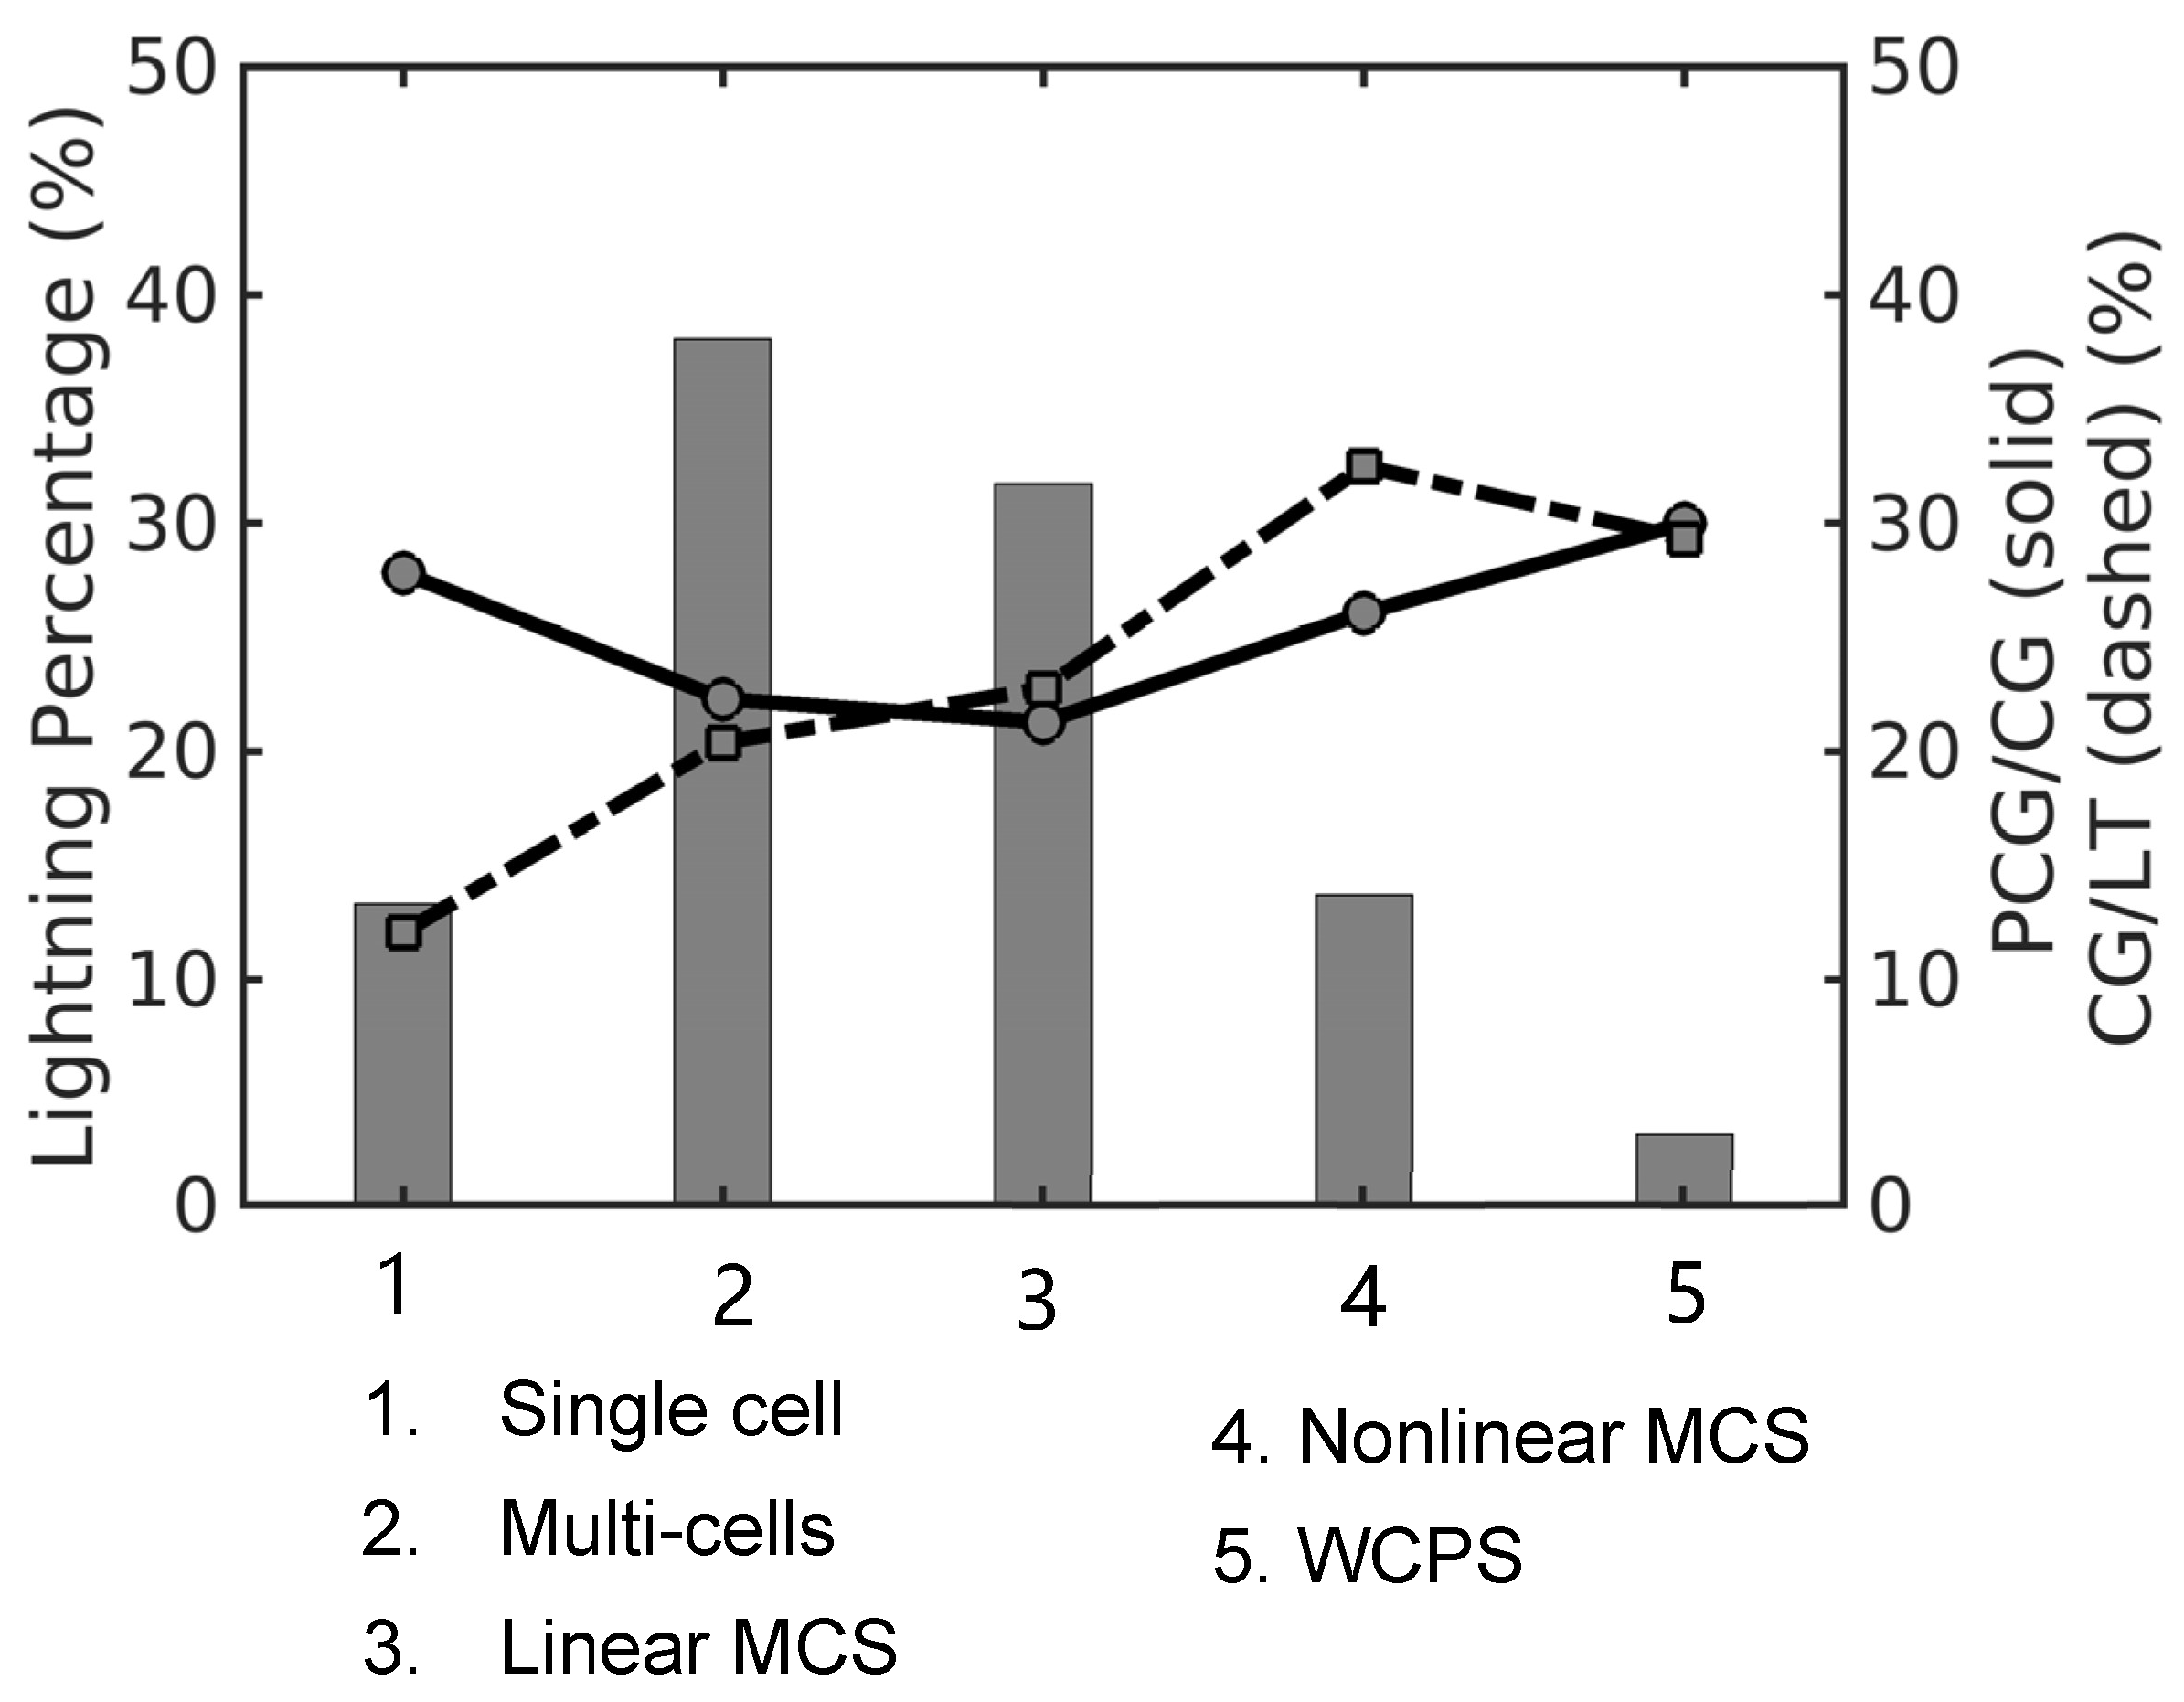
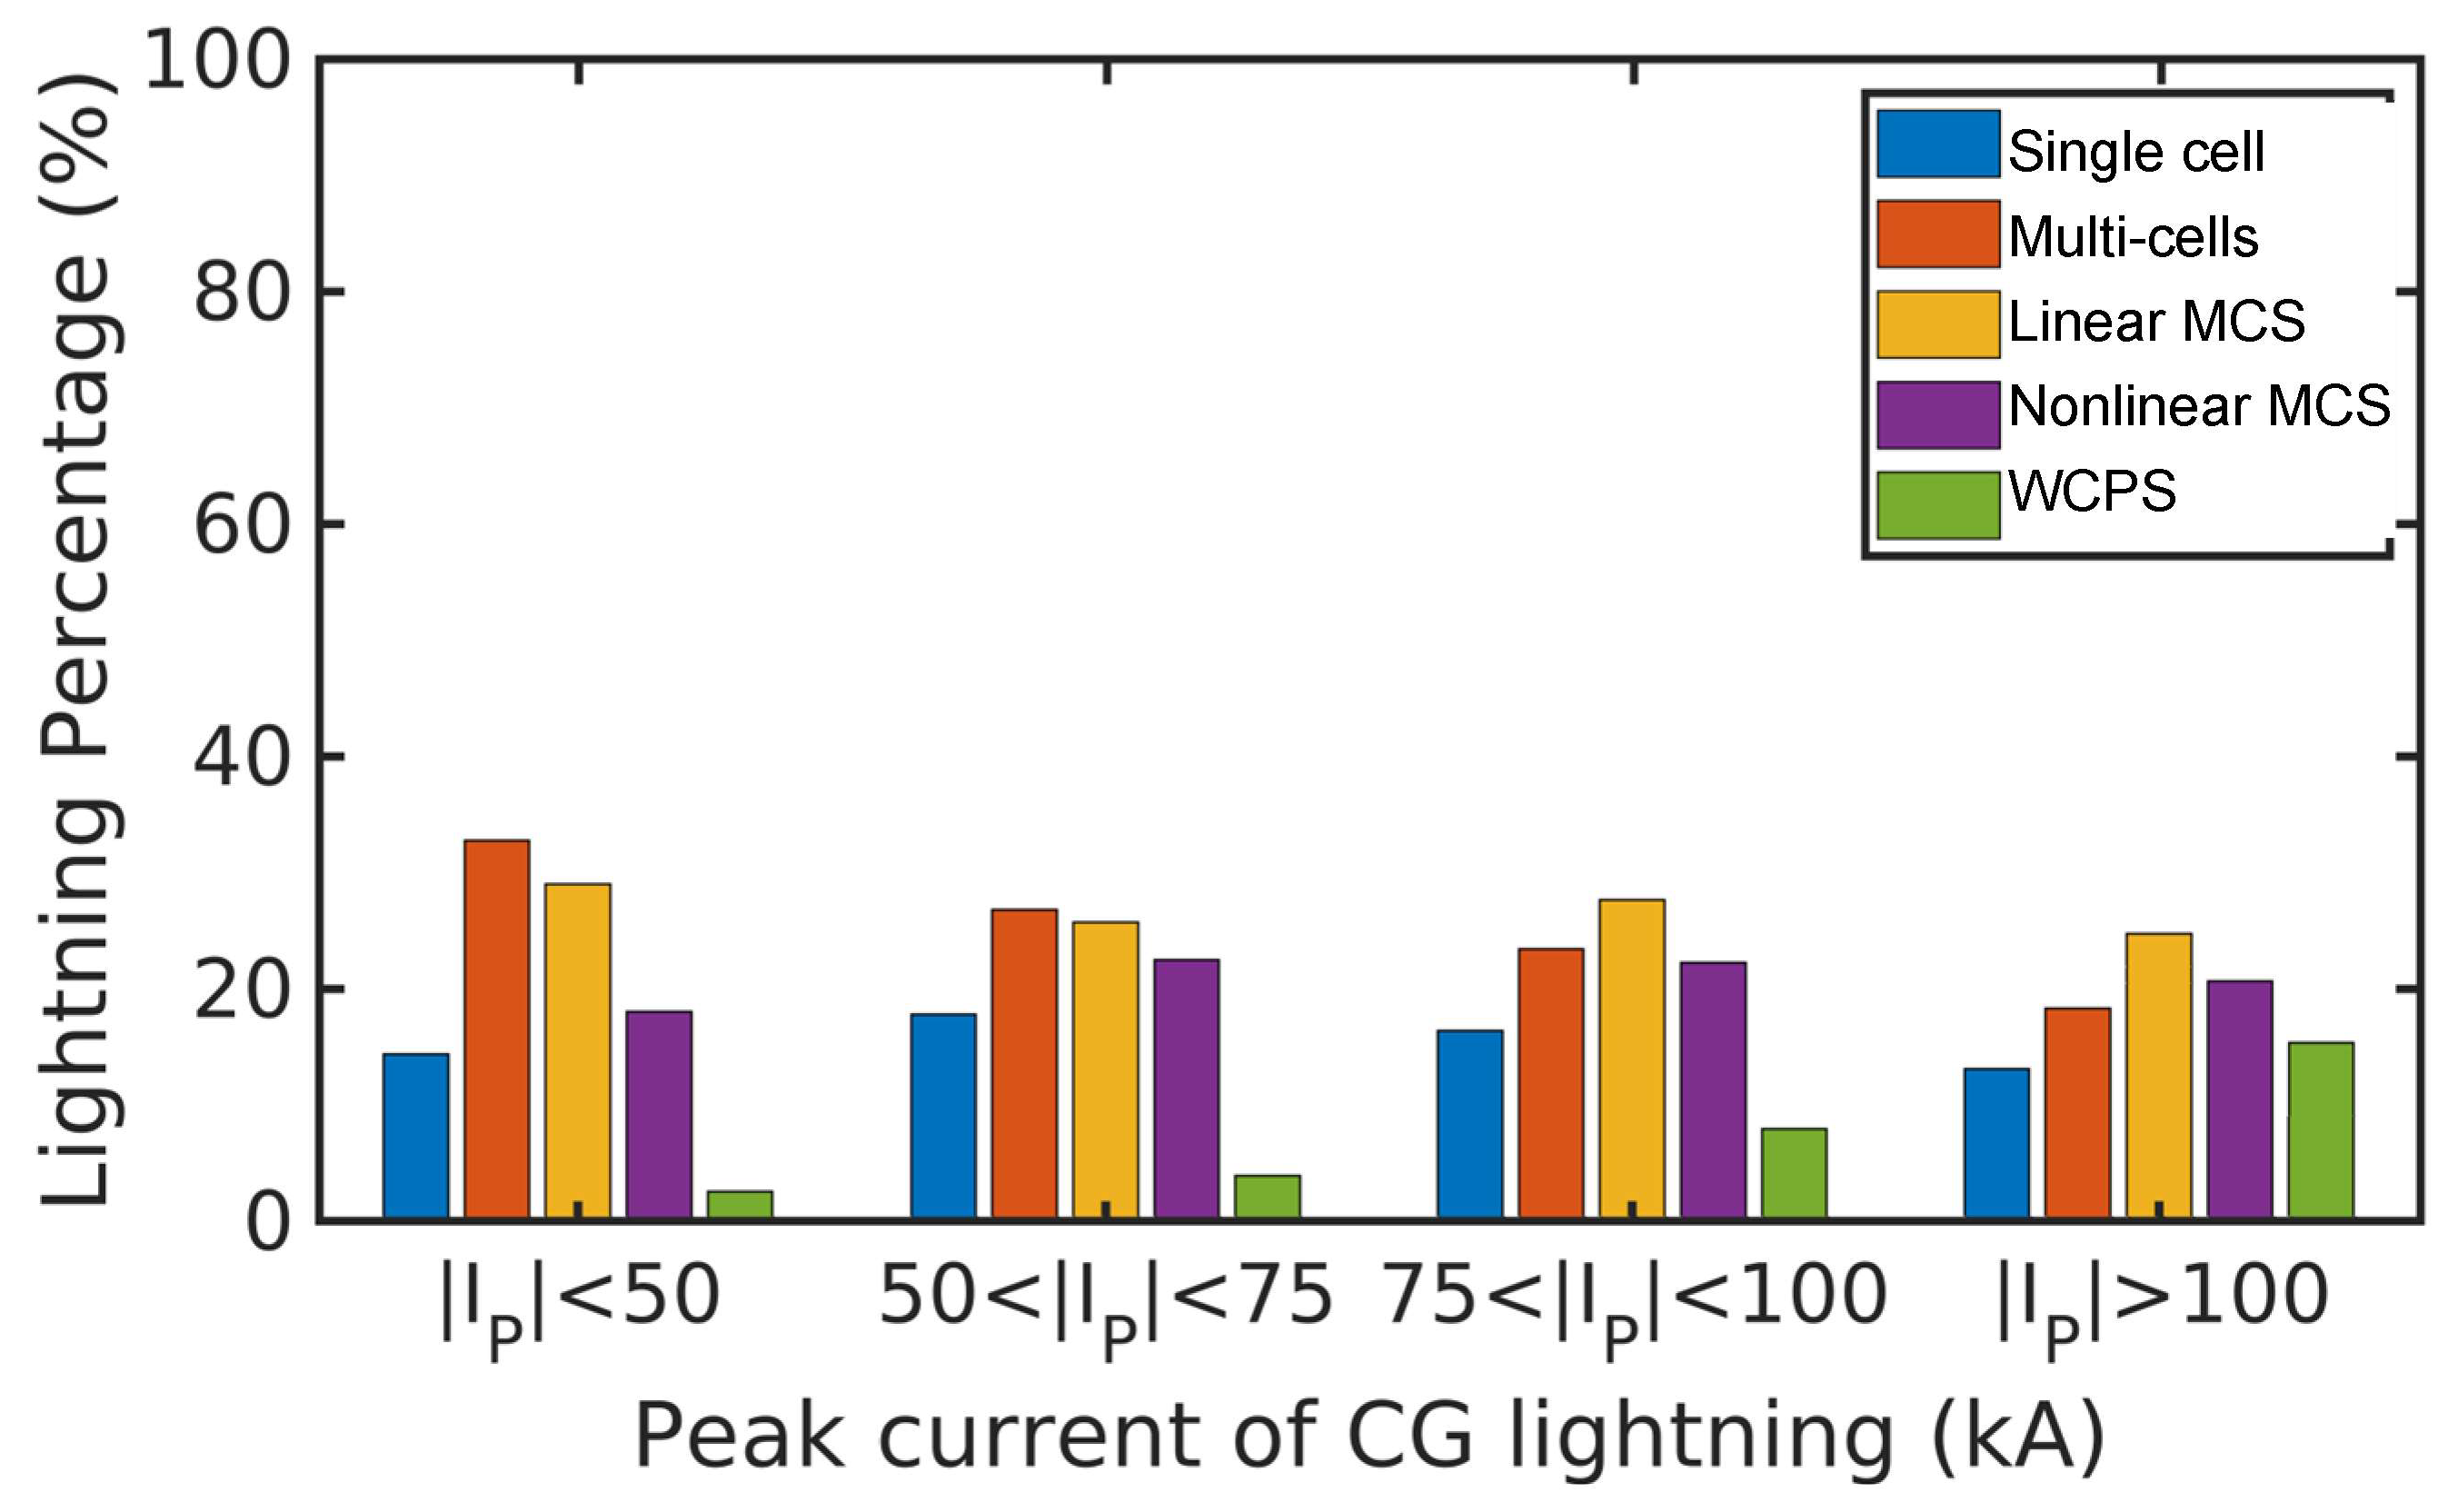
3.2. The Characteristics of Lightning Activity in Different Categories of Thunderstorms

The diurnal variations in thunderstorm occurrence, lightning frequency, and accumulated precipitation differed among different categories of thunderstorms (Figure 5). The maximum number of single cells occurred at around 15:00 LT, while the minimum was observed in the early morning at approximately 5:00 LT. Meanwhile, the diurnal variations in lightning frequency exhibited a bimodal distribution, with a morning sub-peak at 3:00 LT and an afternoon peak at 18:00 LT. Furthermore, the diurnal variability of precipitation demonstrated a phase delay, with the nocturnal maxima occurring at 21:00 LT. The peak occurrence of multi-cells appeared around 19:00 LT, whereas the lightning frequency peaked at 14:00 LT, and the precipitation concentrated in the afternoon, with the maximum appearing at 17:00 LT. Linear MCS generated the highest lightning frequency and the accumulated precipitation. The thunderstorm occurrence and accumulated precipitation exhibited an afternoon maximum at about 16:00 LT. However, the maximum lightning frequency occurred at 14:00 LT, preceding the precipitation peak. Similar to linear MCS, nonlinear MCS also exhibited late-afternoon characteristics with maximum thunderstorm occurrence, lightning frequency, and accumulated precipitation occurring between 17:00 LT and 19:00 LT, indicating that nonlinear MCSs were more favorable for generating in the late afternoon and night. The maximum storm occurrence and the lightning frequency of WCPS both occurred at 18:00 LT, about two hours earlier than the maximum precipitation. Overall, the timing of peak lightning frequency tended to lead to precipitation, which showed similar trends in related studies [49,50]. The time lag between lightning frequency and accumulated precipitation is attributed to the formation mechanism of electrification and precipitation of thunderstorms. After the collision and riming processes, the large-sized charging particles acted as precipitation particles and fell to the ground. Except for linear MCS, the other four categories of thunderstorms exhibited obvious nocturnal precipitation features, with the precipitation concentrating from 20:00 LT to 4:00 LT. This finding was consistent with the results in Figure 3, which showed that a high percentage of thunderstorms was associated with nocturnal convection.
The percentage of lightning numbers varies significantly among different thunderstorm categories. The ratio of CG: ALL lightning and +CG: CG lightning in each category of the thunderstorm is shown in Figure 6. Multi-cells and linear MCS generated the majority of lightning, which was dominated by IC lightning. CG lightning only occupied around 20%, and +CG lightning accounted for the lowest proportion. Both types of thunderstorms developed more vigorously, lasted longer, and generated frequent lightning. Nonlinear MCSs and single cells generated approximately 15% of total lightning, respectively. In the type of nonlinear MCS, the proportion of CG lightning accounted for 32%, while single cells occupied the lowest proportion of CG lightning at 12%. Additionally, the +CG: CG ratio of these two categories was relatively high at 0.28. Although the WCPS generated the lowest percentage of lightning at 5%, +CG: CG accounted for the highest at 0.3. It suggested that the WCPS was more likely to produce +CG lightning. WCPS typically has relatively weak but broad-scale updrafts, which can reduce the entrainment of ambient air and deplete cloud liquid water. These conditions can promote the formation of SLW and graupel particles in the mixed-phase region, resulting in +CG lightning occurrence.
The percentages of total lightning and +CG lightning exhibited opposite characteristics. Thunderstorms with a high percentage of lightning tended to have a lower +CG lightning ratio, while thunderstorms with a low lightning percentage preferred a high +CG lightning proportion. The charge structure of most thunderstorms can be simplified as a normal tripolar pattern with a negative charge region in the middle level and a positive charge region in the upper and lower levels, respectively. Indeed, the charge structure of thunderstorms is much more complex than dipolar or tripolar patterns. Thunderstorms with normal tripolar charge structures generate a significant fraction of −CG lightning [51]. A high percentage of +CG lightning occurs during specific periods, such as the early initial and late dissipating stages, as well as thunderstorms with hailstone [52]. Furthermore, +CG lightning is more likely to be generated in the stratiform region of thunderstorms [16,53]. Moreover, anomalous charge structure of thunderstorms, such as inverted charge structure, titled charge structure, and multiple charge regions, may also be responsible for the dominance of +CG lightning [15,24].
Different thresholds of the peak current were defined for CG lightning, including |Ip| < 50 kA, 50 kA < |Ip| < 75 kA, 75 kA < |Ip| < 100 kA, and |Ip| >100 kA (Figure 7). The peak current of CG lightning generated by linear MCS and multi-cells at each interval accounted for a large proportion. At different thresholds, CG lightning flashes generated by single cells accounted for about 18%, and nonlinear MCS occupied roughly 20%. In addition, the percentage of CG lightning generated by WCPS gradually increased at different current intervals. This finding aligned with previous studies showing that the stratiform region of thunderstorms usually generated CG lightning with large peak currents, especially +CG lightning [54,55].

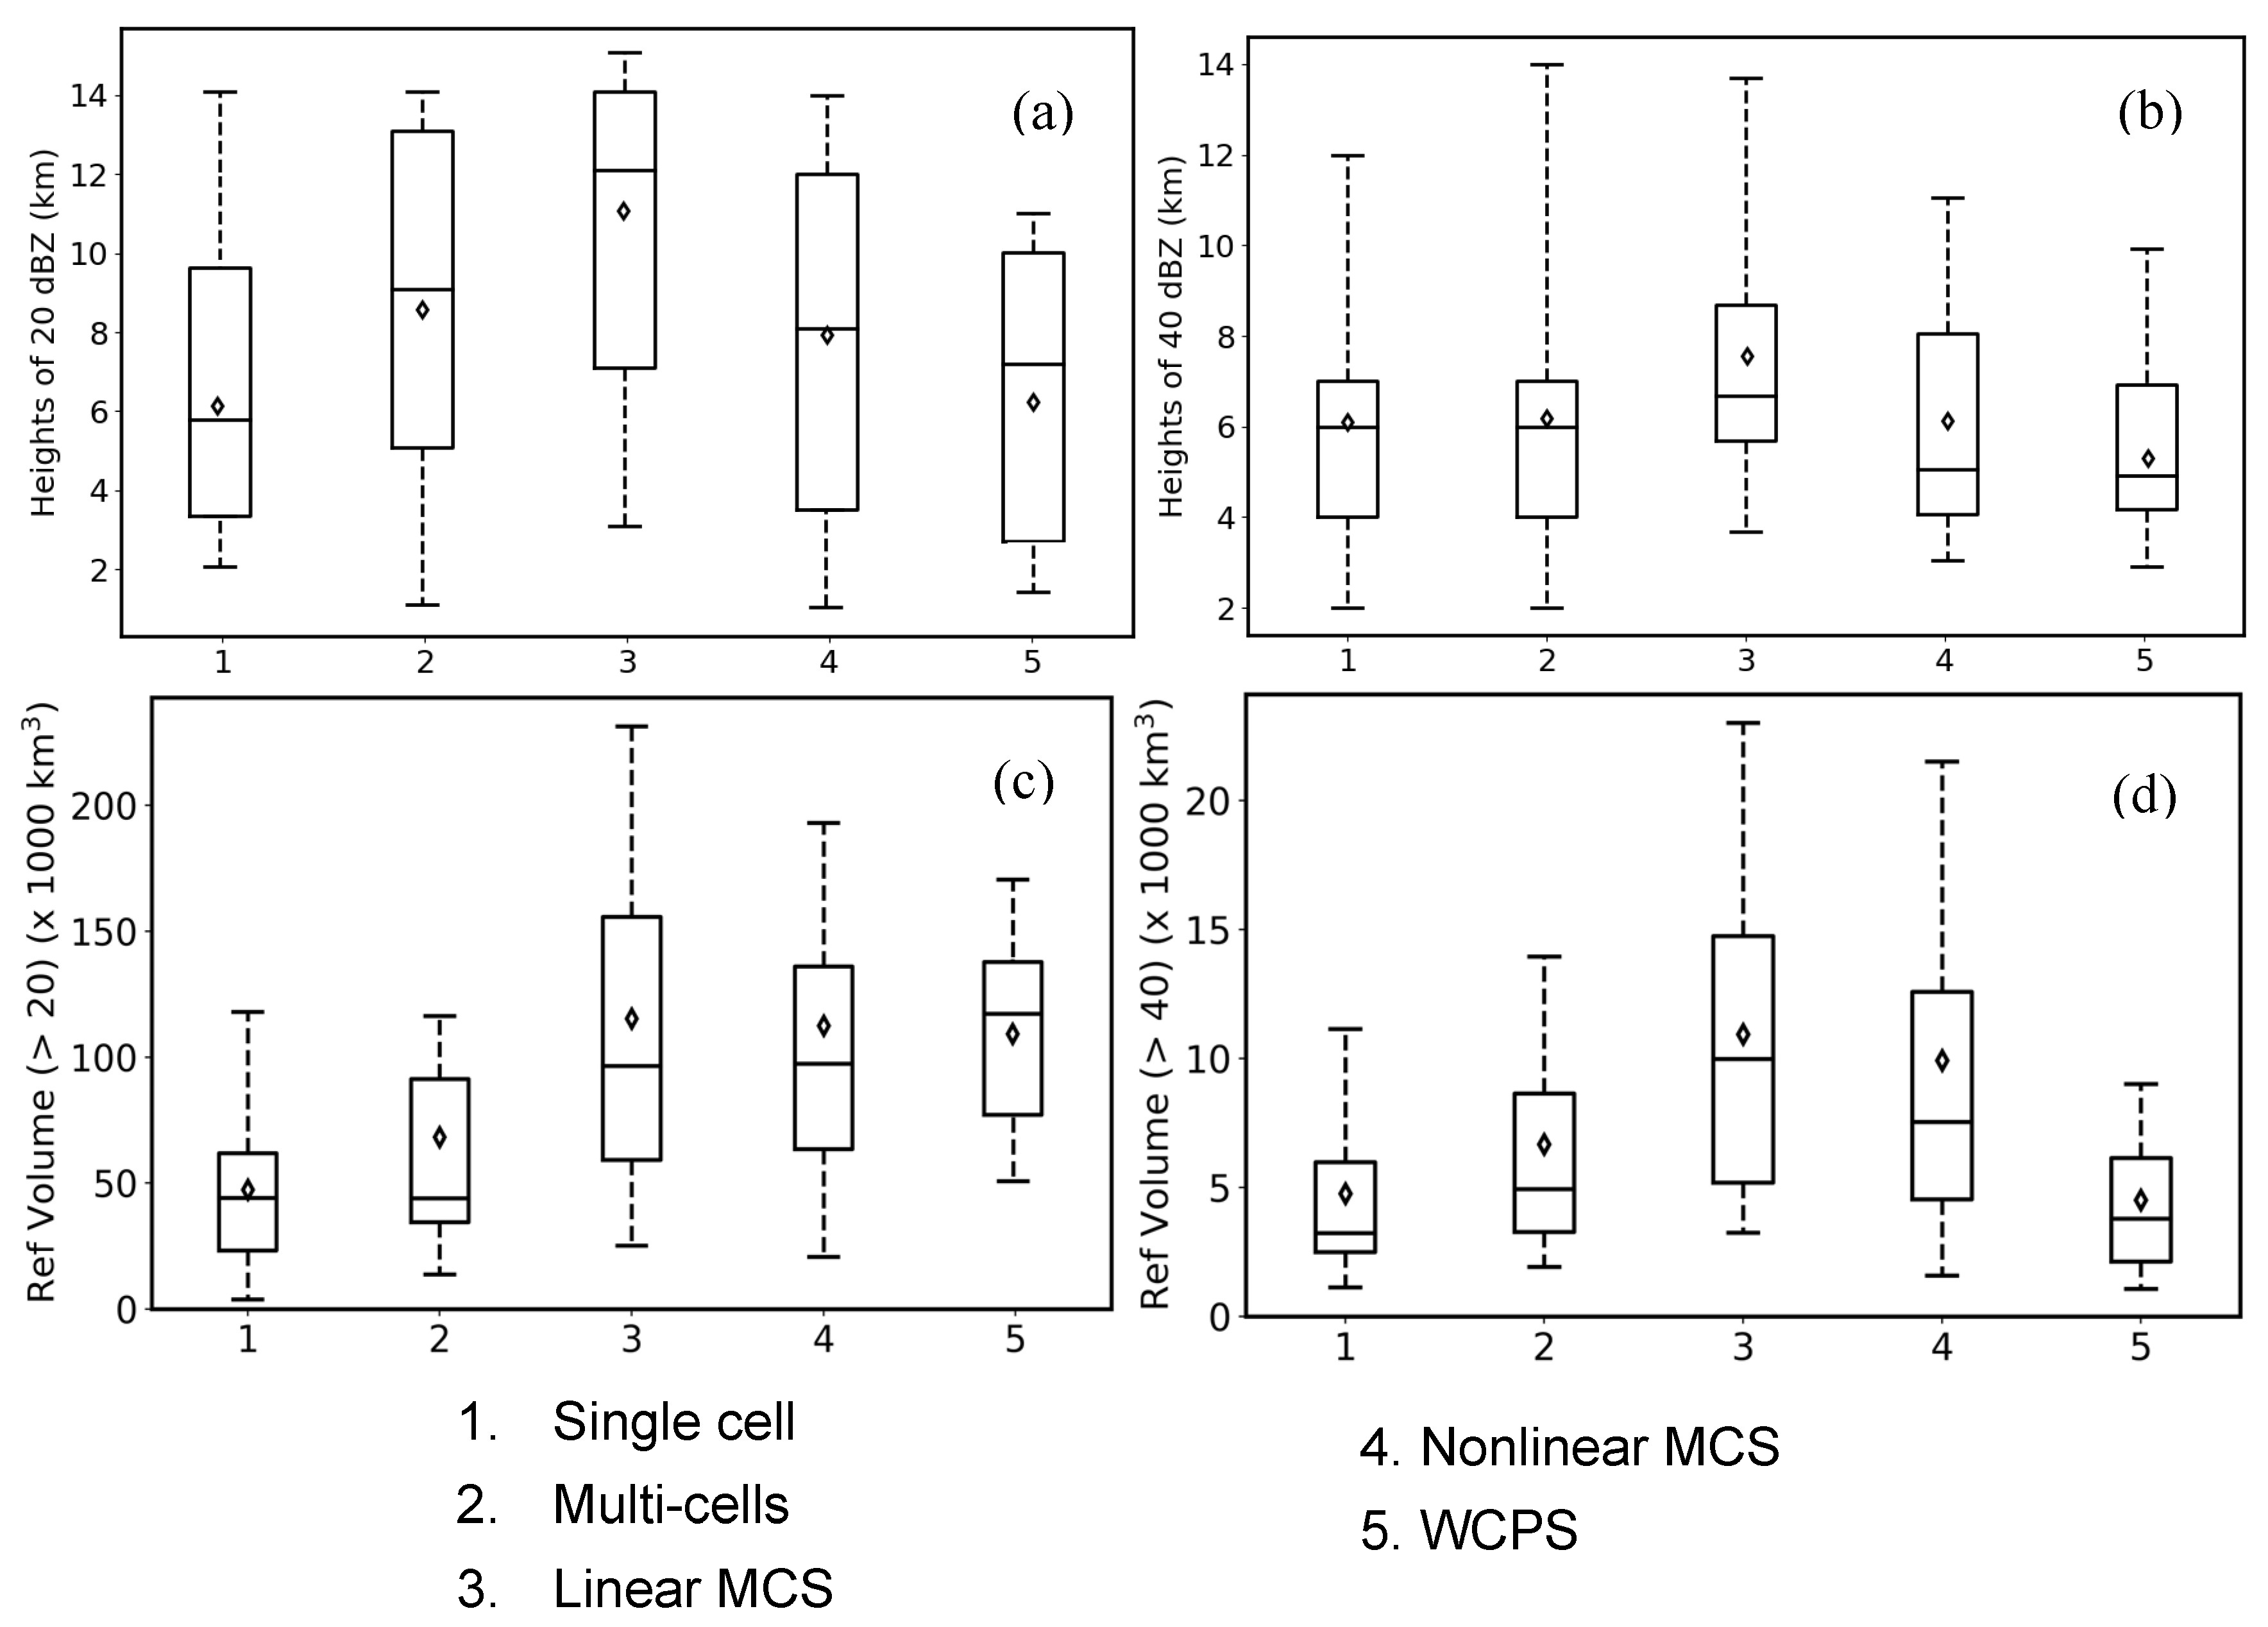
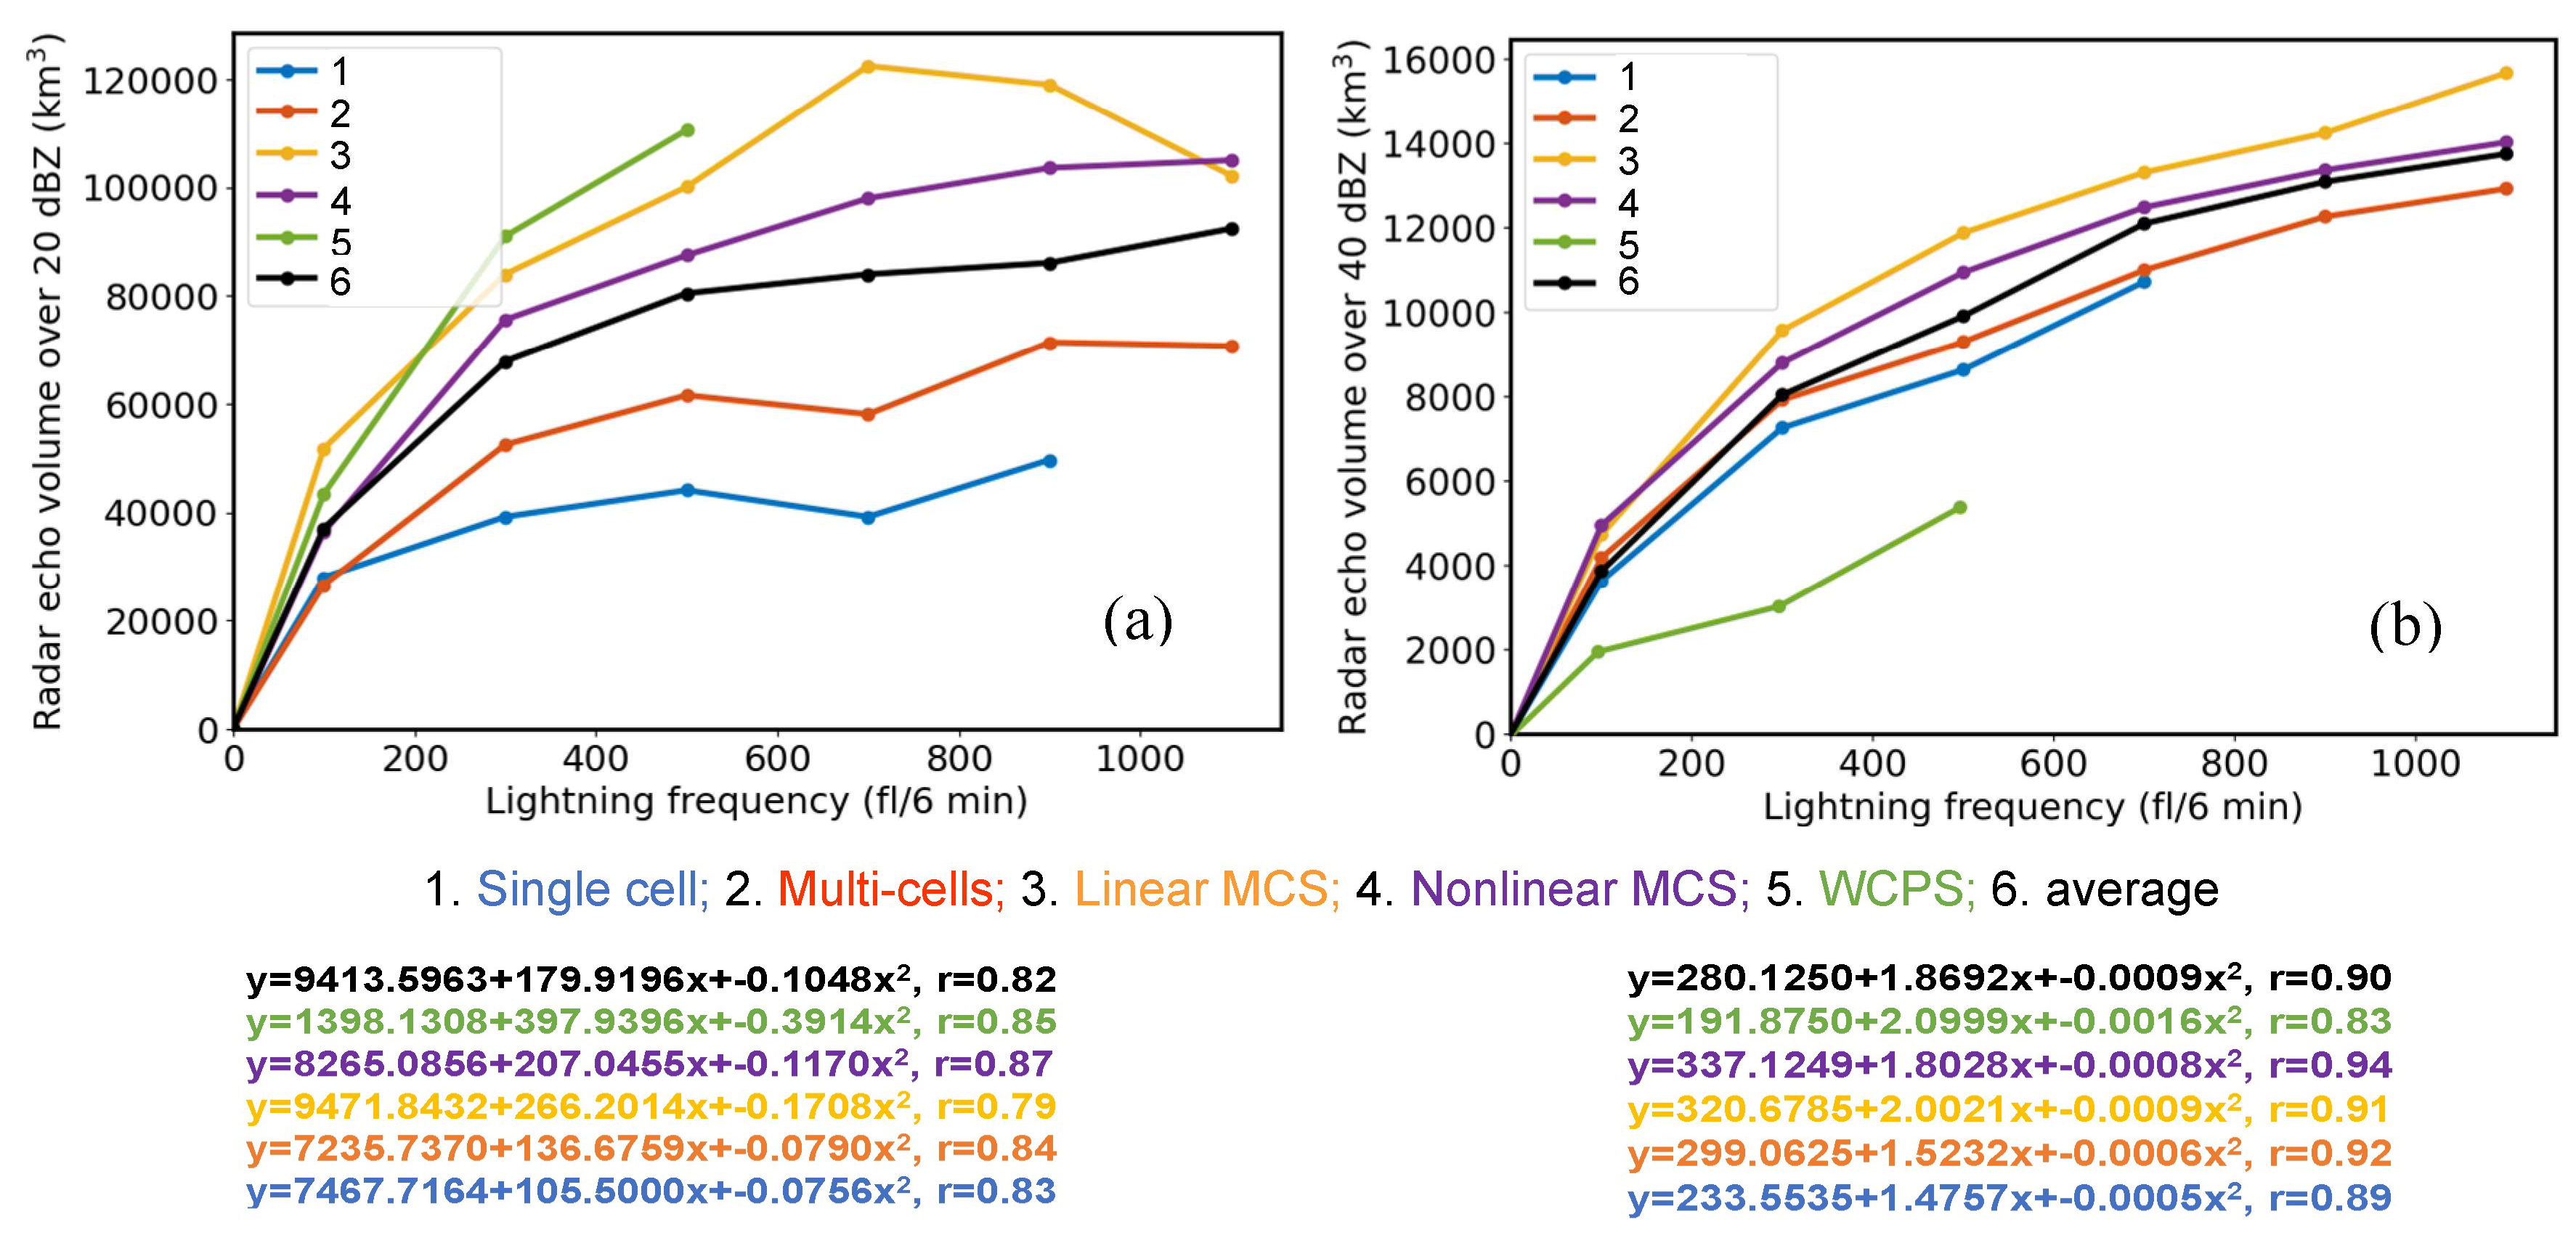
3.3. Relationship between Lightning Activity and Radar Reflectivity Gradients

To some extent, deep convection can be characterized by the height of radar echo reached at 20 dBZ (H20dBZ) and the volume of 20 dBZ (V20dBZ). In addition, the height of 40 dBZ radar echo (H40dBZ) and the volume of 40 dBZ (V40dBZ) above the level of 0 °C can be considered a good indicator of convective strength and lightning activity (Figure 8). The mean H20dBZ and H40dBZ of linear MCS were both the highest among the five categories of thunderstorms, reaching 11 km and 8 km, respectively. Some of them even exceeded the tropopause, with H20dBZ reaching 16 km, which suggested that larger particles, such as graupel-sized particles, could be lifted into higher levels within the deep mixed-phase region of linear MCS. In contrast, the mean H20dBZ and H40dBZ were relatively low for single cells, multi-cells, and nonlinear MCSs, with the lowest value in WCPS. A small fraction of single cells, multi-cells, and nonlinear MCS could develop to higher levels, with H20dBZ reaching 15 km, indicating that the large ice-phase particles were elevated to a lower height than that of linear MCS. Due to weak updraft and convection, the lowest mean H40dBZ occurred in the WCPS, with a height of 5 km.
The V40dBZ could be identified as the volume of ice-phase particles, which played a significant role in determining the magnitude of electrification. The average V20dBZ and V40dBZ of linear MCS were the largest among the five categories of thunderstorms, indicating that the graupel-sized ice-phase particles were mainly concentrated in the mixed-phase region (0 °C to −40 °C). The V20dBZ of WCPS was larger than that of single cells and multi-cells, but the V40dBZ was the smallest among the five categories of thunderstorms. The results indicated that the ice-based process of WCPS was relatively weak and might be a shallow mixed-phase region dominated by the warm-rain process.
The larger radar echo volumes corresponded to higher lightning frequency, and the lightning frequency was closely correlated with V40dBZ, especially in well-organized thunderstorm categories, such as linear MCS, multi-cells, and nonlinear MCS. This suggested that plenty of large-sized ice-phase particles in the mixed-phase region were crucial in enhancing charge separation and electrification, leading to more frequent lightning. Although there was a correlation between lightning frequency and V20dBZ, the correlation was not as strong as that with V40dBZ (Figure 9). In terms of the strong radar echo (>40 dBZ) displaying discrete and unorganized structure, the lightning frequency and V40dBZ showed a relatively weak correlation of WCPS.

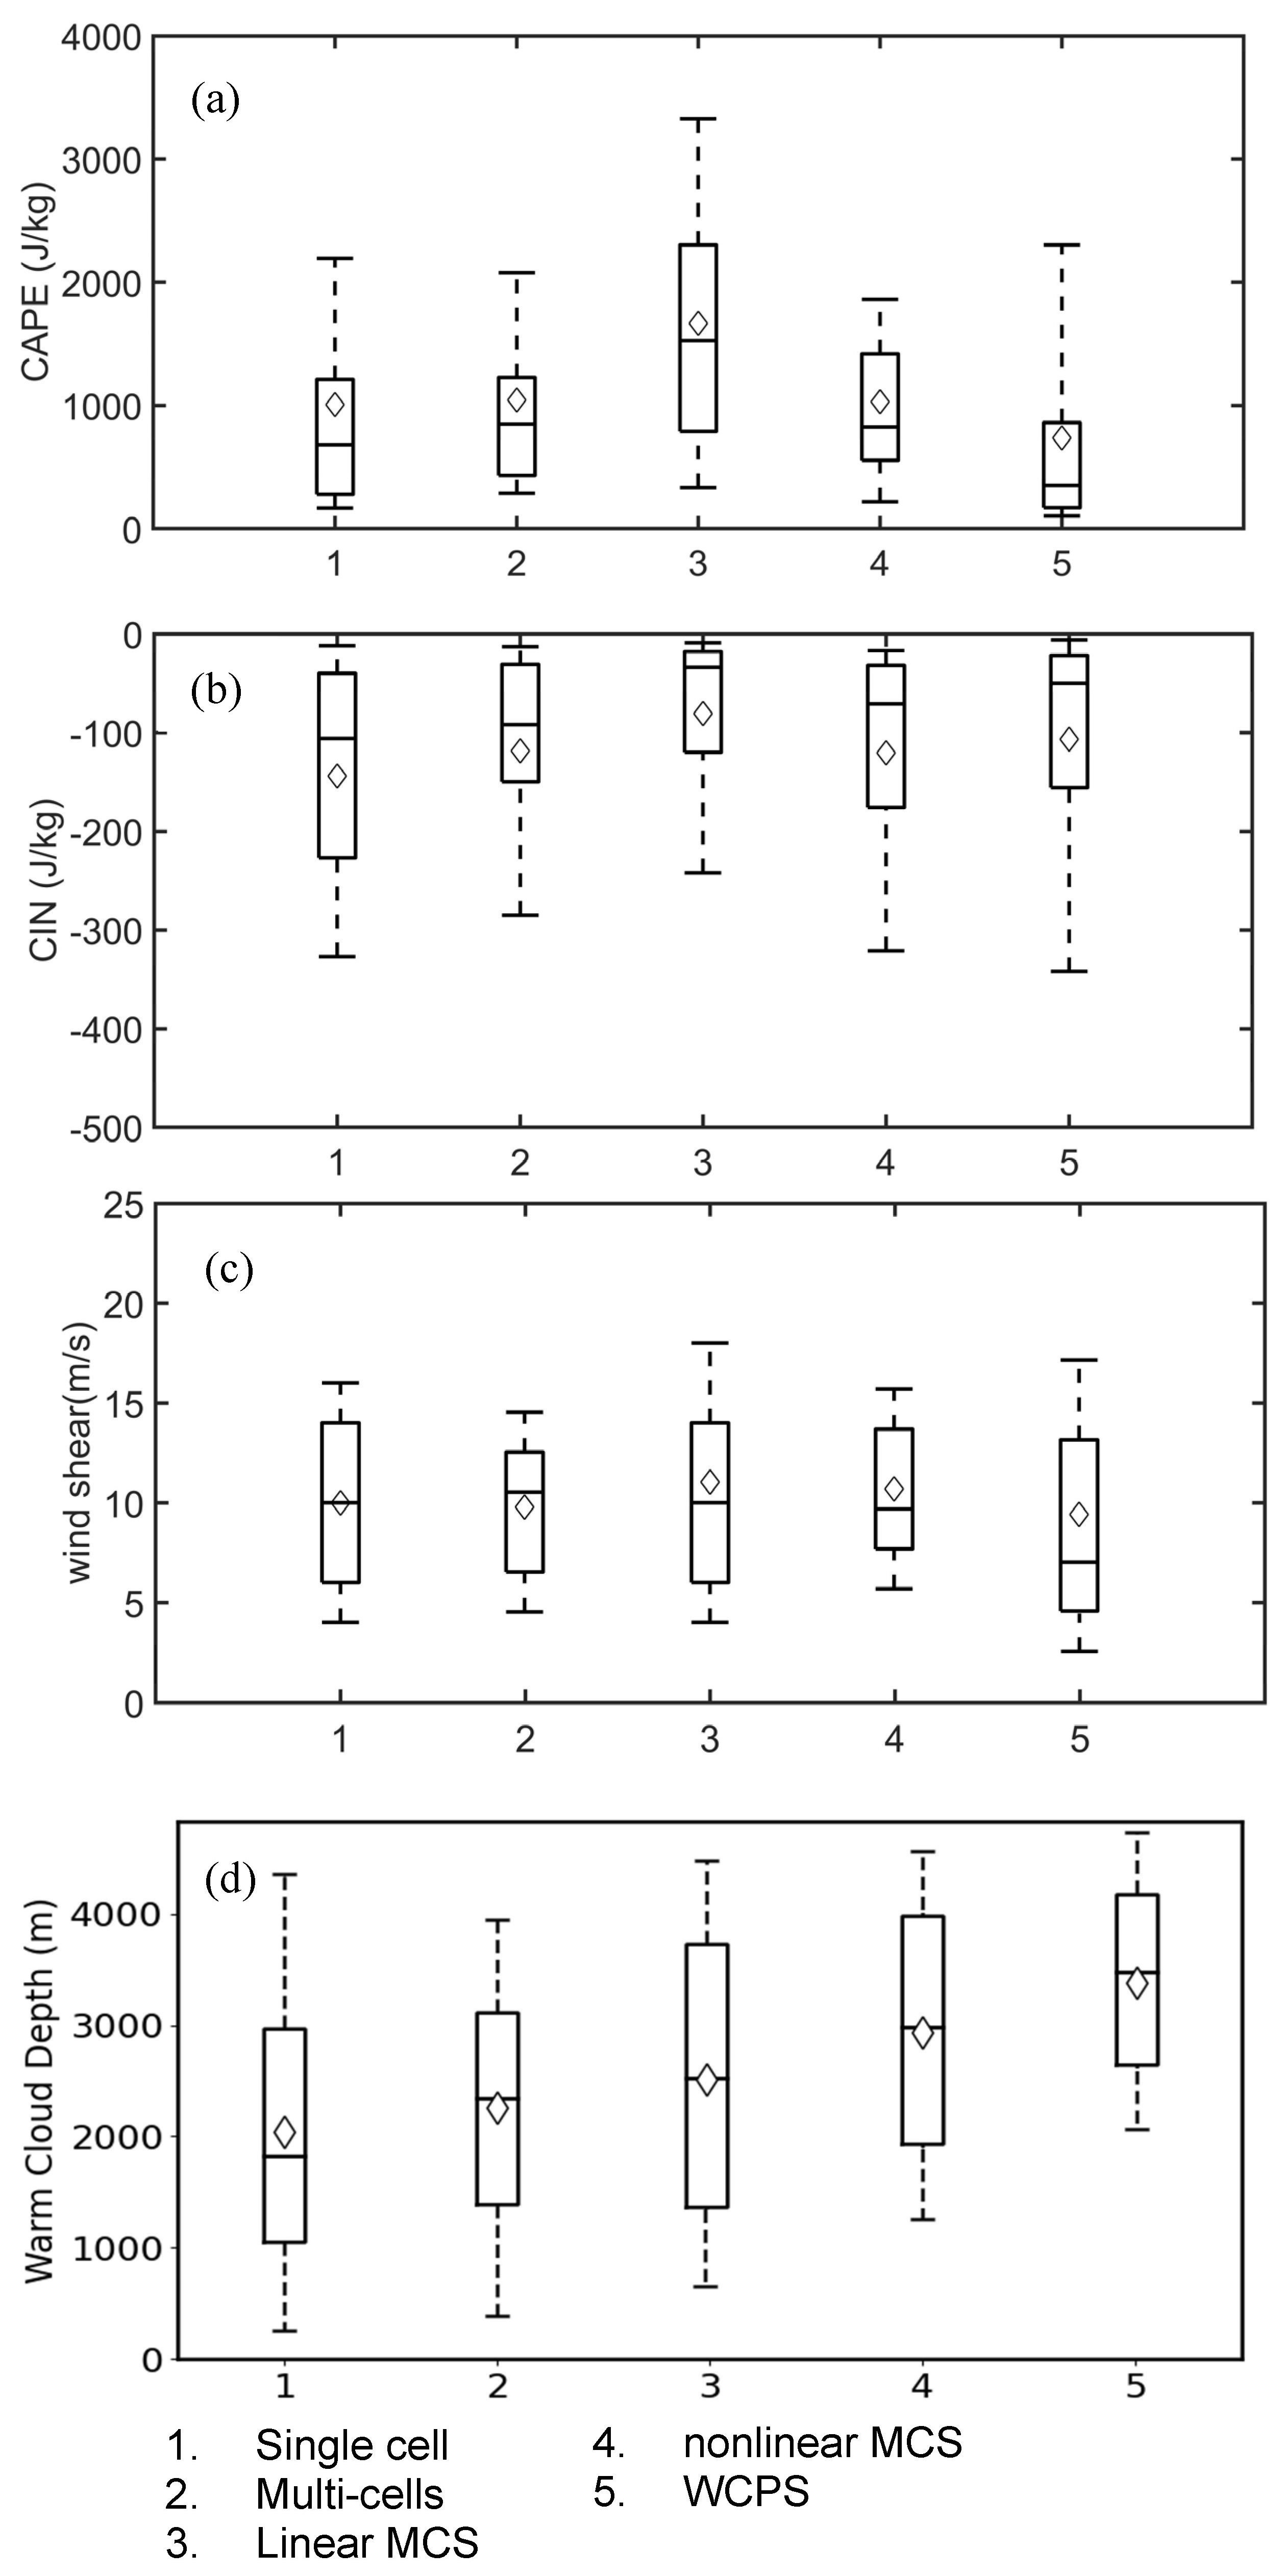
3.4. Variations in Environmental Factors in Different Categories of Thunderstorms

As numerous studies highlighted [56,57,58], the dynamical and thermodynamical convective factors play an important role in the initiation and development of thunderstorms. Consequently, the convective components indicate the intensity of convection and reflect the electrical activity of thunderstorms. The 0–6 km wind shear is a crucial parameter for initiating new convective cells that has a significant effect on maintaining the convective intensities of thunderstorms [59,60].
Linear MCS possessed the highest average CAPE, with a maximum of 4422 J/kg and a mean value of 1667 J/kg. Additionally, the mean value of 0–6 km wind shear was the strongest among the different categories, with a mean value of 12 m/s and a maximum of 20 m/s (Figure 10c). In contrast, the mean CIN (Convective Inhabitation) of the linear MCS was the lowest. The mean CAPE of multi-cells, nonlinear MCS, and single cells were relatively similar, corresponding to 1044 J/kg, 1030 J/kg, and 1008 J/kg, respectively. In addition, the mean wind shear of these three categories of thunderstorms varied from 9 m/s to 11 m/s. In comparison, the WCPS had the lowest CAPE with a mean value of 737 J/kg, a relatively large CIN, and weaker wind shear with a mean value of 8 m/s.
Previous studies have shown that larger WCDs promote coalescence processes between growing rain droplets, rapidly depleting available cloud water and causing rain to fall out of the updraft before freezing. In contrast, small WCDs are thought to deplete cloud water, shorten the time for warm rain growth, and inhibit warm-phase precipitation. To some extent, the depth of WCD can reflect the intensity of convection. The box diagram of WCDs of different thunderstorm categories showed that the average WCD of WCPS was approximately 3.4 km with a maximum of 5.5 km. In addition, the mean WCD of nonlinear MCS reached 3 km, which was lower than that of the WCPS. Some studies have found that a shallow layer of positively charged graupel often presents near the melting level [24]. WCPS is primarily dominated by warm-cloud precipitation with less lightning occurrence and a high percentage of +CG lightning. The mean value of WCD in single cells was about 2 km, with a maximum of 5.6 km. Additionally, the WCD of multi-cells and linear MCS was relatively small, with a mean value of approximately 2.5 km. For multi-cells, linear MCS, and nonlinear MCS, these three types of severe thunderstorms were typically characterized by strong updrafts that lifted the cloud base height to higher levels and brought sufficient SLW into the mixed-phase and charging region (0 °C~−40 °C). The presence of SLW facilitated the formation of ice-phase particles and elevated the magnitude of charge separation in the mixed-phase region [23,26]. The larger graupel volumes of thunderstorms were attributed to higher wind shear and small WCDs.
A negative correlation has been observed between lightning flash rate and WCDs [24]. Thunderstorms with smaller WCDs are more conducive to intense convection and frequent lightning activity. Additionally, Yang et al. [61] also pointed out that compared with post-Meiyu thunderstorms, Meiyu thunderstorms generated fewer CG lightning flashes, which were related to different environmental conditions (updraft, WCD, and CAPE) and microphysical factors, especially the distribution of graupel particles. In addition, the results indicate that there are significant differences in the mean value of these convective factors between strong convective systems and WCPS, while the differences between other strong convective systems are not significant in convection parameters. Although the convective parameters obviously vary for each category of thunderstorms, the statistical results are obtained for different types of thunderstorms, which is helpful to deepen the understanding of different thunderstorms and provide a reference for model parameterizations.
The Hovmöller diagrams showed different spatial–temporal patterns of radar reflectivity ≥40 dBZ for each thunderstorm category (Figure 11). The number of hourly radar reflectivity ≥40 dBZ was averaged over the study region, as shown in Figure 1, along the area from the line AB to CD. Hourly radar reflectivity ≥40 dBZ of single cells dispersed and scattered from the mountain to the plain, indicating that single cells occurred irregularly and frequently throughout the day, with a higher occurrence in the afternoon. Multiple reasons, including terrain forcing, nocturnal convection initiation, and local circulation, might influence the distribution of single cells. The radar reflectivity ≥40 dBZ of multi-cells showed an obvious sloping distribution, which gradually increased along the mountain edge and strengthened over the southern plain region. In addition, thunderstorms occurred in the afternoon and night with a high frequency. The terrain force played a significant role in the formation of multi-cells, promoting the uplift of warm, moist air from the south and facilitating convection initiation along the foothills. Hourly radar reflectivity ≥40 dBZ of linear MCS increased significantly in the late afternoon, especially along the steeper terrain edge. The high frequency of thunderstorm occurrence gradually increased along the foothills. Topographic forcing is thought to be an important mechanism for convection development, contributing to the uplift of warm, moist air and the enhancement of thunderstorms [35]. The hourly radar reflectivity ≥40 dBZ of the nonlinear MCS was concentrated in the southern plain during the nighttime, which is related to the nocturnal convection trigger mechanism. The lowest frequency of radar reflectivity ≥40 dBZ occurred in WCPS, concentrated in the plain area as a nocturnal convective system.
In addition, the meridional winds from northwest to southeast were further investigated to find a possible convective initiation and evolution mechanism on different categories of thunderstorms (Figure 12). As the maxima thunderstorm occurred in the afternoon, the vertical cross-section of the northwest–southeast meridional winds through the urban center of the Beijing area at 1400 LT was adopted. The vertical cross-section showed that wind convergence mainly occurred along the slope of the mountain ridge, corresponding to the high thunderstorm initiation region in the afternoon. An obvious low-level cross-mountain wind was observed, which propagated from the southeast ocean to the northwest inland uplift area with warm and moisture airflow along the ridge under a steep gradient of the mountain slope. The wind gradient along the mountain slope was the largest for the linear MCS type, resulting in strong convection associated with linear MCS. The wind gradient of nonlinear MCS was smaller than that of linear MCS. The warm-moisture airflow propagated deeply into the interior area and crossed over the mountain. The low-level wind speed and gradient of single cells and WCPS were relatively small. Therefore, the larger meridional wind gradients facilitated the formation and maintenance of thunderstorms.
According to the analysis conducted herein, the different convective factors and lightning activity of the five thunderstorm categories can be summarized as follows (Figure 13). Topographic forcing mechanisms played an important role in the occurrence of single cells. As unorganized and short-lived convective cells, single cells occurred throughout the day with relatively large CAPE, small WCD, and small V40dBZ. Although single cells had the highest occurrence number, they generated relatively less lightning with a high percentage of +CG lightning. Topography slope forcing and large wind gradients played a vital role in the occurrence of linear MCS and multi-cells. Large CAPE, small WCD, and strong wind shear promoted the development of long-lived and well-organized convective systems with large V40dBZ and high H40dBZ. Therefore, linear MCS and multi-cells generated the maximum lightning frequency. Meanwhile, SLW was elevated to higher levels, and more ice-phase particles were generated above the 0 °C levels, which promoted the riming process and charge separation in the mixed-phase region, resulting in high lightning frequency. The nocturnal convection trigger mechanism made a significant contribution to nonlinear MCS occurrence. With the moderate WCD and H40dBZ, the convective intensity of nonlinear MCS was not as strong as linear MCS. However, it generated the highest percentage of CG lightning, possibly due to the relatively shallow lower-level charge region closer to the ground. WCPS is characterized by weak convection and large scale, weak instability (small CAPE), large WCD, and relatively small wind shear. Although the lightning percentage of WCPS was minimal, +CG lightning took the highest proportion among the five categories of thunderstorms, indicating that the stratiform–precipitation system preferentially generated +CG lightning with a large peak current. Broad and weak mesoscale updrafts in the middle of stratiform regions brought the SLW into the mix-phase region and formed ice-phase particles [24,61]. In addition, it inferred that the weak updraft of WCPS promoted the increase in charge density generated by noninductive charging [62,63].

4. Conclusions and Discussion

Based on five warm-season comprehensive and coordinated observations, 223 thunderstorms were analyzed and divided into five different categories. Meanwhile, the convective properties and lightning activity for different types of thunderstorms were investigated. The significant findings of this study are summarized as follows.
(1) The diurnal cycles of lightning frequency, thunderstorm occurrence, and precipitation of different categories all exhibited the late-afternoon peak. Lightning frequency tended to reach its maximum before precipitation. Except for linear MCSs, the other four categories of thunderstorms showed evident nocturnal precipitation. Linear MCS, characterized by vigorous convection and strong updrafts, generated the highest frequency of lightning. Linear MCS and multi-cells contributed to the most lightning numbers among the five categories. Nonlinear MCS generated a high percentage of CG lightning, indicating that the shallow lower charge region led to discharge to the ground. Single-cell and WCPS generated relatively lower lightning frequency but with a high ratio of +CG lightning, possibly influenced by anomalous charge structure;
(2) Relatively large CAPE, low CIN, small WCD, and strong wind shear facilitated the development of convection, resulting in more intense mixed-phase processes and more frequent lightning production. On the contrary, thunderstorms with small CAPE, high CIN, large WCD, and weak wind shear were mainly dominated by the growth of warm-phase precipitation and inhibited the ice-based processes, leading to weak convection and less lightning generation. The variables H20dBZ, H40dBZ, V40dBZ, and V20dBZ also showed obvious differences among the five thunderstorm categories. Thunderstorms with large H40dBZ and V40dBZ corresponded to long-lived and well-organized convective systems. In addition, the lightning frequency of five categories of thunderstorms was closely associated with radar echo volume. The relationship between lightning frequency and V40dBZ was more consistent than that of V20dBZ, indicating that higher radar reflectivity (greater than 40 dBZ) correlated better with lightning activity;
(3) In the daytime, the topographic forcing mechanism, combined with the warm air rising along mountain slopes, enhanced the formation of the afternoon thunderstorms along the steep mountain edges, especially linear MCS and multi-cells. At nighttime, the nocturnal convective initiation mechanism played a significant role in the formation and enhancement of thunderstorms, which performed obviously in the types of nonlinear MCS and WCPS.
The initiation and evolution of thunderstorms can be influenced by different terrain conditions, synoptic background, local circulation, and so on. As a result, the convective structures, microphysical processes, and charge structures of thunderstorms differ in different regions. However, as continental thunderstorms, the evolutional characteristics of the convective structures and the interactions of the dynamic-microphysics-electrification mechanisms of thunderstorms are basically in common. In summer, these five different categories of thunderstorms classified in this study occur relatively frequently over land, especially in the northern hemisphere. Therefore, the findings of our study are generalizable for further understanding the characteristics of lightning activity for different thunderstorms. In addition, the investigations on the lightning activity for different thunderstorm categories that relied on radar morphology-based classifications are relatively few. Limited studies have only focused on MCS or linear MCS types [9,10,11]. Furthermore, related studies did not systematically compare the convective structure and lightning characteristics of all warm-season thunderstorms, especially the categories of WCPS and single cell. Additionally, identical analyses of lightning activity under these five different morphological classifications have not been performed.
In this study, the classification includes all warm-season thunderstorms capable of producing lightning in this study. Moreover, total lightning information is used to reflect the entire electrification process fully [2,9] and also accurately indicate the relationship between convective structure and thunderstorm lightning activity. The results reveal distinct characteristics of lightning activities of five categories of thunderstorms and the relationships between different convective properties and lightning. The effect of topography forcing and nocturnal convective mechanisms in the occurrence and enhancement of all warm-season thunderstorm categories are also discussed. To a certain extent, our findings extend the scope of knowledge on thunderstorm classification associated with lightning activity.
This preliminary work offers a valuable look at trends in the total lightning of different categories of thunderstorms, which will provide the forecasting indicators for the evolution of convective structure and lightning activity trends in different categories of thunderstorms. Further investigation is needed to deeply explore the convective initiation mechanisms, microphysical characteristics, and charge structures of these different thunderstorm categories. These studies will contribute to a more comprehensive understanding of the underlying mechanisms of different categories of thunderstorms and improve our ability to forecast and manage thunderstorm-related hazards.

Author Contributions

Conceptualization, D.L.; methodology, D.L. and Z.S.; software, H.Y.; validation, D.W.; formal analysis, D.L.; resources, H.Z.; data curation, D.W.; writing—original draft preparation, D.L.; writing—review and editing, D.L. All authors have read and agreed to the published version of the manuscript.

Funding

This study is supported by the National Natural Science Foundation of China (Grant No. 42230609 and No. 41875007) and the Open Grants of the State Key Laboratory of Severe Weather (2023LASW-B22).

Data Availability Statement

The radar data that support the findings of this study are available in the Beijing Meteorology Administration (http://www.nmc.cn/publish/radar/bei-jing/da-xing.htm (accessed on 1 January 2023)). ECMWF reanalysis data are openly available to download from the website (https://www.ecmwf.int/en/forecasts/datasets/browse-reanalysis-datasets (accessed on 1 January 2023)). The precipitation, radar, and lightning data that support the findings are available at https://zenodo.org/record/7980456 (accessed on 1 January 2024).

Acknowledgments

Beijing Meteorological Administration is appreciated for providing the data from the auto weather station and sounding data. The authors declare that they have no conflicts of interest. The authors are thankful for the effort of all the people who participated in the coordinated observations of Dynamic–Microphysical–Electrical processes in severe thunderstorms and lightning hazards.

Conflicts of Interest

The authors declare no conflicts of interest.

References

  1. Carey, L.D.; Rutledge, S.A. Characteristics of cloud-to-ground lightning in severe and nonsevere storms over the central United States from 1989–1998. J. Geophys. Res. 2003, 108, 1–21. [Google Scholar] [CrossRef]
  2. Xia, R.; Zhang, D.; Zhang, C.; Wang, Y. Synoptic control of convective rainfall rates and cloud-to-ground lightning frequencies in warm-season mesoscale convective systems over North China. Mon. Weather Rev. 2018, 146, 813–831. [Google Scholar] [CrossRef]
  3. Parker, M.D.; Johnson, R.H. Organizational modes of midlatitude mesoscale convective systems. Mon. Weather Rev. 2000, 128, 3413–3436. [Google Scholar] [CrossRef]
  4. Gallus, W.A.; Nathan, A.S.; Elise, V.J. Spring and summer severe weather reports over the Midwest as a function of convective mode: A preliminary study. Weather Forecast. 2008, 23, 101–113. [Google Scholar] [CrossRef]
  5. Houze, R.A. Mesoscale convective systems. Rev. Geophys. 2004, 42, 1–43. [Google Scholar] [CrossRef]
  6. Pettet, C.R.; Johnson, R.H. Airflow and precipitation structure of two leading stratiform mesoscale convective systems determined from operational datasets. Weather Forecast. 2003, 18, 685–699. [Google Scholar] [CrossRef]
  7. Ma, R.Y.; Sun, J.H.; Yang, X.L. A 7-Yr Climatology of the Initiation, Decay, and Morphology of Severe Convective Storms during the Warm Season over North China. Mon. Weather Rev. 2021, 149, 2599–2612. [Google Scholar]
  8. Boussaton, M.P.; Soula, S.; Coquillat, S. Total lightning activity in thunderstorms over Paris. Atmos. Res. 2007, 84, 221–232. [Google Scholar] [CrossRef]
  9. Parker, M.D.; Rutledge, S.A.; Johnson, R.H. Cloud-to-Ground Lightning in Linear Mesoscale Convective Systems. Mon. Weather Rev. 2001, 129, 1232–1242. [Google Scholar] [CrossRef]
  10. Liu, D.; Sun, M.; Su, D.; Xu, W. A five-year climatological lightning characteristics of linear mesoscale convective systems over North China. Atmos. Res. 2021, 256, 105580. [Google Scholar] [CrossRef]
  11. Makowski, J.A.; MacGorman, D.R.; Biggerstaff, M.I.; Beasley, W.H. Total Lightning characteristics relative to radar and satellite observations of oklahoma mesoscale convective system. Mon. Weather Rev. 2013, 141, 1593–1611. [Google Scholar] [CrossRef]
  12. Takahashi, T. Riming Electrification as a Charge Generation Mechanism in Thunderstorms. J. Atmos. Sci. 1978, 35, 1536–1548. [Google Scholar] [CrossRef]
  13. Saunders, C.P.R.; Keith, W.D.; Mitzeva, R.P. The effect of liquid water on thunderstorm charging. J. Geophys. Res. 1991, 96, 11007–11017. [Google Scholar] [CrossRef]
  14. Mansell, E.R.; Ziegler, C.L.; Bruning, E.C. Simulated Electrification of a Small Thunderstorm with Two-Moment Bulk Microphysics. Mon. Weather Rev. 2010, 67, 171–194. [Google Scholar] [CrossRef]
  15. Williams, E. The electrification of severe storms. In Severe Convective Storms; American Meteorological Society: Boston, MA, USA, 2001; pp. 527–561. [Google Scholar]
  16. Carey, L.D.; Murphy, M.J.; McCormick, T.L.; Demetriades, N.W.S. Lightning location relative to storm structure in a leading-line, trailing-stratiform mesoscale convective system. J. Geophys. Res. 2005, 110, D03105. [Google Scholar] [CrossRef]
  17. Bruning, E.C.; Weiss, S.A.; Calhoun, K.M. Continuous variability in thunderstorm primary electrification and an evaluation of inverted-polarity terminology. Atmos. Res. 2014, 135, 274–284. [Google Scholar] [CrossRef]
  18. Stough, S.M.; Carey, L.D.; Schultz, C.J.; Cecil, D.J. Examining conditions supporting the development of anomalous charge structures in supercell thunderstorms in the Southeastern United States. J. Geophys. Res. 2021, 126, e2021JD034582. [Google Scholar] [CrossRef]
  19. Sun, C.; Liu, D.X.; Xiao, X.; Chen, Y.C.; Liu, Z.R.; Sun, Y. The electrical activity of a thunderstorm under high dust circumstances over Beijing metropolis region. Atmos. Res. 2023, 285, 106628. [Google Scholar] [CrossRef]
  20. Brooks, H.E. Severe thunderstorms and climate change. Atmos. Res. 2013, 123, 129–138. [Google Scholar] [CrossRef]
  21. Trapp, R.J.; Diffenbaugh, N.S.; Gluhovsky, A. Transient response of severe thunderstorm forcing to elevated greenhouse gas concentrations. Geophys. Res. Lett. 2009, 36, L01703. [Google Scholar] [CrossRef]
  22. Seeley, J.T.; Romps, D.M. The effect of global warming on severe thunderstorms in the United States. J. Clim. 2015, 28, 2443–2458. [Google Scholar] [CrossRef]
  23. Carey, L.D.; Buffalo, K.M. Environmental Control of Cloud-to-Ground Lightning Polarity in Severe Storms. Mon. Weather Rev. 2007, 135, 1327–1353. [Google Scholar] [CrossRef]
  24. Fuchs, B.R.; Rutledge, S.A.; Bruning, E.C.; Pierce, J.R.; Kodros, J.K.; Lang, T.J. Environmental controls on storm intensity and charge structure in multiple regions of the continental United States. J. Geophys. Res. 2015, 120, 6575–6596. [Google Scholar] [CrossRef]
  25. Minobe, S.; Park, J.H.; Virts, K.S. Diurnal Cycles of Precipitation and Lightning in the Tropics Observed by TRMM3G68, GSMaP, LIS, and WWLLN. J. Clim. 2020, 33, 4293–4313. [Google Scholar] [CrossRef]
  26. Fuchs, B.R.; Rutledge, S.A.; Dolan, B.; Carey, L.D.; Schultz, C. Microphysical and kinematic processes associated with anomalous charge structures in isolated convection. J. Geophys. Res. 2018, 123, 6505–6528. [Google Scholar] [CrossRef]
  27. Carey, L.D.; Schultz, E.V.; Schultz, C.J.; Deierling, W.; Petersen, W.A.; Bain, A.L.; Pickering, K.E. An Evaluation of Relationships between Radar-Inferred Kinematic and Microphysical Parameters and Lightning Flash Rates in Alabama Storms. Atmosphere 2019, 10, 796. [Google Scholar] [CrossRef]
  28. Fierro, A.O.; Mansell, E.R. Relationships between Electrification and Storm-Scale Properties Based on Idealized Simulations of an Intensifying Hurricane-like Vortex. Mon. Weather Rev. 2018, 75, 657–674. [Google Scholar] [CrossRef]
  29. Zipser, E.J.; Lutz, K.R. The Vertical Profile of Radar Reflectivity of Convective Cells: A Strong Indicator of Storm Intensity and Lightning Probability? Mon. Weather Rev. 1994, 122, 1751–1759. [Google Scholar] [CrossRef]
  30. Deierling, W.; Petersen, W.A. Total lightning activity as an indicator of updraft characteristics. J. Geophys. Res. 2008, 113, D16210. [Google Scholar] [CrossRef]
  31. MacGorman, D.R.; Burgess, D.W. Positive cloud-to-ground lightning in tornadic storms and hailstorms. Mon. Weather Rev. 1994, 122, 1671–1697. [Google Scholar] [CrossRef]
  32. Virts, K.S.; Wallace, J.M.; Hutchins, M.L.; Holzworth, R.H. Highlights of a new ground-based, hourly global lightning climatology. Bull. Am. Meteor. Soc. 2013, 94, 1381–1391. [Google Scholar] [CrossRef]
  33. Taszarek, M.; Czernecki, B.; Kozioł, A. A cloud-to-ground lightning climatology for Poland. Mon. Weather Rev. 2015, 143, 4285–4304. [Google Scholar] [CrossRef]
  34. Lu, J.; Qie, X.; Jiang, R.; Xiao, X.; Liu, D.; Li, J.; Yuan, S.; Chen, Z.; Wang, D.; Tian, Y.; et al. Convective cloud mergers and their impact on lightning activity in a severe squall-line system over the Beijing Metropolitan Region. Atmos. Res. 2021, 256, 105555. [Google Scholar] [CrossRef]
  35. Chen, M.; Wang, Y.; Gao, F.; Xiao, X. Diurnal variations in convective storm activity over contiguous North China during the warm season based on radar mosaic climatology. J. Geophys. Res. 2012, 117, D20115. [Google Scholar] [CrossRef]
  36. Xiao, X.; Sun, J.; Qie, X.; Ying, Z.; Ji, L.; Chen, M.; Zhang, L. Lightning Data Assimilation Scheme in a 4DVAR System and Its Impact on Very Short-Term Convective Forecasting. Mon. Weather Rev. 2021, 149, 353–373. [Google Scholar] [CrossRef]
  37. Yu, M.; Miao, S.G.; Li, Q.C. Synoptic analysis and urban signatures of a heavy rainfall on 7 August 2015 in Beijing. J. Geophys. Res. 2017, 122, 65–78. [Google Scholar] [CrossRef]
  38. Xiao, X.; Sun, J.; Chen, M.X.; Qie, X.; Ying, Z.; Wang, Y.; Ji, L. Comparison of environmental and mesoscale characteristics of two types of mountain-to-plain precipitation systems in the Beijing Region, China. J. Geophys. Res. 2019, 124, 6856–6872. [Google Scholar] [CrossRef]
  39. Wang, Y.; Qie, X.; Wang, D.; Liu, M.; Su, D.; Wang, Z. Beijing Lightning Network (BLNET) and the observation on preliminary breakdown processes. Atmos. Res. 2016, 171, 121–132. [Google Scholar] [CrossRef]
  40. Chan, Y.T.; Ho, K.C. A simple and efficient estimator for hyperbolic location Signal Process. IEEE Trans. 1994, 42, 1905–1915. [Google Scholar] [CrossRef]
  41. Levenberg, K. A Method for the Solution of Certain Problems in Least Squares. Quart. Appl. Math. 1944, 2, 164–168. [Google Scholar] [CrossRef]
  42. Marquardt, D. An Algorithm for Least-Squares Estimation of Nonlinear Parameters. SIAM J. Appl. Math. 1963, 11, 431–441. [Google Scholar] [CrossRef]
  43. Thomas, R.J.; Krehbiel, P.R.; Rison, W.; Hunyady, S.J.; Winn, W.P.; Hamlin, T.; Harlin, J. Accuracy of the Lightning Mapping Array. J. Geophys. Res. 2004, 109, D14207. [Google Scholar] [CrossRef]
  44. Shao, X.M.; Stanley, M.; Regan, A.; Harlin, J.; Pongratz, M.; Stock, M. Total lightning observations with the new and improved Los Alamos Sferic Array (LASA). J. Atmos. Ocean. Technol. 2006, 23, 1273–1288. [Google Scholar] [CrossRef]
  45. Srivastava, A.; Tian, Y.; Qie, X.S.; Wang, D.F.; Sun, Z.L.; Yuan, S.F. Performance assessment of Beijing Lightning Network (BLNET) and comparison with other lightning location networks across Beijing. Atmos. Res. 2017, 197, 76–83. [Google Scholar] [CrossRef]
  46. Cummins, K.L.; Murphy, M.J.; Bardo, E.A.; Hiscox, W.L.; Pyle, R.B.; Pifer, A.E. A combined TOA/MDF technology upgrade of the U.S. national lightning detection network. J. Geophys. Res. 1998, 103, 9035–9044. [Google Scholar] [CrossRef]
  47. Rosenfeld, D.; Woodley, W.L. Closing the 50-year circle: From cloud seeding to space and back to climate change through precipitation physics, in Cloud Systems, Hurricanes, and the Tropical Rainfall Measuring Mission (TRMM). Meteorol. Monogr. 2003, 29, 59–80. [Google Scholar] [CrossRef]
  48. Gauthier, M.L.; Petersen, W.A.; Carey, L.D. Cell mergers and their impact on cloud-to-ground lightning over the Houston area. Atmos. Res. 2010, 96, 626–632. [Google Scholar] [CrossRef]
  49. Virts, K.S.; Wallace, J.M.; Hutchins, M.L.; Holzworth, R.H. Diurnal and seasonal lightning variability over the Gulf Stream and the Gulf of Mexico. J. Atmos. Sci. 2015, 72, 2657–2665. [Google Scholar] [CrossRef]
  50. Venugopal, V.; Virts, K.; Sukhatme, J.; Wallace, J.; Chattopadhyay, B. A comparison of the fine-scale structure of the diurnal cycle of tropical rain and lightning. Atmos. Res. 2016, 169, 515–522. [Google Scholar] [CrossRef]
  51. Williams, E.R. The tripole structure of thunderstorms. J. Geophys. Res. 1989, 94, 13151–13167. [Google Scholar] [CrossRef]
  52. Liu, D.X.; Qie, X.S.; Chen, Y.C.; Sun, Z.L.; Yuan, S.F. Investigating lightning characteristics through a supercell storm by comprehensive coordinated observations over North China. Adv. Atmos. Sci. 2020, 37, 861–872. [Google Scholar] [CrossRef]
  53. Rutledge, S.A.; MacGorman, D.R. Cloud-to-Ground Lightning Activity in the 10–11 June 1985 Mesoscale Convective System Observed during the Oklahoma–Kansas PRE-STORM Project. Mon. Weather Rev. 1988, 116, 1393–1408. [Google Scholar] [CrossRef]
  54. Lyons, W.A.; Uliasz, M.; Nelson, T.E. Large peak current Cloud-to-Ground lightning flashes during the summer months in the Contiguous United States. Mon. Weather Rev. 1998, 126, 2217–2233. [Google Scholar] [CrossRef]
  55. Said, R.K.; Cohen, M.B.; Inan, U.S. Highly intense lightning over the oceans: Estimated peak currents from global GLD360 observations. J. Geophys. Res. 2013, 118, 6905–6915. [Google Scholar] [CrossRef]
  56. Allen, J.T.; Karoly, D.J.; Mills, G.A. A severe thunderstorm climatology for Australia and associated thunderstorm environments. Aust. Meteorol. Oceanogr. J. 2011, 61, 143–158. [Google Scholar] [CrossRef]
  57. Westermayer, A.T.; Groenemeijer, P.; Pistotnik, G.; Sausen, R.; Faust, E. Identification of favorable environments for thunderstorms in reanalysis data. Meteor. Zeits. 2017, 26, 59–70. [Google Scholar] [CrossRef]
  58. Taszarek, M.; Allen, J.; Pucik, T.; Gorenemeijer, P.; Czernecki, B.; Kolendowicz, L. A Climatology of Thunderstorms across Europe from a Synthesis of Multiple Data Sources. J. Clim. 2019, 32, 1813–1837. [Google Scholar] [CrossRef]
  59. Weisman, M.; Rotunno, R. “A theory for strong long-lived squall lines” revised. J. Atmos. Sci. 2004, 61, 361–382. [Google Scholar] [CrossRef]
  60. Fovell, R.G.; Dailey, P.S. The temporal behavior of numerically simulated multicell-type storms. Part I: Modes of behavior. J. Atmos. Sci. 1995, 52, 2073–2095. [Google Scholar] [CrossRef]
  61. Yang, J.; Zhao, K.; Zheng, Y.; Chen, H.; Chen, G. Microphysical structure of thunderstorms and their lightning activity during the mei-yu and post-mei-yu periods over Nanjing, Yangtze River Delta. Geophys. Res. Lett. 2022, 49, e2022GL100952. [Google Scholar] [CrossRef]
  62. Dye, J.E.; Bansemer, A. Electrification in mesoscale updrafts of deep stratiform and anvil clouds in Florida. J. Geophys. Res. 2019, 124, 1021–1049. [Google Scholar] [CrossRef]
  63. Wang, F.; Liu, H.; Dong, W.; Zhang, Y.; Yao, W.; Zheng, D. Radar reflectivity of lightning flashes in stratiform regions of mesoscale convective systems. J. Geophys. Res. 2019, 124, 14114–14132. [Google Scholar] [CrossRef]
Figure 1. The platform and the theoretical detected efficiency of BLNET. (a) The distribution of the lightning detection network and the site of Doppler radar; the black triangles represent the substations, and the red star indicates the location of operational S-band radar and sounding site. The red polygon shows the boundary of the Beijing area, and the solid diagonal rectangle of line AB–CD stands for the subdomain shown in Figure 11, which is used to calculate the mean thunderstorm percentage. The color shading indicates the terrain height above sea level. (b) The spatial distribution of the theoretical detected efficiency of BLNET; the color shading stands for the detection efficiency.
Remotesensing 16 00447 g001
Figure 2. The radar reflectivity of different categories of thunderstorms. The black line stands for the provincial boundary of Beijing and surrounding area. (a) Single cell. (b) Multicells. (c) Linear MCS. (d) Nonlinear MCS. (e) WPCS. The unit of radar reflectivity is dBZ.
Remotesensing 16 00447 g002
Figure 3. The monthly thunderstorm occurrence and lightning number of different categories of thunderstorms over the study region. The amount of lightning in different categories of thunderstorms is listed on the bar chart (a). The diurnal variations in thunderstorm occurrence and lightning flash rate (b). The black line stands for thunderstorm number; the dashed line stands for lightning flash rate.
Remotesensing 16 00447 g003
Figure 4. Thunderstorm occurrence and lightning percentage for different categories of thunderstorms during five warm seasons. Color bars stand for the thunderstorm number, and solid line stands for the lightning percentage of different categories of thunderstorms.
Remotesensing 16 00447 g004
Figure 5. The diurnal variations in thunderstorm number, accumulated precipitation, and lightning frequency in different categories of thunderstorms. Solid black line stands for lightning frequency (flashes/hour); the dashed black line stands for thunderstorm number, and the dotted line represents precipitation (mm/hour).
Remotesensing 16 00447 g005
Figure 6. The percentage of total lightning (histogram) among different categories of thunderstorms, the ratio of CG lightning (dashed line), and the ratio of +CG lightning (solid line) in each category of thunderstorm.
Remotesensing 16 00447 g006
Figure 7. The histogram of lightning percentage in different categories of thunderstorms within different thresholds of CG lightning current.
Remotesensing 16 00447 g007
Figure 8. The box diagram of the H20dBZ, H40dBZ, V20dBZ, and V40dBZ in different categories of thunderstorms. The bottoms and tops of the black boxes show the 25% and 75% percentiles, respectively. The two ends of the box stand for 5% and 95% percentiles, respectively. The central black lines represent the median; inside-the-box diamonds stand for mean values (a) H20dBZ, (b) H40dBZ, (c) V20dBZ, and (d) V40dBZ. The label of Ref Volume in (c,d) stands for the volume of radar reflectivity.
Remotesensing 16 00447 g008
Figure 9. The relationship between lightning frequency (fl/6 min) and the mean value of radar echo volume in different categories of thunderstorms; the colored formula stands for the relationship in different categories of thunderstorms. (a) V20dBZ. (b) V40dBZ.
Remotesensing 16 00447 g009
Figure 10. The box plots of CAPE, CIN, the 0–6 km wind shear, and WCD for different types of thunderstorms. The bottoms and tops of the black boxes show the 25% and 75% percentiles, respectively. The two ends of the box stand for 5% and 95% percentiles, respectively. The central black line stands for the median, and inside-the-box diamonds stand for mean values (a) CAPE, (b) CIN, (c) 0–6 km wind shear, and (d) WCDs.
Remotesensing 16 00447 g010
Figure 11. Hovmöller diagram of the number of hourly observations, with a reflectivity ≥40 dBZ in different categories of thunderstorms (color shading) for approximate NW–SE orientation average along the area from AB–CD in Figure 1; the average topography profile is shown in gray in bottom panel.
Remotesensing 16 00447 g011
Figure 12. Cross-section of meridional wind (m/s); the dashed line and the color shading stand for meridional wind with intervals of 1 m/s along 35°N–41°N from northwest to southeast; the black solid line stands for the profile of topography. Beijing area is located at 115°E–118°E.
Remotesensing 16 00447 g012
Figure 13. Schematic illustration of different convective factors in five categories of thunderstorms.
Remotesensing 16 00447 g013
Disclaimer/Publisher’s Note: The statements, opinions and data contained in all publications are solely those of the individual author(s) and contributor(s) and not of MDPI and/or the editor(s). MDPI and/or the editor(s) disclaim responsibility for any injury to people or property resulting from any ideas, methods, instructions or products referred to in the content.

