
A Feature-Driven Inception Dilated Network for Infrared Image Super-Resolution Reconstruction

Abstract
1. Introduction
2. Materials and Methods
2.1. Data Preprocessing
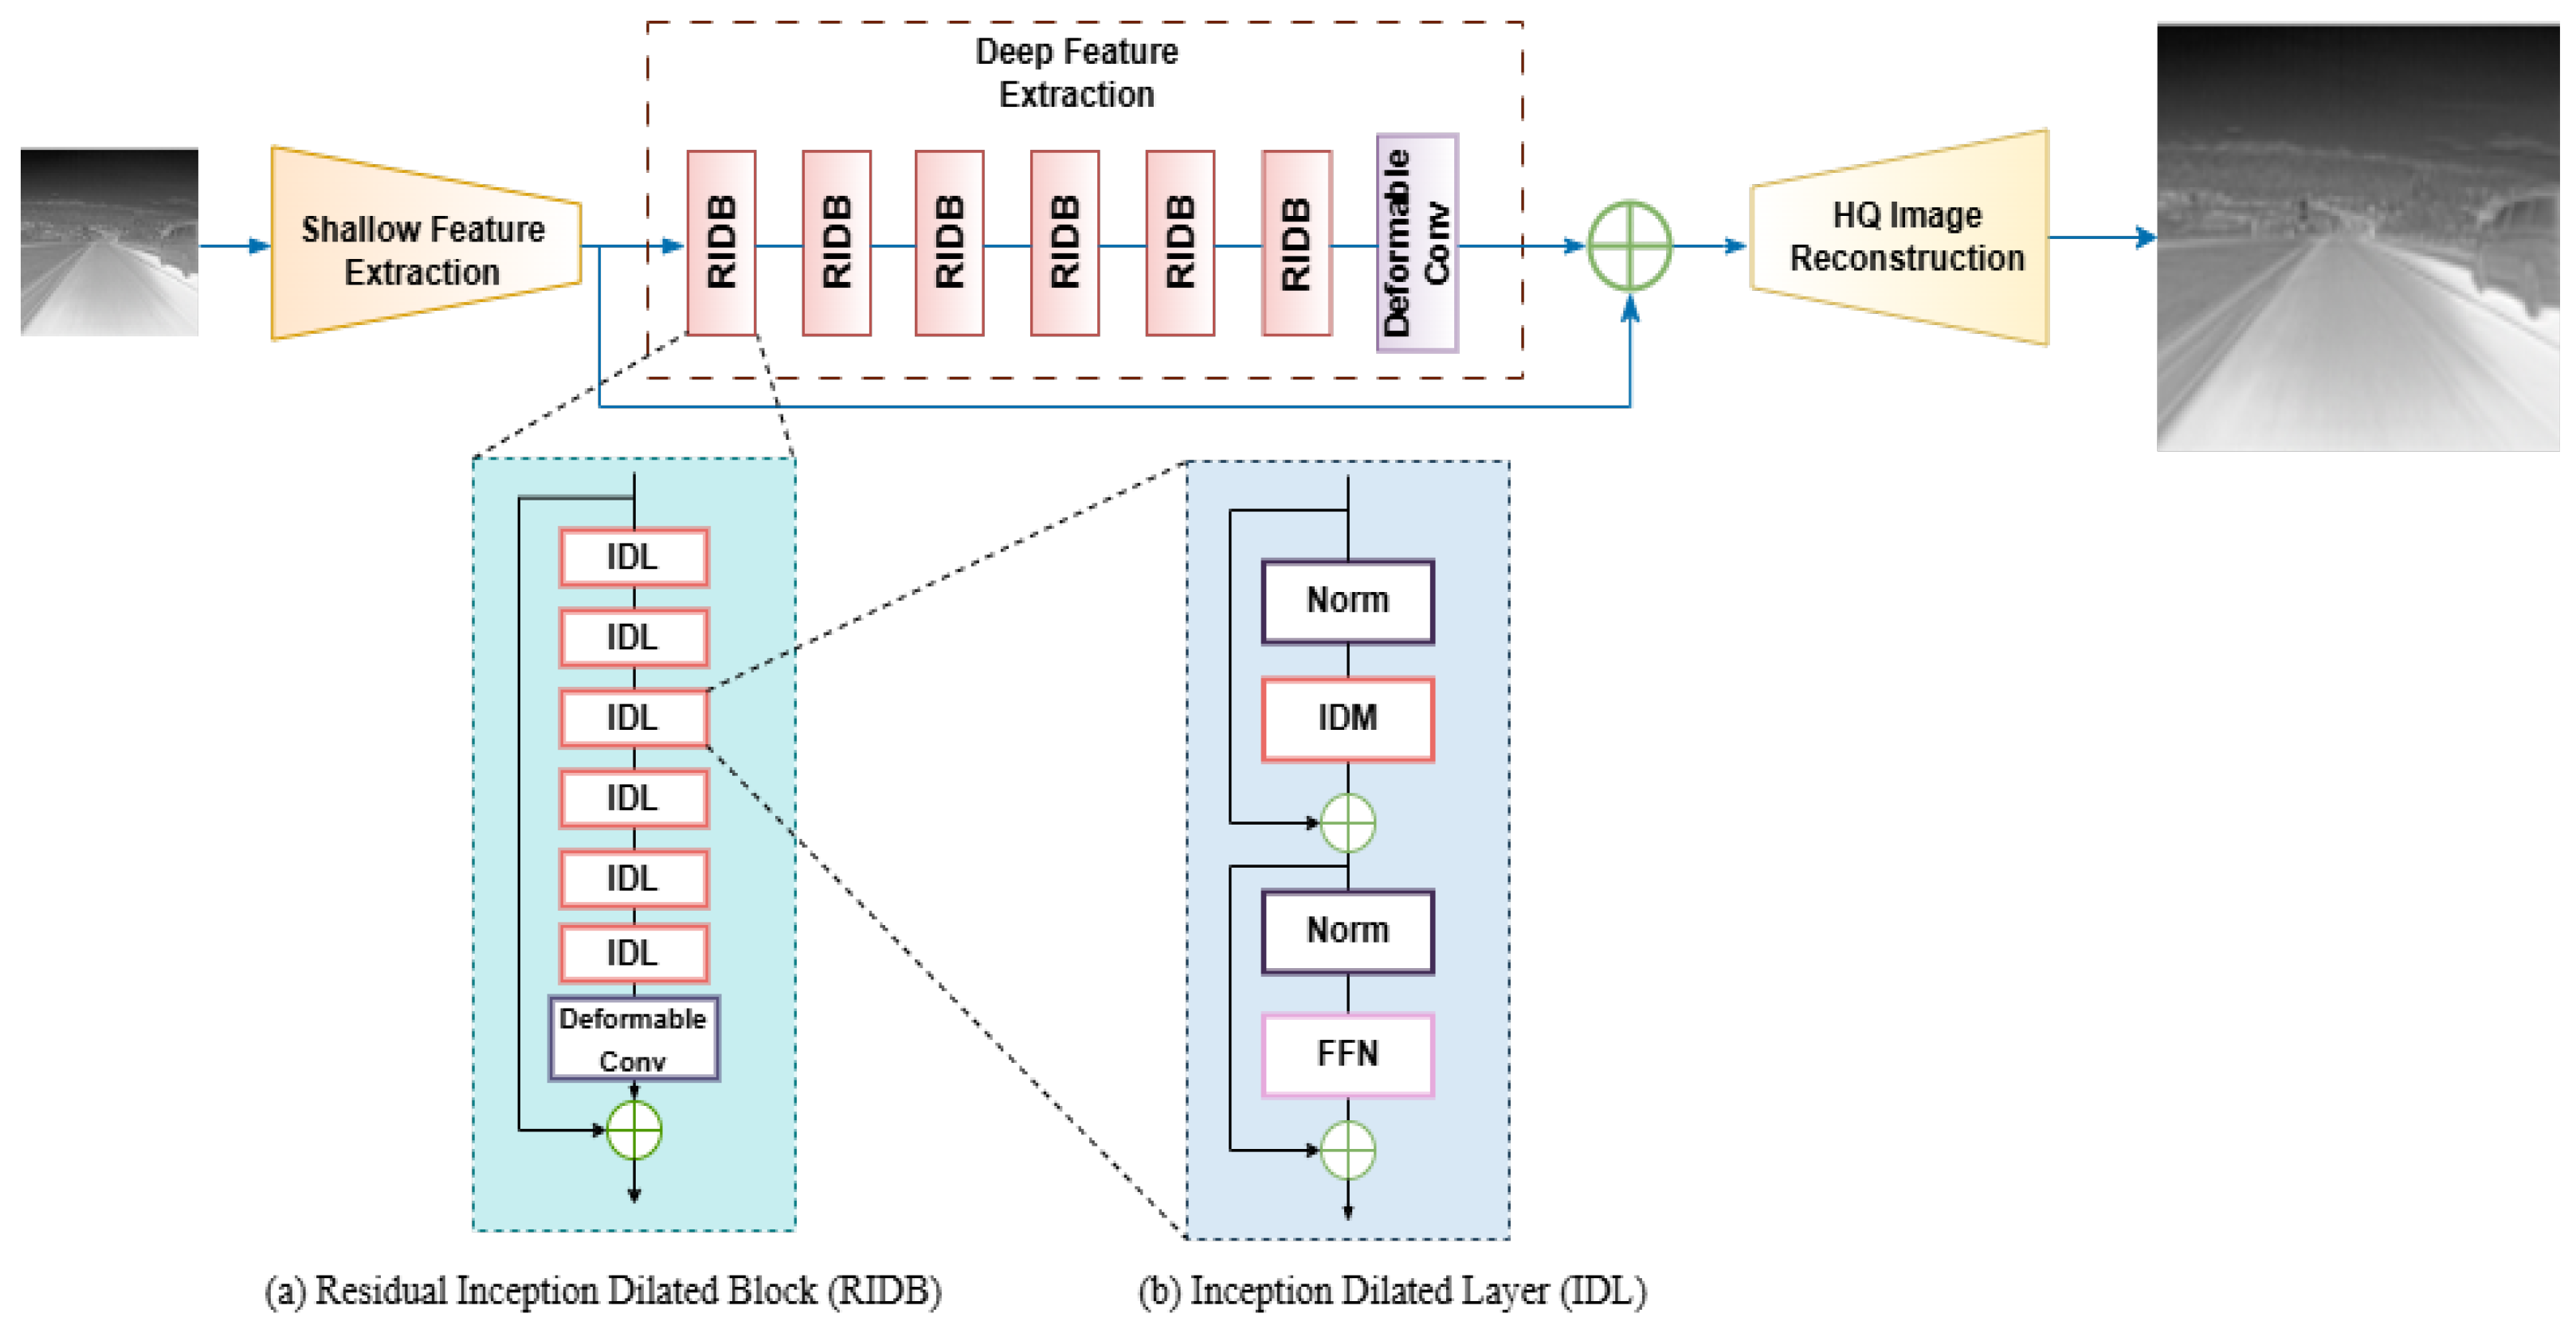
2.2. IDSR Network
2.2.1. Shallow Feature Extraction
2.2.2. Deep Feature Extraction
2.2.3. Reconstruction Module
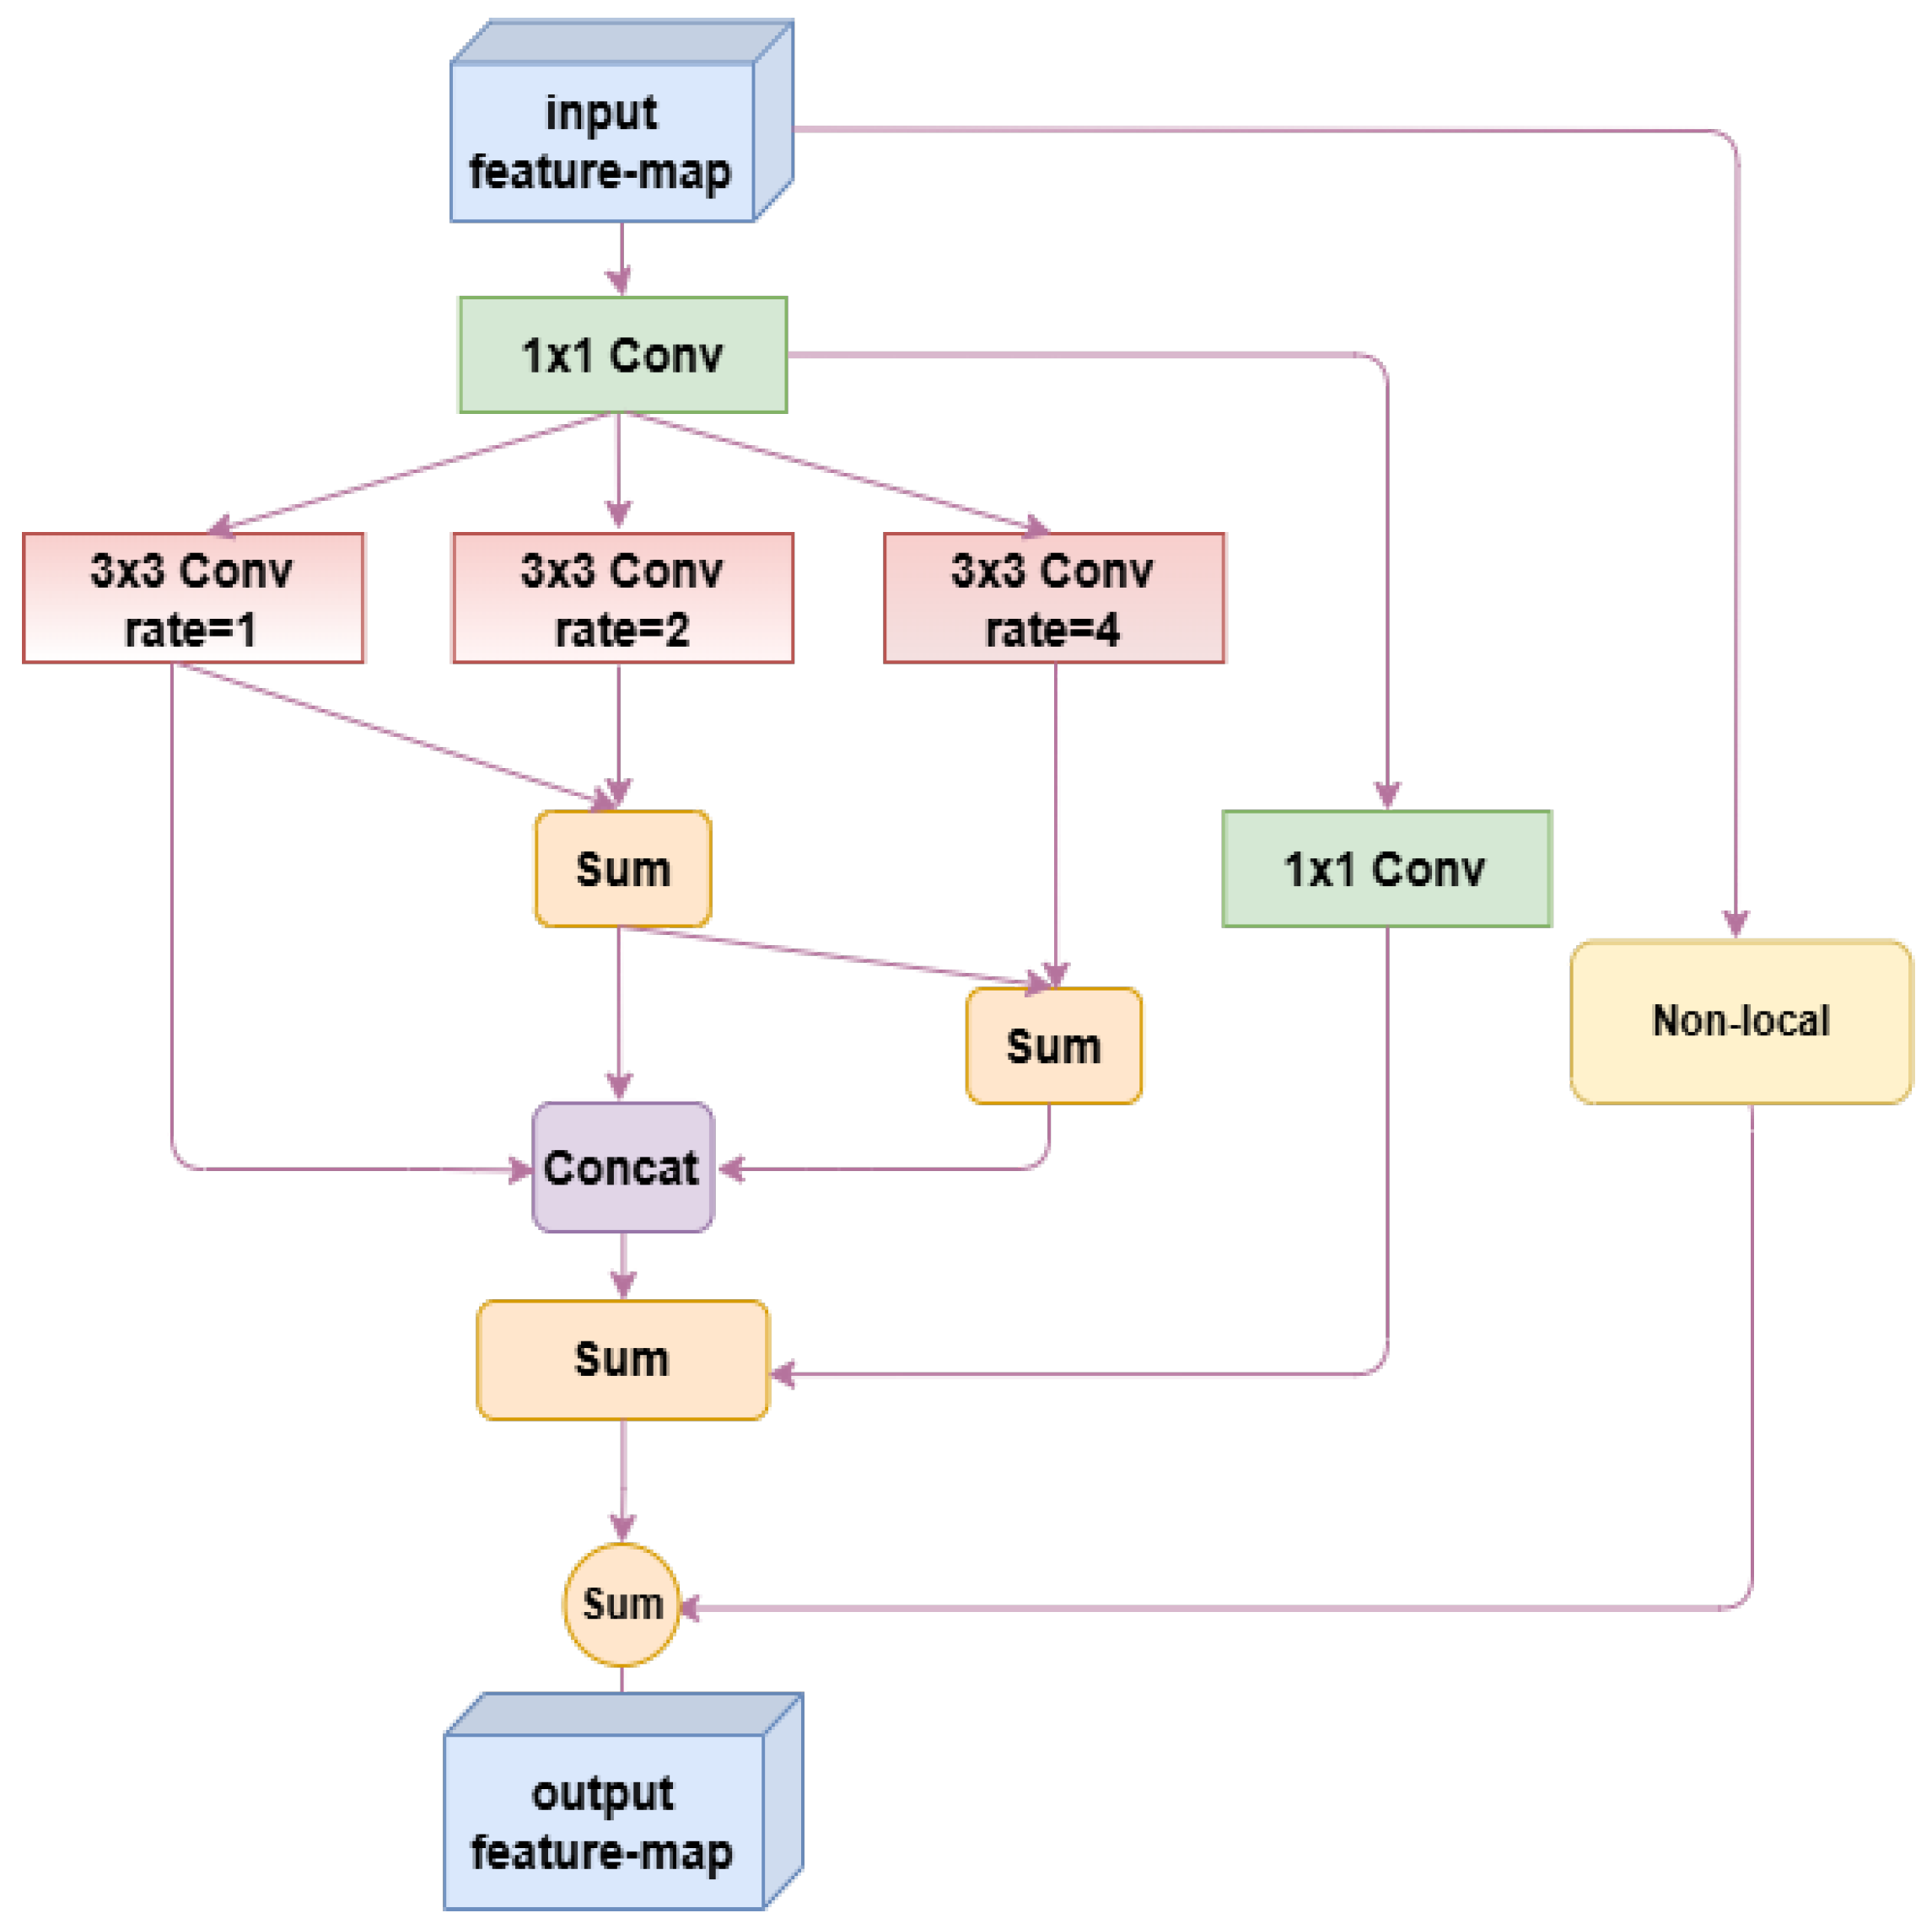
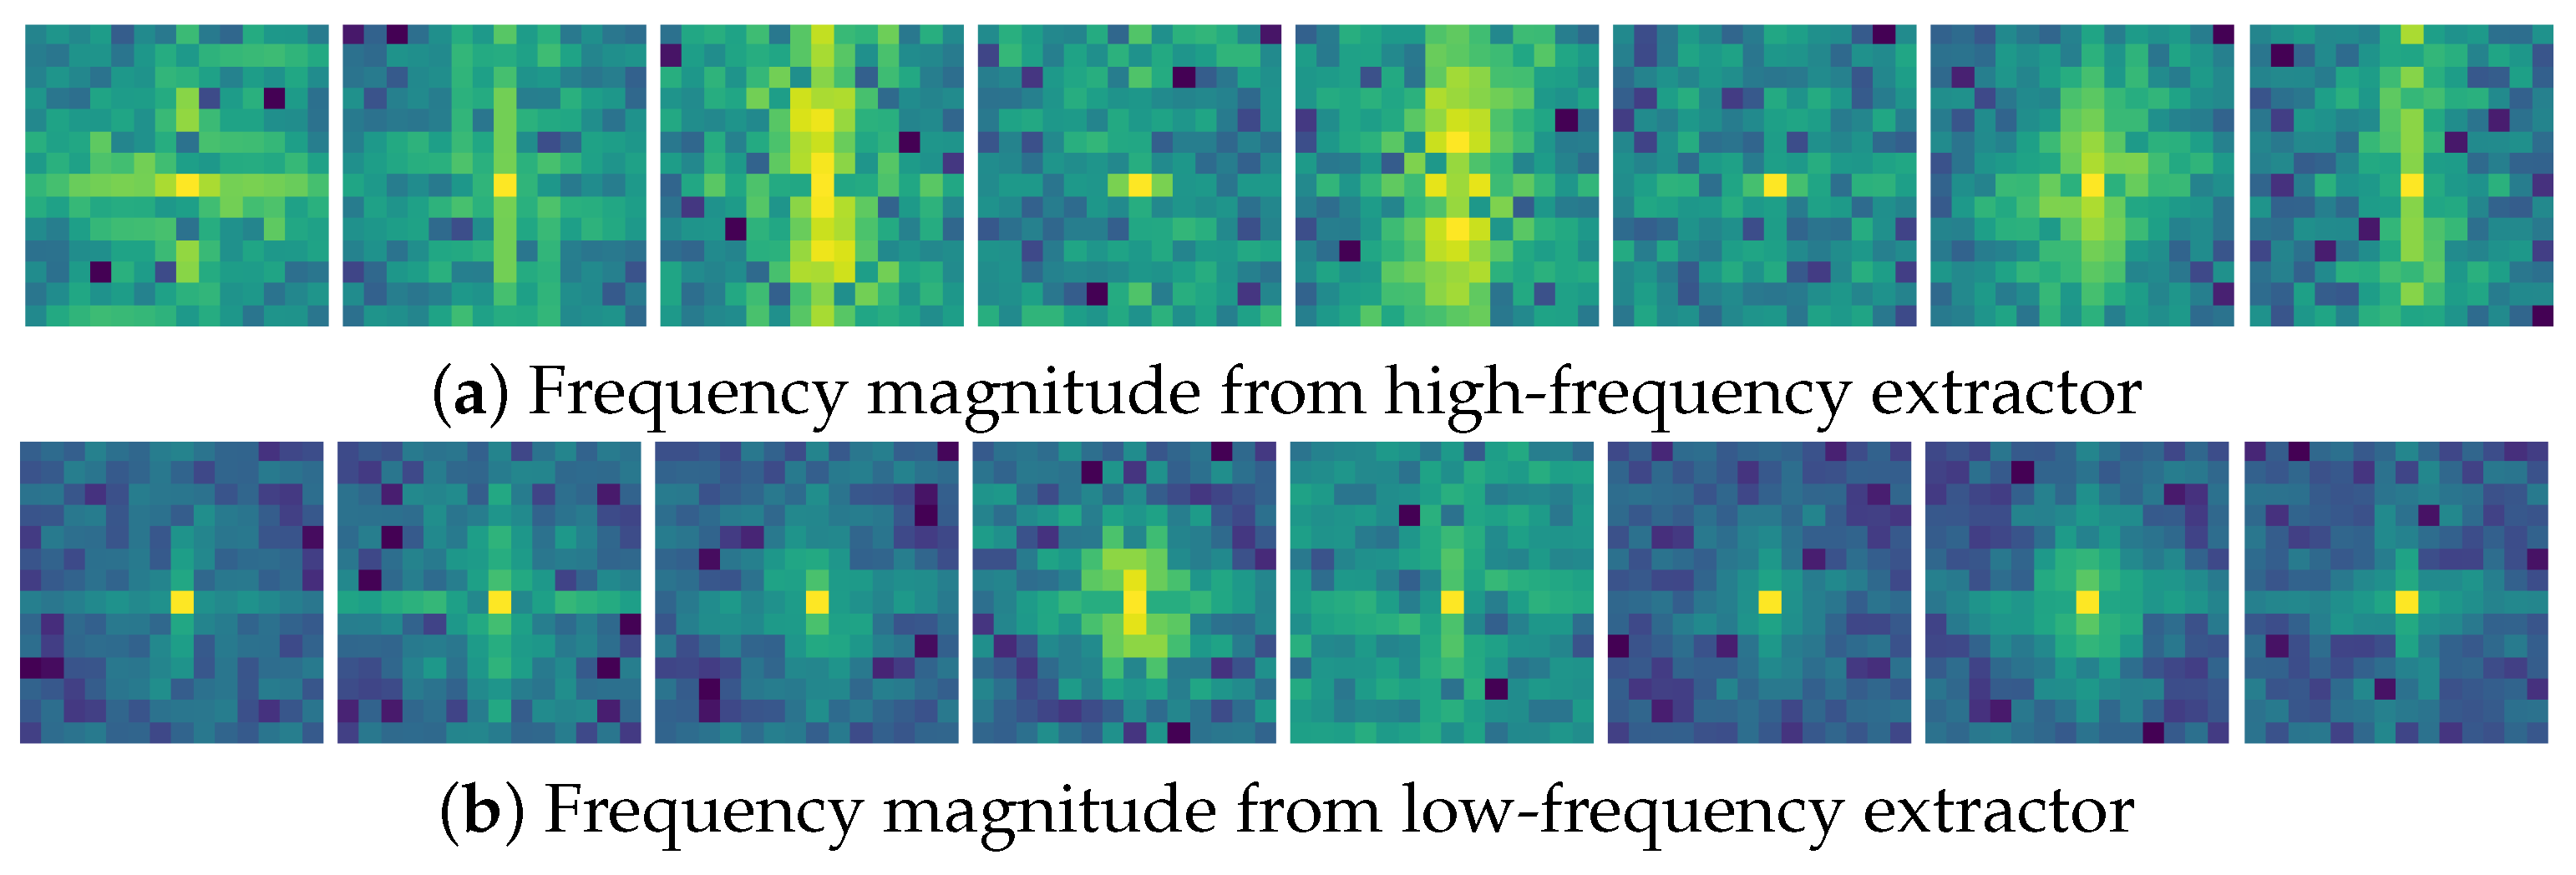
2.3. Feature-Driven Module
2.4. Joint Loss Function
2.4.1. Super-Resolution Reconstruction Loss
2.4.2. Feature-Driven Loss
3. Results
3.1. Dataset
3.2. Experimental Environment and Parameter Settings
- Firstly, the IDSR network is trained on the FLIR dataset. In this case, , in Equation (3). The feature-driven module does not participate in the training of the reconstruction network.
- Secondly, different weights are assigned to the loss function by adjusting the value of and . During this phase, the parameters of the feature-driven model are frozen, and only the joint loss is used to train the IDSR network via back-propagation.
| Algorithm 1 Two-stage training strategy |
|
3.3. Experimental Analysis
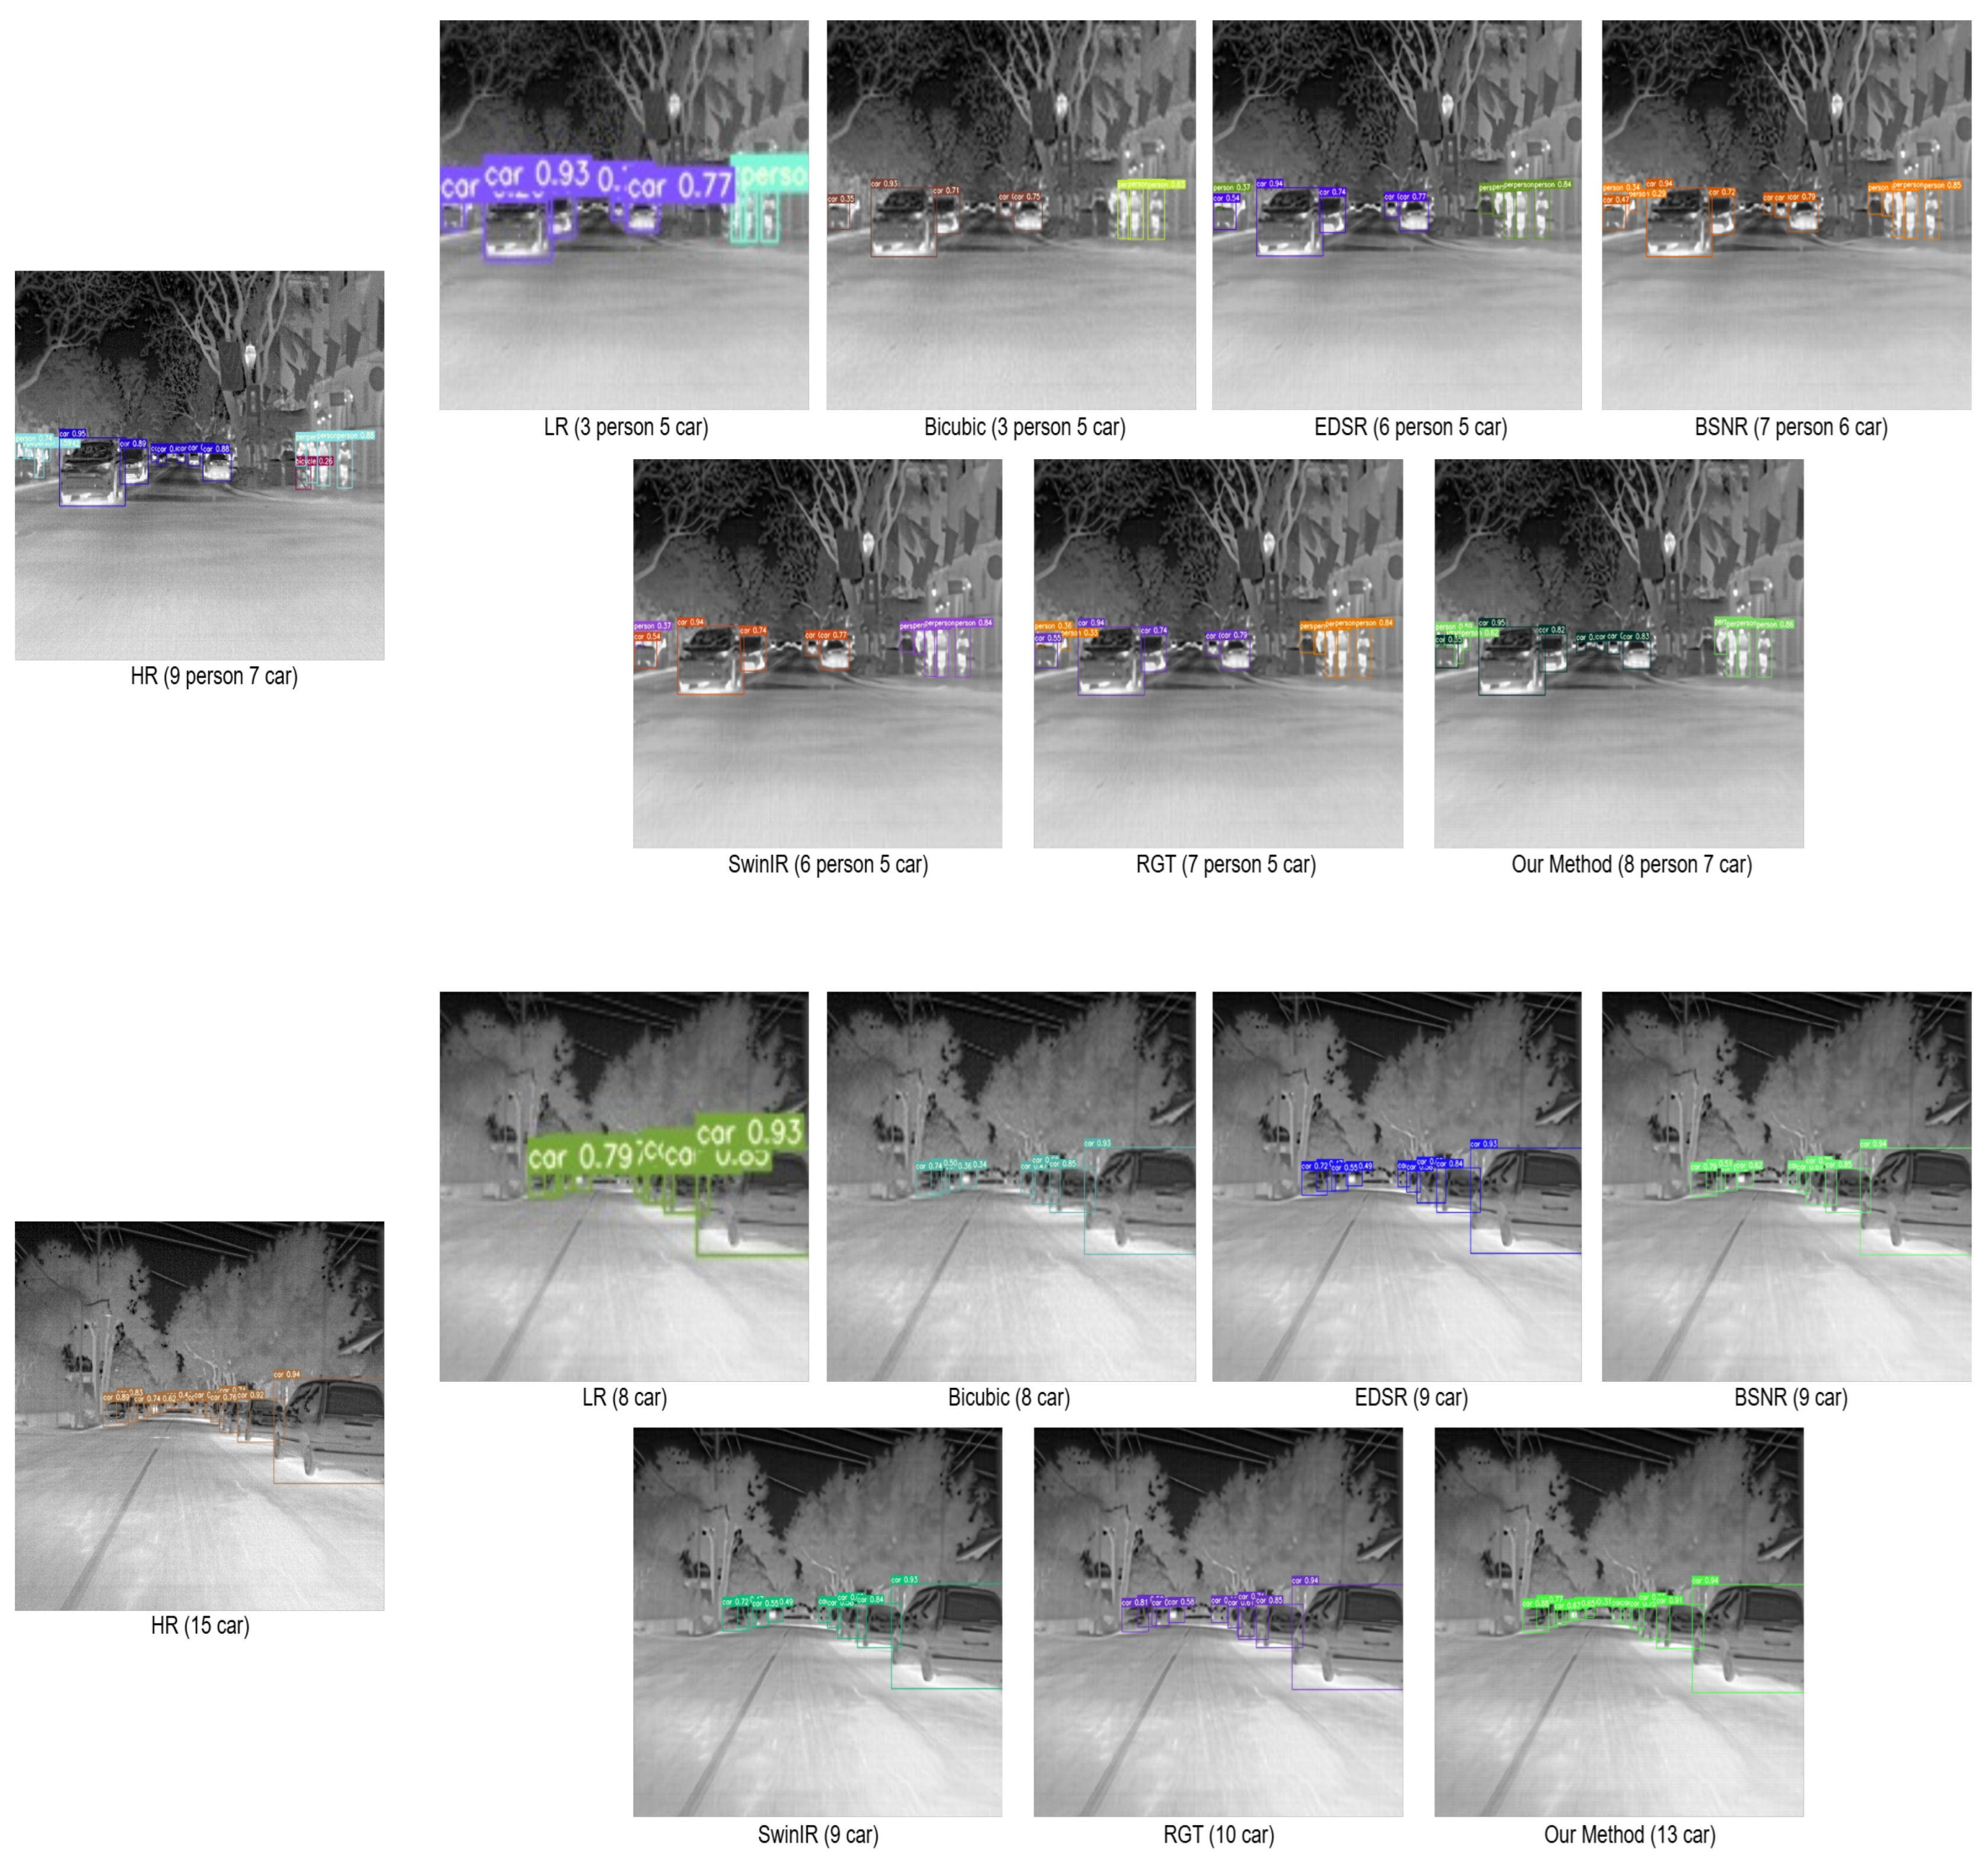
- Compare the performance of SR images generated by IDSR with other existing SR reconstruction networks in terms of image super-resolution reconstruction and object detection tasks.
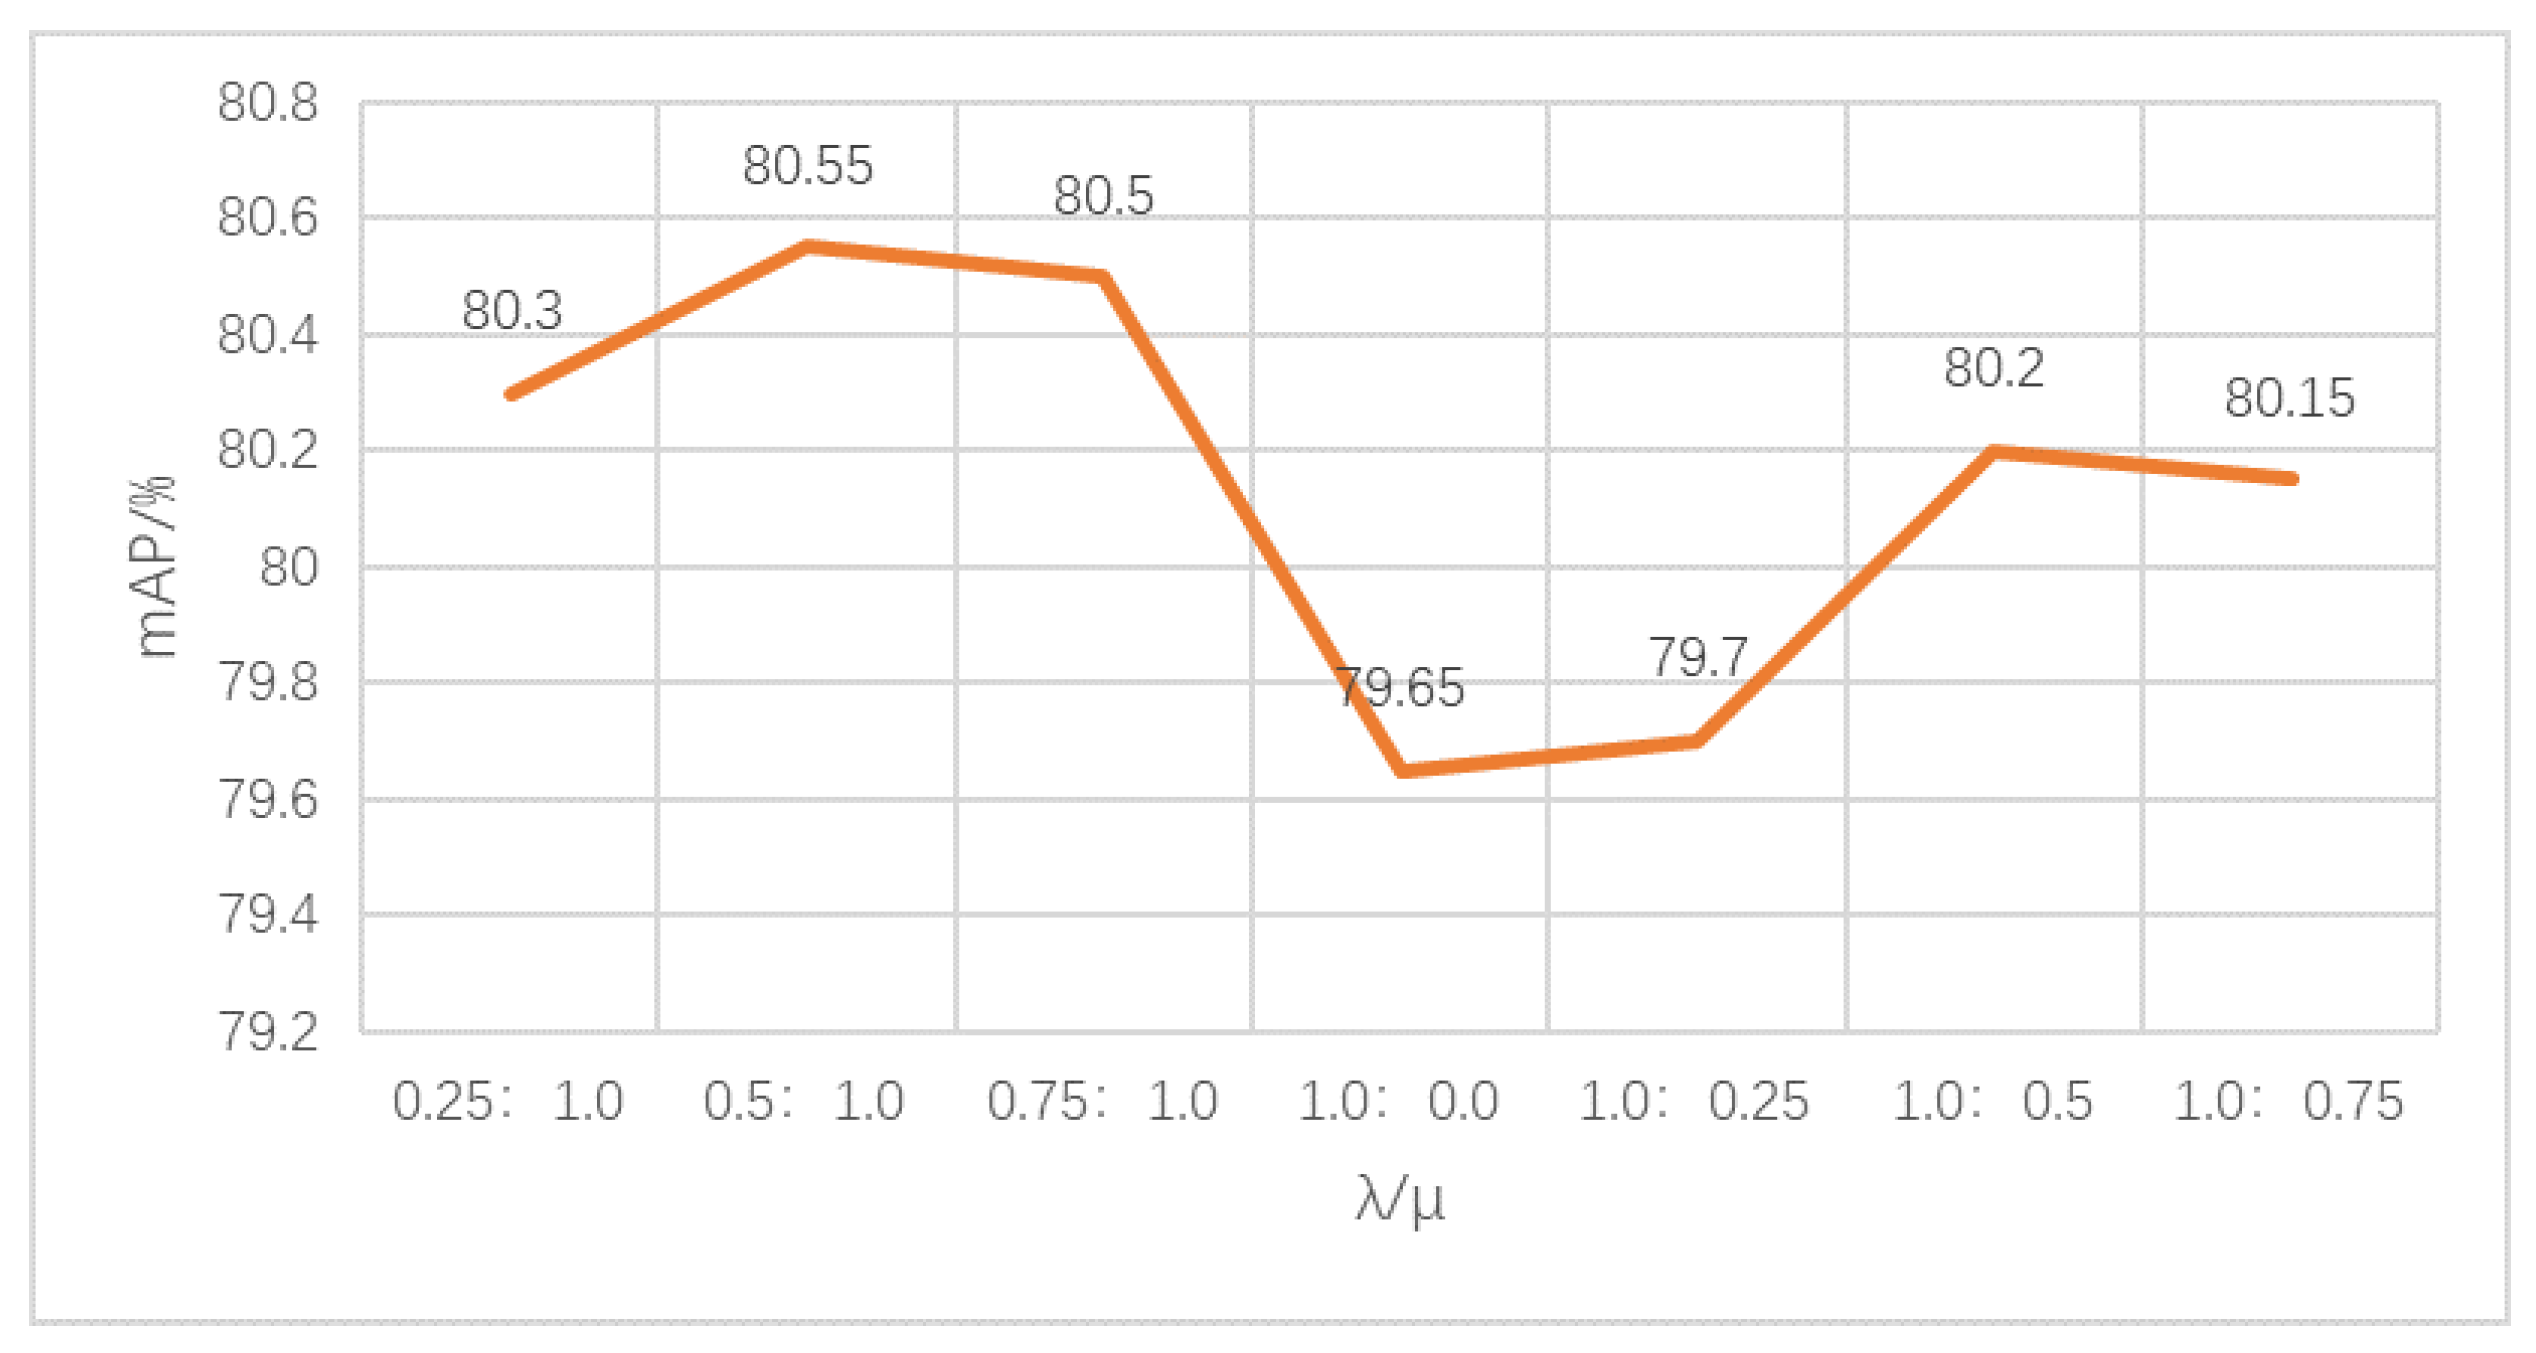
- Explore the influence of different loss weight selections on the object detection task. Concurrently, the loss weight yielding the best performance on the detection task is chosen as the parameter for subsequent experiments.
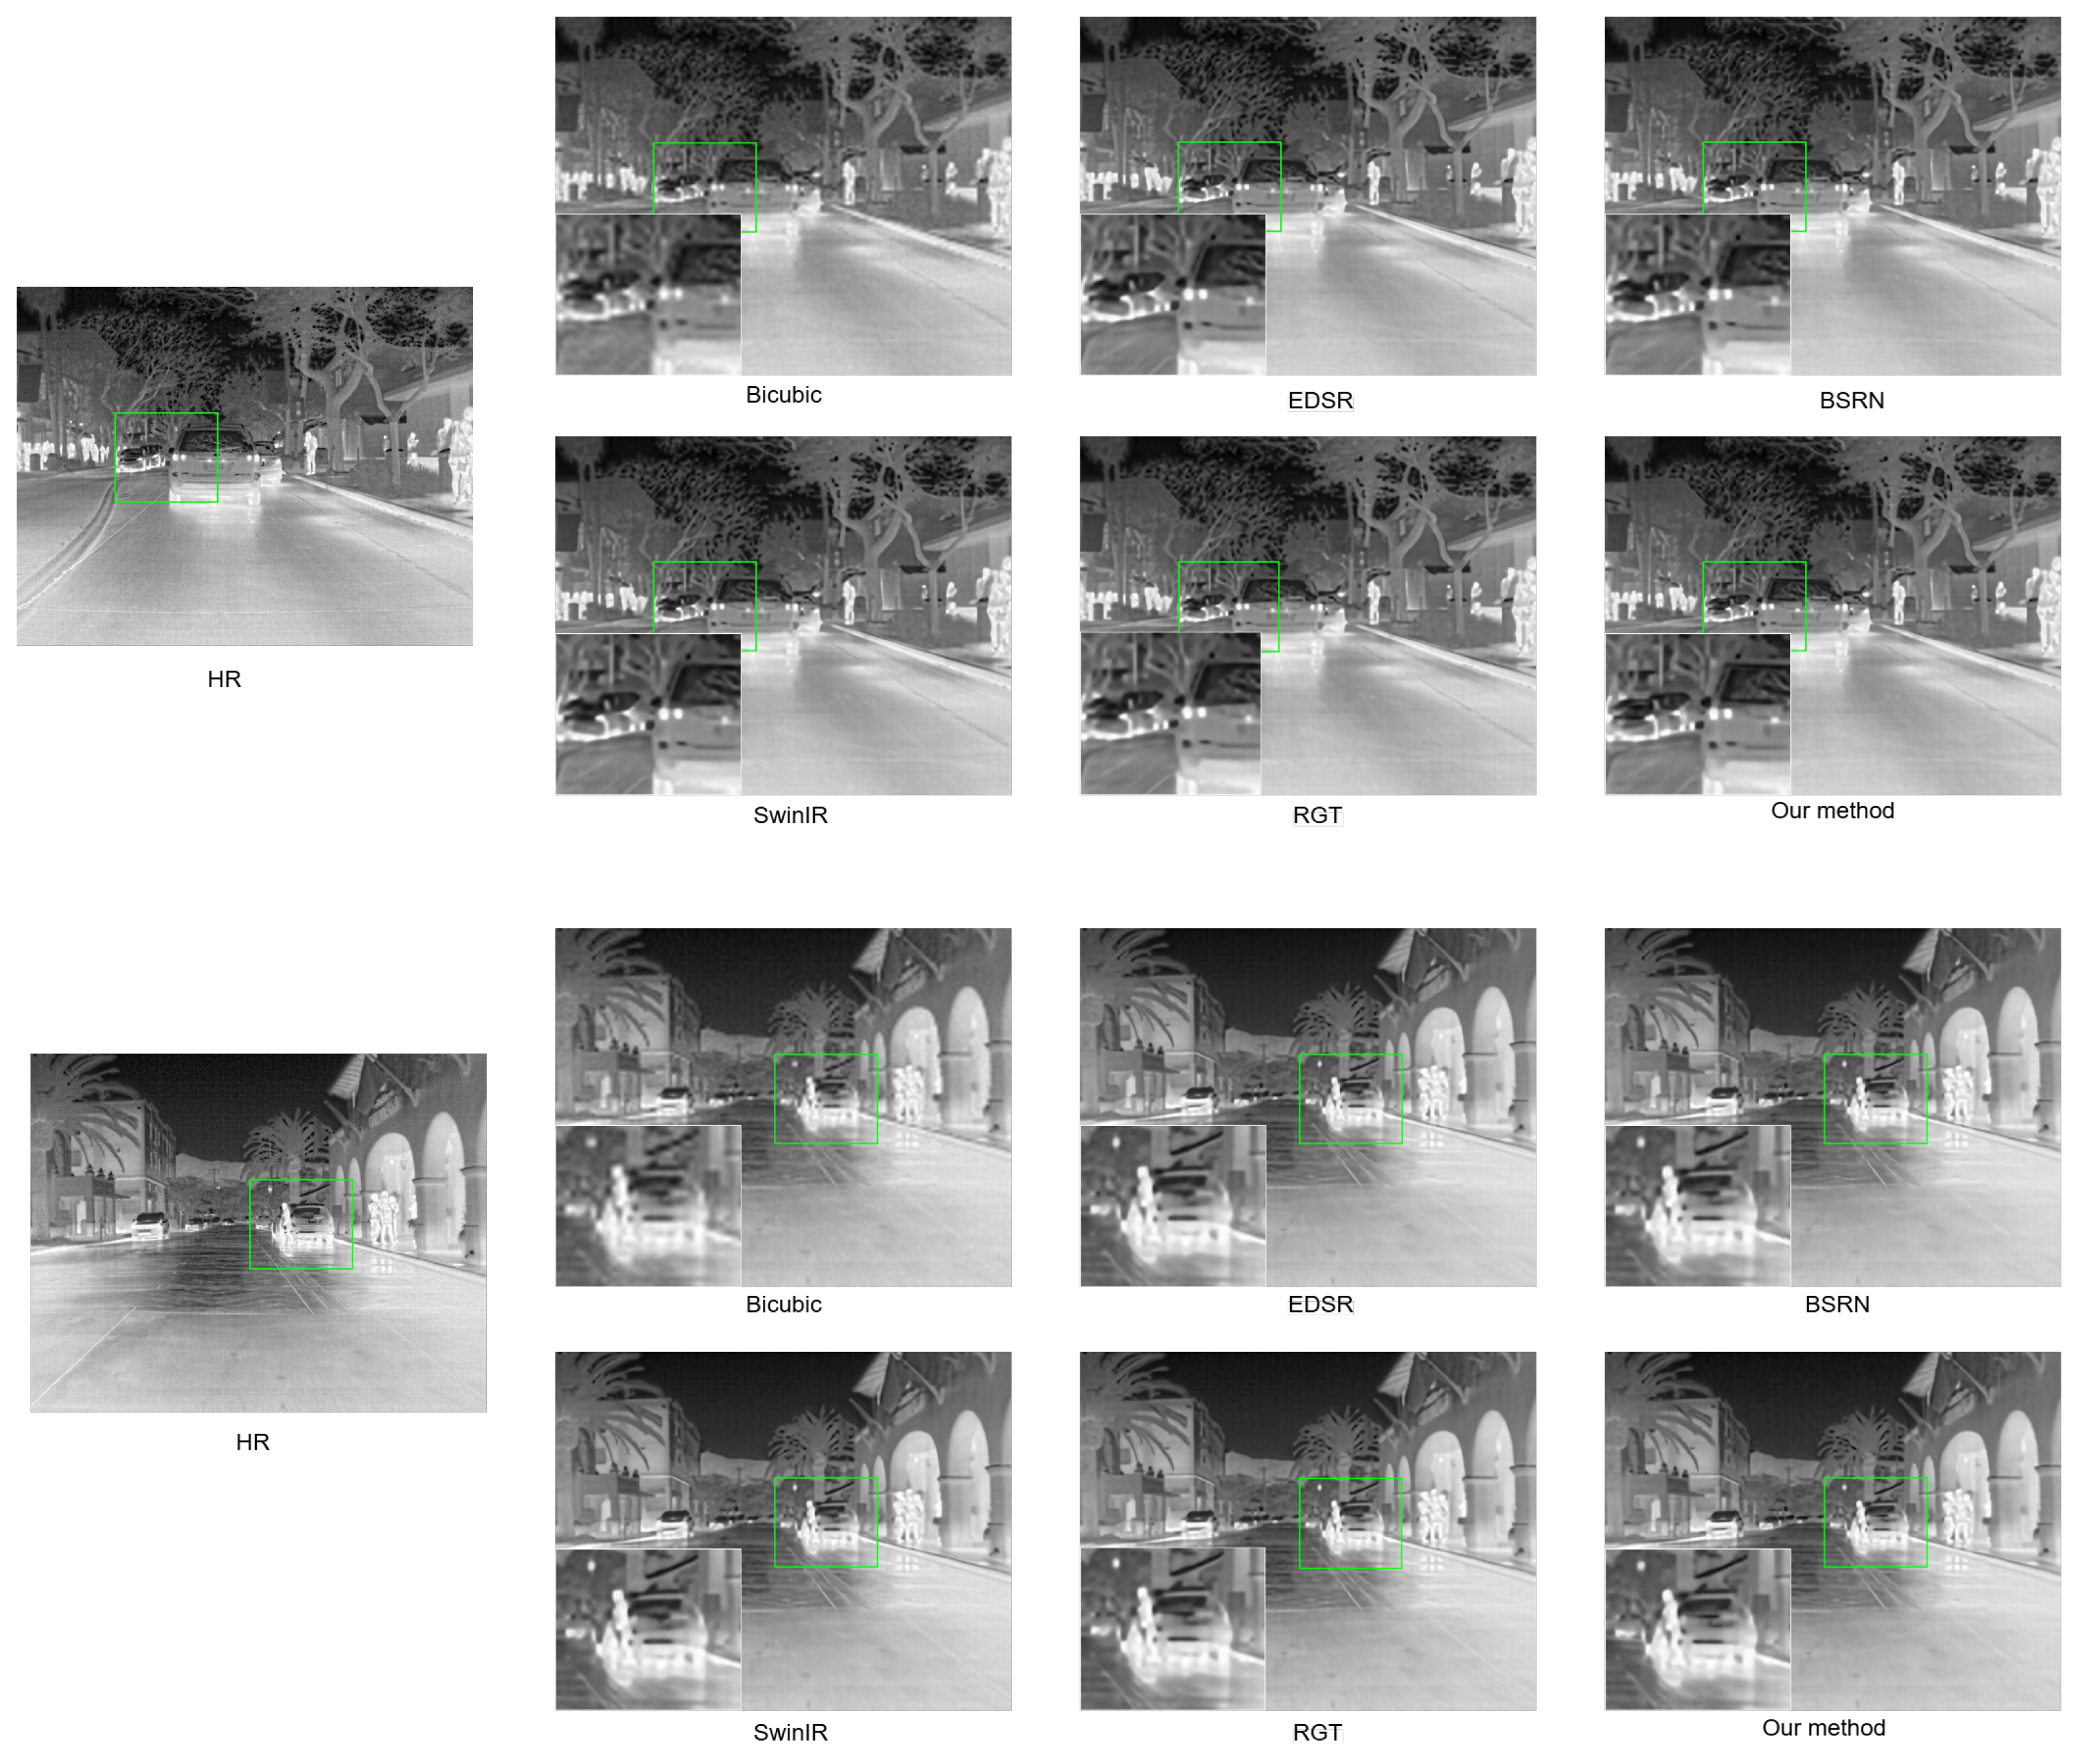
- Compare the performance of SR images generated by the feature-driven IDSR (our method) with other existing SR reconstruction networks in image super-resolution and object detection tasks.
- Analyze the effect of different modules on the baseline (SwinIR), including the data preprocessing, the IDM module, the deformable convolution module (Deconv) and the feature-driven module.
- Use the SR model trained on the FLIR dataset to test the M3FD dataset and directly output SR images.
- Compare the performance of SR images generated by the feature-driven IDSR (our method) with other existing SR reconstruction networks in image super-resolution and object detection tasks.
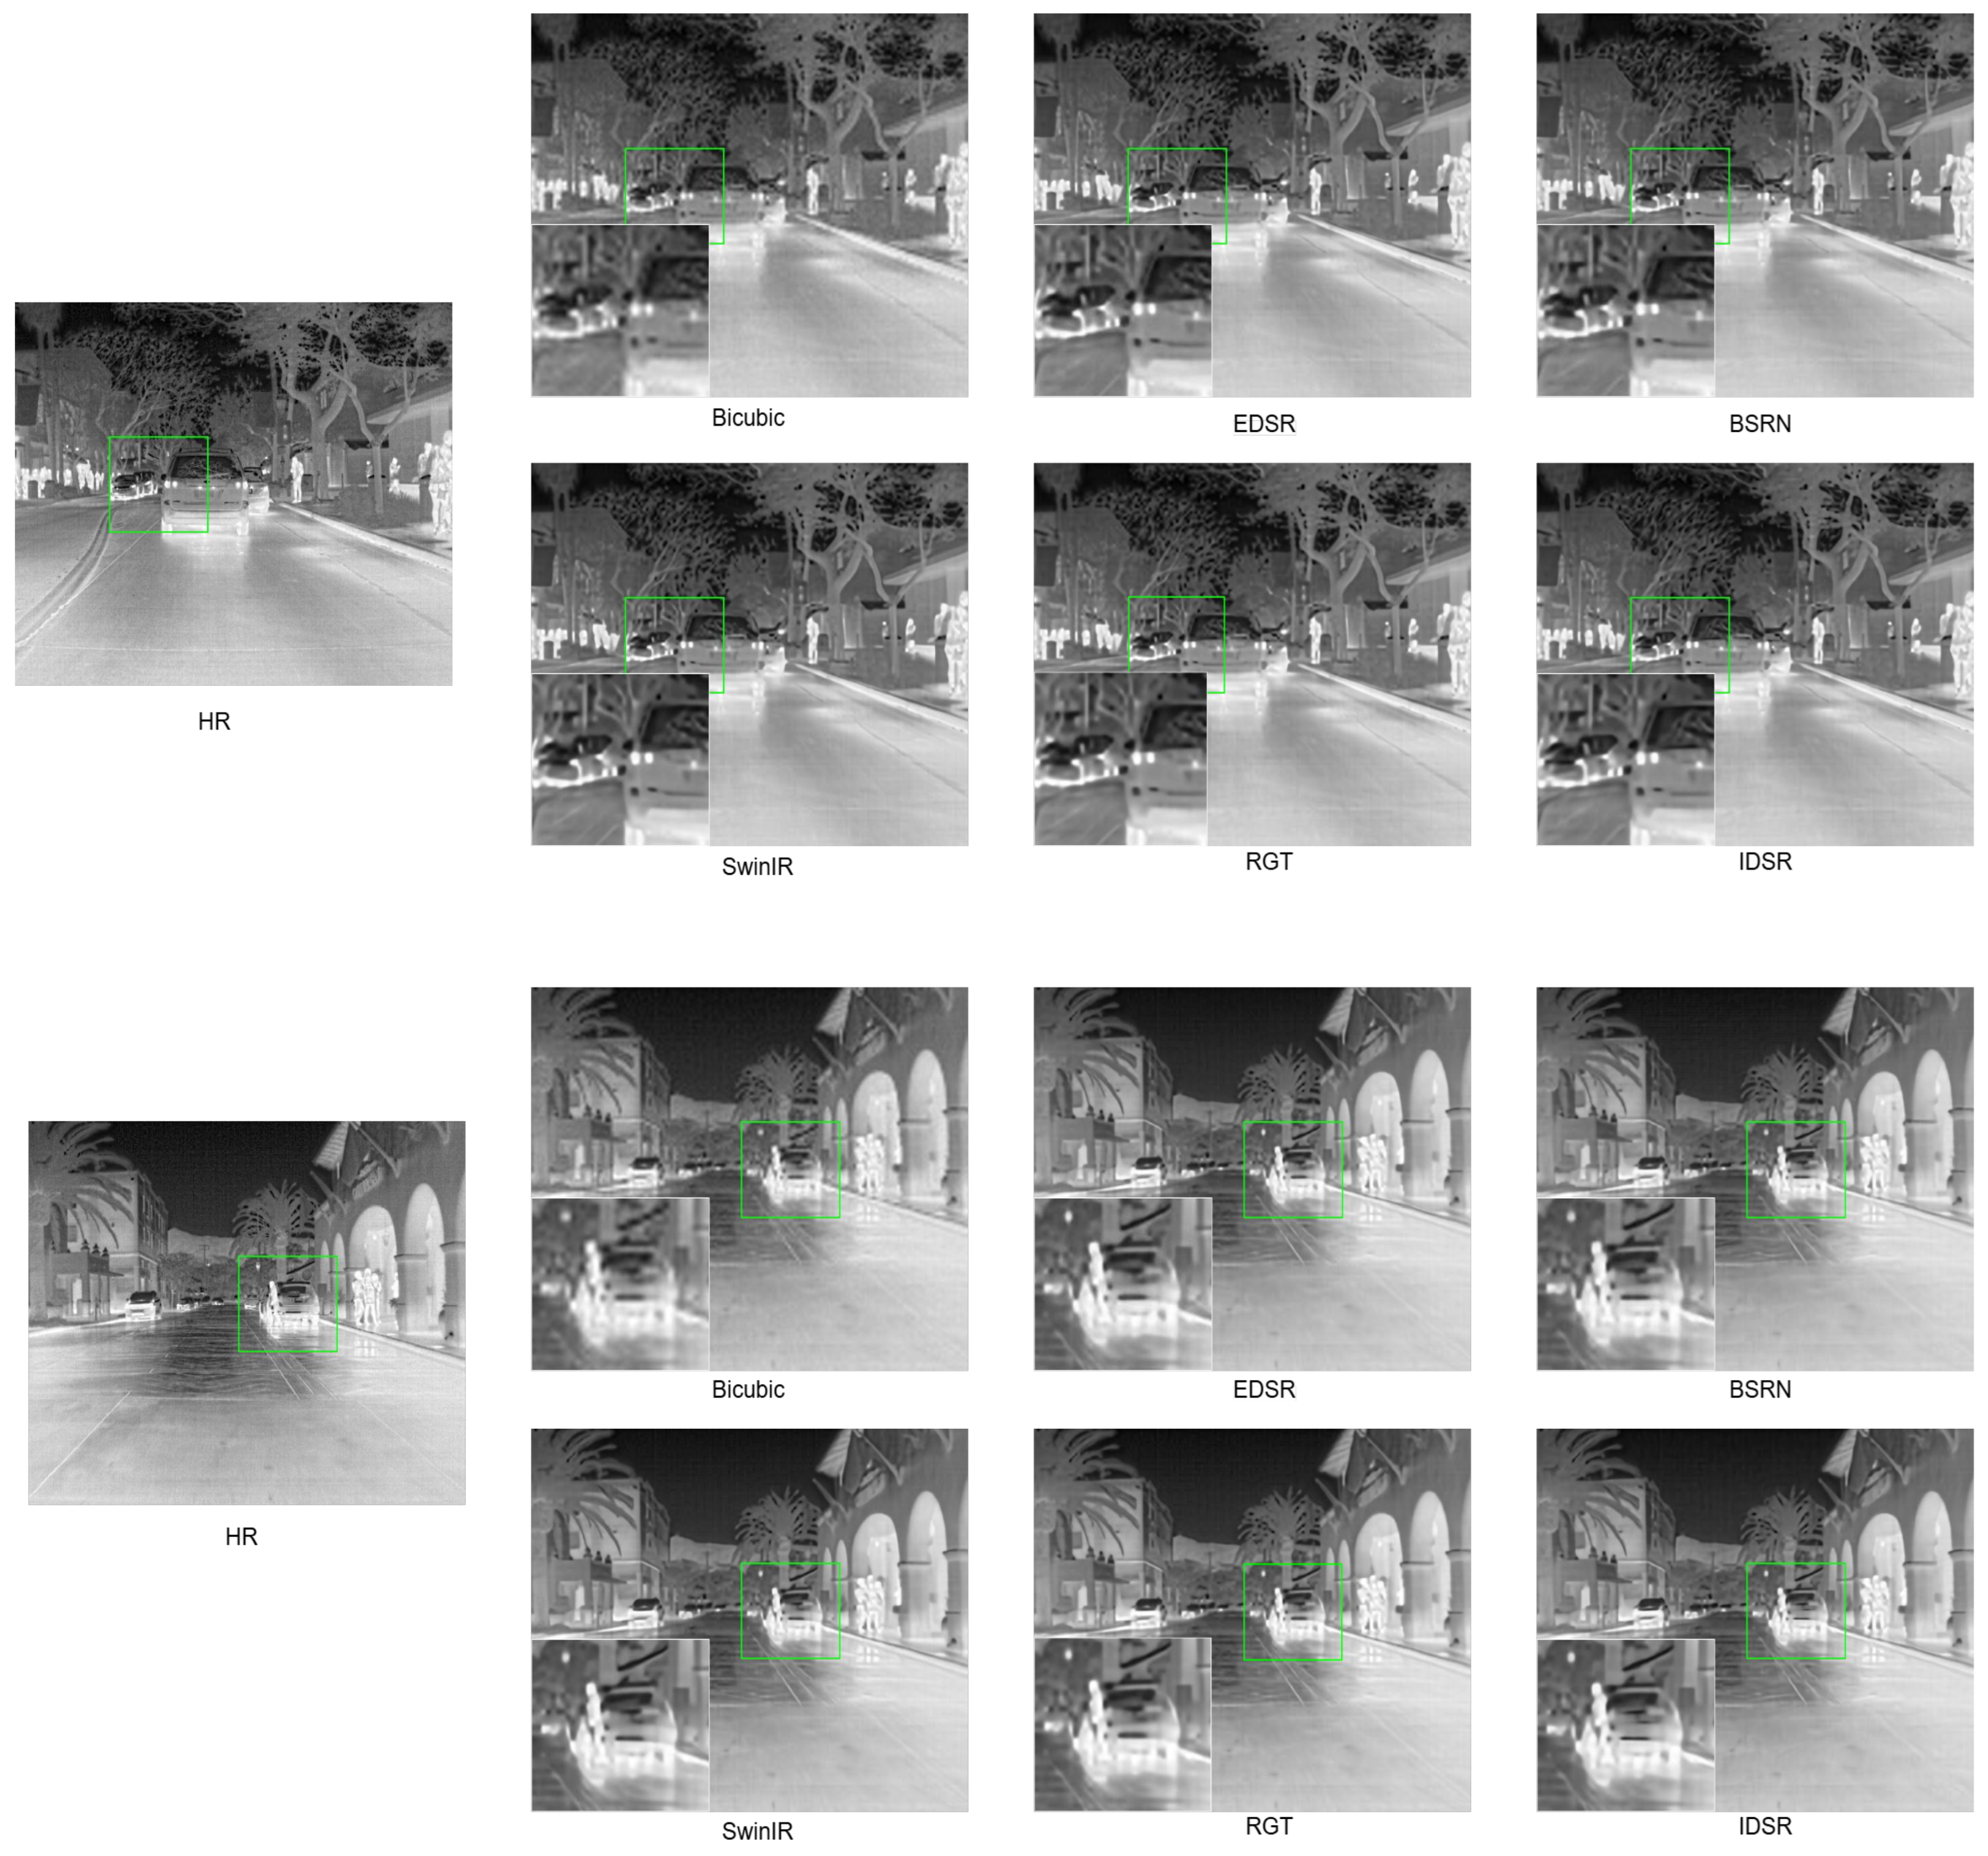
3.3.1. Comparison with State-of-the-Art SR Methods
3.3.2. Different Values of Loss Weights
3.3.3. After Fine-Tuning by the Feature-Driven Module, the Comparison with State-of-the-Art SR Methods
3.3.4. Ablation Experiment
3.3.5. Generalization Experiment on M3FD Dataset
4. Discussion
5. Conclusions
Author Contributions
Funding
Data Availability Statement
Conflicts of Interest
References
- Huang, Y.; Miyazaki, T.; Liu, X.F.; Omachi, S. Infrared Image Super-Resolution: Systematic Review, and Future Trends. arXiv 2022, arXiv:2212.12322. [Google Scholar] [CrossRef]
- Shi, W.; Caballero, J.; Huszár, F.; Totz, J.; Aitken, A.P.; Bishop, R.; Rueckert, D.; Wang, Z. Real-Time Single Image and Video Super-Resolution Using an Efficient Sub-Pixel Convolutional Neural Network. In Proceedings of the 2016 IEEE Conference on Computer Vision and Pattern Recognition (CVPR), Las Vegas, NV, USA, 27–30 June 2016; pp. 1874–1883. [Google Scholar] [CrossRef]
- Lim, B.; Son, S.; Kim, H.; Nah, S.; Lee, K.M. Enhanced Deep Residual Networks for Single Image Super-Resolution. In Proceedings of the 2017 IEEE Conference on Computer Vision and Pattern Recognition Workshops (CVPRW), Honolulu, HI, USA, 21–26 July 2017; pp. 1132–1140. [Google Scholar] [CrossRef]
- Li, Z.; Liu, Y.; Chen, X.; Cai, H.; Gu, J.; Qiao, Y.; Dong, C. Blueprint Separable Residual Network for Efficient Image Super-Resolution. In Proceedings of the 2022 IEEE/CVF COnference on Computer Vision and Pattern Recognition Workshops, CVPRW 2022, New Orleans, LA, USA, 19–20 June 2022; pp. 832–842. [Google Scholar] [CrossRef]
- Liang, J.; Cao, J.; Sun, G.; Zhang, K.; Gool, L.V.; Timofte, R. SwinIR: Image Restoration Using Swin Transformer. In Proceedings of the 2021 IEEE/CVF International Conference on Computer Vision Workshops (ICCVW), Montreal, BC, Canada, 11–17 October 2021; pp. 1833–1844. [Google Scholar] [CrossRef]
- Liu, Z.; Lin, Y.; Cao, Y.; Hu, H.; Wei, Y.; Zhang, Z.; Lin, S.; Guo, B. Swin Transformer: Hierarchical Vision Transformer using Shifted Windows. In Proceedings of the 2021 IEEE/CVF International Conference on Computer Vision (ICCV), Montreal, QC, Canada, 11–17 October 2021; pp. 9992–10002. [Google Scholar] [CrossRef]
- Chen, Z.; Zhang, Y.; Gu, J.; Kong, L.; Yang, X. Recursive Generalization Transformer for Image Super-Resolution. In Proceedings of the ICLR, Vienna, Austria, 7 May 2024. [Google Scholar]
- Zamir, A.; Sax, A.; Shen, W.; Guibas, L.; Malik, J.; Savarese, S. Taskonomy: Disentangling Task Transfer Learning. In Proceedings of the 2018 IEEE/CVF Conference on Computer Vision and Pattern Recognition (CVPR), Salt Lake City, UT, USA, 18–23 June 2018; pp. 3712–3722. [Google Scholar] [CrossRef]
- Tang, L.; Yuan, J.; Ma, J. Image fusion in the loop of high-level vision tasks: A semantic-aware real-time infrared and visible image fusion network. Inf. Fusion 2022, 82, 28–42. [Google Scholar] [CrossRef]
- Liu, D.; Wen, B.; Liu, X.; Wang, Z.; Huang, T. When Image Denoising Meets High-Level Vision Tasks: A Deep Learning Ap proach. In Proceedings of the International Joint Conferences on Artificial Intelligence Organization, Stockholm, Sweden, 13–19 July 2018; pp. 842–848. [Google Scholar] [CrossRef]
- Wang, X.; Girshick, R.; Gupta, A.; He, K. Non-local Neural Networks. In Proceedings of the 2018 IEEE/CVF Conference on Computer Vision and Pattern Recognition, Salt Lake City, UT, USA, 18–23 June 2018; pp. 7794–7803. [Google Scholar] [CrossRef]
- Shorten, C.; Khoshgoftaar, T.M. A survey on Image Data Augmentation for Deep Learning. J. Big Data 2019, 6, 60. [Google Scholar] [CrossRef]
- Zhang, Q.; Xu, Y.; Zhang, J.; Tao, D. ViTAEv2: Vision Transformer Advanced by Exploring Inductive Bias for Image Recognition and Beyond. Int. J. Comput. Vis. 2023, 131, 1141–1162. [Google Scholar] [CrossRef]
- Xiao, T.; Singh, M.; Mintun, E.; Darrell, T.; Dollár, P.; Girshick, R.B. Early Convolutions Help Transformers See Better. arXiv 2021, arXiv:2106.14881. [Google Scholar]
- Si, C.; Yu, W.; Zhou, P.; Zhou, Y.; Wang, X.; Yan, S. Inception transformer. In Proceedings of the 36th International Conference on Neural Information Processing Systems, NIPS’22, New Orleans, LA, USA, 28 November–9 December 2022. [Google Scholar]
- Yu, F.; Koltun, V. Multi-Scale Context Aggregation by Dilated Convolutions. arXiv 2015, arXiv:1511.07122. [Google Scholar]
- Kwasniewska, A.; Ruminski, J.; Szankin, M.; Kaczmarek, M. Super-resolved thermal imagery for high-accuracy facial areas detection and analysis. Eng. Appl. Artif. Intell. 2020, 87, 103263. [Google Scholar] [CrossRef]
- Wang, H.; Wu, X.; Huang, Z.; Xing, E.P. High-Frequency Component Helps Explain the Generalization of Convolutional Neural Networks. In Proceedings of the 2020 IEEE/CVF Conference on Computer Vision and Pattern Recognition (CVPR), Seattle, WA, USA, 13–19 June 2020; pp. 8681–8691. [Google Scholar] [CrossRef]
- Mehta, S.; Rastegari, M.; Caspi, A.; Shapiro, L.; Hajishirzi, H. ESPNet: Efficient Spatial Pyramid of Dilated Convolutions for Semantic Segmentation. In Proceedings of the Computer Vision—ECCV 2018, Munich, Germany, 8–14 September 2018; Springer International Publishing: Berlin/Heidelberg, Germany, 2018; pp. 561–580. [Google Scholar]
- Wang, C.Y.; Bochkovskiy, A.; Liao, H.Y.M. YOLOv7: Trainable Bag-of-Freebies Sets New State-of-the-Art for Real-Time Object Detectors. In Proceedings of the 2023 IEEE/CVF Conference on Computer Vision and Pattern Recognition (CVPR), Vancouver, BC, Canada, 17–24 June 2023; pp. 7464–7475. [Google Scholar] [CrossRef]
- Lai, W.S.; Huang, J.B.; Ahuja, N.; Yang, M.H. Fast and Accurate Image Super-Resolution with Deep Laplacian Pyramid Networks. IEEE Trans. Pattern Anal. Mach. Intell. 2019, 41, 2599–2613. [Google Scholar] [CrossRef] [PubMed]
- FLIR, T. Flir Thermal Dataset for Algorithm Training. DB/OL. 2018. Available online: https://www.flir.com/oem/adas/adas-dataset-form/ (accessed on 1 May 2024).
- Liu, J.; Fan, X.; Huang, Z.; Wu, G.; Liu, R.; Zhong, W.; Luo, Z. Target-aware Dual Adversarial Learning and a Multi-scenario Multi-Modality Benchmark to Fuse Infrared and Visible for Object Detection. In Proceedings of the IEEE/CVF Conference on Computer Vision and Pattern Recognition, New Orleans, LA, USA, 18–24 June 2022; pp. 5802–5811. [Google Scholar]
- Wang, Z.; Simoncelli, E.P.; Bovik, A.C. Multiscale structural similarity for image quality assessment. In Proceedings of the Thrity-Seventh Asilomar Conference on Signals, Systems & Computers, Pacific Grove, CA, USA, 9–12 November 2003; Volume 2, pp. 1398–1402. [Google Scholar] [CrossRef]
- Sheikh, H.R.; Bovik, A.C.; Veciana, G.d. An information fidelity criterion for image quality assessment using natural scene statistics. IEEE Trans. Image Process. 2005, 14, 2117–2128. [Google Scholar] [CrossRef] [PubMed]


| Method | PSNR | MS-SSIM | IFC | SF | Person mAP | Car mAP | Average mAP |
|---|---|---|---|---|---|---|---|
| LR | — | — | — | — | 70.30 | 77.10 | 73.70 |
| Bicubic | 25.94 | 0.68 | 1.17 | 8.26 | 70.30 | 76.10 | 73.20 |
| EDSR | 26.60 | 0.72 | 1.29 | 10.21 | 73.10 | 80.50 | 76.80 |
| BSRN | 26.53 | 0.71 | 1.27 | 10.02 | 72.70 | 80.50 | 76.60 |
| SwinIR | 26.65 | 0.72 | 1.31 | 10.44 | 73.70 | 80.90 | 77.30 |
| RGT | 26.68 | 0.72 | 1.31 | 10.29 | 73.80 | 81.50 | 77.65 |
| IDSR | 26.64 | 0.72 | 1.31 | 10.53 | 76.30 | 82.50 | 79.40 |
| Method | PSNR | MS-SSIM | IFC | SF | Person mAP | Car mAP | Average mAP |
|---|---|---|---|---|---|---|---|
| Bicubic | 25.94 | 0.68 | 1.17 | 8.26 | 70.30 | 76.10 | 73.20 |
| EDSR | 26.55 | 0.71 | 1.30 | 10.43 | 73.00 | 80.60 | 76.80 |
| BSRN | 26.45 | 0.71 | 1.27 | 10.28 | 73.00 | 80.40 | 76.70 |
| SwinIR | 26.69 | 0.72 | 1.32 | 10.43 | 73.90 | 81.50 | 77.70 |
| RGT | 26.71 | 0.72 | 1.32 | 10.17 | 74.40 | 81.40 | 77.90 |
| Our method | 26.50 | 0.71 | 1.36 | 11.17 | 77.30 | 83.80 | 80.55 |
| SSD | Cascade-RCNN | |||||
|---|---|---|---|---|---|---|
| Method | Person mAP | Car mAP | Average mAP | Person mAP | Car mAP | Average mAP |
| Bicubic | 31.70 | 54.60 | 43.15 | 42.90 | 53.60 | 48.25 |
| EDSR | 42.60 | 64.20 | 53.40 | 54.70 | 62.50 | 58.60 |
| BSRN | 42.80 | 63.80 | 53.30 | 54.40 | 61.80 | 58.10 |
| SwinIR | 44.50 | 66.00 | 55.25 | 56.70 | 64.40 | 60.55 |
| RGT | 44.30 | 65.60 | 54.95 | 57.30 | 65.20 | 61.25 |
| Our method | 49.50 | 71.50 | 60.50 | 63.60 | 73.20 | 68.40 |
| Experiment | PSNR | MS-SSIM | IFC | SF | Person mAP | Car mAP | Average mAP |
|---|---|---|---|---|---|---|---|
| SwinIR (200 k iters) | 26.65 | 0.72 | 1.31 | 10.44 | 73.70 | 80.90 | 77.30 |
| +DataPre (200 k iters) | 26.67 | 0.72 | 1.30 | 10.41 | 74.90 | 82.30 | 78.60 |
| +Deconv (200 k iters) | 26.93 | 0.72 | 1.31 | 9.96 | 74.70 | 82.70 | 78.70 |
| +IDM (200 k iters) | 26.69 | 0.70 | 1.37 | 11.68 | 74.40 | 83.60 | 79.00 |
| +DataPre + Deconv + IDM = IDSR (200 k iters) | 26.64 | 0.72 | 1.31 | 10.53 | 76.30 | 82.50 | 79.40 |
| SwinIR (300 k iters) | 26.69 | 0.72 | 1.32 | 10.43 | 73.90 | 81.50 | 77.70 |
| +Feature-driven (300 k iters) | 26.62 | 0.70 | 1.34 | 11.00 | 75.20 | 84.40 | 79.80 |
| +DataPre + Deconv + IDM + Feature-driven = Our method (300 k iters) | 26.50 | 0.71 | 1.36 | 11.17 | 77.30 | 83.80 | 80.55 |
| Method | PSNR | MS-SSIM | IFC | SF | Person mAP | Car mAP | Average mAP |
|---|---|---|---|---|---|---|---|
| LR | — | — | — | — | 68.00 | 74.60 | 71.30 |
| Bicubic | 35.98 | 0.93 | 1.79 | 6.39 | 68.10 | 74.70 | 71.40 |
| EDSR | 37.30 | 0.94 | 1.88 | 7.45 | 71.70 | 75.90 | 73.80 |
| BSRN | 36.79 | 0.94 | 1.88 | 7.40 | 70.90 | 76.20 | 73.55 |
| SwinIR | 37.38 | 0.94 | 1.92 | 7.50 | 71.70 | 76.20 | 73.95 |
| RGT | 37.43 | 0.94 | 1.91 | 7.27 | 71.80 | 76.70 | 74.25 |
| Our method | 37.11 | 0.93 | 1.95 | 7.81 | 72.50 | 76.90 | 74.70 |
Disclaimer/Publisher’s Note: The statements, opinions and data contained in all publications are solely those of the individual author(s) and contributor(s) and not of MDPI and/or the editor(s). MDPI and/or the editor(s) disclaim responsibility for any injury to people or property resulting from any ideas, methods, instructions or products referred to in the content. |
© 2024 by the authors. Licensee MDPI, Basel, Switzerland. This article is an open access article distributed under the terms and conditions of the Creative Commons Attribution (CC BY) license (https://creativecommons.org/licenses/by/4.0/).
Share and Cite
Huang, J.; Wang, H.; Li, Y.; Liu, S. A Feature-Driven Inception Dilated Network for Infrared Image Super-Resolution Reconstruction. Remote Sens. 2024, 16, 4033. https://doi.org/10.3390/rs16214033
Huang J, Wang H, Li Y, Liu S. A Feature-Driven Inception Dilated Network for Infrared Image Super-Resolution Reconstruction. Remote Sensing. 2024; 16(21):4033. https://doi.org/10.3390/rs16214033
Chicago/Turabian StyleHuang, Jiaxin, Huicong Wang, Yuhan Li, and Shijian Liu. 2024. "A Feature-Driven Inception Dilated Network for Infrared Image Super-Resolution Reconstruction" Remote Sensing 16, no. 21: 4033. https://doi.org/10.3390/rs16214033
APA StyleHuang, J., Wang, H., Li, Y., & Liu, S. (2024). A Feature-Driven Inception Dilated Network for Infrared Image Super-Resolution Reconstruction. Remote Sensing, 16(21), 4033. https://doi.org/10.3390/rs16214033