Abstract
Convection monitoring and forecasting are crucial for air traffic management as they can lead to the development of intense thunderstorms and hazards such as severe turbulence and icing, lightning activity, microbursts and hail that affect aviation safety. The airport of Burgas is located in southeast Bulgaria on the Black Sea coast and occurrences of intense thunderstorms are mainly observed in the warm season between May and September. This work presents an analysis of severe convection over southeast Bulgaria on 17 September 2022. In the late afternoon, a gust front was formed that reached the Burgas airport with a wind speed exceeding 45 m/s, the record for the past 50 years, damaging the instrument landing system of the airport. To analyse the severe weather conditions, we combine state-of-the-art observations from satellite and radar with the upper-air sounding and surface. The studied period was dominated by the presence of a very unstable air mass over southeast Bulgaria ahead of the atmospheric front. As convection developed and moved east towards Burgas, it had four characteristics of severe deep convection, including gravitational waves at the overshooting cloud top, a cold U-shape, a flanking line and a cloud top temperature below −70 °C. The positive integrated water vapour (IWV) rate of change preceded the lightning activity peak by 30 min. Analysis of integrated vapour transport (IVT) gives higher values by a factor of two compared to climatology associated with the atmospheric river covering the eastern Mediterranean sea.
1. Introduction
The World Meteorological Organization (WMO) defines an extreme weather event as a rare event at a particular place and time of year, with unusual characteristics in terms of magnitude, location, timing or extent [1]. Climate changes are resulting in extreme weather and are leading to changes in the frequency, intensity, spatial extent, duration and timing of weather and climate extremes [2]. For example, during 2017–2021, parts of Eurasia and the African Sahel were anomalously wet, and Southern Africa and Western Europe were anomalously dry [3]. Improving early warnings and disaster management is crucial for decreasing the number of life and economic losses. Nowcasting is an essential component of early warning systems and plays an increasing role in crisis management and risk prevention. Monitoring and nowcasting convective weather events are highly complex and integrated tasks that require high-resolution observations, including radar, satellite, lightning detection networks, surface meteorological stations, wind profiles, aircraft-based observations and radiosondes. Weather radars are an established observing system for issuing warnings, with confidence, of severe convective weather like flash floods, hail, tornadoes, microbursts and other damaging thunderstorm winds [4]. Radar has a distinct advantage in precipitation nowcasting because it directly observes precipitation particles in three dimensions over a large area, with an update rate of 4–5 min. The detection of wind convergence lines is particularly important for nowcasting thunderstorm initiation, growth and dissipation. It has been shown that thunderstorms initiate and grow along convergence lines and storms often dissipate if they move rapidly away from convergence lines. While radar is the most useful tool for nowcasting, synergies with other observations, like remote sensing systems, are very important for providing high spatial and temporal resolution. Monitoring the state of the atmosphere with high resolution is possible using a ground-based global navigation satellite system (GNSS, [5]). GNSS observations, expressed in terms of zenith total delay (ZTD), can be transformed into integrated water vapour (IWV) values that provide a valuable insight into the atmospheric instability [6]. Several studies have investigated the spatiotemporal patterns of IWV during extreme weather events, such as heavy rainfall, thunderstorms and tropical cyclones ([7,8,9]). Convection monitoring and forecasting are crucial for air traffic management as they can lead to the development of intense thunderstorms and hazards such as severe turbulence and icing, lightning activity, microbursts and hail that affect aviation safety and cause delays. According to [10], the number of flights in 2022 increased by 48% when compared to 2021. The majority of delays in 2022 were associated with en-route delays (83%), primarily related to a lack of air traffic control capacity due to staffing issues, followed by other en-route constraints and en-route weather-related events. In 2022, air traffic flow management reported that airport delays represented 17% of the total delays, with 40% attributed to weather-related events at the airport [11]. Traffic in Bulgaria increased by 59% compared to 2021, which is a recovery of 93% from 2019 levels. After the COVID crisis, the EUROCONTROL Seven-Year Forecast (2023–2028) predicts an average annual increase between 3.3% and 6.7% during the planning cycle, with an average baseline growth of 5.2% [12].
The airport of Burgas is located in southeast Bulgaria, where the airspace of the Republic of Bulgaria serves as an important bridge between Europe and Asia. For this region, occurrences of intense thunderstorms are mainly observed in the warm season between May and September (north hemisphere late spring and summer). Highly unstable atmospheric conditions on 17 September 2022 support the development of three severe convective systems that moved in a northeast direction across Bulgaria. For that day, more than 30,000 instances of lightning were detected and the European Severe Weather Database shows that there were 51 reports from Bulgaria [13]. Most of the reports are at the time the first severe convective system developed in southeast Bulgaria and moved towards the city of Burgas, placed at the coastline of the Black Sea. According to [14], a record wind gust of 45 m/s was observed at the Burgas airport, which exceeded the estimated maximum wind speed once every 50 years. A valuable insight of atmospheric instability is given by the IVT index, which can be connected with extreme precipitation and flood occurrence ([15,16]).
2. Data and Methods
The synoptic situation and atmospheric instability are analysed using ERA5 reanalysis [17]. As moisture is one of the the main ingredients for intense thunderstorms, formation GNSS tropospheric products are analysed and compared to lightning activity from the LINET network. This is possible as the thunderstorm passes directly over the GNSS station. The IWV data are derived from GNSS tropospheric products available at the Storm demo portal [18]. Wind information from aircraft-based observations AMDAR and Mode-S is used to analyse the environmental conditions near the coastline of the Black Sea and their potential to support severe weather. Satellite and radar data for the period 12:00–14:00 UTC are used in helping the analysis of the initiation and development of the severe convective storm. At the time the storm hits Burgas airport, information for wind speed, temperature and pressure from the Burgas automated weather observation system (AWOS) is analysed.
2.1. ERA5 Reanalyse
To study the atmospheric dynamics that led to the extreme weather on 17 September, we use the following data from the European Centre for Medium-Range Weather Forecasts (ECMWF) global reanalysis (ERA5): (1) mean sea level pressure, temperature and thickness charts and (2) the temperature and wind vertical profile at Burgas airport. To compute the integrated vapour transport index (IVT, [16]) ERA5 hourly data of specific humidity (q), zonal (u) and meridional (v) wind components at 10 pressure levels (p) of 1000, 925, 850, 700, 500, 400, 300, 200, 100 and 50 hPa are downloaded and used in the following equation:
Hourly changes in the IVT index for the studied day are investigated. The IVT anomaly on 17 September 2022 is computed by subtracting the 30 year mean values of IVT on 17 September at 12:00 UTC.
2.2. Observations
Surface meteorological data obtained by the automated weather observation system (AWOS) at Burgas airport are analysed, more specifically, 10-m-height anemometer wind speed readings, combined with data from temperature and pressure sensors.
Meteorological data collected from the aircraft are used in this study. Mode-S is a secondary surveillance and communication system that supports air traffic control. Mode-S is composed of ground radar and transponders on board the aircraft. The data are related either to the direct measurement of weather parameters from sensors installed on the aircraft or to information about aircraft location and speed. These kinds of data are an alternative to radiosonde measurements.
The radar information is from a weather Doppler radar located at Varna airport (blue circle in Figure 1), which is 80 km north of Burgas airport (red circle in Figure 1). The radar performs effective observations in the C-band range, at a frequency of 5.64 GHz. It has a horizontal polarisation of the beam, with an uneven circular scan (360°) at thirteen different angles. The maximum useful range of the radar is 250 km and the resolution of a single pixel is 250 m. The weather radar performs one full scan in 5 min. The main purpose of the radar is to detect and track the movement and development of cloud systems with a convective nature and related phenomena dangerous to aviation.
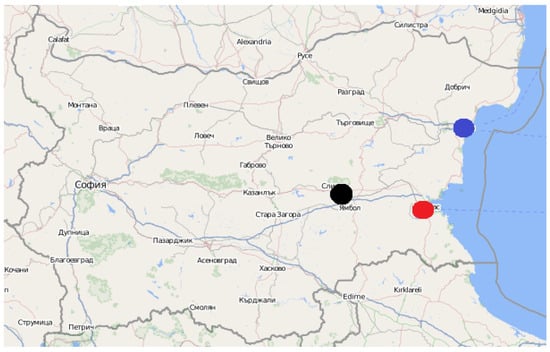
Figure 1.
Map of Bulgaria and position of Staro Selo GNSS station (black circle), Varna weather radar (blue circle) and Burgas airport (red circle).
Lightning activity data are from the nowcast LINET high-resolution lightning detection network [19]. In Europe, the sensors are located at a distance of about 150–250 km from each other, and, in Bulgaria, there are 3 sensors. The system determines the location of the discharge with an accuracy of about 100 m by measuring the difference in the moment at which the sensors detected the discharge and the subsequent triangulation of the signal.
Tropospheric water vapour distribution during the severe weather event is traced using the water vapour absorption band (WV 6.2) satellite images from Meteosat Second Generation (MSG [20]). Also, the “sandwich” satellite product is used to monitor cloud top features of mature convective storms, which are possibly related to severity. This product combines two different image types: a high-resolution visible band and a colour-enhanced infrared image [21].
Since 2022, the ground-based GNSS network in Bulgaria has been processed in real time. For a detailed description of the GNSS processing, we refer to [18]. In this work, tropospheric products from the GNSS station Staro selo in central Bulgaria are used (black circle in Figure 1).
3. Results
3.1. Storm Diagnosis: 17 September 2022
A detailed synoptic analysis over Bulgaria for this day is given by [22]. On 17 September 2022, the weather over the Balkan Peninsula was defined by a multi-centre low-pressure system, with a major centre over the Baltic Sea. A secondary low-pressure centre was forming over the Adriatic Sea (Figure 2a). A frontal system was moving across Bulgaria from the northwest to southeast, with prevailing strong southwest wind. In Figure 2b, the thickness chart between 1000 and 500 hPa levels on September 17, 12:00 UTC is shown. By 12:00 UTC, the territory of Bulgaria was divided by two contrasting air masses. The northwest part of the country was dominated by a cold and wet air mass with a significant amount of nimbostratus clouds. At the same time, southeast Bulgaria was cloud-free and had more than 10 °C higher surface temperatures. At 12:00–13:00 UTC, when the convection initiation and development started, Burgas airport was located on the boundary of these two highly contrasting air masses. At the time of the storm passing the Burgas airport, the 10 min averaged wind gust reached 45 m/s.
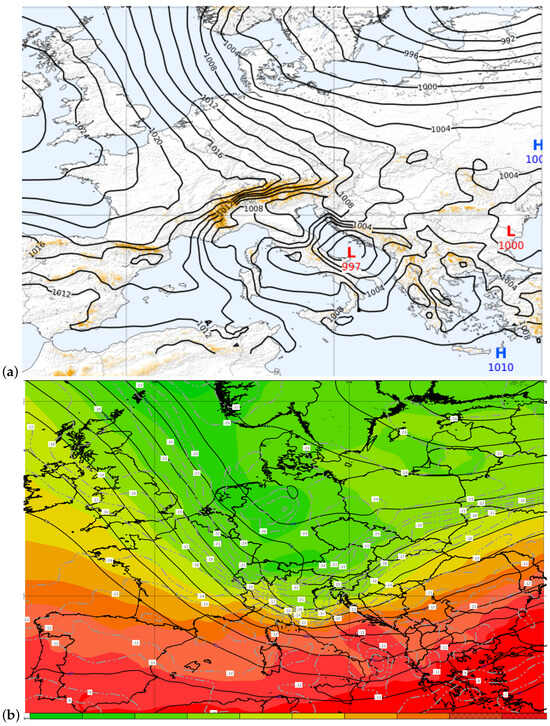
Figure 2.
(a) Mean sea level pressure (black lines) at 12:00 UTC on 17 September 2022. (b) Thickness chart at 12:00 UTC on 17 September 2022, with 500 hPa geopotential height (black line), 500 hPa isotherm (dashed line) and thickness of the air layer between 1000 and 500 hPa (colours).
During the day, the mean sea level pressure in Burgas was decreasing, with mostly sunny weather and high temperatures. Two hours before the storm impacted Burgas airport, the ERA5 Skew-t thermodiagram at 12:00 UTC (Figure 3) was similar to a loaded gun sounding shape, with strong southwest wind at all pressure levels. The wind shear between the surface and 6 km was reaching 22 m/s. Strong winds were also seen between the surface and 3 km, with wind shear values of 15 m/s. These values are indicative of a high probability of severe weather development. In addition, thirteen atmospheric instability indices are estimated and shown in Table 1. It is seen that two of the indices (CAPE, SWEAT) have below-moderate values and show no risk of severe weather. Values of the CIN index also represent a stable atmospheric condition. There are five indices (K, S, Cross Totals, Total Totals and Showalter) that show moderate values, interpreted as a likely development of thunderstorms. Five out of thirteen atmospheric instability indices (KO, Jefferson, Vertical Totals, BOYDEN and Rackliff) indicate strong convective potential and a risk of severe thunderstorm development.
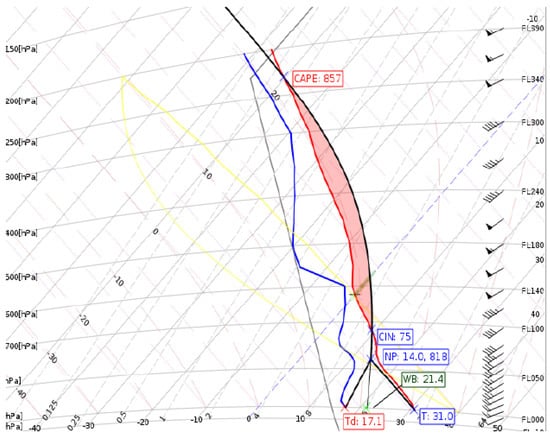
Figure 3.
Skew-t thermodiagram at Burgas airport on 17 September at 12:00 UTC.

Table 1.
Thermodynamic indices for Burgas airport at 12:00 UTC computed from ERA5 (column 2) and index values for moderate (column 3) and severe (column 4) weather.
Figure 4a presents the hodograph for wind speed and direction between the surface and 2500 m height from the Mode-S report at Burgas airport from 13:26 UTC, which is about 30 min before the storm. As seen from Figure 4a, there was a surface and low-level (600 m) southeast wind caused by the afternoon sea breeze circulation. Strong wind shear is seen in the vertical profile on Figure 4b, which can support an organised convective system.
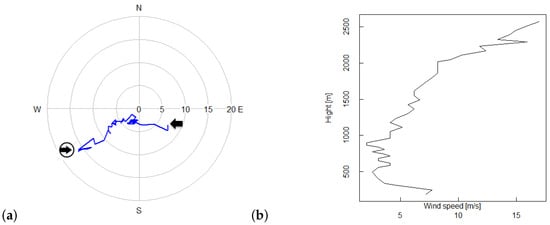
Figure 4.
13:26 UTC Mode-S (a) hodograph (blue line) from surface (black arrow) to 2500 m (black arrow in circle) and (b) vertical wind data.
Radar images at 14:00 UTC give detailed information about the structure of the convective system. In Figure 5a, a bow echo structure with a main convective cell over Burgas is seen at the 2 km radar reflectivity cross-section. Ahead of the storm, there is a well-formed gust front. In Figure 5b, the maximum radar reflectivity and vertical cross-section of the storm are shown, and we can see that the cloud reached a height above 14 km, with a max radar reflectivity of over 60 dBZ.
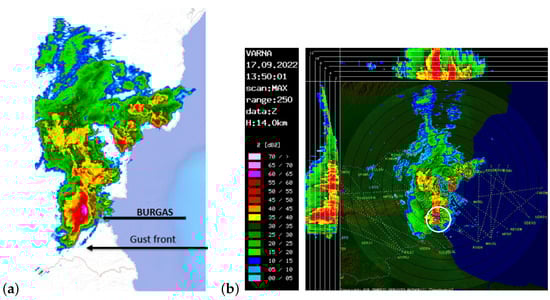
Figure 5.
Radar reflectivity at 14:00 UTC. (a) Radar reflectivity cross-section at 2 km height (dBz) and (b) Z max product from Varna weather radar.
3.2. Analysis of IWV and IVT: 17 September 2022
First, we analyse the period between 12:30 and 13:30 UTC on 17 September. That is the time when the initialisation of convection in southeast Bulgaria had already started and passed through Staro selo GNSS station. Water vapour satellite images at 12:30 UTC and 13:30 UTC are shown in Figure 6a,b, respectively. In that period, the convection started to develop into an organised multicell convective system. At 12:30 UTC, a multicell convective system with horizontal dimensions of about 55 × 130 km formed and moved fast eastwards, producing heavy rain with hail, severe wind gust and lightning activity. The cloud top reached about 14 km and its temperature was −60 °C. An hour later, the storm was near the Black Sea coast, indicating a travel speed of over 100 km/h. At 13:30 UTC, the supercell-like storm (Figure 6b) moving towards Burgas airport had horizontal dimensions of about 130 × 170 km. The cloud top height was above 16 km. As seen from Figure 6c, there were four characteristics of severe deep convection, namely (1) gravitational waves at the overshooting cloud top, (2) a cold U-shape, (3) a flanking line and (4) a temperature below −70 °C.
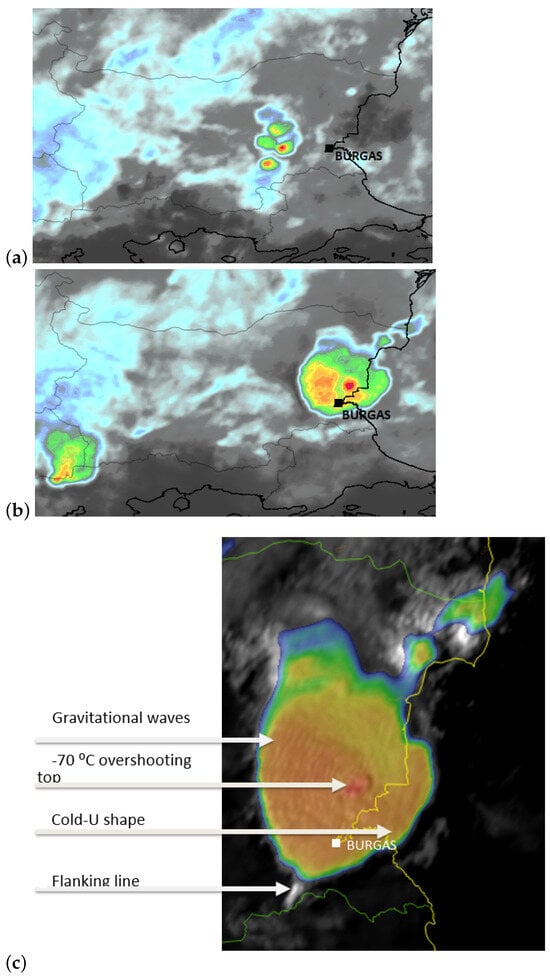
Figure 6.
MSG images of (a) 6.2 m water vapour at 12:30 UTC and (b) 6.2 m water vapour at 13:30 UTC. (c) “sandwich” satellite product for East Bulgaria at 13:30 UTC with shown storm elements.
Figure 7 shows the detected lightning for the same period and the GNSS station location (black circle in Figure 1). It is clearly seen that the thunderstorm moved directly over the GNSS station. Figure 8a shows the IWV values every 15 min between 10:00 and 15:00 UTC and the number of lightning strikes (grey bar). We can see that the peak of both IWV and lightning activity was at the time of the thunderstorm passing the station Staro selo at 12:45 UTC. In addition, Figure 8b shows the IWV gradient every 15 min and the lightning activity. It can be seen that the IWV gradient peak was 30 min before the lightning peak.
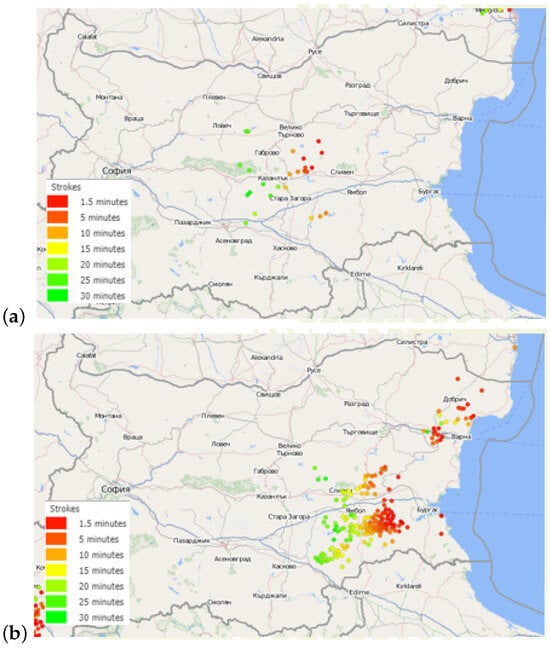
Figure 7.
Detected lightning by LINET at (a) 12:30 UTC and (b) 13:30 UTC.
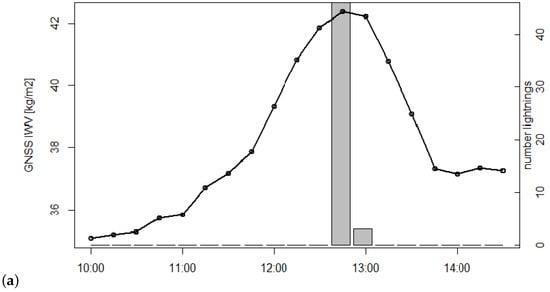
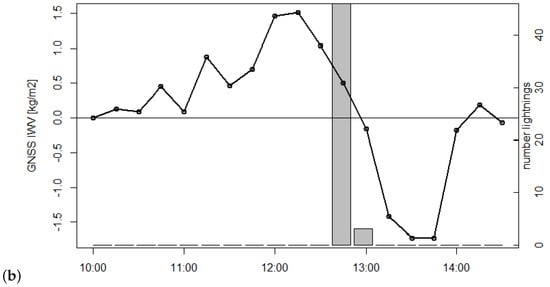
Figure 8.
(a) IWV values (black line with dots) between 10:00 and 15:00 UTC and number of lightning strikes (grey bars). (b) IWV gradient every 15 min vs. number of lightning strikes.
Further, we analysed the IVT index for the period of 16 to 18 September. The aim was to identify an atmospheric-river-like structure over Southeast Europe. At 12:00 UTC (Figure 9a), during the initiation of severe deep convection in Bulgaria, high IVT values were seen in southeast Bulgaria and the Black Sea. Further analysis of the IVT index was carried out to access the IVT anomaly over Bulgaria on 17 September. For this purpose, IVT values at 12:00 UTC on 17 September 2022 (Figure 9a) were compared with the mean IVT values for 12:00 UTC on 17 September 1992–2022 (Figure 9b). The highest values for the period 1992–2022 are seen over the Adriatic Sea, Balearic Sea and Ligurian Sea. Compared to the mean IVT values, 17 September 2022 shows a strong negative anomaly over the Balearic Sea (Figure 9c). Strong positive anomalies can be seen over South Italy, Sicily, the Tyrrhenian Sea, the Ionian Sea and all over Bulgaria, with the highest values located in the southeast part of the country.
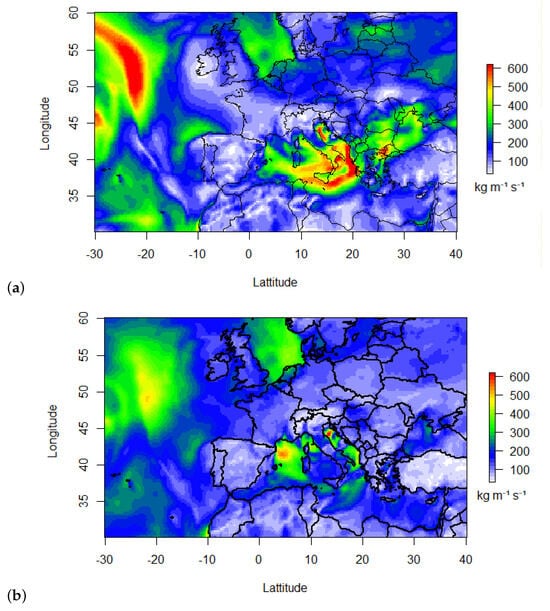
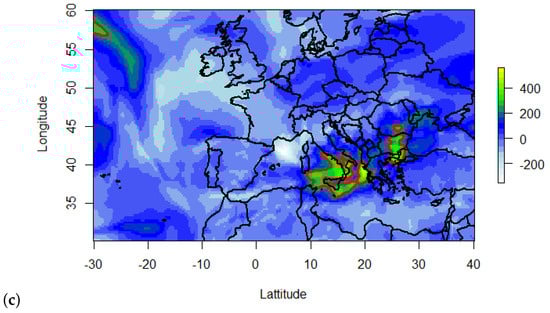
Figure 9.
(a) Map of IVT index on 17 September 2022 at 12:00 UTC. (b) Mean IVT index for 12:00 UTC on 17 September 1992–2022. (c) IVT anomaly for 12:00 UTC on 17 September 2022. Values of 250 kg/ms are shown by red isoline.
In addition, we estimated IVT at different pressure levels to analyse the moisture content of the middle and upper troposphere. In Figure 10, the vertical profiles of IVT are shown for each year and the mean over the studied period. As seen for 2022 (blue line with dots), large IVT values above the mean (red line with dots) are present at all levels, except at the 400 hPa, 100 hPa and 50 hPa pressure levels. The exceptionally moist vertical profile shows that the highest IVT values are at the 925 hPa, 850 hPa and 700 hPa pressure levels.
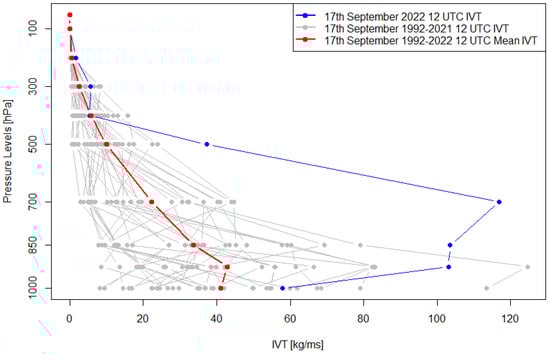
Figure 10.
17 September 12 UTC IVT vertical profiles for 1992–2021 (gray line with dots), and mean over the period 1992–2022 (red line with dots) and 2022 (blue line with dots).
4. Discussion
The storm developed on 17 September 2022 had four characteristics of severe deep convection, namely, (1) gravitational waves at the overshooting cloud top, (2) a cold U-shape, (3) a flanking line and (4) a temperature below −70 °C. The detailed synoptic analysis of the storm is presented by [22] and the focus of this work is to analyse the storm conditions by using high-temporal-resolution observations from (1) surface meteorological data, (2) GNSS-derived water vapour and (3) Mode-S in combinations with instability indices and IVT derived from ERA5 reanalysis. As shown by [32], vertical profiles of temperature and specific humidity are highly valuable sources of information; thus, the GNSS radio occultation (GNSS-RO) observations were also considered. However, for this day, there were no GNSS-RO observations for the territory of Bulgaria. A ground-based GNSS was used to compute the rate of increase in IWV and the time of lightning activity. It was found that the peak of the IWV increase is about 30 min before the lightning peak. A similar time off-set between IWV and lightning is reported by [33] in the Kanto district of Japan. Those studies clearly demonstrate the need for high-temporal-resolution data for storm nowcasting. It is to be noted that the IWV temporal resolution used in our study is 15 min and is defined by the WMO as the “goal” for nowcasting application. In addition, the IWV data are available in real time from a publicly accessible web platform (http://suada.phys.uni-sofia.bg/?page_id=4838, accessed on 19 October 2024) and can be used for severe storm monitoring in real time. Another interesting finding is the atmospheric-river-like structure approaching Southeast Europe on 16 September 2022. The IVT values recorded on 17 September are above 250 kg/ms, which is the widely accepted threshold for an atmospheric river. Further analysis of the IVT anomaly for 12:00 UTC on 17 September shows high positive values above 400 kg/ms in southeast Bulgaria and Burgas. Atmospheric rivers are the primary meteorological factor in flood generation in many California rivers, as well as a primary source of precipitation and water resources in the United States [34]. However, due to the smaller size of the Mediterranean Sea, the definition of an AR is not applicable for Bulgaria, but it will be important to study the “river-like” contribution to the severe storms.
5. Conclusions
On 17 September, the territory of Bulgaria was divided by two contrasting air masses with a more than 10 °C surface temperature difference. Two hours before the storm impacted Burgas airport, the Skew-t thermodiagram had a shape similar to a “loaded gun” with strong southwest wind at all pressure levels, and the wind shear between the surface and 6 km was 22 m/s. These values are indicative of a high probability of severe weather development. Five out of thirteen atmospheric instability indices indicate strong convective potential and a risk of severe thunderstorm development. Mode-S observations at Burgas airport recorded surface and low-level (600 m) southeast wind caused by the afternoon sea breeze circulation. At the time of the storm passing Burgas airport (13:48 UTC), the 10 min maximum wind gust reached 45 m/s. A severe deep convective cloud developed with observed gravitational waves at the overshooting cloud top, a cold U-shape, a flanking line and a temperature below −70 °C, and horizontal dimensions of 170 by 130 km reaching an altitude of 16 km.
Between 12:30 and 13:30 UTC on 17 September, the initialisation of convection in southeast Bulgaria had already started and passed through the GNSS station Staro selo. The thunderstorm moved directly over the GNSS station and both IWV and lightning activity peaked at the time of the storm passing at 12:48 UTC. A comparison between the IWV increase rate (IWV gradient) and lightning activity indicates that the IWV gradient peak is at 12:15 UTC, which is 33 min before the lightning peak. This result has a potential impact for severe storm early warning, particularly for aviation.
On 16 September, an atmospheric-river-like structure approached Southeast Europe. IVT values above 250 kg/ms were recorded west of Bulgaria at 00:00 UTC and 03:00 UTC on 17 September 2022. At 12:00 UTC, during deep convection initiation, high IVT values were seen in southeast Bulgaria and the Black Sea. Further analysis of the mean IVT index for 12:00 UTC on 17 September over 1992–2022 period shows that the highest values were seen over the Adriatic Sea, Balearic Sea and Ligurian Sea. On 17 September 2022, strong positive anomalies could be seen over South Italy, Sicily, the Tyrrhenian Sea, the Ionian Sea and Bulgaria. A high positive IVT anomaly (above 400 kg/ms) was seen in southeast Bulgaria, where Burgas airport is located.
Author Contributions
Conceptualisation, B.K. and R.P.; methodology, G.G.; formal analysis, B.K.; data curation, B.K.; writing—original draft preparation, B.K.; writing—review and editing, G.G. and R.P.; visualisation, B.K.; funding acquisition, G.G. All authors have read and agreed to the published version of the manuscript.
Funding
Guergana Guerova acknowledges funding by the European Union- NextGenerationEU, through the National Recovery and Resilience Plan of the Republic of Bulgaria, project No BG-RRP-2.004-0008-C01.
Data Availability Statement
The data are only available by request.
Acknowledgments
We thank the Hail Suppression Agency for providing GNSS data from station Staro selo. Thanks to Jan Dousa and Pavel Vaclavovic from the Geodetic observatory of Pecny for processing the GNSS data and providing ZTD products in real time. We thank the reviewers and editors for their constructive feedback and valuable suggestions.
Conflicts of Interest
The authors declare no conflicts of interest.
References
- Available online: https://wmo.int/topics/extreme-weather (accessed on 19 October 2024).
- Asadnabizadeh, M. Critical findings of the sixth assessment report (AR6) of working Group I of the intergovernmental panel on climate change (IPCC) for global climate change policymaking a summary for policymakers (SPM) analysis. Int. J. Clim. Change Strateg. Manag. 2022. ahead-of-print. [Google Scholar] [CrossRef]
- Hermanson, L.; Smith, D.; Seabrook, M.; Bilbao, R.; Doblas-Reyes, F.; Tourigny, E.; Lapin, V.; Kharin, V.V.; Merryfield, W.J.; Sospedra-Alfonso, R.; et al. WMO global annual to decadal climate update: A prediction for 2021–25. Bull. Am. Meteorol. Soc. 2022, 103, E1117–E1129. [Google Scholar] [CrossRef]
- Wang, Y.; Coning, E.D.; Jacobs, W.; Joe, P.; Nikitina, L.; Roberts, R.; Wan, J.; Wilson, J. Guidelines for Nowcasting Techniques; World Meteorological Organization: Geneva, Switzerland, 2017. [Google Scholar]
- Bevis, M.; Businger, S.; Herring, T.A.; Rocken, C.; Anthes, R.A.; Ware, R.H. GPS meteorology: Remote sensing of atmospheric water vapor using the global positioning system. J. Geophys. Res. Atmos. 1992, 97, 15787–15801. [Google Scholar] [CrossRef]
- Guerova, G.; Jones, J.; Douša, J.; Dick, G.; de Haan, S.; Pottiaux, E.; Bock, O.; Pacione, R.; Elgered, G.; Vedel, H.; et al. Review of the state of the art and future prospects of the ground-based GNSS meteorology in Europe. Atmos. Meas. Tech. 2016, 9, 5385–5406. [Google Scholar] [CrossRef]
- Sapucci, L.F.; Machado, L.A.; de Souza, E.M.; Campos, T.B. Global P ositioning S ystem precipitable water vapour (GPS-PWV) jumps before intense rain events: A potential application to nowcasting. Meteorol. Appl. 2019, 26, 49–63. [Google Scholar] [CrossRef]
- Slavchev, M.; Stoycheva, A.; Gerova, G. Comparative analysis of convective processes and the intense precipitation using numerical weather model and GNSS meteorology method. Bulg. J. Meteorol. Hydrol. 2019, 23, 31–45. [Google Scholar]
- Jones, J.; Guerova, G.; Douša, J.; Dick, G.; de Haan, S.; Pottiaux, E.; Bock, O.; Pacione, R.; van Malderen, R. (Eds.) Advanced GNSS Tropospheric Products for Monitoring Severe Weather Events and Climate; Spinger: Berlin/Heidelberg, Germany, 2020. [Google Scholar]
- Central Office for Delay Analysis Eurocontrol Annual 2022 Report. All-Causes Delays to Air Transport in Europe. 2023. Available online: https://www.eurocontrol.int/publication/all-causes-delays-air-transport-europe-annual-2022 (accessed on 19 October 2024).
- Eurocontrol. ATM Cost-Effectiveness (ACE) Benchmarking Report; Eurocontrol: Brussels, Belgium, 2024. [Google Scholar]
- Eurocontrol. Bulgaria Local Single Sky Implementation (LSSIP) Document—2022; Eurocontrol: Brussels, Belgium, 2023. [Google Scholar]
- Groenemeijer, P.; Dotzek, N.; Stel, F.; Brooks, H.E.; Doswell, C.A., III; The Late Derek Michael Elsom; Dario, G.; Gilbert, A.; Holzer, A.M.; Meaden, G.T.; et al. ESWD-A standardized, flexible data format for severe weather reports. In Proceedings of the 3rd European Conference on Severe Storms, Leon, France, 9–12 November 2004. [Google Scholar]
- Branzov, H. Valuation of the possibility for determination the maximum wind speeds using the averaged values. Bulg. J. Meteorol. Hydrol. 2010, 15, 118–130. [Google Scholar]
- Lavers, A.D.; Villarini, G. The nexus between atmospheric rivers and extreme precipitation across Europe. Geophys. Res. Lett. 2013, 40, 3259–3264. [Google Scholar] [CrossRef]
- Mahlstein, I.; Bhend, J.; Spirig, C.; Martius, O. Developing an automated medium-range flood awareness system for Switzerland based on probabilistic forecasts of integrated water vapor fluxes. Weather. Forecast. 2019, 34, 1759–1776. [Google Scholar] [CrossRef]
- Hersbach, H.; Bell, B.; Berrisford, P.; Biavati, G.; Horányi, A.; Muñoz Sabater, J.; Nicolas, J.; Peubey, C.; Radu, R.; Rozum, I.; et al. ERA5 Hourly Data on Pressure Levels from 1940 to Present. Copernicus Climate Change Service (C3S) Climate Data Store (CDS). 2023. Available online: https://climate.copernicus.eu/ (accessed on 19 October 2024).
- Guerova, G.; Douša, J.; Dimitrova, T.; Stoycheva, A.; Václavovic, P.; Penov, N. GNSS storm nowcasting demonstrator for Bulgaria. Remote Sens. 2022, 14, 3746. [Google Scholar] [CrossRef]
- Betz, H.D.; Schmidt, K.; Laroche, P.; Blanchet, P.; Oettinger, W.P.; Defer, E.; Dziewit, Z.; Konarski, J. LINET—An international lightning detection network in Europe. Atmos. Res. 2009, 91, 564–573. [Google Scholar] [CrossRef]
- Schumann, W.; Stark, H.; McMullan, K.; Aminou, D.; Luhmann, H.-J. The MSG system. In ESA Bulletin; ESA Directorate of Earth Observation, ESTEC: Noordwijk, The Netherlands, 2002; pp. 11–14. [Google Scholar]
- Available online: https://user.eumetsat.int/resources/user-guides/sandwich-products-quick-guide (accessed on 19 October 2024).
- Georgi, T.; Slavchev, M.; Popova, M. Thunderstorms and strong wind gusts in Burgas district on 17th September 2022. Bulg. J. Meteorol. Hydrol. 2022, 26, 65–81. [Google Scholar]
- Moncrieff, M.W.; Miller, M.J. The dynamics and simulation of tropical cumulonimbus and squall lines. Q. J. R. Meteorol. Soc. 1976, 102, 373–394. [Google Scholar] [CrossRef]
- George, J.J. Weather Forecasting for Aeronautics; Academic Press: Cambridge, MA, USA, 2014. [Google Scholar]
- Andersson, T.; Andersson, M.; Jacobsson, C.; Nilsson, S. Thermodynamic indexes for forecasting thunderstorms in southern sweden. Meteorol. Mag. 1989, 118, 141–146. [Google Scholar]
- Jefferson, G.J. A further development of the instability index(Modification of instability index, for use with tephigrams, for prediction of thunderstorms). Meteorol. Mag. 1963, 92, 313–316. [Google Scholar]
- Miller, R.C. Notes on Analysis and Severe-Storm Forecasting Procedures of the Air Force Global Weather Central; AWS: Seattle, WA, USA, 1975; Volume 200. [Google Scholar]
- Boyden, C.J. A simple instability index for use as a synoptic parameter. Meteor. Mag. 1963, 92, 198–210. [Google Scholar]
- Rackliff, P.G. Application of an instability index to regional forecasting. Meteorol. Mag. 1962, 91, 113–120. [Google Scholar]
- ShowalterShowalter, A.K. A stability index for thunderstorm forecasting. Bull. Am. Meteorol. Soc. 1953, 34, 250–252. [Google Scholar] [CrossRef]
- Siedlecki, M. Selected instability indices in Europe. Theor. Appl. Climatol. 2020, 96, 85–94. [Google Scholar] [CrossRef]
- Lasota, E.; Slavchev, M.; Guerova, G.; Rohm, W.; Kaplon, J. Combined space- and ground-based GNSS monitoring of two severe hailstorm cases in Bulgaria. J. Atmos. Ocean. Technol. 2022, 39, 649–665. [Google Scholar] [CrossRef]
- Inoue, H.Y.; Toshiro, I. Characteristics of the water-vapor field over the Kanto district associated with summer thunderstorm activities. SOLA 2007, 3, 101–104. [Google Scholar] [CrossRef][Green Version]
- Dettinger, M.D.; Ralph, F.M.; Das, T.; Neiman, P.J.; Cayan, D.R. Atmospheric rivers, floods and the water resources of California. Water 2011, 3, 445–478. [Google Scholar] [CrossRef]


Disclaimer/Publisher’s Note: The statements, opinions and data contained in all publications are solely those of the individual author(s) and contributor(s) and not of MDPI and/or the editor(s). MDPI and/or the editor(s) disclaim responsibility for any injury to people or property resulting from any ideas, methods, instructions or products referred to in the content. |
© 2024 by the authors. Licensee MDPI, Basel, Switzerland. This article is an open access article distributed under the terms and conditions of the Creative Commons Attribution (CC BY) license (https://creativecommons.org/licenses/by/4.0/).