Article

A Multi-Tiered Collaborative Network for Optical Remote Sensing Fine-Grained Ship Detection in Foggy Conditions

1
National Space Science Center, Key Laboratory of Electronics and Information Technology for Space System, Chinese Academy of Sciences, Beijing 100190, China
2
School of Computer Science and Technology, University of Chinese Academy of Sciences, Beijing 100049, China
3
School of Computer Science & Technology, Beijing Jiaotong University, Beijing 100091, China
*
Author to whom correspondence should be addressed.
Remote Sens. 2024, 16(21), 3968; https://doi.org/10.3390/rs16213968
Submission received: 3 September 2024 / Revised: 12 October 2024 / Accepted: 22 October 2024 / Published: 25 October 2024

Abstract

:
Ship target detection faces the challenges of complex and changing environments combined with the varied characteristics of ship targets. In practical applications, the complexity of meteorological conditions, uncertainty of lighting, and the diversity of ship target characteristics can affect the accuracy and efficiency of ship target detection algorithms. Most existing target detection methods perform well in conditions of a general scenario but underperform in complex conditions. In this study, a collaborative network for target detection under foggy weather conditions is proposed, aiming to achieve improved accuracy while satisfying the need for real-time detection. First, a collaborative block was designed and SCConv and PCA modules were introduced to enhance the detection of low-quality images. Second, the PAN + FPN structure was adopted to take full advantage of its lightweight and efficient features. Finally, four detection heads were used to enhance the performance. In addition to this, a dataset for foggy ship detection was constructed based on ShipRSImageNet, and the mAP on the dataset reached 48.7%. The detection speed reached 33.3 frames per second (FPS), which is ultimately comparable to YOLOF. It shows that the model proposed has good detection effectiveness for remote sensing ship images during low-contrast foggy days.

Graphical Abstract

1. Introduction

The rapid development of contemporary remote sensing technology has provided an abundance of high-resolution remote sensing images for maritime and military domains [1]. In maritime applications, accurate ship positioning and tracking are crucial for rescue operations [2]. Ship target detection is the foundation and prerequisite for achieving these goals and has received considerable attention. The sidelobe effect in synthetic aperture radar (SAR) images can seriously affect the detection of targets [3]. Optical images have richer texture information and more defined structures than synthetic aperture radar images, and can provide more detailed and complex constructions of the observed scenes [4]. Thus, the use of visible remote sensing images for ship target detection is important in many areas, including maritime search and rescue, maritime reconnaissance, and port management [5,6,7]. Although optical remote sensing images face many challenges in practical applications, such as weather variations and wave interference, reasonable detection performance has been achieved using advanced image processing techniques, such as convolutional neural networks (CNNs) and multiscale feature extraction, as well as data enhancement and migration learning [8,9,10,11,12]. Therefore, ship target detection using optical sensors is of significant theoretical and practical importance. Further studies in this field will contribute to further improving the capabilities of remote sensing image processing and promoting the development of ship location and tracking technology [13].
Object detection techniques play an important role in the monitoring and control of the marine environment [14]. However, the poor contrast of images on foggy days and in poor weather conditions, such as dim light, leads to a degradation in the performance of conventional target detection models. This phenomenon is known as the domain offset problem [15], in which detection models have different data distributions during training and testing, resulting in the poor performance of the models in different data distributions. When monitoring the marine environment, domain shifts in input images can lead to a significant loss of detail, which can affect the performance of target detection models, especially in ship detection. Existing target detection methods perform well for ship detection under normal sea conditions but do not achieve satisfactory results under poor conditions. Accordingly, traditional target detection models cannot be used to achieve target detection with an assured accuracy under such conditions.
Two primary approaches are currently employed for ship detection in adverse sea conditions. The first class of methods is based on the background modeling of ship detection methods, such as single Gaussian, mixed Gaussian [16], codebook [17], and ViBe algorithms [18]. This class of methods is simple and real-time, and its target detection rate is high. However, these methods have significant limitations in that the detection of stationary targets is poor, and problems such as artifacts, shadow foreground, and incomplete moving targets can occur. The second class of algorithms is the ship detection method based on manual feature extraction, such as the early Viola–Jones object detector framework [19,20], HOG Detector [21] based on the gradient direction histogram to extract features, and DPM Detector [22]. These detectors extract the features and then use a support vector machine and other classifiers [23] for classification. This class of methods is highly interpretable and can enable fast detection under simple background conditions. However, these methods also have several problems: (a) they have poor recognition effect and accuracy performance; (b) they require large computational effort and have slow computational speed; and (c) multiple recognition results may be generated.
The rise in deep learning has captured the interest of researchers due to the remarkable feature extraction capabilities and robustness exhibited by CNNs when applied to image analysis, and CNN-based methods have been applied to target detection under the impetus of Girshick et al. [24]. Two-stage detection networks represented by R-CNN, Fast R-CNN [25], and the feature pyramid network (FPN) [26] divide the task into regional feature extraction and classification. The two-stage algorithm needs to classify and identify all regions that occupy a large amount of memory space during training. There are redundant features in multiple adjacent candidate regions, which show good performance in terms of detection accuracy but a slow detection speed. The one-stage detection represented by you only look once (YOLO) [27], single-shot multibox detector (SSD) [28], and RetinaNet [29] performs both localization and classification tasks simultaneously, which shows a significant improvement in detection speed. Nonetheless, the training process of a one-stage detector often encounters the challenge of imbalanced positive and negative samples, resulting in lower detection accuracy compared to two-stage detectors. However, the continuous advancements in one-stage detectors have yielded impressive results, surpassing the performance of two-stage detectors on the COCO dataset.
Although deep learning methods have been widely used for target detection, fast ship detection under poor sea conditions has not been explored in depth, and ship detection under such conditions still faces significant challenges. A simple idea is to split this task into image enhancement preprocessing and target detection, and to investigate these two tasks separately. For the image enhancement task, traditional algorithms rely on the researcher’s strong a priori knowledge and a series of hypothetical estimates of parameters in the degradation process. These may be based on dark channels [30] or color attenuation [31], which perform poorly under certain extreme conditions such as when the background color of the sky is not clearly distinguishable from fog. Acquiring a significant number of paired training images, which are essential for training deep learning models in enhancement tasks, can be highly challenging in real-world scenarios. The performance of feeding the recovered images into the detection network depends to some extent on the performance of the augmented network, which adds uncertainty to the desired detection results. Additionally, the two-stage approach increases the complexity of the algorithm and leads to a decrease in detection efficiency [32].
Therefore, researchers have introduced the concept of multitask learning to deep learning, using more complex networks to learn common feature representations and then individual tasks to learn their respective outputs on the common features individually. Techniques such as CNN [33], RNN [34], factorization machine embedding [35], and field-aware factorization machine bedding [36] improve data usage efficiency, reduce overfitting by sharing representations, and accelerate learning using auxiliary tasks. However, negative migration or destructive interference inevitably occurs, and the performance of different tasks can be bound to each other. Therefore, the design of high-performance networks for complex conditional ship detection remains an urgent problem that must be solved.
In this study, a new network structure is proposed to optimize target detection under poor visibility conditions. The backbone of the network combines the attention mechanism and channel multiplexing with convolution to recover the image features while introducing as few parameters as possible. This is due to their inherent lightness and flexibility. To enhance the detection of small targets, the detection accuracy is improved by introducing an attention module in the detection part in addition to using four detection heads, which makes the network more suitable for ship target detection under poor conditions.
The main contributions of this paper are as follows:
  • We propose the collaborative network framework, which addresses the shortcomings of traditional models for extracting detailed features in foggy weather conditions with low visibility and degraded image quality. Our framework enhances the feature extraction capability by introducing collaborative block and pixel and channel attention (PCA) modules that focus on relevant target information, thus improving the detection performance under challenging conditions.
  • We introduce the collaborative block within the collaborative network framework, which addresses the limitations of traditional models by utilizing a multi-use convolutional kernel to reduce model size and computational complexity without sacrificing accuracy. Additionally, it incorporates a PCA mechanism that allows the network to focus more on target features during image recovery, enhancing overall detection performance.
  • The proposed model enables end-to-end ship detection under foggy conditions with improved accuracy and robustness compared to existing models. By focusing on the specific challenges of ship detection in adverse weather conditions, our collaborative network framework directly addresses the shortcomings of prior approaches, making it a highly effective solution for real-world maritime applications.
The remainder of this paper is organized as follows: Section 2 discusses related work and outlines our motivation. Section 3 provides a detailed explanation of the multi-tiered collaborative network and analyzes its underlying theoretical mechanisms. Section 4 presents the experimental data, details the data processing methods, and evaluates the performance indicators. Section 5 offers validation through comparative and ablation experiments, accompanied by a comprehensive analysis and discussion of the results. Finally, the last section concludes the paper and suggests directions for future research.

2. Related Work

2.1. Object Detection

Since 2012, object detection methods based on deep learning CNNs have seen rapid development with the iconic representative AlexNet [37]. These methods have not only achieved excellent performance on publicly available benchmark datasets [38,39,40] but have also been widely deployed in practical applications, such as in the field of autonomous driving [41]. In addition, [25,42] established a strong foundation for the development of target detection. Target detection algorithms based on CNNs can be broadly classified into two main technical development lines: anchor-based and anchor-free approaches. Anchor-based methods encompass both single-stage and two-stage detection algorithms. In the case of anchor-based two-stage detection algorithms, the workflow typically involves localization as the initial step, followed by classification. Fast R-CNN and Cascade R-CNN [43] belong to this category. Two-stage detection algorithms tend to prioritize higher accuracy, but this often comes at the expense of slower processing speeds when compared to one-stage algorithms. The YOLO family comprises classical models based on single-stage detection algorithms. The models are trained using an end-to-end approach, dividing the image into grid cells for detection, and are thus faster. However, their detection is ineffective for dense and small targets. To improve the model performance, YOLOv2 introduces batch normalization layers and clustering to generate anchor frames, and YOLOv3 borrows ideas from ResNet [44] to achieve multiscale detection; however, the model complexity is high, and the detection of medium and large targets is poor. YOLOv5s, on the other hand, improves the detection speed substantially while maintaining high accuracy. It provides four different models from which users can choose. For these reasons, in this study, part of the structure of YOLOv5s is followed to improve detection speed while maintaining detection accuracy and achieving better performance in many different application scenarios.

2.2. Exploration of Attention Mechanisms

Neural networks are computationally intensive, and the computation increases linearly with the resolution. The nature of human vision is not to process the entire scene at once but to extract key location information and then expand on the entire scene information. Based on this idea, [45] introduced an attention mechanism for RNN-based image classification tasks to solve the forgetting problem of an encoder–decoder architecture. The transformer architecture proposed in [46] can produce more interpretable models and break through the limitation that RNNs cannot be computed in parallel. There are many subsequent studies in the field of self-attentive mechanisms based on this, but it is limited by its high computational complexity, which is the reason that it is less used in the embedded and engineering fields. In addition, the transformer requires more training samples for fitting than the CNN architecture. Furthermore, the attention module has been embedded in a variety of different network architectures to perform different tasks and has shown excellent performance. For example, [47] introduced a residual attention mechanism in shallow feature maps and incorporated contextual information to enhance the detection performance specifically for small targets. In this study, the PCA module was similarly used to focus more on targets in ambiguous contexts to improve the detection performance.

2.3. Ship Inspection Under Poor Sea Conditions

Among the traditional methods, ref. [48] used a combination of superpixel segmentation and feature points to perform ship detection under cloud-occlusion conditions. Ref. [49] proposed the detection of an abnormal ship trajectory based on the complex polygon (DATCP) to detect the ship of the image. Ref. [50] proposed an algorithm based on an extended wavelet transform and phase salient map (PSMEWT) to solve the problem of ship detection under complex conditions. Among deep learning-based methods, ref. [51] used an R-CNN method based on scene classification for ship detection in foggy conditions. This method first classifies an image using a scene classifier that divides the image into classes containing ships and those that do not. The ship classification results in the scene classifier were then fused with the candidate frames in the R-CNN algorithm to obtain the final ship detection results. This method requires a large number of labeled samples for scene classification and ship detection, and there are many parameters that are reused in training. The model is difficult to train and may require retraining under different foggy remote sensing image scenes. A new method based on anomaly detection was proposed in [52] that models normal image regions as a Gaussian distribution and detects pixels that do not conform to this distribution using an anomaly detection algorithm to achieve ship target detection. The spatial pyramid pooling (SPP)-PCANet algorithm is further used for feature extraction and classification of ship targets because it determines the presence of ships by using anomaly detection, which makes it difficult to detect ships accurately when the number of ships is small. This requires the calculation of multiple filters and feature mappings, which needs more computational resources and time for large-scale datasets, limiting its use. Ref. [53] used an ensemble generative adversarial network to detect ships in rainy and foggy conditions, but this approach has a high complexity and uses a dataset with fewer typical ship classes, which may have limited performance in real-world applications.

3. Proposed Method

In this section, a comprehensive description of the network design is provided. This includes the overall network framework.

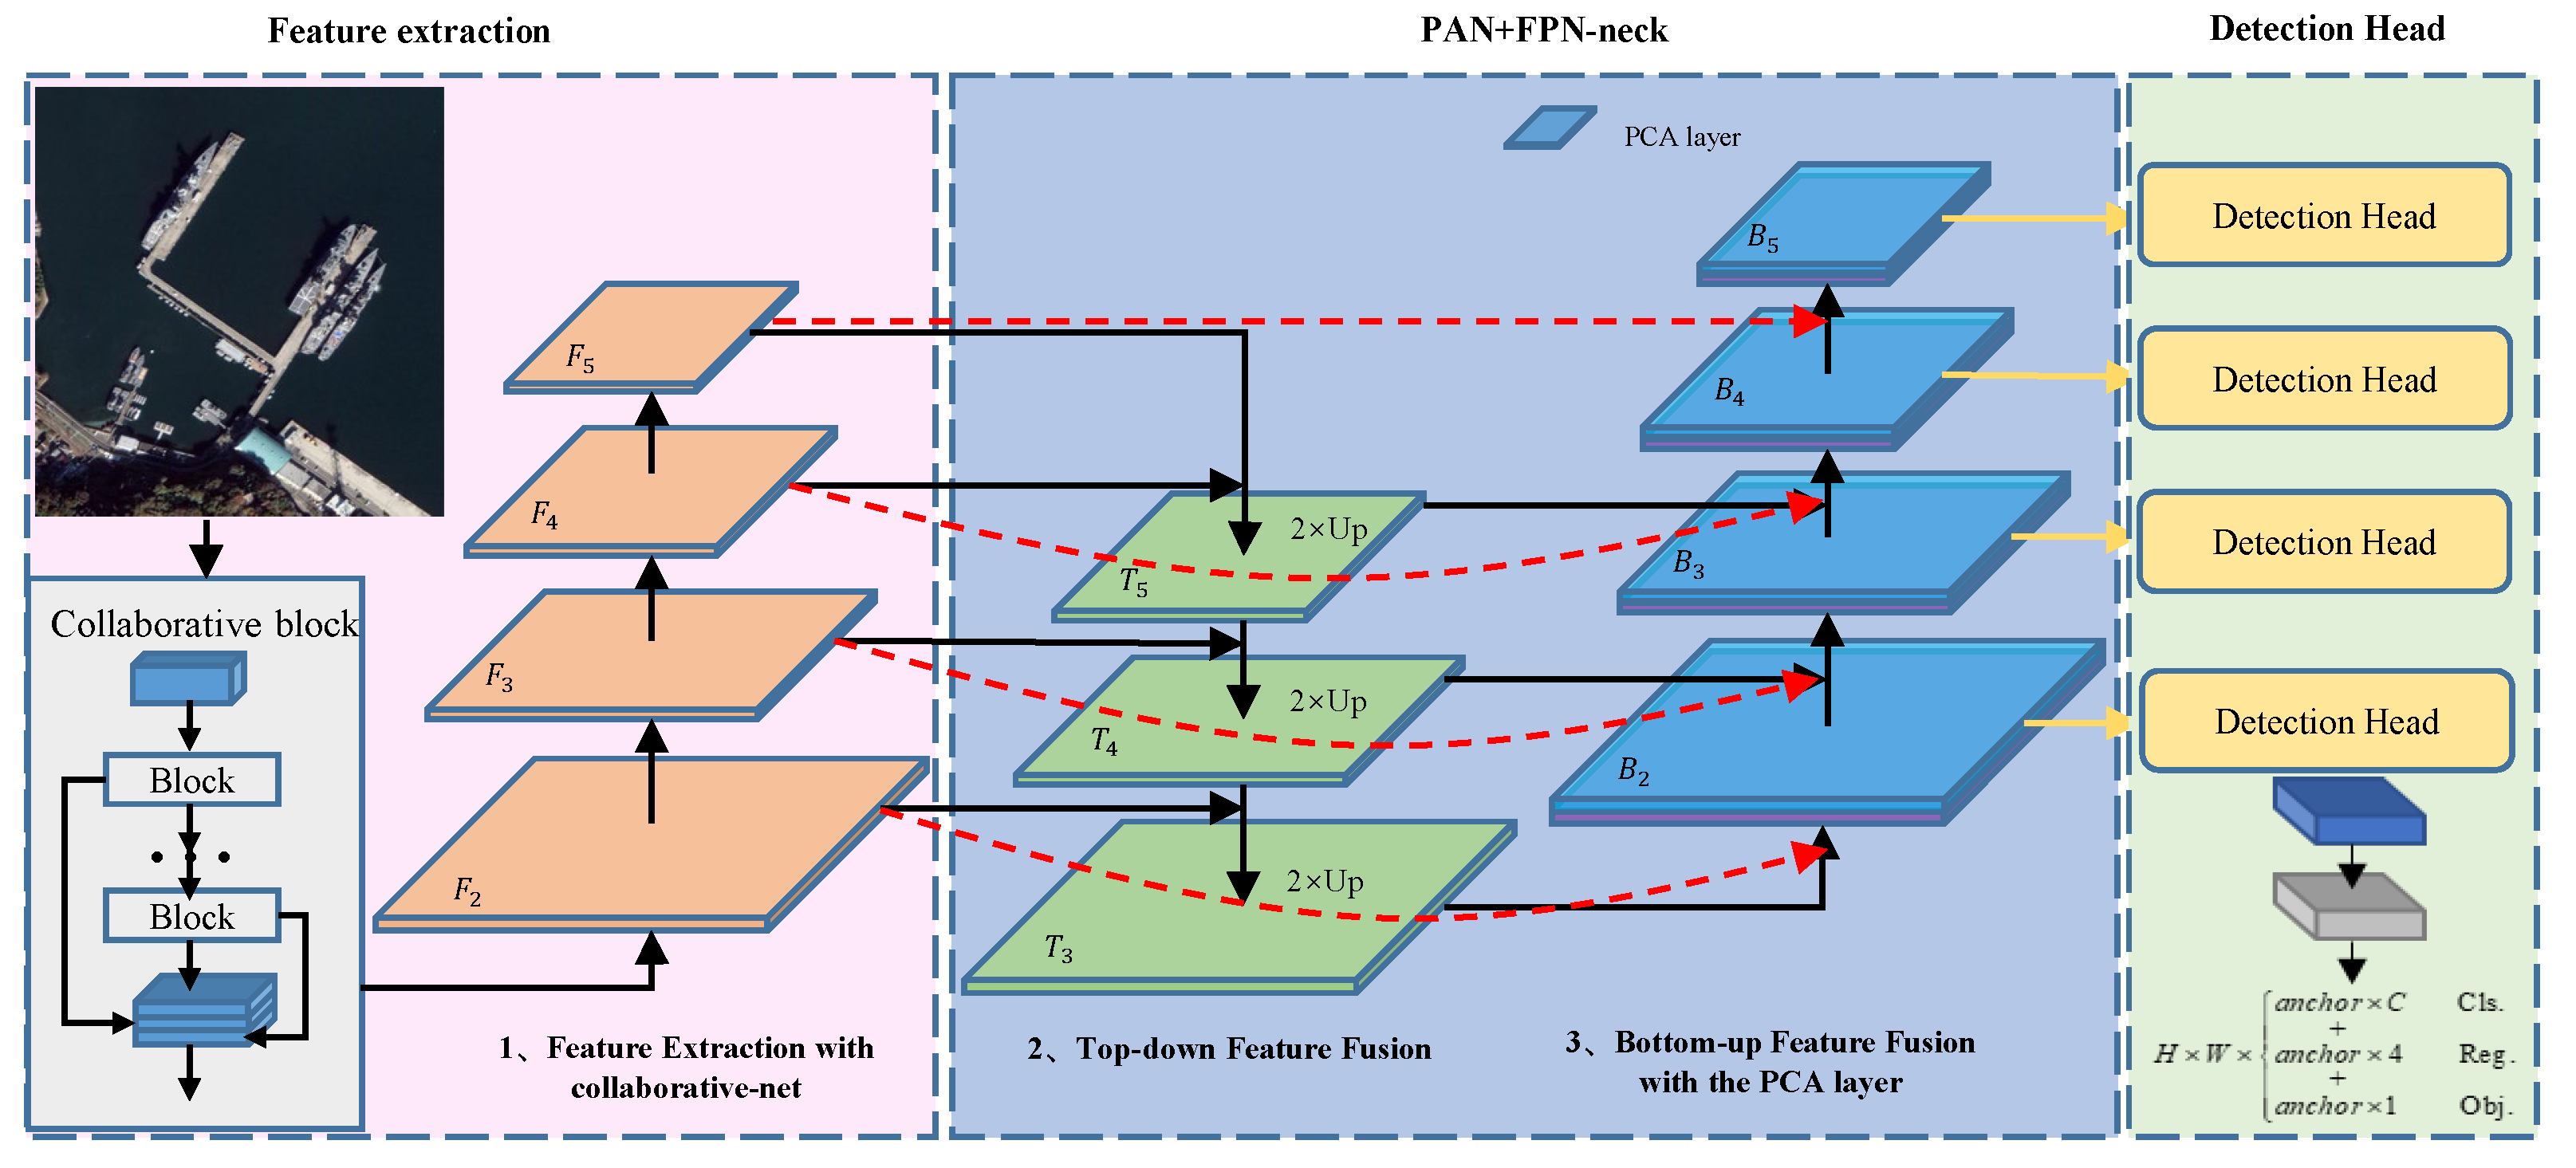
3.1. Network Architecture

As shown in Figure 1, the images entering the network are first preprocessed (including resizing and image sample augmentation). In the feature extraction part, a collaborative structure is constructed to extract the shallow features of deteriorated images, specifically using a multi-hop cascade structure. The output feature maps of each hop are concatenated while following the spatial pyramid pooling framework (SPPF) to further extract the feature information of the images. The PAN + FPN-Neck part introduces the PCA attention mechanism to emphasize the features of each pixel point, suppress irrelevant features, and guide the feature map update. The PAN + FPN structure combines the advantages of two feature pyramid methods, and constructs a feature pyramid suitable for different scales of target detection by cascading the multiscale feature maps. It effectively fuses shallow semantic information with deep semantic information through an efficient feature transfer mechanism, overcoming the problems of an insufficient low-level feature extraction capability and use of high-level semantic information in traditional target detection algorithms. In addition, the PAN + FPN structure has high computational efficiency and low memory occupation while ensuring target detection accuracy, which is appropriate for use in scenarios with limited computational and storage resources. Four detection heads are introduced in the head part to better handle targets of different sizes and aspect ratios and to generate more accurate target bounding boxes and classification results. The four heads process feature maps of different scales separately, which can capture more detailed information of the target while maintaining high resolution. In addition, they use different perceptual fields and scales on different levels of feature maps to improve the model’s ability to perceive the target. Finally, three loss functions are used to calculate the classification, localization, and confidence loss and to boost the accuracy of network prediction by non-maximum suppression.

3.2. Collaborative Block

For severe weather conditions such as foggy days, more attention should be paid to the information of each pixel point in the image. Most of the classical target detection backbone decreases the image resolution after each convolutional layer, which is unfavorable for extracting the features of the degraded images. To solve this problem, in this section, the use of the multi-hop cascade structure of a collaborative block is proposed to ensure the recovery and extraction of shallow features of degraded images, as shown in Figure 2.
The collaborative block part first undergoes a spatial and channel reconstruction convolution (SCConv) to extract shallow features. The SCConv differs from traditional convolutions because there is a high level of redundancy in the parameters of the convolution kernel. We establish that the dimensions of the primary convolution kernel and the conventional convolution kernel are equivalent and have denoted them as d × d . Executing a sampling process on the primary convolution kernel generates [ d / 2 ] secondary convolution kernels, where [·] signifies the ceiling function, which is indicative of upward rounding. Consequently, the dimensions of the ith secondary convolution kernel can be represented as ( d 2 i + 2 ) × ( d 2 i + 2 ) , given that the spatial dimensions of the feature maps produced by the application of these secondary convolution kernels remain invariant compared with the resultants from the primary convolution kernel. Considering that the secondary convolution kernels encompass a reduced spatial extent relative to the primary convolution kernel, a decrease in computational demand is achieved.
Assume that the number of secondary convolutional kernels is s. For convolutional kernels f i ^ R d × d × c , the output is f ^ i R H × W × n . The total space complexity of traditional convolutional kernels is O ( d 2 c n ) , and the computational complexity is O ( i = 1 s d 2 c H W n ) . The space complexity of SCConv convolution is O ( d 2 c n / s ) , and the computational complexity is O ( i = 1 s ( d 2 i + 2 ) 2 c H W n / s ) . In addition, the idea of convolution kernel reuse is followed in the channel to generate multiple second-level convolution kernels based on the channel. The SCConv convolution kernel can be expressed as
f s c c o n v = [ f 1 , f 2 , , f n ] . s . t . i , f ^ i R d × d × c , n = c c ^ g + 1
where g is the step size on the channel, f i is the convolution kernel of the i sliding window, ĉ is the number of channels in the secondary convolution kernel set, and c ^ is the number of channels. One convolution kernel is used n times simultaneously to generate the feature map several times. The features were further extracted using three blocks. Suppose that the input feature map is I R W × H × 3 , which is convolved to obtain the feature map p 0 :
p 0 = f s c c o n v I = [ f 1 I , f 2 I , , f n I ]
of which, p 0 R W × H × C . To distinguish the inputs, W and H are the spatial dimensions of the generated feature maps. The block design follows the SCConv, followed by a ReLU layer to prevent gradient diffusion. A cascade of two attention modules follows combined with a residual connection to obtain the final refined feature map to prevent gradient disappearance. The block structure can be expressed as
F b l o c k = f b l o c k ( I ) = f P C A ( f s c c o n v δ ( f s c c o n v I ) I ) I
where δ is the ReLU activation function, ⊗ denotes convolution, and ⊕ denotes element-by-element summation. Each subsequent block layer in the model takes the output of the previous block as its input:
p i = f b l o c k ( p i 1 ) i = 1 , 2 , 3 .
The stacking of multiple blocks and final combination of the output feature maps of multiple blocks allow the features to be conveyed at different levels:
A n e t ( I ) = δ ( C B L ( f s c c o n v I ) C B L ( C B L ( f P C A ( c o n c a t ( p 1 , p 2 , p 3 ) ) ) ) )

3.3. Channel Attention and Pixel Attention
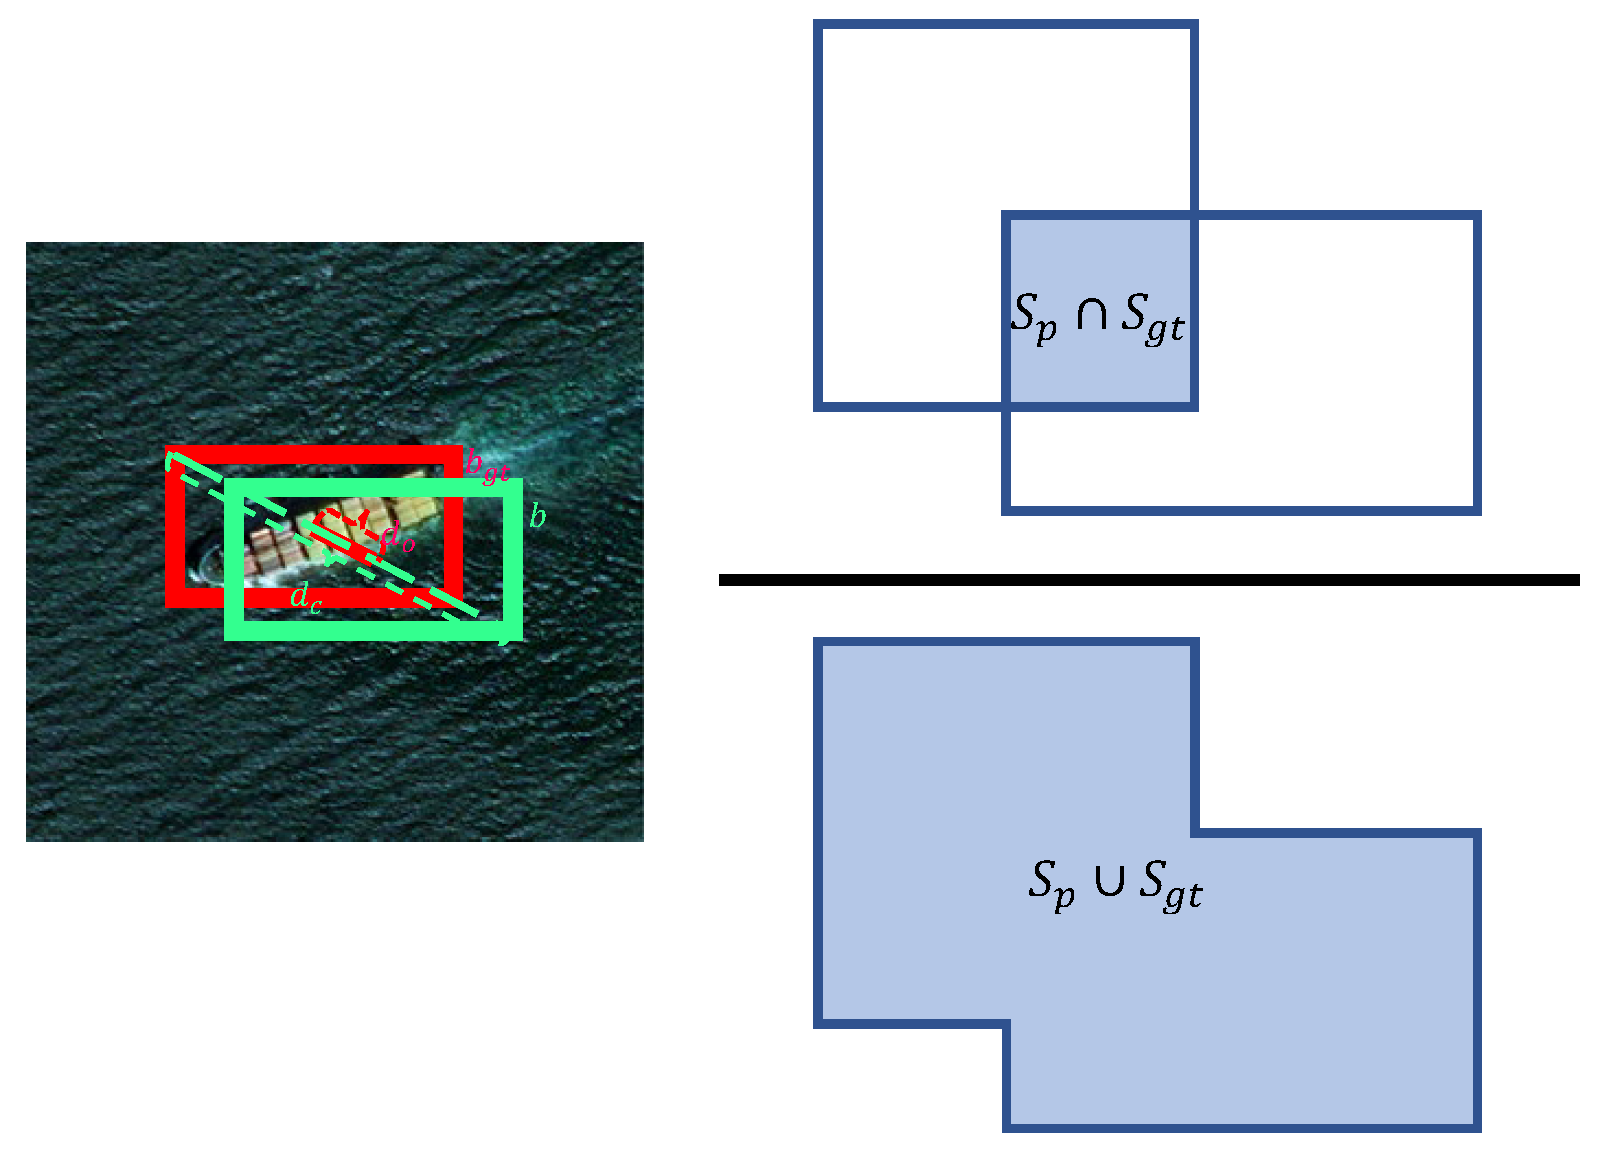
The channel attention layer can make full use of the relationship between the remote sensing image channels, and the pixel attention layer can focus on the features of each pixel point, which is more flexible in an actual scene where the fog concentration is not uniform. Figure 3 shows the whole structure. Suppose that the input feature map is F c :
F C A ν g = H p ( F c ) = 1 H × W i = 1 H j = 1 W X c ( i , j )
where X c ( i , j ) is the value of a channel in ( i , j ) , and H p is the global pooling function.
F C 2 = σ C o n v δ C o n v ( F C A v g )
F p 1 = F C 2 × F c
where F p 1 denotes the output of the channel attention layer, F C 2 denotes the output of the global pooling function, C o n v denotes the 1×1 convolution, and pixel attention can be expressed as
F P 3 = σ C o n v δ C o n v ( F P 1 )
F = F p 1 × F p 3
where F is the output of the channel and pixel attention layer.

3.4. Loss Function

The loss function design in target detection is guided by three fundamental aspects: object localization, confidence estimation, and class classification. The loss function of our model consists of three main components: target localization loss, target confidence loss, and target classification loss. Target localization loss focuses on refining a model’s ability to predict the precise locations and dimensions of objects’ bounding boxes. Minimizing the disparity between predicted and ground truth boxes enhances the model’s accuracy in localizing objects within images, and the target localization loss is represented by the complete IOU (CIOU) loss as follows:
L c i o u ( b , b g t ) = 1 C I O U = 1 I O U d o 2 d c 2 v 2 1 I O U + v
where b and b g t are the prediction and true boxes, respectively; d o 2 / d c 2 is the ratio of the square of the Euclidean distance between the center points of the two frames to the square of the diagonal distance between the minimum closed areas of the two frames (see Figure 4); IOU represents the overlap ratio between predicted and real boxes; and v is the normalized difference between the predicted and actual frame aspect ratios:
I O U = S p S g t S p S g t
v = 4 π 2 ( a r c t a n w g t h g t a r c t a n w h ) 2
The target confidence loss is aimed at refining the model’s capability to discern the presence or absence of objects and facilitates the learning of the discrimination between background and foreground regions as well as the distinction between non-object areas and regions containing objects. This distinction helps mitigate false positives (erroneously identifying the background as an object) and false negatives (failures to detect actual objects), thereby enhancing detection accuracy. L o b j is expressed as a binary cross-entropy loss:
L o b j ( p 0 , p i o u ) = [ p i o u · l o g p 0 + ( 1 p i o u ) · l o g ( 1 p 0 ) ]
where P 0 is the prediction frame confidence score, and P i o u is the CIOU value of the predicted frame and corresponding target frame. The target classification loss is tasked with refining the model’s predictions for object categories. Following the determination of object presence, the classification loss aids in accurately identifying the categories to which these objects belong. Bolstering the model’s performance in classifying objects accurately ensures that detected objects are not only localized but also correctly categorized. L c l s is expressed as a cross-entropy loss:
L c l s ( p i , p ^ i ) = [ p i · l o g p ^ i + ( 1 p i ) · l o g ( 1 p ^ i ) ]
where p i { 0 , 1 } is the true value of the ith category (=1 for belonging to the ith category and 0 for not), and p ^ i is the probability of the current category prediction. The total loss function can be formulated as follows:
L l o s s = α k ( α b o x L c i o u + α o b j L o b j + α c l s L c l s )
where α b o x , α o b j , and α c l s are used to balance the weights of each loss function. In our experiments, α b o x , α o b j , and α c l s are set to 0.05, 1.0, and 0.5, respectively, and α k is an optional parameter that is used to balance the weights of the feature map at each scale and is set to 1 by default.

4. Experimental Procedure

4.1. Datasets

A series of defogging algorithm datasets has emerged during the development of defogging algorithms, most of which are pairs of fogged and real images, considering the limited availability of datasets for advanced vision tasks like target detection. Owing to the scarcity of actual image samples in foggy conditions, there are only a small number of publicly available datasets for general scenarios, such as the Foggy Cityscapes [54], RTTS, and UFDD datasets [55], mainly for target detection tasks in scenarios such as urban public transportation and portraits. In special fields such as remote sensing, most researchers synthesize data manually based on the depth information of images and standard optical models.
ShipRSImageNet [56] provides an accurately labeled dataset in different scenarios. It is the largest ship-related dataset available and provides a more accurate classification compared with the FGSD and HRSC2016 datasets.
ShipRSImageNet contains more than 3435 images and 17,573 ship instances. The ship instances are divided into four levels, Level0, Level1, Level2, and Level3, and the higher the level, the higher the level of fine-grained classification. As shown in Table 1, the Level2 level with 25 classes for the simulation of image generation was chosen for this study along with the dataset for subsequent comparison and ablation experiments.
Because the size of the fog-conditioned ship dataset itself is relatively small and deep learning relies on ample training samples to achieve improved results, constructing the dataset needed for training is also a critical task. Most studies have used synthetic fog to construct fog datasets, and some researchers have used a method to synthesize fog images based on a standard optical model (center-point synthetic fog), which is applicable to a variety of atmospheric conditions and scene types. Regardless of whether the indoor or outdoor scenes are mountainous or urban, the standard optical model can effectively simulate the light propagation and scattering processes in the atmosphere and generate realistic fog effects. Center-point synthetic fog can simulate the fog concentration change according to the distance and depth of different areas in a scene based on optical physics, simulating the propagation and scattering process of light in the atmosphere. Therefore, the synthesized fog images in our study were closer to the real fog phenomenon and had a higher physical accuracy.
The most commonly used basic models for foggy images in computer vision and graphics are (from the perspective on energy decay)
I ( x ) = J ( x ) t ( x ) + A ( 1 t ( x ) )
t ( x ) = e β d ( x )
where I ( x ) is the haze image obtained from the detecting system, J ( x ) is the fog-free image to be recovered, A is the sky light, t ( x ) is the medium transmission, β is the atmospheric scattering coefficient, and d ( x ) is the depth of field. As shown in Figure 5, haze images were obtained by simulating A and t ( x ) . We chose 2198 images as the training set and 550 images as the validation set. In the training set, there were 700 thin-fog, 700 medium-fog, and 798 thick-fog images.

4.2. Evaluation Scheme

To perform a quantitative evaluation of our proposed model, we chose precision, recall, and AP as the evaluation metrics. If IOU > threshold, the prediction frame was considered TT, otherwise, it was considered TF. If no prediction box covered the target region, it was considered as FF. Otherwise, the region was FT.
p r e c i s i o n = T T T T + T F
r e c a l l = T T T T + F F
Precision measures the probability of correctly detecting the target, while recall quantifies the probability of correctly identifying positive samples. The AP metric, on the other hand, weighs between precision and recall and expresses the average precision value for each object class as the recall varies from 0 to 1. The setting of the aforementioned thresholds is a subjective decision. By adjusting different thresholds, the corresponding precision and recall values can be obtained. Then, the precision–recall curve can be constructed based on these values:
A P = 0 1 p r e c i s i o n ( r e c a l l ) d ( r e c a l l )
m A P = A P N
where AP is the integral of the precision–recall curve, precision(recall) represents the precision–recall curve, N is the total number of categories, and A P is the sum of the AP.

5. Results

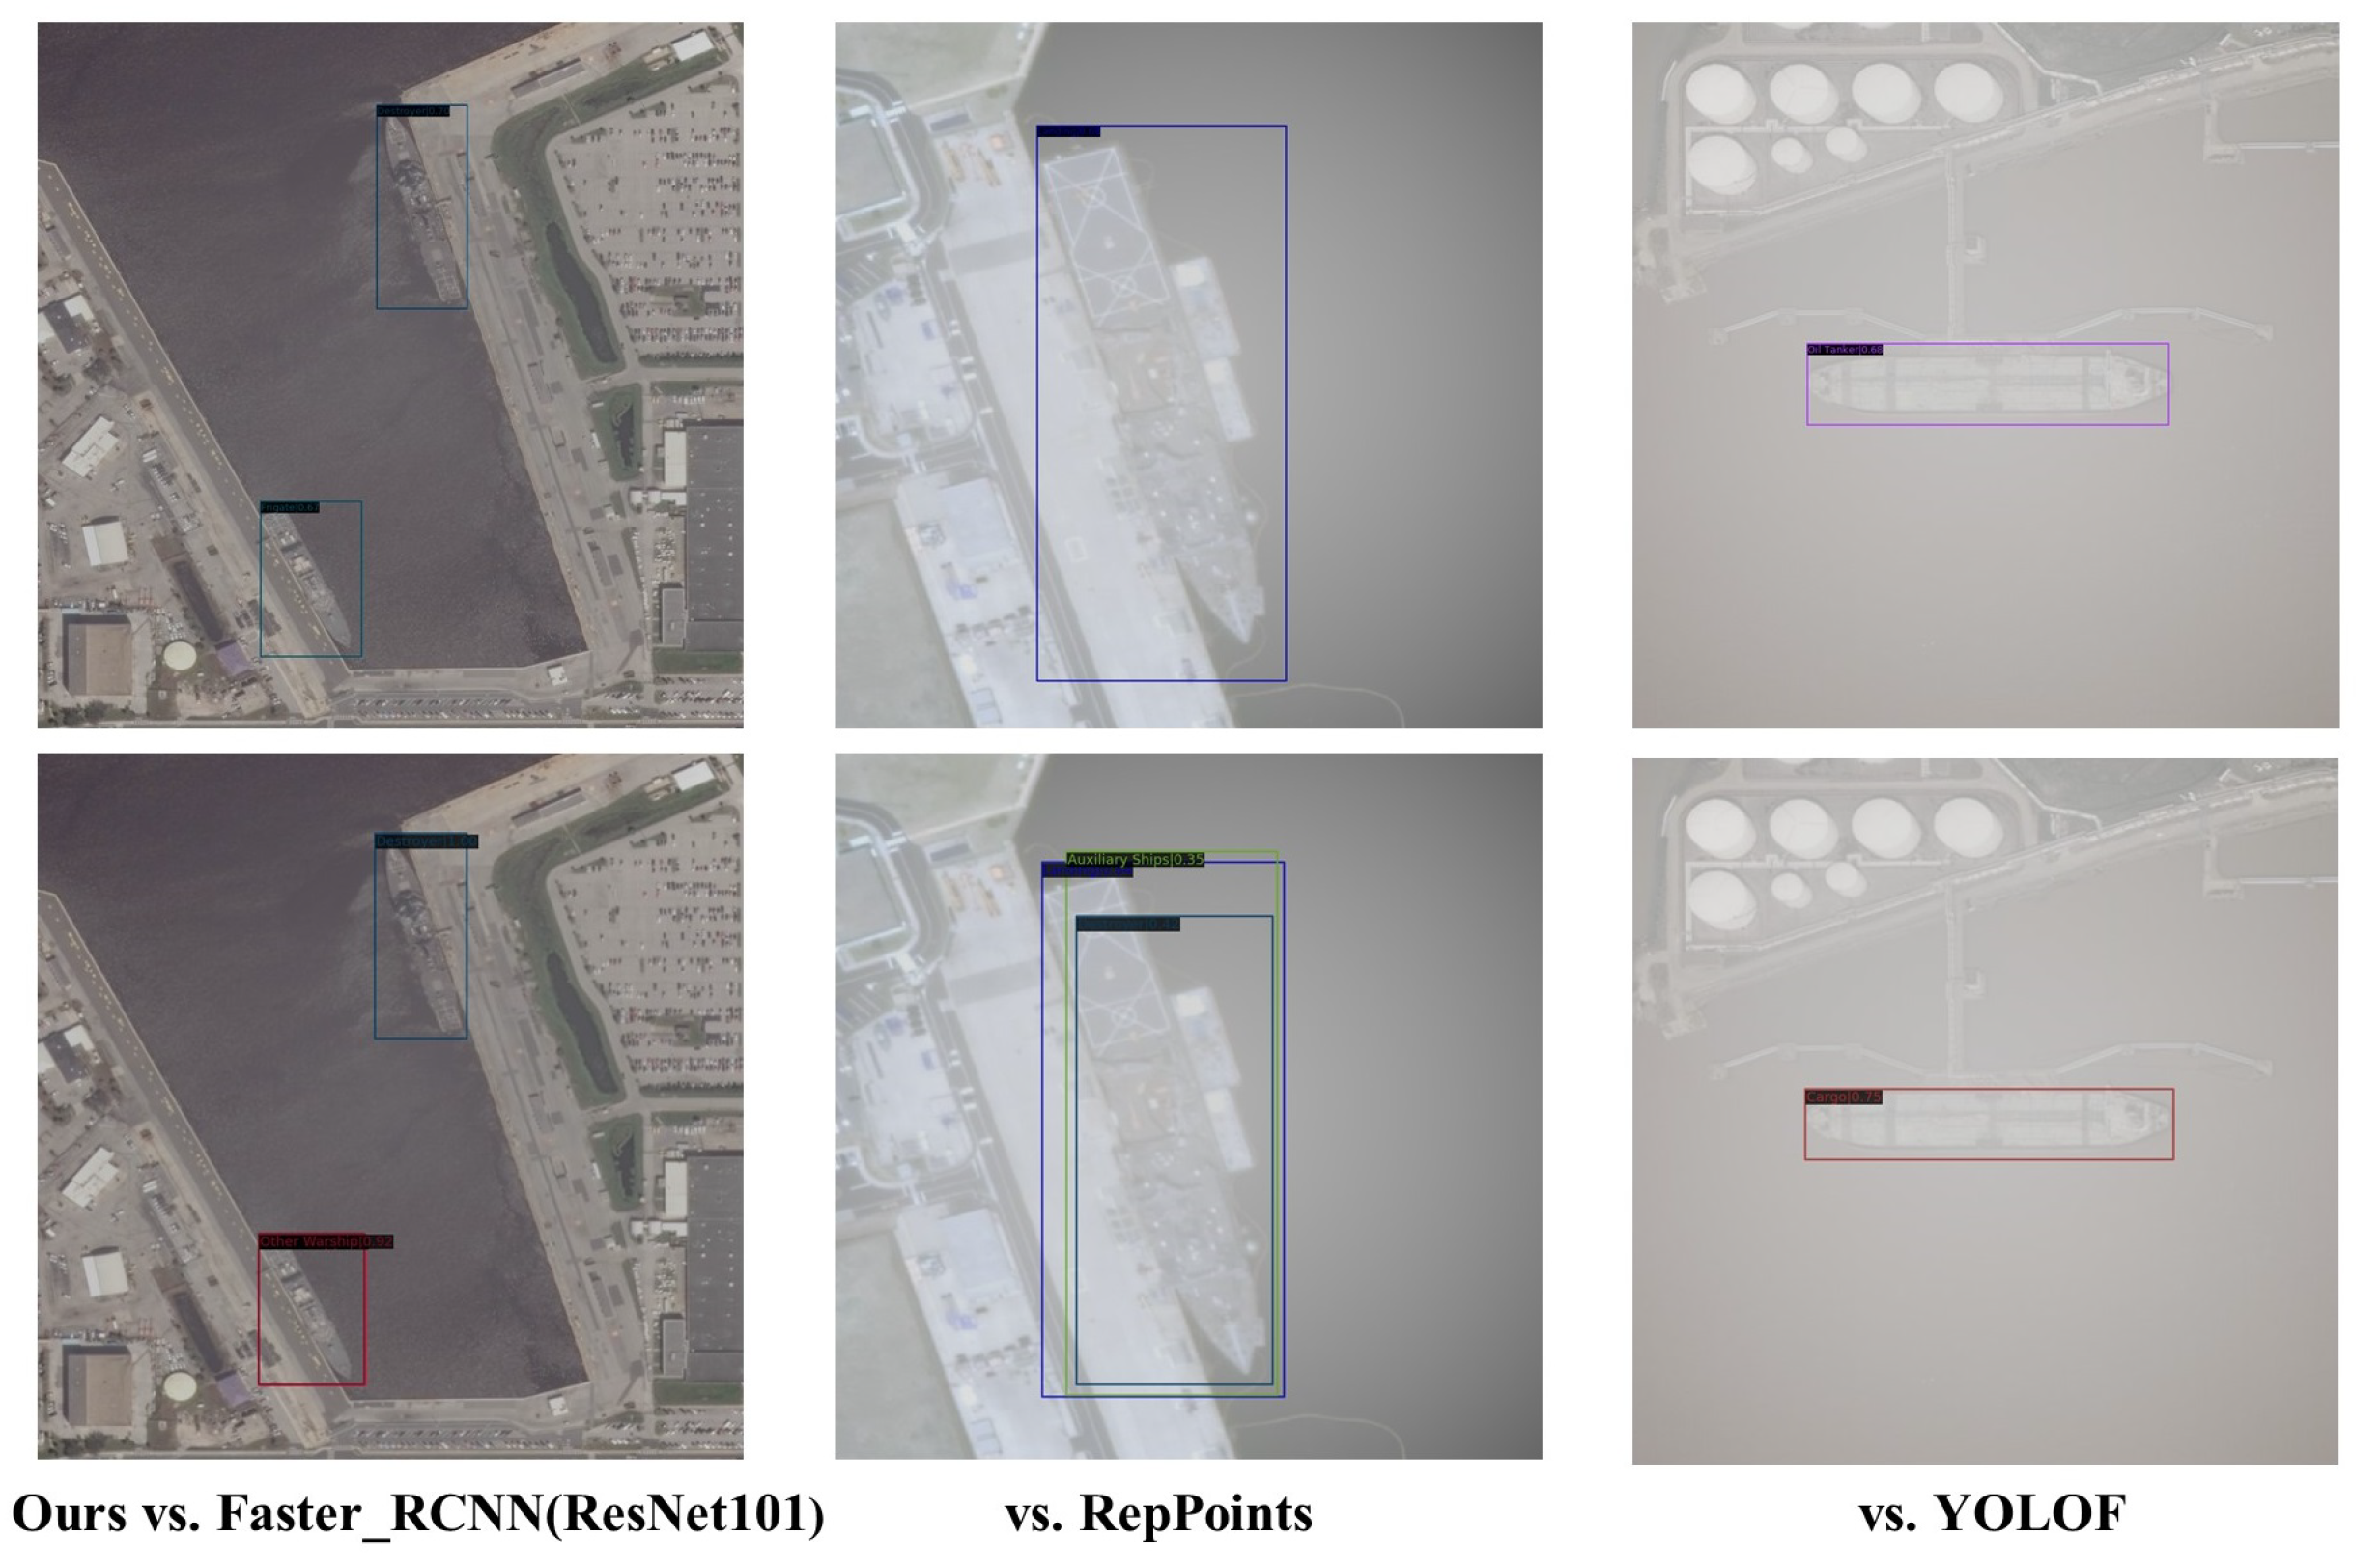
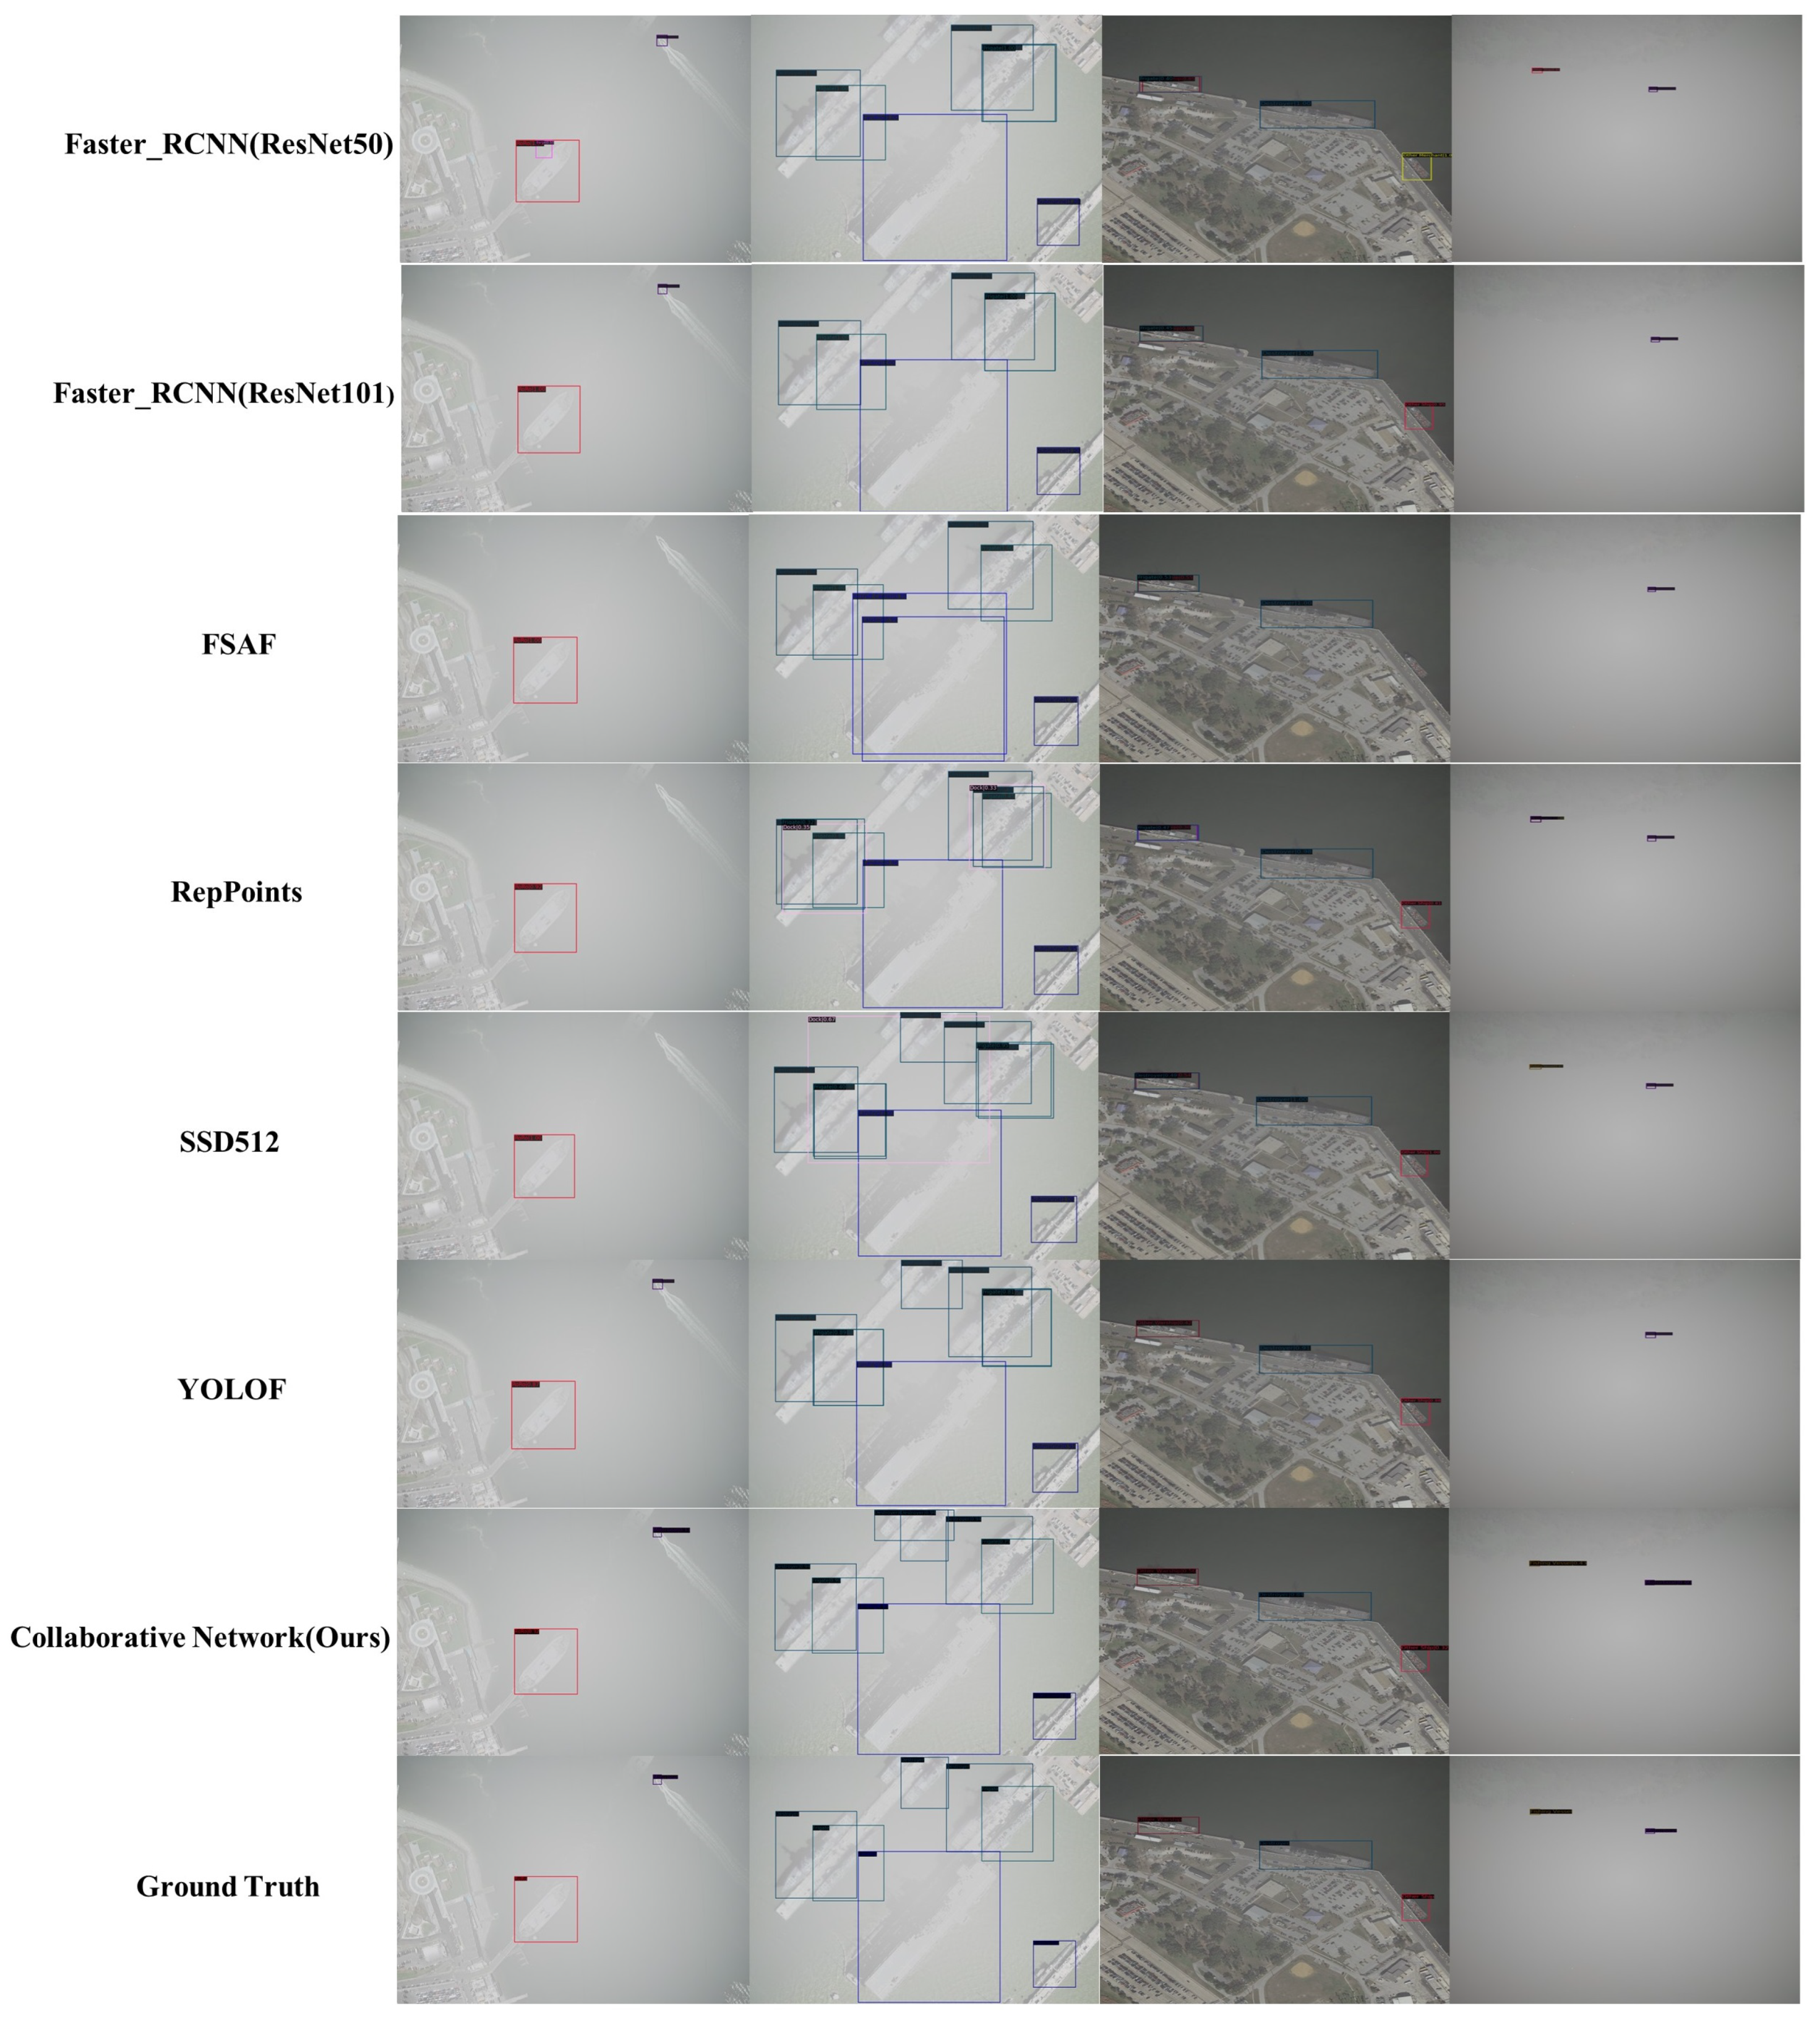
5.1. Comparative Experiment

To assess the generalization capabilities of the proposed model, an in-depth investigation of the dataset was conducted. In this analysis, the proposed model was compared with several baseline detectors, namely Faster R-CNN, SSD, FSAF [57], RepPoints [58], YOLOF [59], YOLOv5s, YOLOv6s [60], and YOLOv8n. All the experiments were conducted under identical training settings to ensure a fair and unbiased comparison. The training curve of our method is shown in Figure 6. Regarding the hyperparameters, the learning rate was configured to 0.1, the batch size was set to 10, and the training epochs were set to 800. Notably, these configurations were employed without utilizing a pre-trained model, necessitating the commencement of training from scratch.
The results of these comparative experiments are summarized in Table 2. The findings highlight the efficacy of the proposed model in tackling the challenges posed by foggy conditions and underscore its superior performance compared with benchmarked methods.
In order to further validate and analyze the superiority of the performance of our proposed model under different fog density levels, we recreated three datasets of thin, medium, and thick fogs, in which the validation set was different from the mixed dataset previously used in Table 2 but was uniformly thin, medium, or thick (denoted as thin, medium, and thick in Table 3), and the performance of the model was validated in each of the three datasets. The performance of the model was verified and a comparison test was conducted, and the results are shown in Table 3.
To demonstrate the impact of the performance of the proposed model visually, a comparative analysis of the detection results for different fog concentration scenarios is presented, as illustrated in Figure 7. The figure shows the effectiveness of different methods in addressing fog-induced challenges, allowing for a comprehensive evaluation of the performance of the proposed model compared with other state-of-the-art detectors.
The results of the proposed method under thin-, medium-, and thick-fog conditions, respectively, are shown in Figure 8. In addition to this, a number of additional image comparisons have been added to Figure A1 and Figure A2 in Appendix A to help promote clearer qualitative assessments that complement the quantitative performance indicators.

5.2. Ablation Experiment

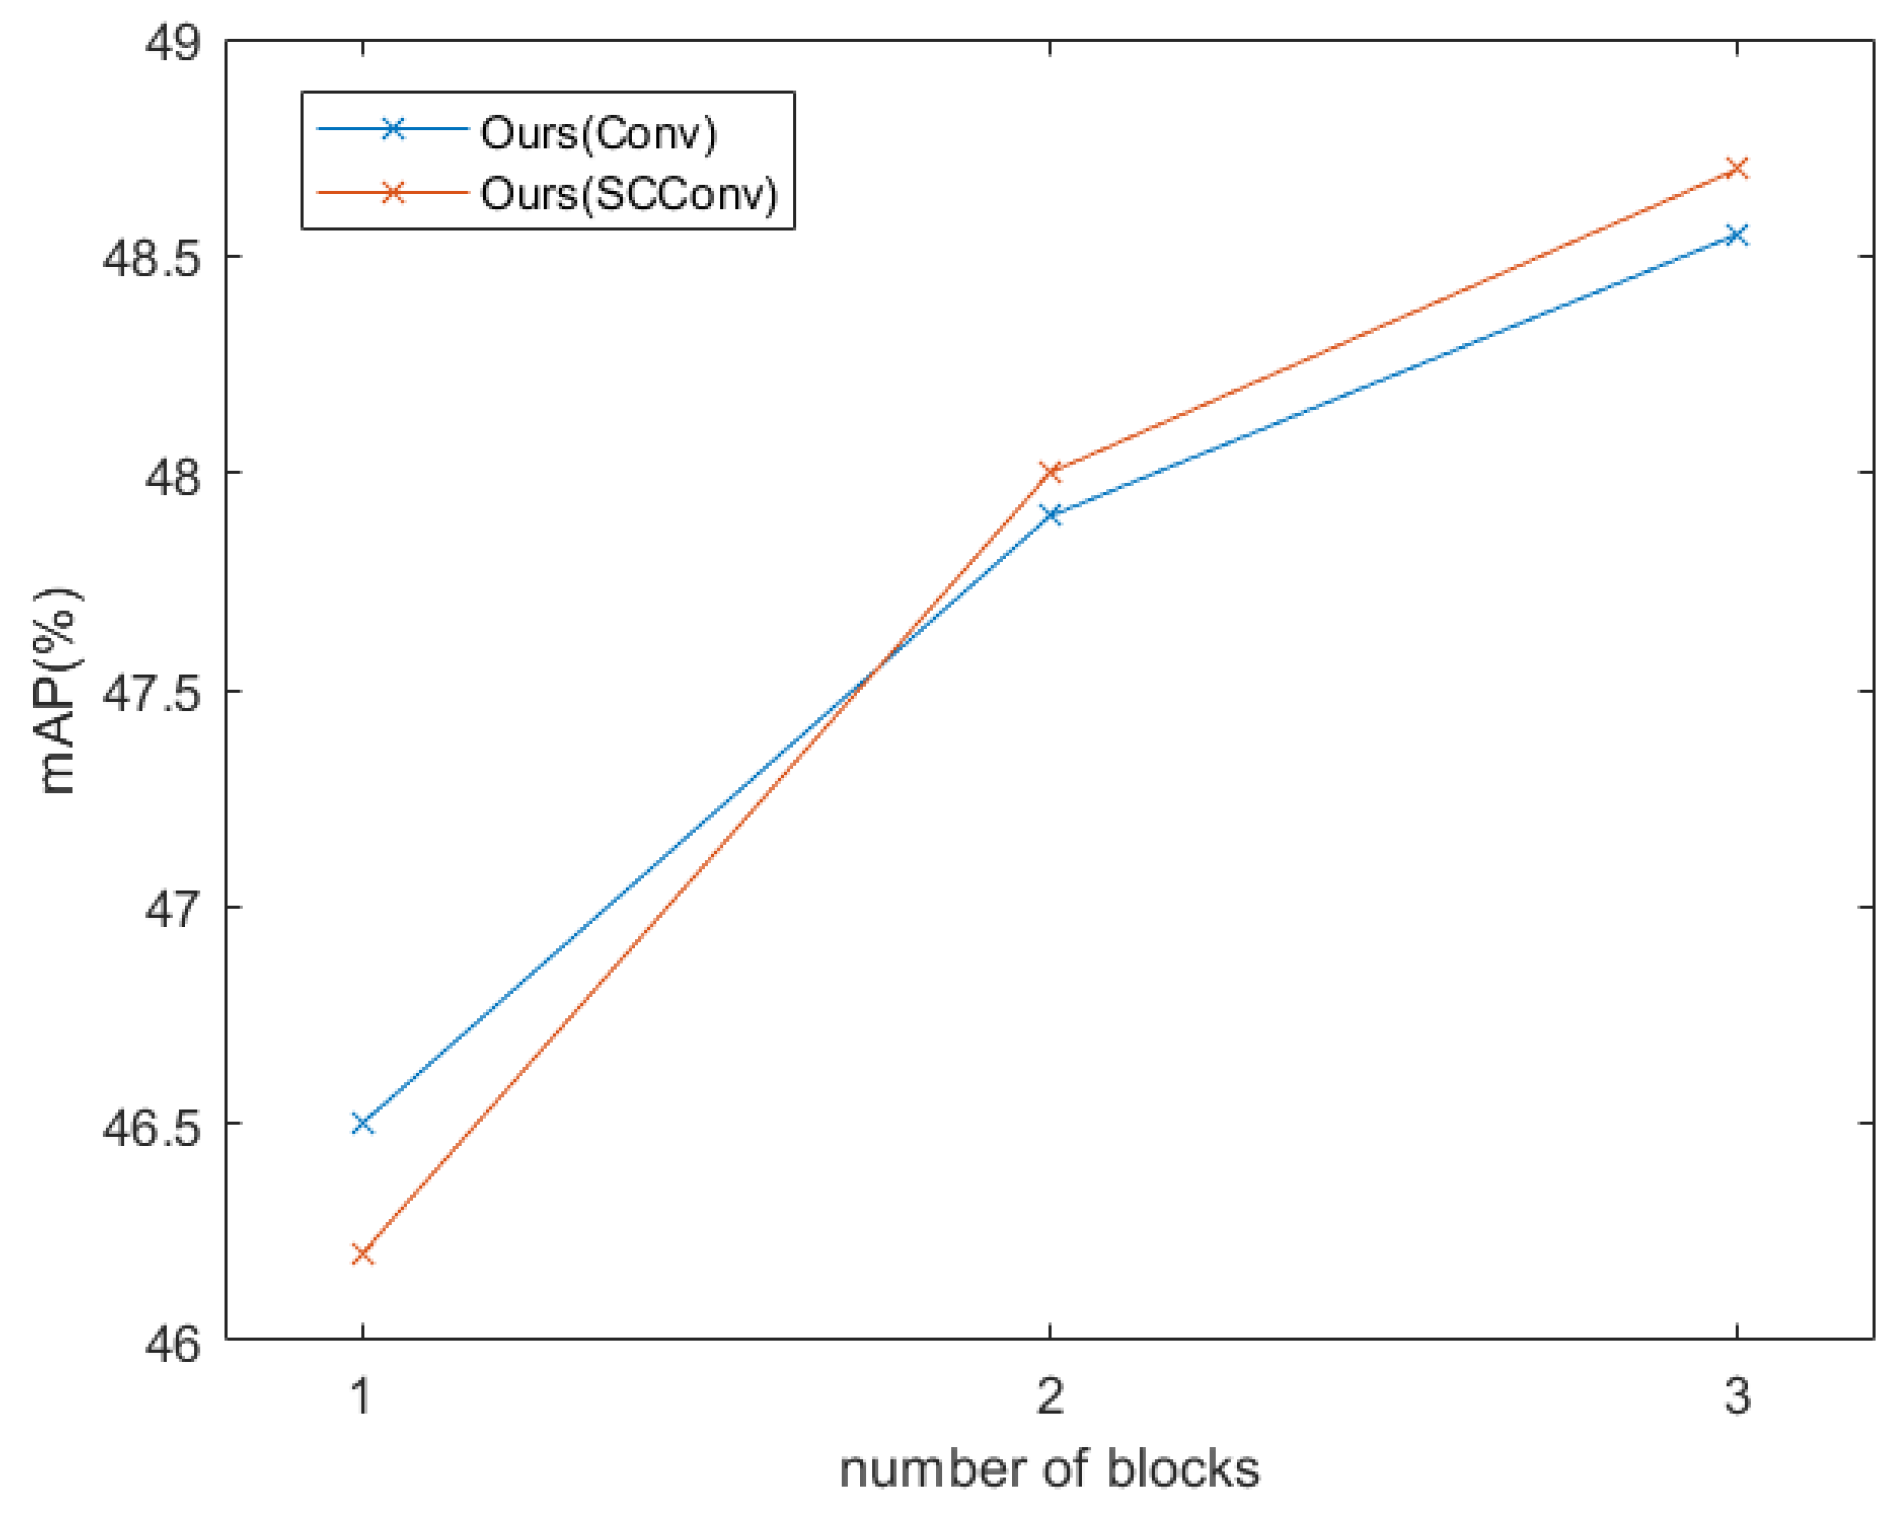
5.2.1. Collaborative Block Component Design

An ablation study was performed to investigate the optimal performance of the model with stacked blocks and the role of SCConv within these blocks (see Figure 9). The experimental results (Table 4) show that the relative improvement reaches 1.25% when the number of modules is increased from two to three. By analyzing the results, it is concluded that an increase in this module can have a positive impact on model performance. In addition, the computation and performance of the entire model in this module is compared with those of the ordinary convolutional kernel and SCConv, where the GFLOPs are the computations when the model is trained with the same input size. Experiments show that the proposed model design can achieve the same performance as a normal convolutional block with reduced computation.

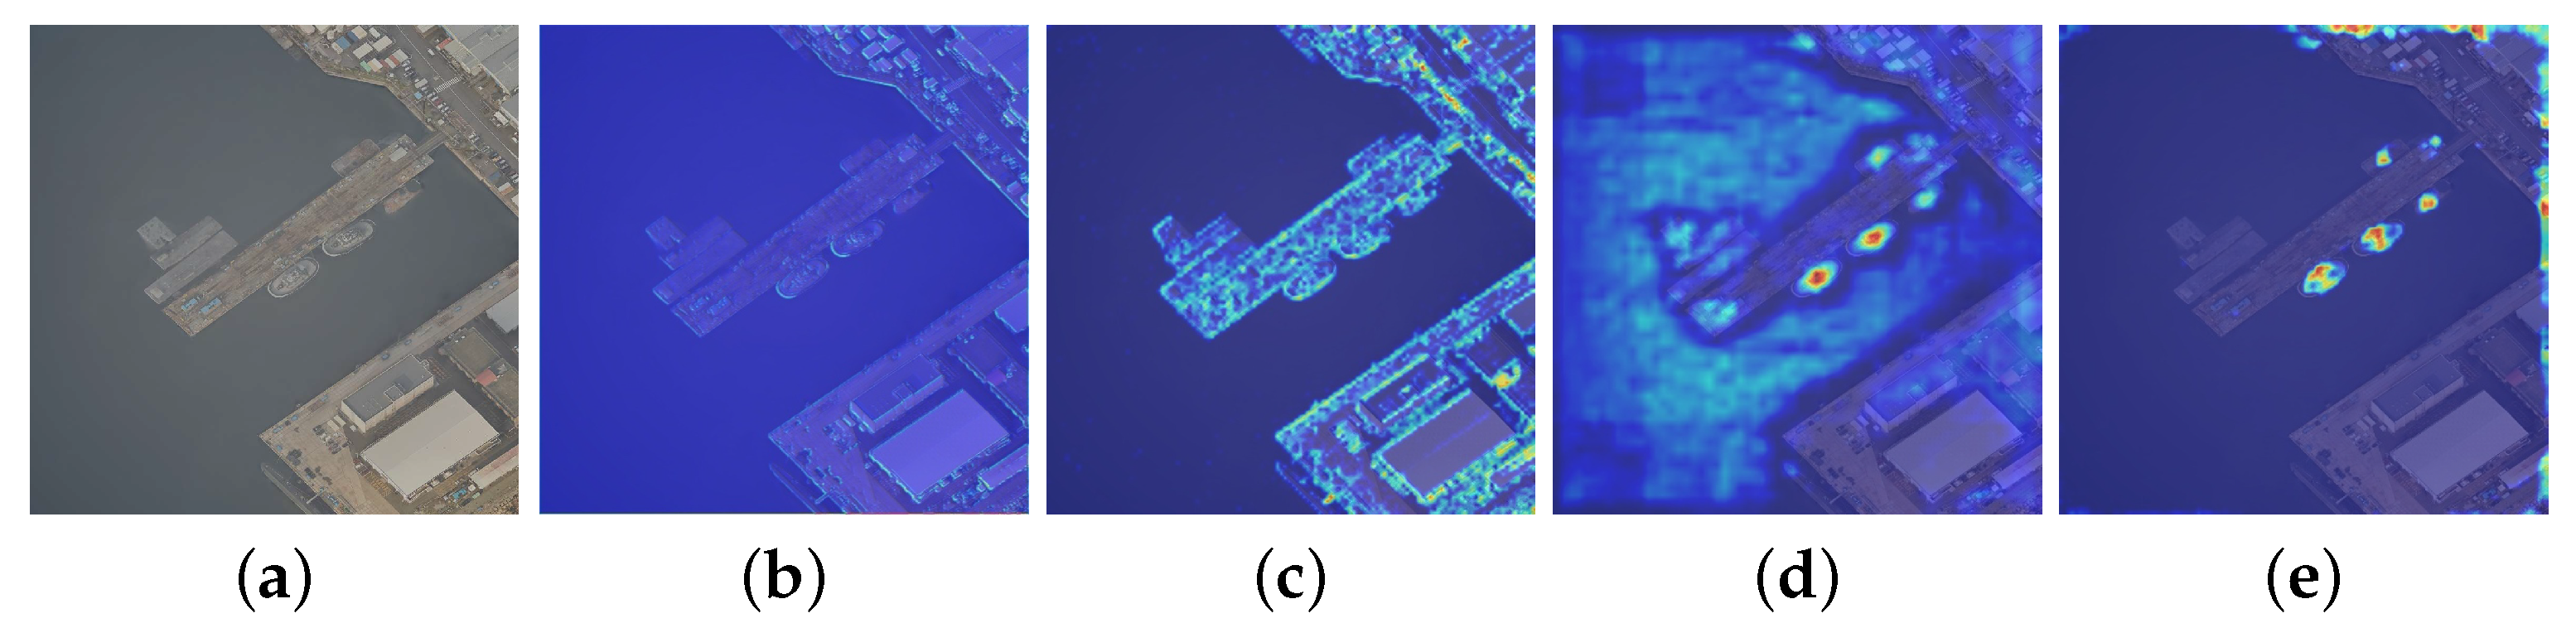
5.2.2. Attention Modules

The PCA module was compared with other attention modules with similar functions such as SE, CBAM, and ECA (Table 5). This improvement is attributed to the fact that the pixel attention mechanism of PCA for images can consider the relationship between pixels and surrounding pixels, and can better find features that require more attention in a complex context.
As can be seen from the results, for the ship detection assignment, the traditional YOLOv5s method performs relatively badly, with an mAP of 46.7%. On this basis, methods that introduce attention mechanisms, such as YOLOv5s + SE, YOLOv5s + ECA, and YOLOv5s + CBAM, improve the performance to some extent. Compared with YOLOv5s, the precision and mAP of the YOLOv5s + PCA method improve by 7.8% and 4.4%, respectively. The proposed model enhances the extraction and strengthening of local features, which can better distinguish the target from the background and improve the detection accuracy and stability.

5.2.3. Overlay of Global Effect

To verify the effectiveness of the overall design of the proposed model, the experiment based on three integral designs of the collaborative block, PCA module, and 4-heads, was ablated using the YOLOv5s model as the baseline and the other hyperparameters were kept consistent in the experiment.
The results (Table 6) show that performance metrics improve with the addition of the module. YOLOv5s + collaborative block shows decreases in precision and mAP of 4% and 1.4%, respectively, compared to YOLOv5s (baseline). This may be due to the additional parameters and calculations introduced by the addition of the module, resulting in an increase in overfitting of the network and thus a decrease in detection performance. The method of adding four attention modules (YOLOv5s + four attention modules) shows an improvement, with recall and mAP increasing by 2.3% and 0.8%. Adding four detection heads (YOLOv5s + four detection heads) results in improvements in precision and mAP, with increases of 3% and 0.5%, respectively. Adding all of these blocks (YOLOv5s + collaborative block + four attention modules + four detection heads) results in significant improvements in precision and mAP, with increases of 5.3% and 2%, respectively.
Overall, these results indicate that the performance of YOLOv5s can be improved by incrementally adding modules to ship inspection tasks. In particular, the overall performance of the model improves significantly after the addition of all of the above modules.
To visually evaluate the performance of the added module, we show a feature visualization graph in Figure 10. Notably, for the ship object in the image, we observe that the addition of the collaborative block and the attention block activates the ship region using brighter colors, suggesting that the addition of the collaborative block and the attention block makes the feature more discriminative. This intuitive evidence suggests that our saliency-aware features are more discriminative.

6. Discussion

As shown in Table 2, the proposed algorithm demonstrated significant improvements when compared to YOLOv5s and RepPoints, achieving a 2% higher mAP than YOLOv5s (46.7%) and a 2.5% higher mAP than the 46.2% achieved by RepPoints. Additionally, the proposed algorithm exhibited remarkable improvements in mAP compared to the YOLOF and SSD512, with increases of 3.9% and 6.6%, respectively. These improvements underscore the efficacy of the proposed algorithm in target detection tasks, particularly in achieving higher levels of accuracy than the aforementioned algorithms.
In terms of processing speed, the proposed algorithm achieved an FPS of 33.3; although slightly inferior to SSD512 in terms of speed, it was able to satisfy real-time image or video stream processing, and promptly generated target detection results.
The results in Table 3 show that with the increase in haze thickness, the mAP of all detection methods shows a decreasing trend, which is in line with the objective cognitive law. Additionally, the performance of different detection methods in a haze environment varies significantly, among which YOLOv6s performs the most poorly under the thick haze condition, with an mAP of only 24.5%, indicating that the robustness of its detection is poorer under foggy conditions. Moreover, the proposed collaborative network performs optimally in all fog conditions, with mAP reaching 49.1% in thin-fog conditions, 47.4% in medium fog, and maintained at 41.3% in thick fog conditions. The overall performance is significantly better than the other methods, especially in thin- and medium-fog environments. In thick fog, the proposed model still outperforms the detection accuracy of other models under the same conditions.
By leveraging these rigorous evaluations and maintaining consistent experimental conditions, this study aims to verify the reliability of our proposed model and its usefulness in real-world scenarios.
In the first column of Figure 7, the fog concentration is categorized as moderate. Among the detection models examined, FSAF, RepPoints, and SSD failed to detect smaller motorboats. Faster R-CNN, however, exhibited false-positive detection. In contrast, both YOLOF and the proposed model demonstrated accurate performance in detecting the objects of interest. The second column in Figure 7 presents a scenario with a large number of targets. The Faster R-CNN, FSAF, and RepPoints models failed to detect the targets in the upper-left corner. In addition, both the SSD and YOLOF models exhibited false-positive results.
However, the proposed model successfully detected targets, including those that were not present in the dataset, particularly in the upper-left corner. These observations suggest that the detection performance of the proposed model remained robust, even in scenarios involving a larger number of targets. In the third column in Figure 7, where the fog concentration was relatively low, the distinction between “Other Warship” and “Other Ship” became more challenging for the detectors. Consequently, all models, except YOLOF and the proposed model, exhibited false-positive detections, particularly for the middle-left target. In the last column of the figure, a higher fog concentration is depicted along with smaller targets. Only the SSD and the proposed model demonstrated successful detection and differentiation of targets. In contrast, other models either produced false-positive detections or failed to detect the targets altogether.

7. Conclusions

In this study, we propose a novel multi-tiered collaborative network for fine-grained ship detection in foggy conditions using optical remote sensing imagery. The model integrates a collaborative block, a PCA attention mechanism, and multiple detection heads, which collectively enhance detection performance under low-visibility conditions. The significance of our approach lies in its ability to address the challenges of detecting ships in degraded visual environments, a critical issue in maritime applications such as monitoring, search and rescue, and port management. Results from ablation experiments demonstrate the effectiveness of each component. The three-collaborative-block design improves feature extraction from low-quality images, while the PCA attention mechanism further refines detection by focusing on key features. This leads to a 4.4% increase in mAP compared to other attention mechanisms. Additionally, incorporating four detection heads enhances model accuracy by 3%, leading to improved detection of small and obscured targets. Comparative analysis shows that the proposed model outperforms several baseline methods, achieving an mAP of 48.7% and maintaining a real-time detection speed of 33.3 FPS, making it suitable for practical applications. The model excels in foggy conditions, surpassing traditional models such as Faster R-CNN and SSD512, which exhibit reduced accuracy under similar circumstances.
However, our study has certain limitations. First, the model’s effectiveness is currently optimized for foggy conditions, and its performance in other adverse weather conditions, such as rain or snow, has yet to be explored in detail. Second, while the model maintains real-time detection speeds, the complexity of the architecture, including the use of multiple detection heads and collaborative blocks, may pose challenges for deployment in resource-constrained environments, such as on-board satellite systems or drones. Future work will focus on extending the model to handle other challenging environmental conditions and optimizing its architecture for better efficiency in low-resource settings.

Author Contributions

Conceptualization, W.Z. and L.L.; Data curation, W.Z., B.L., Y.C. and W.N.; Formal analysis, L.L., Y.C. and W.N.; Investigation, W.Z.; Methodology, W.Z., L.L. and B.L.; Project administration, L.L. and W.N.; Software, W.Z., W.N. and B.L.; Supervision, L.L. and W.N.; Validation, W.N. and Y.C.; Visualization, W.Z. and Y.C.; Writing—original draft, W.Z. and L.L.; Writing—review and editing, W.Z. and L.L. All authors have read and agreed to the published version of the manuscript.

Funding

This research received no external funding.

Data Availability Statement

The raw data supporting the conclusions of this article will be made available by the authors on request.

Conflicts of Interest

The authors declare no conflicts of interest. The founding sponsors had no role in the design of the study; in the collection, analyses, or interpretation of data; in the writing of the manuscript, and in the decision to publish the results.

Appendix A

We focus on comparing the performance of the YOLOv5s model, which demonstrates the best relative performance, with our proposed model. The results show that YOLOv5s is prone to misdetections and omissions as fog density increases. For instance, in the second column, water splashes are incorrectly identified as ships. In the fourth set of images, ships in the central area go undetected, while in the sixth set, the target on the right side is missed. Additionally, the first and fifth sets show detection failures, and although some objects are identified, the classification results are incorrect.
Figure A1. Comparison of detection results produced by the proposed collaborative network. The upper graph shows the predicted results of the model and the lower graph shows the detection results of YOLOV5s.
Remotesensing 16 03968 g0a1
In addition to this, we add proposed models with relatively better performance (Faster R-CNN (ResNet101) (mAP 45.3%), RepPoints (mAP 46.2%), and YOLOF (mAP 44.8%)), and it can be seen that the other model detections in foggy conditions may have some misdetections as well as repetitive frame-drawing behaviors.
Figure A2. Comparison of supplementary detection results for the proposed collaborative network. Upper figure shows the predicted results of the model and the following figure shows the detection results of some of the other models.
Remotesensing 16 03968 g0a2

References

  1. Zhao, Y.; Chen, D.; Gong, J. A Multi-Feature Fusion-Based Method for Crater Extraction of Airport Runways in Remote-Sensing Images. Remote Sens. 2024, 16, 573. [Google Scholar] [CrossRef]
  2. Zhang, N.; Wang, Y.; Zhao, F.; Wang, T.; Zhang, K.; Fan, H.; Zhou, D.; Zhang, L.; Yan, S.; Diao, X. Monitoring and Analysis of the Collapse at Xinjing Open-Pit Mine, Inner Mongolia, China, Using Multi-Source Remote Sensing. Remote Sens. 2024, 16, 993. [Google Scholar] [CrossRef]
  3. Zhou, Y.; Liu, H.; Ma, F.; Pan, Z.; Zhang, F. A sidelobe-aware small ship detection network for synthetic aperture radar imagery. IEEE Trans. Geosci. Remote. Sens. 2023, 61, 1–16. [Google Scholar] [CrossRef]
  4. Fuentes Reyes, M.; Auer, S.; Merkle, N.; Henry, C.; Schmitt, M. Sar-to-optical image translation based on conditional generative adversarial networks—Optimization, opportunities and limits. Remote Sens. 2019, 11, 2067. [Google Scholar] [CrossRef]
  5. Melillos, G.; Themistocleous, K.; Danezis, C.; Michaelides, S.; Hadjimitsis, D.G.; Jacobsen, S.; Tings, B. Detecting migrant vessels in the Cyprus region using Sentinel-1 SAR data. In Proceedings of the Counterterrorism, Crime Fighting, Forensics, and Surveillance Technologies IV, Online, 21–25 September 2020; SPIE: Philadelphia, PA, USA, 2020; Volume 11542, pp. 134–144. [Google Scholar]
  6. Bi, F.; Chen, J.; Zhuang, Y.; Bian, M.; Zhang, Q. A decision mixture model-based method for inshore ship detection using high-resolution remote sensing images. Sensors 2017, 17, 1470. [Google Scholar] [CrossRef] [PubMed]
  7. Chen, H.; Gao, T.; Chen, W.; Zhang, Y.; Zhao, J. Contour refinement and EG-GHT-based inshore ship detection in optical remote sensing image. IEEE Trans. Geosci. Remote. Sens. 2019, 57, 8458–8478. [Google Scholar] [CrossRef]
  8. Zhu, Z.; Luo, Y.; Qi, G.; Meng, J.; Li, Y.; Mazur, N. Remote sensing image defogging networks based on dual self-attention boost residual octave convolution. Remote Sens. 2021, 13, 3104. [Google Scholar] [CrossRef]
  9. Wang, Y.; Dou, Y.; Guo, J.; Yang, Z.; Yang, B.; Sun, Y.; Liu, W. Feasibility Study for an Ice-Based Image Monitoring System for Polar Regions Using Improved Visual Enhancement Algorithms. IEEE J. Sel. Top. Appl. Earth Obs. Remote Sens. 2022, 15, 3788–3799. [Google Scholar] [CrossRef]
  10. Zou, Z.; Shi, Z. Ship detection in spaceborne optical image with SVD networks. IEEE Trans. Geosci. Remote. Sens. 2016, 54, 5832–5845. [Google Scholar] [CrossRef]
  11. Dong, Y.; Chen, F.; Han, S.; Liu, H. Ship object detection of remote sensing image based on visual attention. Remote Sens. 2021, 13, 3192. [Google Scholar] [CrossRef]
  12. Tang, J.; Deng, C.; Huang, G.B.; Zhao, B. Compressed-domain ship detection on spaceborne optical image using deep neural network and extreme learning machine. IEEE Trans. Geosci. Remote. Sens. 2014, 53, 1174–1185. [Google Scholar] [CrossRef]
  13. Zhang, Z.; Wang, C.; Song, J.; Xu, Y. Object tracking based on satellite videos: A literature review. Remote Sens. 2022, 14, 3674. [Google Scholar] [CrossRef]
  14. Yang, J.; Ma, Y.; Hu, Y.; Jiang, Z.; Zhang, J.; Wan, J.; Li, Z. Decision fusion of deep learning and shallow learning for marine oil spill detection. Remote Sens. 2022, 14, 666. [Google Scholar] [CrossRef]
  15. Sindagi, V.A.; Oza, P.; Yasarla, R.; Patel, V.M. Prior-based domain adaptive object detection for hazy and rainy conditions. In Proceedings of the Computer Vision–ECCV 2020: 16th European Conference, Glasgow, UK, 23–28 August 2020; Proceedings, Part XIV 16. Springer: Berlin/Heidelberg, Germany, 2020; pp. 763–780. [Google Scholar]
  16. Vaněk, J.; Machlica, L.; Psutka, J. Estimation of single-Gaussian and Gaussian mixture models for pattern recognition. In Proceedings of the Progress in Pattern Recognition, Image Analysis, Computer Vision, and Applications: 18th Iberoamerican Congress, CIARP 2013, Havana, Cuba, 20–23 November 2013; Proceedings, Part I 18. Springer: Berlin/Heidelberg, Germany, 2013; pp. 49–56. [Google Scholar]
  17. Kim, K.; Chalidabhongse, T.H.; Harwood, D.; Davis, L. Background modeling and subtraction by codebook construction. In Proceedings of the 2004 International Conference on Image Processing, 2004, ICIP’04, Singapore, 24–27 October 2004; IEEE: Piscataway, NJ, USA, 2004; Volume 5, pp. 3061–3064. [Google Scholar]
  18. Barnich, O.; Van Droogenbroeck, M. ViBe: A powerful technique for background detection and subtraction in video sequences. In Proceedings of the IEEE International Conference on Acoustics, Speech and Signal Processing, Taipei, Taiwan, 19–24 April 2009; pp. 945–948. [Google Scholar]
  19. Viola, P.; Jones, M. Rapid object detection using a boosted cascade of simple features. In Proceedings of the 2001 IEEE Computer Society Conference on Computer Vision and Pattern Recognition, CVPR 2001, Kauai, HI, USA, 8–14 December 2001; IEEE: Piscataway, NJ, USA, 2001; Volume 1, p. 1. [Google Scholar]
  20. Viola, P.; Jones, M.J. Robust real-time face detection. Int. J. Comput. Vis. 2004, 57, 137–154. [Google Scholar] [CrossRef]
  21. Dalal, N.; Triggs, B. Histograms of oriented gradients for human detection. In Proceedings of the 2005 IEEE Computer Society Conference on Computer Vision and Pattern Recognition (CVPR’05), San Diego, CA, USA, 20–26 June 2005; IEEE: Piscataway, NJ, USA, 2005; Volume 1, pp. 886–893. [Google Scholar]
  22. Felzenszwalb, P.F.; Girshick, R.B.; McAllester, D.; Ramanan, D. Object detection with discriminatively trained part-based models. IEEE Trans. Pattern Anal. Mach. Intell. 2009, 32, 1627–1645. [Google Scholar] [CrossRef]
  23. Cortes, C. Support-Vector Networks. Mach. Learn. 1995, 20, 273–297. [Google Scholar] [CrossRef]
  24. Girshick, R.; Donahue, J.; Darrell, T.; Malik, J. Rich feature hierarchies for accurate object detection and semantic segmentation. In Proceedings of the IEEE Conference on Computer Vision and Pattern Recognition, Columbus, OH, USA, 23–28 June 2014; pp. 580–587. [Google Scholar]
  25. Ren, S.; He, K.; Girshick, R.; Sun, J. Faster R-CNN: Towards real-time object detection with region proposal networks. IEEE Trans. Pattern Anal. Mach. Intell. 2016, 39, 1137–1149. [Google Scholar] [CrossRef]
  26. Lin, T.Y.; Dollár, P.; Girshick, R.; He, K.; Hariharan, B.; Belongie, S. Feature pyramid networks for object detection. In Proceedings of the IEEE Conference on Computer Vision and Pattern Recognition, Honolulu, HI, USA, 21–26 July 2017; pp. 2117–2125. [Google Scholar]
  27. Redmon, J.; Divvala, S.; Girshick, R.; Farhadi, A. You only look once: Unified, real-time object detection. In Proceedings of the IEEE Conference on Computer Vision and Pattern Recognition, Las Vegas, NV, USA, 27–30 June 2016; pp. 779–788. [Google Scholar]
  28. Liu, W.; Anguelov, D.; Erhan, D.; Szegedy, C.; Reed, S.; Fu, C.Y.; Berg, A.C. Ssd: Single shot multibox detector. In Proceedings of the Computer Vision—ECCV 2016: 14th European Conference, Amsterdam, The Netherlands, 11–14 October 2016; Proceedings, Part I 14. Springer: Berlin/Heidelberg, Germany, 2016; pp. 21–37. [Google Scholar]
  29. Lin, T.Y.; Goyal, P.; Girshick, R.; He, K.; Dollár, P. Focal loss for dense object detection. In Proceedings of the IEEE International Conference on Computer Vision, Venice, Italy, 22–29 October 2017; pp. 2980–2988. [Google Scholar]
  30. He, K.; Sun, J.; Tang, X. Single image haze removal using dark channel prior. IEEE Trans. Pattern Anal. Mach. Intell. 2010, 33, 2341–2353. [Google Scholar]
  31. Zhu, Q.; Mai, J.; Shao, L. A fast single image haze removal algorithm using color attenuation prior. IEEE Trans. Image Process. 2015, 24, 3522–3533. [Google Scholar]
  32. Du, L.; Zhang, R.; Wang, X. Overview of two-stage object detection algorithms. J. Phys. Conf. Ser. 2020, 1544, 012033. [Google Scholar] [CrossRef]
  33. Chua, L.O.; Roska, T. The CNN paradigm. IEEE Trans. Circuits Syst. Fundam. Theory Appl. 1993, 40, 147–156. [Google Scholar] [CrossRef]
  34. Zaremba, W. Recurrent neural network regularization. arXiv 2014, arXiv:1409.2329. [Google Scholar]
  35. Rendle, S.; Gantner, Z.; Freudenthaler, C.; Schmidt-Thieme, L. Fast context-aware recommendations with factorization machines. In Proceedings of the 34th International ACM SIGIR Conference on Research and Development in Information Retrieval, Beijing, China, 24–28 July 2011; pp. 635–644. [Google Scholar]
  36. Juan, Y.; Zhuang, Y.; Chin, W.S.; Lin, C.J. Field-aware factorization machines for CTR prediction. In Proceedings of the 10th ACM Conference on Recommender Systems, Boston, MA, USA, 15–19 September 2016; pp. 43–50. [Google Scholar]
  37. Krizhevsky, A.; Sutskever, I.; Hinton, G.E. ImageNet classification with deep convolutional neural networks. Commun. ACM 2017, 60, 84–90. [Google Scholar] [CrossRef]
  38. Lin, T.Y.; Maire, M.; Belongie, S.; Hays, J.; Perona, P.; Ramanan, D.; Dollár, P.; Zitnick, C.L. Microsoft coco: Common objects in context. In Proceedings of the Computer Vision—ECCV 2014: 13th European Conference, Zurich, Switzerland, 6–12 September 2014; Proceedings, Part V 13. Springer: Berlin/Heidelberg, Germany, 2016; pp. 740–755. [Google Scholar]
  39. Hoiem, D.; Divvala, S.K.; Hays, J.H. Pascal VOC 2008 challenge. World Lit. Today 2009, 24, 1–4. [Google Scholar]
  40. Deng, J.; Dong, W.; Socher, R.; Li, L.J.; Li, K.; Fei-Fei, L. Imagenet: A large-scale hierarchical image database. In Proceedings of the 2009 IEEE Conference on Computer Vision and Pattern Recognition, Miami, FL, USA, 20–25 June 2009; IEEE: Piscataway, NJ, USA, 2009; pp. 248–255. [Google Scholar]
  41. Hasan, I.; Liao, S.; Li, J.; Akram, S.U.; Shao, L. Generalizable pedestrian detection: The elephant in the room. In Proceedings of the IEEE/CVF Conference on Computer Vision and Pattern Recognition, Nashville, TN, USA, 20–25 June 2021; pp. 11328–11337. [Google Scholar]
  42. Redmon, J. Yolov3: An incremental improvement. arXiv 2018, arXiv:1804.02767. [Google Scholar]
  43. Cai, Z.; Vasconcelos, N. Cascade r-cnn: Delving into high quality object detection. In Proceedings of the IEEE Conference on Computer Vision and Pattern Recognition, Salt Lake City, UT, USA, 18–23 June 2018; pp. 6154–6162. [Google Scholar]
  44. He, K.; Zhang, X.; Ren, S.; Sun, J. Deep residual learning for image recognition. In Proceedings of the IEEE Conference on Computer Vision and Pattern Recognition, Las Vegas, NV, USA, 27–30 June 2016; pp. 770–778. [Google Scholar]
  45. Bahdanau, D. Neural machine translation by jointly learning to align and translate. arXiv 2014, arXiv:1409.0473. [Google Scholar]
  46. Vaswani, A. Attention is all you need. In Proceedings of the 31st Conference on Neural Information Processing Systems (NIPS 2017), Long Beach, CA, USA, 4–9 December 2017. [Google Scholar]
  47. Lim, J.S.; Astrid, M.; Yoon, H.J.; Lee, S.I. Small object detection using context and attention. In Proceedings of the 2021 International Conference on Artificial Intelligence in Information and Communication (ICAIIC), Jeju Island, Republic of Korea, 13–16 April 2021; IEEE: Piscataway, NJ, USA, 2021; pp. 181–186. [Google Scholar]
  48. Wang, W.; Zhang, X.; Sun, W.; Huang, M. A novel method of ship detection under cloud interference for optical remote sensing images. Remote Sens. 2022, 14, 3731. [Google Scholar] [CrossRef]
  49. Weng, J.; Li, G.; Zhao, Y. Detection of abnormal ship trajectory based on the complex polygon. J. Navig. 2022, 75, 966–983. [Google Scholar] [CrossRef]
  50. Nie, T.; He, B.; Bi, G.; Zhang, Y.; Wang, W. A method of ship detection under complex background. ISPRS Int. J. -Geo-Inf. 2017, 6, 159. [Google Scholar] [CrossRef]
  51. Wang, R.; You, Y.; Zhang, Y.; Zhou, W.; Liu, J. Ship detection in foggy remote sensing image via scene classification R-CNN. In Proceedings of the 2018 International Conference on Network Infrastructure and Digital Content (IC-NIDC), Guiyang, China, 22–24 August 2018; IEEE: Piscataway, NJ, USA, 2018; pp. 81–85. [Google Scholar]
  52. Wang, N.; Li, B.; Xu, Q.; Wang, Y. Automatic ship detection in optical remote sensing images based on anomaly detection and SPP-PCANet. Remote Sens. 2018, 11, 47. [Google Scholar] [CrossRef]
  53. Chen, X.; Wei, C.; Xin, Z.; Zhao, J.; Xian, J. Ship Detection under Low-Visibility Weather Interference via an Ensemble Generative Adversarial Network. J. Mar. Sci. Eng. 2023, 11, 2065. [Google Scholar] [CrossRef]
  54. Sakaridis, C.; Dai, D.; Van Gool, L. Semantic foggy scene understanding with synthetic data. Int. J. Comput. Vis. 2018, 126, 973–992. [Google Scholar] [CrossRef]
  55. Li, B.; Ren, W.; Fu, D.; Tao, D.; Feng, D.; Zeng, W.; Wang, Z. Benchmarking single-image dehazing and beyond. IEEE Trans. Image Process. 2018, 28, 492–505. [Google Scholar] [CrossRef] [PubMed]
  56. Zhang, Z.; Zhang, L.; Wang, Y.; Feng, P.; He, R. ShipRSImageNet: A large-scale fine-grained dataset for ship detection in high-resolution optical remote sensing images. IEEE J. Sel. Top. Appl. Earth Obs. Remote Sens. 2021, 14, 8458–8472. [Google Scholar] [CrossRef]
  57. Zhu, C.; He, Y.; Savvides, M. Feature selective anchor-free module for single-shot object detection. In Proceedings of the IEEE/CVF Conference on Computer Vision and Pattern Recognition, Long Beach, CA, USA, 15–20 June 2019; pp. 840–849. [Google Scholar]
  58. Yang, Z.; Liu, S.; Hu, H.; Wang, L.; Lin, S. Reppoints: Point set representation for object detection. In Proceedings of the IEEE/CVF International Conference on Computer Vision, Seoul, Republic of Korea, 27 October–2 November 2019; pp. 9657–9666. [Google Scholar]
  59. Chen, Q.; Wang, Y.; Yang, T.; Zhang, X.; Cheng, J.; Sun, J. You only look one-level feature. In Proceedings of the IEEE/CVF Conference on Computer Vision and Pattern Recognition, Nashville, TN, USA, 20–25 June 2019; pp. 13039–13048. [Google Scholar]
  60. Li, C.; Li, L.; Geng, Y.; Jiang, H.; Cheng, M.; Zhang, B.; Ke, Z.; Xu, X.; Chu, X. Yolov6 v3. 0: A full-scale reloading. arXiv 2023, arXiv:2301.05586. [Google Scholar]
  61. Hu, J.; Shen, L.; Sun, G. Squeeze-and-excitation networks. In Proceedings of the IEEE Conference on Computer Vision and Pattern Recognition, Salt Lake City, UT, USA, 18–23 June 2018; pp. 7132–7141. [Google Scholar]
  62. Wang, Q.; Wu, B.; Zhu, P.; Li, P.; Zuo, W.; Hu, Q. ECA-Net: Efficient channel attention for deep convolutional neural networks. In Proceedings of the IEEE/CVF Conference on Computer Vision and Pattern Recognition, Seattle, WA, USA, 13–19 June 2020; pp. 11534–11542. [Google Scholar]
  63. Woo, S.; Park, J.; Lee, J.Y.; Kweon, I.S. Cbam: Convolutional block attention module. In Proceedings of the European Conference on Computer Vision (ECCV), Munich, Germany, 8–14 September 2018; pp. 3–19. [Google Scholar]
  64. Selvaraju, R.R.; Cogswell, M.; Das, A.; Vedantam, R.; Parikh, D.; Batra, D. Grad-cam: Visual explanations from deep networks via gradient-based localization. In Proceedings of the IEEE International Conference on Computer Vision, Venice, Italy, 22–29 October 2017; pp. 618–626. [Google Scholar]
Figure 1. Structure of the proposed detection method illustrating the overall architecture, including the collaborative block components and the integration of the PCA attention mechanism, to enhance target detection in foggy conditions.
Remotesensing 16 03968 g001
Figure 2. Detailed structure of the collaborative block, showing the multi-hop cascade architecture designed for effective feature recovery and extraction from degraded images, with a focus on spatial and channel reconstruction.
Remotesensing 16 03968 g002
Figure 3. Architecture of the PCA attention module, which incorporates channel and pixel attention mechanisms to prioritize significant features in the input images.
Remotesensing 16 03968 g003
Figure 4. Illustration of the IOU process, demonstrating how the predicted bounding boxes are evaluated against ground truth boxes to determine the accuracy of object localization.
Remotesensing 16 03968 g004
Figure 5. Sample images from the dataset representing various fog conditions—thin, medium, and thick fog—used for training and validating the proposed detection model.
Remotesensing 16 03968 g005
Figure 6. (a) Loss curves of the image training process; different colored curves correspond to each component of the loss function. (b) Detection of the average precision of the image training process, where mAP@0.5 denotes mAP score at an IOU threshold of 0.5, and mAP@0.5:0.95 denotes mAP scores averaged over IOU thresholds from 0.5 to 0.95.
Remotesensing 16 03968 g006
Figure 7. Comparison of the results of different detection methods in four typical scenarios (medium fog, medium fog with multi-targets, thin fog, and thick fog with small targets).
Remotesensing 16 03968 g007
Figure 8. Comparison of detection results generated by the proposed collaborative network. The top images illustrate the model’s predictions, while the bottom images show the corresponding ground truth.
Remotesensing 16 03968 g008
Figure 9. Relationship between the number of collaborative blocks used in the proposed model and the achieved mean average precision (mAP), demonstrating the positive impact of adding blocks on detection performance.
Remotesensing 16 03968 g009
Figure 10. Example of attention visualization heatmap generation based on Grad-CAM algorithm [64]. (a) Input image. (b) Before collaborative block. (c) After collaborative block. (d) Before attention modules. (e) After attention modules.
Remotesensing 16 03968 g010
Table 1. Overview of our dataset.
TypeTotalTrainValTest
Other-Ship16961050297349
Other-Warship1455962209284
Submarine1017666171180
Aircraft-Carrier2851964643
Ticonderoga44025877105
Destroyer1525940269316
Frigate874563105206
Patrol1541023715
Landing944593150201
Commander146883226
Auxiliary-Ship4833118389
Other-Merchant2521505052
Container-Ship3762327272
RoRo1701072043
Cargo1082657169256
Barge2391612256
Tugboat2901974647
Ferry3091915365
Yacht71250114071
Sailboat796325341130
Fishing-Vessel60631899189
Oil-Tanker2041293243
Hovercraft3342293174
Motorboat20911190398503
Dock1093744154195
Table 2. Detection of average precision (%) and speed of different methods in the dataset.
MethodBackbonemAP(%)
Faster R-CNNResNet5043.4
Faster R-CNNResNet10145.3
SSD512VGG1642.1
FSAFResNet10141.3
RepPointsResNet5046.2
YOLOFResNet5044.8
YOLOv5s-46.7
YOLOv6s-44.2
YOLOv8n-46.1
Collaborative network (proposed)-48.7
Table 3. Comparison of object detection methods under different fog conditions.
MethodBackboneFogPrecisionRecallmAP(%)
Faster-R-CNNResNet50thin0.3560.71143.8
medium0.3920.64540.7
thick0.3520.56833.5
Faster-R-CNNResNet101thin0.3830.72147.4
medium0.4180.66743.8
thick0.3750.57035.7
SSD512VGG16thin0.3160.71242.9
medium0.3270.71443.4
thick0.2820.62836.2
FSAFResNet101thin0.3140.68342.1
medium0.3510.62339.9
thick0.3170.51230.5
RepPointsResNet50thin0.2010.74545.9
medium0.2190.71744.3
thick0.2060.63336.9
YOLOFResNet50thin0.2680.74246.7
medium0.2790.72044.9
thick0.2570.62235.1
YOLOv5s thin0.6780.60047.8
medium0.7000.55445.5
thick0.6590.44937.1
YOLOv6s thin0.4310.59845.5
medium0.4370.31833.4
thick0.3320.27924.5
YOLOv8n thin0.6300.51245.1
medium0.5920.52945.4
thick0.5160.46237.4
Collaborative network (proposed) thin0.6690.61249.1
medium0.6800.58347.4
thick0.6530.51441.3
Table 4. Precision, recall, and detection of average precision (%) for different numbers of blocks.
MethodBlockPrecisionRecallmAP(%)GFLOPs
Proposed (Conv)10.6820.55146.5111
Proposed (Conv)20.7000.59447.9172
Proposed (Conv)30.6850.59548.6233
Proposed (SCConv)10.6900.54346.249.0
Proposed (SCConv)20.6850.53848.049.6
Proposed (SCConv)30.7330.57648.750.1
Table 5. Precision, recall and detection of average precision (%) under different attention modules.
MethodPrecisionRecallmAP(%)
YOLOv5s (baseline)0.6800.58346.7
YOLOv5s + SE [61]0.6690.58547.1
YOLOv5s + ECA [62]0.7280.57847.9
YOLOv5s + CBAM [63]0.6750.61148.2
YOLOv5s + PCA (proposed)0.7330.57648.7
Table 6. Precision, recall, and detection of average precision (%) for different combinations of components.
MethodPrecisionRecall mAP(%)
YOLOv5s (baseline)0.6800.58346.7
+ collaborative block0.6400.56045.3
+ 4 attention modules0.6420.60647.5
+ 4 detection heads0.7100.57747.2
+ collaborative block + 4 attention modules + 4 detection heads0.733 0.57648.7
Disclaimer/Publisher’s Note: The statements, opinions and data contained in all publications are solely those of the individual author(s) and contributor(s) and not of MDPI and/or the editor(s). MDPI and/or the editor(s) disclaim responsibility for any injury to people or property resulting from any ideas, methods, instructions or products referred to in the content.

