Abstract
Lunar laser retroreflectors are a crucial target for lunar laser ranging (LLR). During LLR operations at all lunar laser ranging stations, the considerable distance between the Earth and the Moon makes it impossible to visually identify the position of the lunar laser retroreflectors within the camera’s field of view (FOV). Typically, we use the camera to observe various lunar surface features illuminated by sunlight, and then we align the telescope with the corresponding area for accurate positioning. Based on lunar digital elevation model (DEM) data and INPOP19a planetary ephemeris, our research presents an illumination model for the lunar terrain around the lunar laser retroreflectors, suitable for the 1’ camera FOV constraint at the TianQin laser ranging station. The illumination model is linked to universal time coordinated (UTC) time and DEM data. By inputting the UTC time, the illumination conditions of the terrain surrounding the five lunar laser retroreflectors can be determined for that specific time. The terrain surrounding the Apollo 15 and Lunokhod 2 retroreflectors exhibits distinctive terrain features under illumination, making them easier to locate compared to other retroreflectors. This illumination model provides a better solution to the problem of aligning laser ranging stations to lunar laser retroreflectors.
1. Introduction
Lunar laser ranging (LLR) indirectly measures the Earth–Moon distance by measuring the round-trip flight time interval of light pulses between the laser ranging station and arrays of lunar laser retroreflectors on the lunar surface [1]. LLR data are of significant importance for studying planetary orbital science, geodesy, lunar science, and fundamental physics [2].
There are a total of five lunar laser retroreflector arrays on the lunar surface available for LLR. A significant amount of theoretical analyses and experimental research on laser ranging has been conducted for these five lunar laser retroreflectors. Currently, there are approximately 50 stations globally that are equipped to perform satellite laser ranging operations, and the high-precision data obtained through this technology are extensively utilized. However, only a few observatories are capable of conducting regular LLR operations, including the McDonald Laser Ranging Station and the Apache Point Observatory in the United States [3,4], the Grasse Observatory in France [5,6,7], the MLRO Observatory in Italy, and the Wettzell Observatory in Germany [8]. In recent years, a number of astronomical observatories in China have started LLR technology research, such as the Yunnan Observatory, the Shanghai Observatory, the Changchun Observatory of the National Astronomical Observatories of China, and the TianQin laser ranging station of Sun Yat-sen University. Currently, the TianQin laser ranging station has successfully received effective return signals from all five lunar laser retroreflector arrays on the lunar surface, with measurement accuracy reaching the centimeter level.
Currently, in LLR, due to the considerable distance between Earth and the Moon and the relatively narrow laser divergence angle, the number of return photons is relatively low. It is necessary to increase the number of returning photons from the retroreflectors. Therefore, the precise aiming of the telescope at the lunar laser retroreflectors’ position is required. This is a significant challenge in the context of current LLR. In order to increase the echo photon rate, the design of all of the five lunar laser retroreflectors adopts an array structure, with each retroreflector array consisting of multiple corner-cube retroreflectors. The Apollo 15 lunar laser retroreflector is the largest, measuring 104 cm × 61 cm, which appears very small compared to the Earth–Moon distance. Therefore, the human eye cannot locate the position of the lunar laser retroreflector on the camera, but can only roughly localize it by the terrain features around the lunar laser retroreflector.
The lunar surface is characterized by a variety of topographical features, including highlands, lowlands, and a multitude of impact craters. These latter features are arguably the most prominent characteristics of the lunar landscape. In the target localization of lunar laser retroreflectors, illumination plays a significant role, necessitating the consideration of lunar topography obstruction and illumination effects to accurately depict the surrounding positions of lunar laser retroreflectors. The illumination conditions directly impact the current illumination of the lunar laser retroreflector, thus enabling us to ascertain whether the lunar laser retroreflector is currently illuminated or not. Concurrently, the illumination conditions can elucidate shaded and highlighted areas of terrain features, thereby facilitating the determination of the actual location of lunar laser retroreflectors and the impact of these terrain features on signal propagation. In the context of imaging or lighting simulations of the lunar surface, the prevailing lighting conditions serve to determine the clarity and contrast of the resulting image. Appropriate lighting serves to accentuate topographical features, thereby facilitating a more precise positioning of the lunar laser retroreflectors. In the absence of adequate illumination, the identification of terrain features may be compromised, potentially impacting the outcomes of data processing and analysis.
Based on the reasons mentioned above, our research employs the Lunar Orbiter Laser Altimeter (LOLA) data and the INPOP19a planetary ephemeris as the foundation data [9,10,11]. Through the INPOP19a planetary ephemeris [12,13], the positional relationships among the Earth, Moon, and Sun, as well as lunar librations, can be obtained for any given universal time coordinated (UTC) time. Under the constraint of a 1′ field of view (FOV) of the camera at the TianQin laser ranging station [14,15], we first produced five templates of the terrain around the lunar laser retroreflectors, and also established an illumination model for the lunar terrain around the lunar laser retroreflectors, linking UTC time, lunar digital elevation model (DEM) data, and the illumination model. This illumination model facilitates the calculation of illumination conditions around the lunar laser retroreflectors and provides real-time capabilities. By entering a specific UTC time, it is possible to ascertain the illumination conditions in the vicinity of the five lunar laser retroreflectors by utilizing the elevation values derived from LOLA data. We can create a database of maximum terrain altitude angles and illumination conditions based on the five lunar laser retroreflector templates, and by entering the solar altitude angle and solar azimuth angle, we can quickly access the database to obtain the illumination conditions of the terrain around the current lunar laser retroreflectors. This provides a solid foundation for subsequent tasks such as camera imaging modeling, the analysis of the lunar laser retroreflector illumination, and the characterization of image features around the lunar laser retroreflectors. Moreover, it presents a promising methodology for the precise localization of laser ranging retroreflectors.
2. The Source and Processing of LOLA Data
2.1. Introduction to LOLA Data
On 19 June 2009, the National Aeronautics and Space Administration (NASA) launched the Lunar Reconnaissance Orbiter (LRO), equipped with the LOLA [16,17], a high-rate multi-beam laser altimetry system. The high-precision distance information acquired by LOLA from the satellite to the lunar surface is utilized for lunar topographic mapping. The lunar DEM data obtained for this study are labeled as “Moon LRO LOLA DEM 118m v1”. The high-resolution DEM data provided by LOLA serve as an ideal data source for research on lunar laser retroreflector positioning and lunar illumination. They serve as a crucial foundation for this study.
The lunar LOLA data are illustrated in the Figure 1 below:
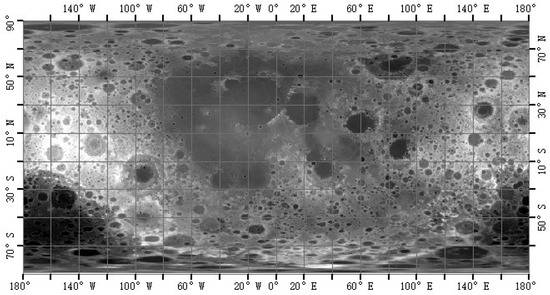
Figure 1.
Lunar LOLA data image.
The lunar LOLA data were initially referenced to an internally consistent inertial coordinate system, derived from the tracking of the LRO spacecraft. In Figure 1, by adopting appropriate values for the orientation of the Moon as defined by the International Astronomical Union, these inertial coordinates were converted into the planet-fixed coordinates (longitude and latitude) used on this map. The coordinate system defined for this product is the mean Earth/polar axis (ME) system. The ME system plays a significant role in the localization of lunar laser retroreflectors.
The geospatial information of the lunar LOLA data is shown in the Table 1 below:

Table 1.
The geospatial information of the lunar LOLA data.
2.2. Data Processing
The camera of the TianQin laser ranging station has an FOV angle of 1 min of arc (1′). In order to accurately assess the environment surrounding five lunar laser retroreflectors and consider the terrain obstruction around the lunar points for precise illumination calculations, it is essential that the terrain data encompass an area that extends beyond the illumination range. Accordingly, our research selects lunar LOLA data with an FOV of 2 min of arc (2′ × 2′). The central positions are in alignment with the locations of the five lunar laser retroreflectors in the mean Earth/polar axis (ME) system, as illustrated in the Table 2 below [18]:

Table 2.
Lunar laser retroreflector arrays coordinates using a frame based on mean Earth/mean rotation axes and the center of mass.
The calculation of the 2′ × 2′ lunar FOV size is based on the maximum distance between the Earth and the Moon, which is approximately 406,000 km. The schematic diagram of the camera’s 1′ FOV is shown in the Figure 2 below:
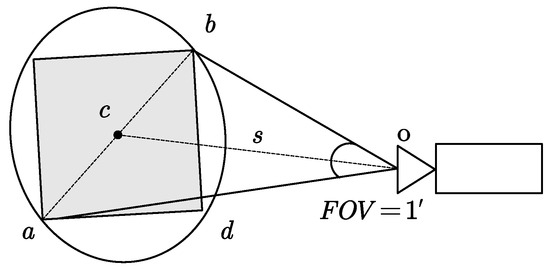
Figure 2.
Schematic diagram of camera 1’s FOV.
As illustrated in Figure 2, a, b and d represent the boundaries of the actual coverage of the lunar surface. c denotes the position of the lunar laser retroreflector of the lunar surface on the Moon. o indicates the position of the TianQin laser station camera, and s denotes the distance between the camera and the lunar laser retroreflector. The gray part indicates the actual area covered by the camera’s 1′ FOV on the lunar surface. The actual lunar distance corresponding to the 2′ × 2′ FOV is determined to be 167,019.49 m by 167,019.49 m, following the calculation. A template image of size 1410 × 1410 pixels on the LOLA data is equivalent to a 2′ × 2′ FOV. Subsequently, the positions of five lunar laser retroreflectors are cropped in the LOLA data. Grid data are used with a spatial resolution as the step length, with longitudes increasing from left to right and latitudes decreasing from top to bottom. The center of the template image corresponds to the position of the lunar laser retroreflectors. Therefore, the corresponding positions (, ) of the elevation of any lunar point (lon, lat) are calculated as follows:
where and , respectively, represent the longitude and latitude values of the origin of the lunar LOLA data, Pix represents the spatial resolution of the terrain data at 1/256°, and the floor(x) function represents the largest integer not exceeding x.
In order to retrieve the elevation value at the specified positions (, ), the Python library function geospatial data abstraction library (GDAL) is invoked.
For ease of computation and retrieval, this paper stores the elevation templates and latitude and longitude information of five lunar laser retroreflectors separately in Python 3.9.13 in the “npy” format. This facilitates the subsequent retrieval of terrain elevation angles and traversing latitude and longitude information related to INPOP19a planetary ephemerides calculations.
The template images of the five lunar laser retroreflectors are shown in the Figure 3, as follows:
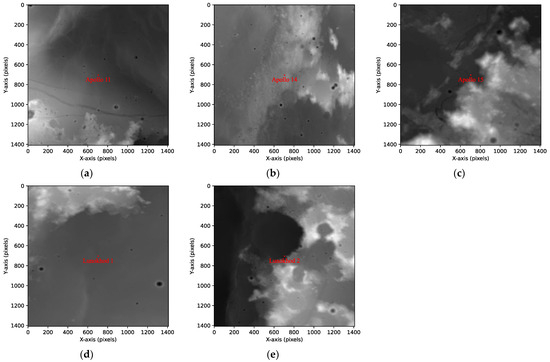
Figure 3.
The template images of the five lunar laser retroreflectors. (a) The template images of the Apollo 11 lunar laser retroreflector; (b) the template images of the Apollo 14 lunar laser retroreflector; (c) the template images of the Apollo 15 lunar laser retroreflector; (d) the template images of the Lunokhod 1 lunar laser retroreflector; and (e) the template images of the Lunokhod 2 lunar laser retroreflector.
In Figure 3, the grayscale of the images represents elevation values, which remain constant. The red positions within the template images, respectively, indicate the actual locations of the five lunar laser retroreflectors on the lunar surface.
3. Establishment of Lunar Illumination Model
Our research establishes a terrain model around lunar laser retroreflectors based on LOLA data, combined with INPOP19a planetary ephemeris. By geometric principles a mathematical model is developed to calculate the terrain illumination conditions around the five lunar laser retroreflectors. The flowchart illustrating the calculation is presented in the Figure 4 as follows:
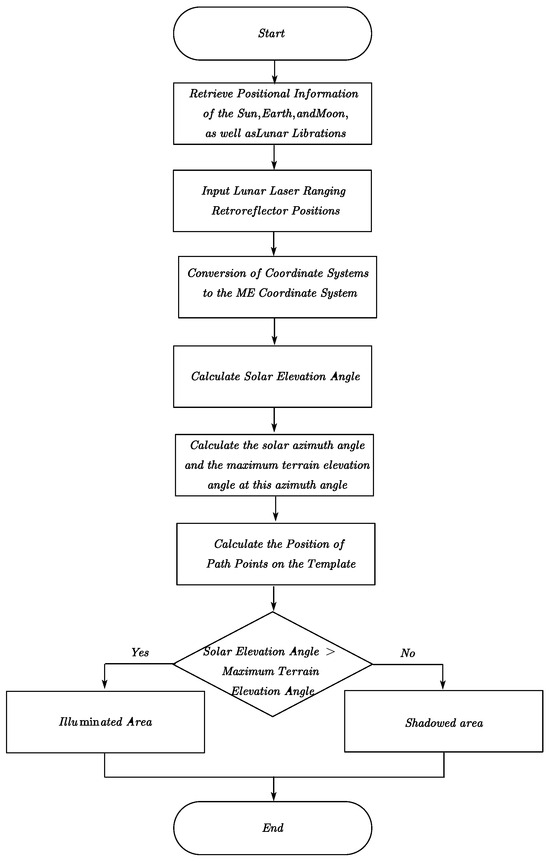
Figure 4.
The flowchart diagram for lunar laser retroreflector illumination calculations considering topography.
In Figure 4, any UTC time is input, and the INPOP19a planetary ephemeris is used to obtain the positions of the Sun, Earth, and Moon [19], as well as the lunar librations. Secondly, through the process of coordinate conversion, the Selenocentric Celestial Reference System (SCRS), expressed in solar position coordinates, was transformed into the ME system. This allowed for the determination of the position of the Sun on the Moon, thereby unifying all coordinates. Thirdly, the solar elevation angle and azimuth angle are calculated, and the positions of the lunar points along the solar illumination path at the solar azimuth angle are determined. The maximum terrain elevation angle along this path is then computed. In the event that the maximum terrain elevation angle within the specified calculation area is less than the solar elevation angle, the lunar point is subject to shadowing, resulting in a value of 0. Conversely, if the terrain elevation angle exceeds the solar elevation angle, the area is illuminated and assigned a value of 1 [20,21,22,23,24]. Finally, the entire lunar laser retroreflector template is traversed to calculate the illumination conditions at each location, thereby obtaining the terrain illumination status around the lunar laser retroreflectors at that UTC time [25,26,27,28].
3.1. Solar Elevation Angle and Azimuth Angle
The illumination model considering the terrain also requires calculations of the solar incidence azimuth angle and the terrain elevation angle at this incidence azimuth angle. The schematic diagram is shown in the Figure 5, as follows:
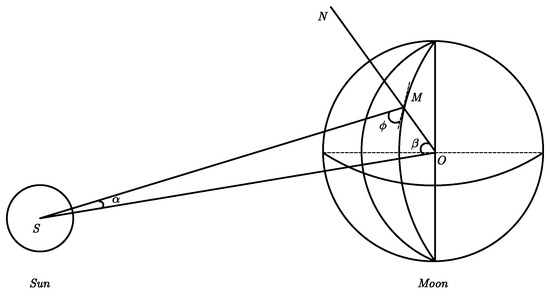
Figure 5.
The schematic diagram of the illumination model.
In Figure 5, the solar altitude angle is calculated using the positions of the solar barycenter S, the lunar barycenter O, and the lunar surface latitude and longitude point M. The positions of S and O can be obtained from the INPOP19a planetary ephemeris, and can be transformed to the ME coordinate system through the application of a coordinate transformation. M represents the lunar laser retroreflector in the ME coordinate system.
The solar altitude angle can be expressed as follows:
where denotes the solar altitude angle and represents the solar incidence angle, which can be expressed by the equation, as follows:
where and can be obtained through the calculation in .
To unify the coordinate system to the ME coordinate system, it is necessary to convert the coordinates of lunar laser retroreflectors in the lunar geographic coordinate system and the coordinates of the Sun in the SCRS coordinate system. The conversion process is as follows:
Assuming the lunar point M has geographical coordinates (, , ), where , , and , respectively, represent longitude, latitude, and distance from the lunar center, the transformation from the lunar geographic coordinate system to the lunar fixed coordinate system yields three-dimensional coordinates, as follows [29]:
where can be calculated from LOLA data, according to the formula, as follows:
where Scaling Factor = 0.5, Pixel Value represents the pixel value of the LOLA data, which can be read using the GDAL library. 1,737,400 m represents the mean radius of the moon.
This yields the result of M in the ME coordinate system.
Through the INPOP19a planetary ephemeris, the position of the Sun in the SCRS and the three Euler angles of the Moon can be obtained. Then, the SCRS coordinates are transformed to the ME coordinate system. Firstly, they are converted to the principal axes (PA) coordinate system as follows:
where , , and represent the three Euler angles of lunar precession, obtainable from the INPOP19a planetary ephemeris. represents the Sun’s position in the PA coordinate system. represents the Sun’s position in the SCRS coordinate system.
Then, through a constant matrix [C], they are ultimately transformed into the ME coordinate system as follows:
In this paper, the solar incidence angle is defined as the anticlockwise angle between the projection direction of the incident vector on the XY plane of the lunar-centered coordinate system and the positive x-axis direction. This angle is crucial for the subsequent computation of path points on the lunar laser retroreflector template. It can be derived from simple geometric relationships, as follows:
where , , and represent the position coordinates of the Sun. , , and represent the position coordinates of the lunar laser retroreflector. and , respectively, represent the longitude and latitude of the lunar laser retroreflector. denotes the solar incidence angle defined by us.
The solar incidence azimuth angle is illustrated in the Figure 6 as follows:
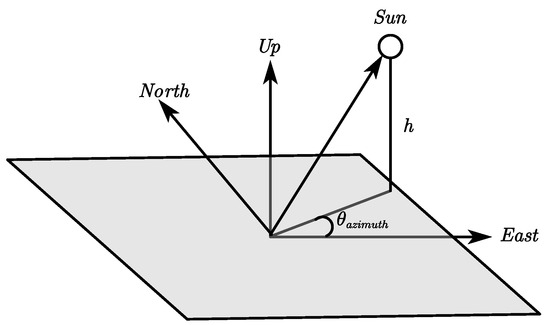
Figure 6.
Illustration of the solar incidence azimuth angle.
After determining the solar incident azimuth angle, the incident path on the lunar surface consists of a set of pixel points on the template corresponding to the azimuth angle.
3.2. The Impact of Terrain on Solar Illumination
Due to the average distance between the Earth and the Moon being approximately 380,000 km, S can be equivalently represented as d, as illustrated in the Figure 7 below:
where represents half of the camera’s FOV angle (1′), R denotes the distance between the Earth and the Moon, s represents the arc distance on the lunar surface under the FOV angle, and d signifies the corresponding planar distance on the lunar surface. Therefore, d is equivalent to s.
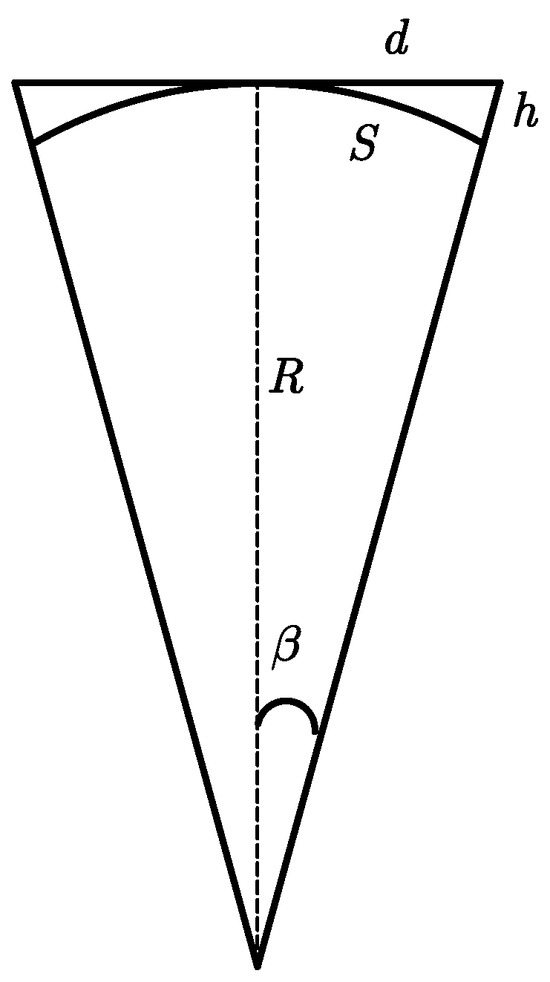
Figure 7.
The schematic diagram of distance equivalence.
Our research improves the illumination model by addressing the characteristics of a narrow camera FOV and a distant Earth–Moon distance. This involves simplifying both the illumination model and the calculation method for the maximum terrain elevation angle. the schematic diagram for terrain elevation angle calculation is shown in the Figure 8, as follows:
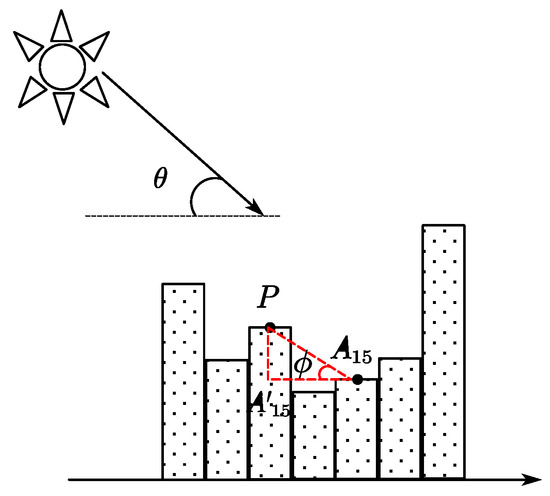
Figure 8.
Schematic diagram for terrain elevation angle calculation.
Assuming a positive solar elevation angle, Figure 8 indicates that the area falls within the solar illumination range. Determining whether is occluded by surrounding terrain primarily depends on the relationship between the solar line-of-sight elevation angle and the maximum terrain elevation angle of terrain traversed under this solar line of sight. When , is occluded by P, indicating a shadowed area; otherwise, it is an illuminated region.
3.3. Simplified Terrain Elevation Angle Method
If calculating the maximum terrain elevation angle at for a given moment, and assuming P represents the location on the lunar surface where the maximum elevation angle along the current solar illumination path occurs, this geometric relationship can be represented using the geometry depicted in Figure 8:
In this context, , the terrain height angle is defined as follows:
where represents the difference in elevation between P and , and represents the difference in distance between the location of P on the lunar surface and . The calculation formula is as follows:
where and denote the elevation differences between points P and , which can be computed from the LOLA data. d represents the resolution of the LOLA data, which is 118.4505876 m per pixel, and denotes the positional difference in pixels between point P and the location of .
Therefore, to compute the maximum terrain elevation angle at a specified azimuth angle, it is essential to calculate the lunar surface points traversed by the illumination path at that specified azimuth angle [30,31,32]. This is illustrated in the Figure 9 as follows:
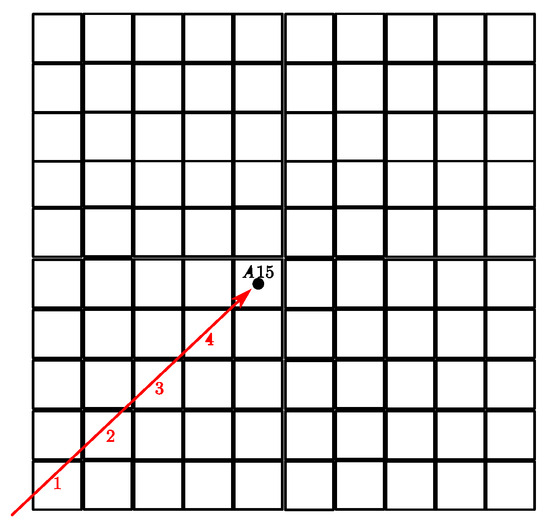
Figure 9.
Schematic diagram for calculating maximum terrain elevation angle at given azimuth angle.
As shown in Figure 9, the maximum terrain elevation angle at position A15 for a given azimuth angle is determined by the path traversing points 1, 2, 3, and 4. In order to ascertain the maximum terrain elevation angle at position A15 for the given azimuth angle, it is essential to calculate the lunar surface positions of these points and the elevation angles between them and position A15.
Establishing the relationship between path points and angles, as illustrated in the Figure 10, is as follows:
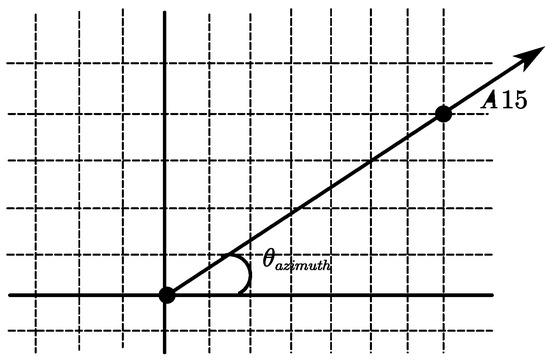
Figure 10.
Schematic diagram illustrating the relationship between path points and the target location.
As Figure 10 shows that A15, under the current solar incident azimuth angle, can calculate the path points traversed by the template using the linear equation as follows:
where and represent the position of A15 on the template, and x and y denote the positions of various path points on the template under the solar incident angle .
Finally, we traverse the entire lunar laser retroreflector template to determine the maximum terrain elevation angle at each position in the image. We store the results in Python in the ‘npy’ format. This methodology allows for the construction of a database comprising illustration conditions and terrain elevation data.
4. Simulation Results and Analysis of Lunar Laser Retroreflectors
The Apollo 15 lunar laser retroreflector represents the largest dataset currently available in LLR. Taking the Apollo 15 lunar laser retroreflector as an example, simulations were conducted for varying azimuth angles at a fixed elevation angle, different elevation angles at a fixed azimuth angle, and the surrounding terrain illumination simulation for five lunar laser retroreflectors at four different UTC times.
4.1. A15 Simulation Results and Analysis for Different Solar Azimuth Angles
Maintaining a constant solar elevation angle of 10°, illumination simulations were conducted for the terrain surrounding the Apollo 15 lunar laser retroreflector. The results are presented in the Figure 11 below:
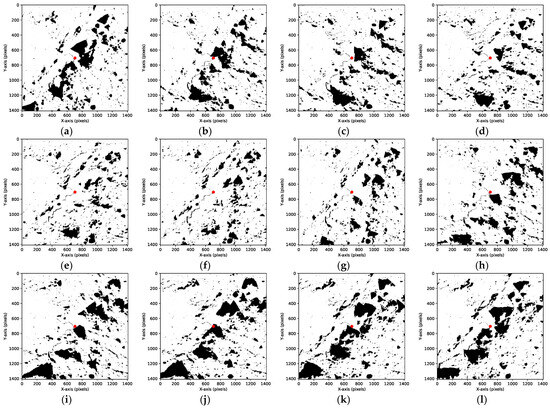
Figure 11.
Apollo 15 lunar laser retroreflector images under various incident azimuth angles. (a) Solar azimuth angle of 0°; (b) solar azimuth angle of 30°; (c) solar azimuth angle of 60°; (d) solar azimuth angle of 90°; (e) solar azimuth angle of 120°; (f) solar azimuth angle of 150°; (g) solar azimuth angle of 180°; (h) solar azimuth angle of 210°; (i) solar azimuth angle of 240°; (j) solar azimuth angle of 270°; (k) solar azimuth angle of 300°; and (l) solar azimuth angle of 330°.
In Figure 11, the red dot indicates the position of the Apollo 15 lunar laser retroreflector under the current illumination conditions. It is evident that the Apollo 15 lunar laser retroreflector exhibits terrain variations with distinct brightness contrasts when initially illuminated by sunlight under different azimuthal angles. The surrounding area, notably near the highest point of a lunar crater, serves as a discernible region, characterized by relatively high elevation values and minimal occlusion.
4.2. Simulation Results and Analysis of A15 under Various Elevation Angles
When maintaining the solar incidence azimuth angle a constant value of 30°, gradually increasing the solar elevation angle from 0° results in the following outcomes, as shown in the Figure 12 below:
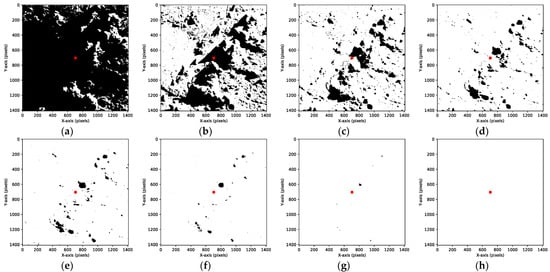
Figure 12.
A15 images under various solar elevation angles. (a) Solar elevation angle of 0°; (b) solar elevation angle of 5°; (c) solar elevation angle of 10°; (d) solar elevation angle of 15°; (e) solar elevation angle of 20°; (f) solar elevation angle of 25°; (g) solar elevation angle of 30°; and (h) solar elevation angle of 35°.
In Figure 12, the red dot indicates the position of the Apollo 15 lunar laser retroreflector under the current illumination conditions. It can be observed that as the solar elevation angle increases from 0°, the backlit areas undergo a gradual transition from dark to bright as they receive illumination. When the solar elevation angle reaches 35°, the terrain surrounding the Apollo 15 lunar laser retroreflector is essentially fully illuminated. From Figure 12h, it can be observed that the surrounding terrain is no longer discernible to the human eye.
4.3. Illumination Simulation of Five Lunar Laser Retroreflectors at UTC Time
Due to the relatively large distances between the five lunar laser retroreflectors on the lunar’s surface, selecting the same UTC time might result in some lunar laser retroreflectors being illuminated while others are shadowed. However, during the full moon, all five lunar laser retroreflectors are illuminated because the Sun’s elevation angle is high. Simultaneously, since the terrains where the five lunar laser retroreflectors are located are in low valley areas, the simulation might show the entire area as brightly lit. In this paper, based on the differences in lunar phases, our research selected the terrain conditions of the retroreflectors at four different UTC times to represent the model situation of the five lunar laser retroreflectors.
The azimuth and elevation angles at four different UTC moments points are as shown in the Table 3 below:

Table 3.
Azimuth and elevation angles of the lunar laser retroreflectors at four different UTC moments.
The illumination simulation maps of the terrain surrounding the five lunar laser retroreflectors at four different UTC moments is shown in the Figure 13, as follows:
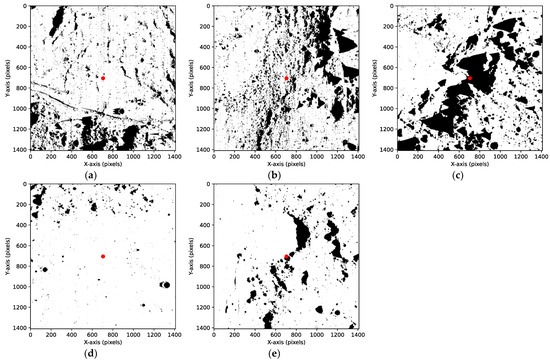
Figure 13.
Illumination simulation maps of the terrain surrounding the five lunar laser retroreflectors at different UTC moments (a) Illumination simulation image of Apollo 11 site at 11:45:00 UTC on 20 September 2023; (b) illumination simulation image of Apollo 14 site at 17:49:00 UTC on 8 September 2023; (c) illumination simulation image of Apollo 15 site at 12:20:20 UTC on 22 September 2023; (d) illumination simulation image of Lunokhod 1 site at 18:10:00 UTC on 25 September 2023; and (e) illumination simulation image of Lunokhod 2 site at 11:45:00 UTC on 20 September 2023.
Figure 13 shows that simulations of the Apollo 11, Apollo 14, Apollo 15, Lunokhod 1, and Lunokhod 2 lunar laser retroreflectors resulted in different illumination images. It is notable that both the Apollo 15 and Lunokhod 2 lunar laser retroreflectors are situated in low-lying areas. The regions in the vicinity of their locations are characterized by cratered terrain, with these craters exhibiting distinctive edge characteristics, thereby providing optimal topographical features for the identification of the positions of the lunar laser retroreflectors. In contrast, the areas around the Apollo 11, Apollo 14, and Lunokhod 1 lunar laser retroreflectors lack distinctive terrain features such as impact craters, basins, or well-defined edge characteristics. However, regions further away from these lunar laser retroreflectors have recognizable terrains that can serve as a reference for locating these lunar laser retroreflectors.
5. Discussion
Our research constructed a relationship between UTC time and the topography of lunar laser retroreflectors. By entering the UTC time at any point in time, we can obtain the terrain state of five lunar laser retroreflectors at that point. By modeling the illumination, we can know if and how much the five lunar laser retroreflectors are illuminated, so that we can better decide whether to perform lunar LLR at that moment.
However, the illumination model also has some limitations. The resolution of the DEM data directly affects the detail representation of the terrain and the accuracy of the illumination model. Higher resolution data can provide more accurate and detailed light simulation results, but they are also accompanied by higher computational and storage requirements. Choosing the appropriate resolution of DEM data requires balancing accuracy and resource requirements based on specific application scenarios and accuracy requirements.
In the future, in order to more accurately locate the position of the lunar laser retroreflector, consideration needs to be given to increasing the accuracy of the DEM data as well as incorporating lunar albedo data to better simulate the terrain of lunar laser retroreflectors.
6. Conclusions
Our research presents an illumination model for the terrain surrounding five lunar laser retroreflectors suitable for lunar laser ranging stations, constrained by the FOV of the camera at the TianQin laser ranging station, supported by LOLA data and INPOP19a planetary ephemerides. This model enables the assessment of illumination conditions within a 2′ FOV around the five lunar laser retroreflectors at any given UTC time. When the solar elevation angle exceeds the maximum terrain elevation angle, the lunar surface point is illuminated; otherwise, it is occluded.
Our research conducts simulations under different illumination conditions, namely simulating illumination variations with different azimuth angles at a fixed elevation angle, different elevation angles at a fixed azimuth angle, the illumination simulation of the terrain surrounding Apollo 11 and Lunokhod 2 lunar laser retroreflectors at 11:45:00 UTC on 20 September 2023, the illumination simulation of the terrain surrounding Apollo 14 lunar laser retroreflector at 17:49:00 UTC on 8 September 2023, the illumination simulation of the terrain surrounding Apollo 15 lunar laser retroreflector at 12:20:20 UTC on 22 September 2023, and the illumination simulation of the terrain surrounding Lunokhod 1 lunar laser retroreflector at 18:10:00 UTC on 25 September 2023.
The results indicate that the terrain surrounding the Apollo 15 lunar laser retroreflector undergoes a gradual transition from shadowed to illuminated states under different azimuth and elevation angles. Due to varying illumination conditions, noticeable differences in the terrain features are observed within the crater where the Apollo 15 and Lunokhod 2 lunar laser retroreflectors are located, facilitating further investigation by lunar ranging researchers. For the Apollo 11, Apollo 14, and Lunokhod 1 lunar laser retroreflectors, their positions are located at the bottom of valleys, with almost no prominent identifiable terrain features nearby. Our research found that there are more distinct topographic features at locations farther away from these lunar laser retroreflectors, which can serve as reference points for locating these lunar laser retroreflectors.
Our research establishes an illumination model for lunar laser retroreflectors, which can serve as a reference for subsequent tasks such as camera imaging, illumination analysis, lunar laser retroreflector localization, the extraction of terrain features around lunar laser retroreflectors, and the deployment of new lunar laser retroreflectors in the future.
Author Contributions
Conceptualization, Y.L. and Y.Y.; methodology, Y.L.; software, Y.L.; validation, X.H. and X.W.; formal analysis, Y.L., X.H., X.L., Q.Z. and C.Z.; investigation, Y.L.; resources, Y.Y.; data curation, Y.L.; writing—original draft preparation, Y.L.; writing—review and editing, Y.Y.; visualization, Y.L.; supervision, Y.Y.; project administration, Y.Y.; funding acquisition, Y.Y. All authors have read and agreed to the published version of the manuscript.
Funding
This research was funded by the National Key R&D Program of China, grant numbers 2021YFC2202200 & 2021YFC2202202.
Data Availability Statement
The data generated in this study are not publicly available due to [their use in an ongoing study by the authors] but can be made available from the corresponding author upon reasonable request.
Acknowledgments
The authors wish to thank the LOLA and LROC Science Team for releasing such great lunar DEM data products.
Conflicts of Interest
The authors declare no conflicts of interest.
References
- Müller, J.; Murphy, T.W.; Schreiber, U.; Shelus, P.J.; Francau, A.G. Lunar laser ranging: A tool for general relativity, lunar geophysics and earth science. J. Geodyn. 2019, 93, 2195–2210. [Google Scholar] [CrossRef]
- Williams, J.G.; Turyshev, S.G.; Boggs, D.H.; Ratcliff, J.T. Lunar laser ranging science: Gravitational physics and lunar interior and geodesy. Adv. Space Res. 2006, 37, 67–71. [Google Scholar] [CrossRef]
- Faller, J.; Winer, I.; Carrion, W.; Johnson, T.S.; Spadin, P.; Robinson, L.; Wampler, E.J.; Wieber, D. Laser beam directed at the lunar retro-reflector array: Observations of the first returns. Science 1969, 166, 99–102. [Google Scholar] [CrossRef]
- Murphy, T.W.; Adelberger, E.G.; Battat, J.B.R.; Carey, L.N.; Hoyle, C.D.; Leblanc, P.; Michelsen, E.L.; Nordtvedt, K.; Orin, A.E.; Strasburg, J.D.; et al. The Apache point observatory lunar laser-ranging operation: Instrument description and first detections. Publ. Astron. Soc. Pac. 2008, 120, 20–37. [Google Scholar] [CrossRef]
- Nicolas, J.; Bonnefond, P.; Laurain, O.; Serio, P.; Exertier, P.; Barlier, F. Triple laser ranging collocation experiment at the grasse observatory. In Proceedings of the XXVII General Assembly of the European Geophysical Society (EGS), Nice, France, 22 April 2002. [Google Scholar]
- Li, X.; Wang, S.; Zheng, Y.; Cheng, A. Estimation of solar illumination on the moon: A theoretical model. Planet. Space Sci. 2008, 56, 947–950. [Google Scholar] [CrossRef]
- Courde, C.; Torre, J.M.; Samain, E.; Martinot-Lagarde, G.; Aimar, M.; Albanese, D.; Exertier, P.; Fienga, A.; Mariey, H.; Metris, G.; et al. Lunar laser ranging in infrared at the grasse laser station. Astron. Astrophys. 2017, 602, A90. [Google Scholar] [CrossRef]
- Schreiber, U.; Mueller, J.; Dassing, R.; Brandl, N.; Haufe, K.H.; Herold, G.; Kahn, R.; Roettcher, K.; Stoeger, R. LLR: Activities in Wettzell. In Proceedings of the 8th International Workshop on Laser Ranging Instrumentation, Annapolis, MD, USA, 18–22 May 1993. [Google Scholar]
- Chin, G.; Brylow, S.; Foote, M.; Garvin, J.; Kasper, J.; Keller, J.; Litvak, M.; Mitrofanov, I.; Paige, D.; Raney, K.; et al. Lunar reconnaissance orbiter overview: The instrument suite and mission. Space Sci. Rev. 2007, 129, 391–419. [Google Scholar] [CrossRef]
- Robinson, M.S.; Brylow, S.M.; Tschimmel, M.; Humm, D.; Lawrence, S.J.; Thomas, P.C.; Denevi, B.W.; Bowman-Cisneros, E.; Zerr, J.; Ravine, M.A.; et al. Lunar reconnaissance orbiter camera (LROC) instrument overview. Space Sci. Rev. 2010, 150, 81–124. [Google Scholar] [CrossRef]
- Vondrak, R.; Keller, J.; Chin, G.; Garvin, J. Lunar reconnaissance orbiter (LRO): Observations for lunar exploration and science. Space Sci. Rev. 2010, 150, 7–22. [Google Scholar] [CrossRef]
- Fienga, A.; Viswanathan, V.; Derem, P.; Di Ruscio, A.; Bernus, L.; Laskar, J.; Gastineau, M.; Rambaux, N.; Minazzolli, O.; Durante, D.; et al. INPOP New Release: INPOP19a. In Proceedings of the Astrometry, Earth Rotation, and Reference Systems in the GAIA Era, Paris, France, 7–9 October 2020; pp. 293–297. [Google Scholar]
- Fienga, A.; Deram, P.; Viswanathan, V.; Ruscio, A.D.; Bernus, L.; Durante, D.; Gastineau, M.; Laskar, J. INPOP19a planetary ephemerides. Notes Sci. Tech. L’institut Mec. Celeste 2019, 109, 1–35. [Google Scholar]
- Shao, K.; Gu, D.; Zhu, J.; Li, M.; Tong, L.; Wei, C. Simulation and accuracy analysis of orbit determination for TianQin using SLR data. Class. Quantum Gravity 2022, 39, 245016. [Google Scholar]
- Zhang, C.; Gao, T.; Cao, Y.; Fan, Z.; Fu, H.; Gu, D.F.; Han, X.; Huang, T.; Kang, L.; Li, K.; et al. The facilities and performance of TianQin laser ranging station. Class. Quantum Gravity 2022, 39, 125005. [Google Scholar] [CrossRef]
- Smith, D.E.; Zuber, M.T.; Neumann, G.A.; Lemoine, F.G.; Mazarico, E.; Torrence, M.H.; McGarry, J.F.; Rowlands, D.D.; Head, J.W.; Duxbury, T.H.; et al. Initial observations from the lunar orbiter laser altimeter (LOLA). Geophys. Res. Lett. 2010, 37, L18204. [Google Scholar] [CrossRef]
- Smith, D.E.; Zuber, M.T.; Neumann, G.A.; Mazarico, E.; Torrence, M.H. Results from the lunar orbiter laser altimeter (LOLA): Global, high resolution topographic mapping of the moon. In Proceedings of the 42nd Lunar and Planetary Science Conference, Woodlands, TX, USA, 7–11 March 2011. [Google Scholar]
- Williams, J.G.; Boggs, D.H.; Folkner, W.M. DE430 Lunar Orbit, Physical Librations and Surface Coordinates; JPL Interoffice Memorandum (Internal Document); Jet Propulsion Laboratory, California Institute of Technology: Pasadena, CA, USA, 2013. [Google Scholar]
- Gastineau, M.; Laskar, J.; Fienga, A.; Manche, H. CALCEPH—Python Language; IMCCE: Paris, France, 2022. [Google Scholar]
- Gläser, P.; Scholten, F.; De Rosa, D.; Figuera, R.M.; Oberst, J.; Mazarico, E.; Neumann, G.A.; Robinson, M.S. Illumination conditions at the lunar south pole using high resolution Digital Terrain Models from LOLA. Icarus 2014, 243, 78–90. [Google Scholar] [CrossRef]
- Zuber, M.T.; Smith, D.E. Topography of the lunar south polar region: Implications for the size and location of permanently shaded areas. Geophys. Res. Lett. 1997, 24, 2183–2186. [Google Scholar] [CrossRef]
- Barker, M.K.; Mazarico, E.; Neumann, G.A.; Smith, D.E.; Zuber, M.T.; Head, J.W. Improved LOLA elevation maps for south pole landing sites: Error estimates and their impact on illumination conditions. Planet. Space Sci. 2021, 203, 105119. [Google Scholar] [CrossRef]
- Bussey, D.B.J.; Fristad, K.E.; Schenk, P.M.; Robinson, M.S.; Spudis, P.D. Constant illumination at the lunar north pole. Nature 2005, 434, 842. [Google Scholar] [CrossRef]
- Mazarico, E.; Neumann, G.A.; Smith, D.E.; Zuber, M.T.; Torrence, M.H. Illumination conditions of the lunar polar regions using LOLA topography. Icarus 2011, 211, 1066–1081. [Google Scholar] [CrossRef]
- Tovar-Pescador, J.; Pozo-Vázquez, D.; Ruiz-Arias, J.A.; Batlles, J.; López, G.; Bosch, J.L. On the use of the digital elevation model to estimate the solar radiation in areas of complex topography. Meteorol. Appl. 2006, 13, 279–287. [Google Scholar] [CrossRef]
- Noda, H.; Araki, H.; Goossens, S.; Ishihara, Y.; Matsumoto, K.; Tazawa, S.; Kawano, N.; Sasaki, S. Illumination conditions at the lunar polar regions by KAGUYA(SELENE) laser altimeter. Geophys. Res. Lett. 2008, 35, 2008GL035692. [Google Scholar] [CrossRef]
- Bussey, D.B.J.; Sorensen, S.-A.; Spudis, P.D. Illumination and temperature modelling of the lunar polar regions. In Proceedings of the 40th Annual Lunar and Planetary Science Conference, Woodlands, TX, USA, 23–27 March 2009. [Google Scholar]
- Cook, A.C.; Spudis, P.D.; Robinson, M.S.; Watters, T.R. Lunar topography and basins mapped using a Clementine stereo digital elevation model. In Proceedings of the 33rd Lunar and Planetary Science Conference, League, TX, USA, 11–15 March 2002. [Google Scholar]
- Gérard, P. IERS Conventions (2010); IERS Conventions Centre: Paris, France, 2010. [Google Scholar]
- Liu, X.W.; Cheng, K. Three-dimensional extension of Bresenham’s algorithm and its application in straight-line interpolation. Proc. Inst. Mech. Eng. Part B J. Eng. Manuf. 2022, 216, 459–463. [Google Scholar] [CrossRef]
- Li, T.; Liu, Y.; Ma, H.; Zhang, P. Line Drawing Method for Low-Resolution Dot Matrix Displays Based on a Uniform Pixel Distribution Strategy. In Proceedings of the 2023 5th International Conference on Frontiers Technology of Information and Computer (ICFTIC), Qingdao, China, 17–19 November 2023; IEEE: Piscataway, NJ, USA, 2023. [Google Scholar]
- Zhang, Y.-X.; Zhang, K.-R.; Wu, C.-H.; Ge, G.-P.; Xu, Y.-A. Comparative analysis of DDA algorithm and Bresenham algorithm. Int. J. Intell. Internet Things Comput. 2022, 1, 263–272. [Google Scholar] [CrossRef]
Disclaimer/Publisher’s Note: The statements, opinions and data contained in all publications are solely those of the individual author(s) and contributor(s) and not of MDPI and/or the editor(s). MDPI and/or the editor(s) disclaim responsibility for any injury to people or property resulting from any ideas, methods, instructions or products referred to in the content. |
© 2024 by the authors. Licensee MDPI, Basel, Switzerland. This article is an open access article distributed under the terms and conditions of the Creative Commons Attribution (CC BY) license (https://creativecommons.org/licenses/by/4.0/).