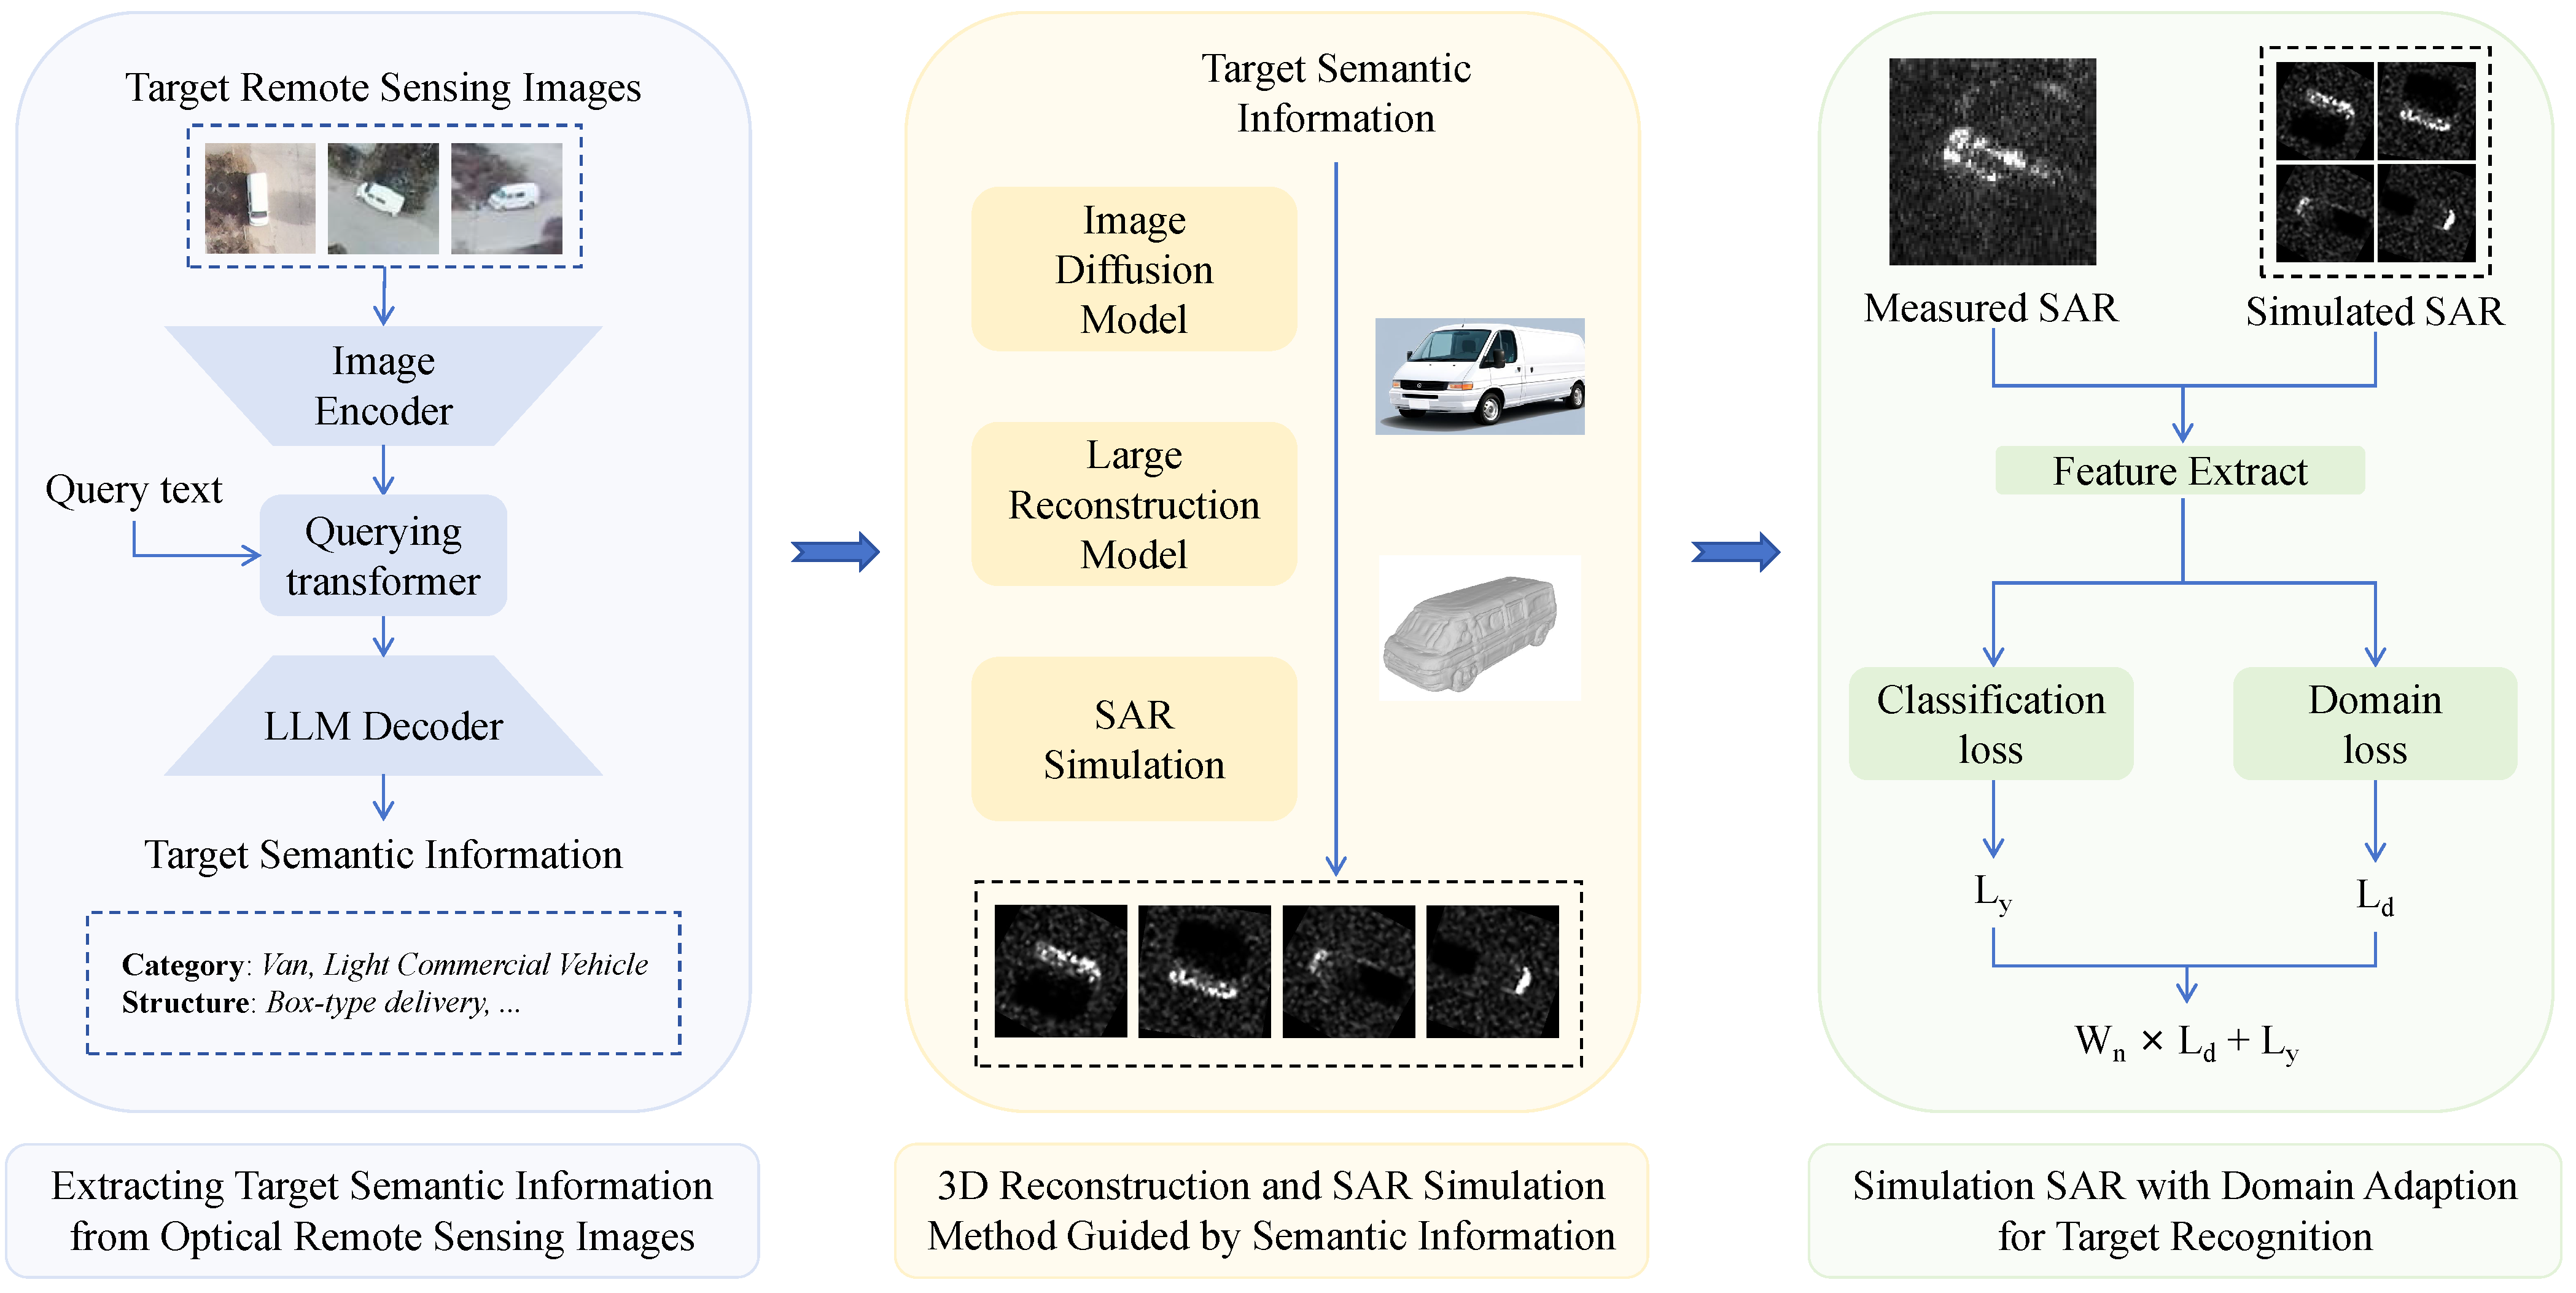
Article

Leveraging Visual Language Model and Generative Diffusion Model for Zero-Shot SAR Target Recognition

College of Electronic Science and Technology, National University of Defense Technology, Changsha 410073, China
*
Author to whom correspondence should be addressed.
Remote Sens. 2024, 16(16), 2927; https://doi.org/10.3390/rs16162927
Submission received: 1 July 2024 / Revised: 1 August 2024 / Accepted: 7 August 2024 / Published: 9 August 2024

Abstract

Simulated data play an important role in SAR target recognition, particularly under zero-shot learning (ZSL) conditions caused by the lack of training samples. The traditional SAR simulation method is based on manually constructing target 3D models for electromagnetic simulation, which is costly and limited by the target’s prior knowledge base. Also, the unavoidable discrepancy between simulated SAR and measured SAR makes the traditional simulation method more limited for target recognition. This paper proposes an innovative SAR simulation method based on a visual language model and generative diffusion model by extracting target semantic information from optical remote sensing images and transforming it into a 3D model for SAR simulation to address the challenge of SAR target recognition under ZSL conditions. Additionally, to reduce the domain shift between the simulated domain and the measured domain, we propose a domain adaptation method based on dynamic weight domain loss and classification loss. The effectiveness of semantic information-based 3D models has been validated on the MSTAR dataset and the feasibility of the proposed framework has been validated on the self-built civilian vehicle dataset. The experimental results demonstrate that the first proposed SAR simulation method based on a visual language model and generative diffusion model can effectively improve target recognition performance under ZSL conditions.

1. Introduction

Synthetic aperture radar (SAR) is an active remote sensing technology with a broad range of applications in both military and civilian fields. SAR is highly regarded for its ability to provide high-quality remote sensing images in all weather conditions and at all times. SAR target recognition has become an integral component of SAR image interpretation. The objective of SAR target recognition is to identify and classify targets of interest, such as vehicles, aircraft, and ships, from SAR data automatically and accurately [1].
Significant advancements have been made in SAR target recognition through the use of deep learning. However, the success of this approach is contingent upon the availability of a substantial amount of high-quality labeled data. The sensitivity of SAR images to various imaging conditions, including wavelength, incidence angle, and, in particular, different observation azimuths, presents a challenge for SAR target recognition. Moreover, the high cost of SAR imaging and the limited azimuth of data obtained further exacerbate the difficulty of sample scarcity. Consequently, SAR target recognition tasks frequently encounter the challenge of limited or even zero target samples for target recognition, a scenario known as zero-shot learning (ZSL) [2,3].
Although ZSL has been extensively studied in the field of natural image classification, research on SAR target recognition under ZSL conditions is relatively limited. Currently, existing ZSL methods can be divided into two types according to the use of unlabeled data in the training stage: the inductive type and the transductive type. The standard for distinguishing between these two methods is whether they can use unlabeled target domain data, which are the measured SAR data to be classified. The inductive type is unable to utilize target domain data, whereas the translational type is capable of utilizing unlabeled target domain data. Under both ZSL conditions, simulated SAR data can serve as the source domain.
It is widely recognized that simulated SAR plays an important role in target recognition because its physical properties are useful, especially under ZSL conditions caused by the lack of training samples in realistic applications [4,5]. With regard to inductive ZSL, Song et al. [6] utilized simulation data of T72 guns to achieve target recognition. Inkawhich et al. [7] achieved completely simulation-based target recognition through the utilization of data augmentation and other methods. Lyu et al. [8], in contrast, employed simulated SAR as the source domain and employed domain adaption methods to narrow the domain shift between simulated SAR and measured SAR domains, thereby achieving target recognition.
Traditional SAR simulation methods mostly rely on the manual construction of target 3D models using prior knowledge bases, followed by electromagnetic simulation [9]. This method has high labor costs and also relies on the target’s prior knowledge bases. In addition, there is also a method of generating simulation images similar to SAR images based on optical images, which is more commonly utilized for the recognition of large-scale targets, such as aircraft and ships and less commonly utilized for the recognition of vehicles [10,11,12]. However, this method does not conform to the principles of SAR imaging. Therefore, this paper focuses on the method of SAR simulation based on 3D models.
The construction of a 3D model for SAR simulation is subject to two fundamental limitations. Firstly, traditional 3D models are manually constructed using a prior knowledge base of the target, without consideration of easily obtainable optical remote sensing images (RSIs). Secondly, SAR simulation methods based on 3D models inevitably result in a “domain shift” between the simulation domain and the measured domain.
The domain shift results in discrepancies between the simulated and measured SAR images with regard to the target structure, background texture, and other characteristics [13]. Furthermore, the distribution of the simulated SAR and measured SAR is inconsistent because it is nearly impossible to construct a 3D model that perfectly matches the structure and details of the real target. The 3D model of the SAR targets is inevitably affected by simplification and errors. For example, the orientation of a military vehicle’s turret or the angle of its barrel can be particularly challenging to ascertain. Furthermore, for civilian targets, it is only possible to distinguish at the level of vehicle type. Achieving consistency at the level of specific brands is challenging. Moreover, SAR images are affected by numerous imaging factors, which makes it challenging to adjust all factors in the simulation process to align with the measurement [7].
Given the difficulty of achieving complete consistency between SAR simulated images and measured images, it is sufficient to consider only the critical features of the target [4]. Under ZSL conditions, some critical features of the target are sufficient to support recognition [13]. For example, distinguishing tank vehicles, infantry vehicles, and anti-aircraft guns, the structural features, the size of the gun turret, and the presence or absence of gun barrels are sufficient. We employ a large visual language pre-trained (VLP) model to extract semantic information, such as target category and target structure features, from the target optical RSIs. This information is then used to generate a coarse-grained 3D model for SAR simulation. In contrast to traditional methods, we do not manually design a fine 3D model using historical images of the target or convert optical RSIs into SAR-like images.
As shown in Figure 1, we extract semantic information from optical RSIs and use multiple generative diffusion models to generate a 3D model of the target for SAR simulation. The SAR simulation method employs the shooting and bouncing rays (SBR) method based on the target 3D model. After obtaining the simulation data, there is still a domain shift between the simulated image and the measured image. We use a domain adaptation method that combines classification loss and domain loss by dynamic weight to narrow the domain shift. The simulated SAR data were used as the source domain, and the measured images served as the target domain, achieving target recognition under ZSL conditions.
This paper makes three contributions to the field of SAR target recognition:
  • We propose a framework for target recognition under ZSL conditions. It extracts semantic information from optical RSIs and transfers it to SAR in order to achieve transductive ZSL target recognition.
  • We leverage the VLP model and multiple diffusion generation models to transition from optical RSIs to 3D models. The semantic information of the target in the optical RSIs is extracted using the VLP model. Subsequently, this information is utilized to generate optical images of the target, thereby achieving more stable and controllable 3D model construction.
  • To narrow the domain shift between simulated SAR and measured SAR, this paper employs a method combining classification loss and domain loss by dynamic weight. The experimental results demonstrate the effectiveness of this method in enhancing target recognition performance on target recognition under transductive ZSL conditions.

2. Related Works

This paper mainly focuses on the research of SAR vehicle target recognition under ZSL conditions. The main process is utilizing semantic information extracted from optical RSIs and converting it into 3D models for SAR simulation. Therefore, this section focuses on the related studies on zero-shot learning in SAR, image captioning in remote sensing, target 3D modeling and SAR simulation methods, and methods for bridging the simulated SAR domain and measured SAR domains.

2.1. Zero-Shot Learning in SAR

SAR target recognition is confronted with the challenge of limited or absent data due to the high cost of SAR data collection and the focus on time-sensitive targets. ZSL is a machine learning technique that aims to classify objects of the target domain by transferring information obtained from the source domain [14]. This is achieved by leveraging the knowledge gained from the source domain to recognize the target domain. ZSL target recognition can be divided into two categories: inductive type and transductive type. In the context of the inductive type, only source domain data can be obtained during the training phase. In contrast, the transductive type allows for the use of both labeled source data and unlabeled target data. In the field of SAR target recognition under ZSL conditions, the source domain can be based on measured SAR data, or alternatively, on simulated SAR images or optical generated SAR-like images.
With regard to inductive ZSL, Wei et al. [15,16], and Ma et al. [17] were able to utilize measured SAR class-level attributes and optical images to construct embedded feature spaces. Song et al. employed simulated T72 data, processing it with a non-essential factor suppression step and then feeding it into a pre-trained convolutional neural network for feature extraction [6].
Transductive ZSL primarily considers the generated SAR images or the synthetic images to be the source domain. The method of generating images based on optical images is primarily utilized for ships and aircraft [10,11,12]. Lyu et al. employed an unsupervised domain adaptation method based on simulation methods to identify three types of targets in simulated data [8]. This paper also applies the domain adaptation method by combining domain loss and classification loss by dynamic weights to achieve target recognition under transductive ZSL conditions.

2.2. Image Captioning in Remote Sensing

Remote sensing image captioning aims to use natural language to describe the content of remote sensing images, including scene descriptions, object attributes, etc. Early remote sensing image analysis mostly relied on models for specific tasks, and universal image captioning techniques can improve adaptability and efficiency across tasks. However, the particularity of remote sensing images, such as land diversity and complex imaging conditions, poses challenges to the generalization ability and accuracy of models [18,19].
The application of VLP models and large language models has yielded considerable success in the fields of natural image and language processing. The potential of these technologies in RSI image captioning is gradually being studied. These large models have a large number of parameters, and the general feature representations learned through large-scale pre-training can effectively improve the performance of image understanding and text generation tasks [20]. The commonly used visual model ViT in VLP models has demonstrated strong image understanding capabilities in the field of remote sensing [21]. Chen et al. used the ViT model to achieve hyperspectral image classification [22]. The Remote CLIP model is a visual language foundational model designed specifically for remote sensing images. It learns text embedding that aligns well with visual features by constructing large-scale image text pair datasets, improving performance in tasks such as scene recognition, image retrieval, and visual question answering [23]. The RSGPT model utilizes large-scale pre-trained data and a decoder for large language models, combined with a visual image encoder, to improve the performance in various remote sensing image understanding tasks [24].
However, the existing RSI image captioning techniques primarily address large scenes and have not yet focused on specific targets, particularly vehicle targets, for image captioning. In order to extract image captioning from RSI, this paper employs VLP to achieve image captioning of vehicle targets.

2.3. Target 3D Modeling and SAR Simulation Method

Using simulated SAR images to assist in target recognition is a common approach. There are generally two methods for simulated SAR images. One is to use generative models or style transfer methods to transform the optical image of the target into a simulated SAR image that is similar to SAR, and is mainly used on larger-scale targets such as airplanes and ships, which have obvious structural characteristics and a large amount of optical data [10,11,12]. However, this method does not conform to the imaging mechanism of SAR.
Another approach is to manually build a target 3D model using target images, optical RSIs, and historical knowledge for SAR simulation. Several commercial and open-source electromagnetic simulation algorithms have emerged for the second method, such as RaySAR [25], CohRaS [26], and SARViz [27]. This paper adopts the idea of constructing a 3D model of the target for electromagnetic simulation.
Traditionally, building 3D models of targets has been a time-consuming and costly task in SAR, often relying on detailed analysis of historical knowledge [28]. With the rapid development of generative diffusion models, especially the emergence of methods like large reconstruction models (LRMs) for 3D reconstruction, the cost of reconstruction has been significantly reduced [29]. Furthermore, DreamFusion utilizes a pre-trained text-to-image diffusion model to guide the optimization of neural radiation fields through a probability density distillation loss function [30]. Similarly, Magic3D accelerates the acquisition of coarse models using low-resolution diffusion models and sparse hash grids and then optimizes the texture grid models using high-resolution latent diffusion models, also achieving high-quality text-guided 3D model generation [31]. Zero-1-to-3 and One-2-3-45 achieved fast 3D object reconstruction from a single image, which suggests they are efficient methods for creating 3D objects from a single 2D image, which is particularly useful for rare or unseen object categories [32,33]. Additionally, Tripo focuses on accelerating the reconstruction process while maintaining consistency across multiple views [34].
Existing LRM models are predominantly constructed using optical images for 3D modeling. The objective of this paper is to construct a 3D model based on the semantic information of the target, which necessitates the utilization of semantic information to reconstruct the optical image of the target. Accordingly, a text-to-image method is necessary.
DALL·E employs a variational auto-encoder and GPT-3 architectural approach for the initial implementation of text-to-image generation [35]. CLIP enhances the text understanding capability of image generation by integrating text and images into a unified vector space [20]. DALL·E 2 employs CLIP to enhance the quality of image generation [36]. Meanwhile, the development of diffusion models has demonstrated enhanced performance in the field of text-to-image generation. The diffusion model introduces noise into the original image, and then the model learns to remove the noise to reconstruct the image [37]. DDIM has achieved successful image generation [38]. Then, stable diffusion was combined with CLIP and DDIM to achieve higher quality-controllable image generation [39].
Based on these studies, this paper also combines the image generative diffusion model with the LRM model to achieve the transformation of target semantic information into the target’s image and then diffusion into 3D models.

2.4. Bridging between Simulated SAR Domain and Measured SAR Domains

As previously mentioned, there exists a gap between the simulated SAR domain and the measured SAR domain, which is referred to as domain shift. SAR images are susceptible to variations in imaging conditions, including the wavelength, incidence angle, and, in particular, different observing azimuths. Consequently, methods are required to address the issue of domain shift [40,41,42,43].
At the feature space level, researchers have explored various transfer learning techniques to mitigate domain shift in simulated images for advancing SAR target recognition. These include fine-tuning, feature transfer, and domain adaptation methods. Fine-tuning methods entail pre-training models on simulated data and subsequently fine-tuning them on limited SAR datasets to swiftly adapt universal features learned from simulation images to SAR recognition tasks [44]. Feature transfer and domain adaptation entail designing specific feature extractors and integrating domain adaptation methods to minimize feature distribution disparities between the simulated and measured domains, thereby achieving effective cross-domain knowledge transfer. Despite demonstrating potential, feature space transfer learning faces unresolved issues [5]. Fine-tuning methods may be constrained by the pre-trained model’s capability to learn SAR-specific features, whereas feature transfer and domain adaptation methods necessitate refined feature engineering designs and targeted adaptation strategies, with the generalization performance of their algorithms requiring further enhancement [6,8].
Given that zero-shot target recognition encompasses inductive ZSL and transductive ZSL, many transfer learning methods, by solely leveraging unlabeled test data, can also be considered as transductive ZSL. For instance, domain adaptation is one such method, among others [14]. This paper specifically investigates domain adaptation methods.

3. Materials and Methods

As illustrated in Figure 1, this paper primarily extracts semantic information from optical RSIs, including key features such as target category and structure. Following the acquisition of the semantic information of the target, it is input into the diffusion generative model to obtain a 3D model of the target, which is then utilized for SAR simulation. Concurrently, in order to compensate for the domain shift between the simulated SAR and measured SAR, domain adaptation methods are employed to achieve target recognition under ZSL conditions. Consequently, the content of this chapter primarily concerns the extraction of semantic information from optical RSIs, 3D reconstruction and SAR simulation guided by semantic information, and simulation SAR with domain adaptation for SAR target recognition.

3.1. Extracting Target Semantic Information from Optical Remote Sensing Image

Semantic information, which includes key features such as target categories and structures, can be used to generate 3D models that include key features of the target. This part outlines the process for obtaining semantic information from optical RSIs.
As shown in Figure 2, in order to extract the semantic information for target recognition from optical RSIs, we used the image captioning method based on VLP and thus could control the output with prompts. A query transformer (Query) structure inspired by BLIP was used to bridge the gap between the visual and language models [45]. The visual model we used is pre-trained ViT-B as the image encoder, and B E R T b a s e as the initialization parameter for Query [21,46]. Next, we trained the Query on the civilian vehicles’ optical RSI dataset we self-built. To preserve the understanding and generation capabilities of the large model, the VLP model was frozen. The Query component was the only trainable element, acting as a lightweight querying transformer. The self-built civilian vehicle optical RSI dataset was the image description dataset used in this paper for four types of civilian vehicle targets, with each target comprising over 100 images and corresponding target descriptions for each type of target. This dataset was used to train Query. Further details on the dataset can be found in the DATASET AND SETTING section.
In the image processing stage, we first resized the input image to 384 × 384 pixels and then used ViT-B to encode it to obtain the feature vectors of the image. In the text processing stage, the prompt text “The vehicle in this photo is” was used, and B E R T b a s e was employed to convert the prompt text and text annotations into 768-dimensional text vectors. Subsequently, the text vector and image feature vector were input into the language model. The loss function utilized was the cross-entropy loss, which can be expressed as
L ( y , y ^ ) = 1 N i = 1 N y i log ( y ^ i )
where L ( y , y ^ ) represents the loss function, y represents the actual caption, y ^ represents the caption generated by the model, and N represents the length of the caption.
In order to minimize the loss function, the Adam W optimizer was employed for parameter updates. Pre-trained visual and language models were utilized to process image and text information, with fine-tuning to fit specific remote sensing datasets. A self-built dataset was employed to train Query, with the prior knowledge of large models successfully utilized to process remote sensing images of civilian vehicle targets and generate descriptive text containing target features. The semantic information of the target is presented in descriptive form, including the target category and optical structure features.

3.2. 3D Reconstruction and SAR Simulation Method Guided by Semantic Information

After obtaining target semantic information including target category and optical structure features, it is necessary to convert it into a 3D model for simulation. In SAR simulation, key target features such as machine guns and barrels, which are optical structure features, have a significant impact on SAR images. The existing methods of text diffusion into 3D models are unable to accurately control key features [30,31,34]. In order to effectively preserve and control the key features of the target, optical reconstruction of the target is introduced as an intermediate step, thereby effectively achieving the preservation of key features of the target in the 3D model.
As shown in Figure 3, the key feature description of the target is first obtained and it is provided as input to the diffusion generation model, achieving optical reconstruction through this step. This paper uses a stable diffusion (SD) model [39], which can generate images containing key features such as target category, structure, and posture based on input prompts. Subsequently, optical reconstructed images containing key features of the target are input into the LRM for 3D model construction. Finally, using SBR technology, SAR simulation is performed on the constructed 3D model to generate SAR simulation images containing key features of the target.
Taking the T72 machine gun as an example, it can be seen from the Figure 3 and Figure 4 that the key features of the target have a significant impact on the simulated image. As indicated by the red circle, when the 3D model has a machine gun, the SAR simulation image obtained clearly has an additional strong scattering center compared to the SAR simulation image without a machine gun, which has a significant impact on target recognition. Therefore, it is necessary to control the key feature of the target.
In order to effectively control the output of the SD using prompt words, we used low-rank adaptation (LoRA) as an efficient fine-tuning method [48]. LoRA achieves efficiency by introducing low-rank matrices to approximate updates to model weights, thereby drastically reducing the parameter count and accelerating training. The weight matrix of a particular layer in the original model is denoted as W R d × d , d signifies the dimensional, and LoRA eschews direct modification of W. Instead, it employs two low-rank matrices, A R d × r and B R r × d , with r d , to construct a correction term Δ W = A · B . Consequently, the adjusted weight matrix can be expressed as
W = W + α · Δ W = W + α · ( A · B )
where α represents a scalar factor that governs the intensity of the LoRA adjustment. After fine-tuning the generated diffusion model through LoRA, a reconstructed image of the target was obtained, which needed to be converted into a 3D model.
LRM incorporates a pre-trained visual transformer, DINO, to encode image features [49], and then projects this onto a 3D triplane representation through an image-to-triplane transformer decoder [50]. This decoder employs cross-attention to map 2D features into 3D space and uses self-attention to model inter-token relationships within the structured triplane, enhancing spatial coherence. The decoder’s output is reshaped and upsampled to yield triplane feature maps, which, when decoded via an MLP, generate color and density values for volumetric rendering, thereby reconstructing the 3D model.
This paper uses TripoSR [34] to convert images into 3D models. The process can be abstracted as follows:
Image Encoder DINO Features Decoder Cross - Attention + Self - Attention Triplane Tokens Reshaping & Upsampling Feature Maps MLP Volume Rendering 3 D Model
After obtaining the target 3D model, we use SBR for SAR simulation [51]. The SBR method is a ray tracing-based technique widely used for analyzing and predicting electromagnetic wave scattering characteristics in complex scenes. The SBR method for simulation involves emitting rays from the radar to represent electromagnetic wave propagation paths, ensuring coverage of the entire scene. When these rays encounter a target object’s surface, their reflection directions are computed based on the surface’s electromagnetic properties and the angle of incidence, with reflection and transmission coefficients factored in. The rays then undergo multiple reflections between objects until their intensity diminishes or they exit the scene, enhancing the accuracy of electromagnetic scattering simulations for complex surfaces.
The physical optics (PO) method is often combined with the SBR method to enhance simulation accuracy. The PO method is based on near-field and far-field approximations of electromagnetic waves and computes electromagnetic scattering from the target surface through integration. The mathematical description of the SBR/PO hybrid method is as follows.
First, define the incident wave vector k i and the surface normal vector n of the target object. When the ray hits the surface, the angle of incidence θ i with respect to the normal vector is given by
cos θ i = k i · n
and then, the reflected wave vector k r can be expressed as
k r = k i 2 ( k i · n ) n
During each reflection, the reflection coefficient Γ and the transmission coefficient τ of the electromagnetic wave are given by the Fresnel equations:
Γ = n 1 cos θ i n 2 cos θ t n 1 cos θ i + n 2 cos θ t
τ = 2 n 1 cos θ i n 1 cos θ i + n 2 cos θ t
where n 1 and n 2 are the refractive indices of the media, and θ t is the angle of transmission. Using these formulas, the iterative calculation of the rays’ multiple reflections on the target object’s surface generates simulation SAR images.
Based on target 3D reconstruction and SAR simulation methods, we have achieved 3D model reconstruction and SAR simulation images guided by key features. As shown in Figure 3, when we control the presence or absence of the “machine gun” during the simulation process, this change can be clearly observed from the optical reconstructed image. Specifically, if the key feature of the machine gun is not included in the input, the generated T72 reconstructed image will not show the machine gun. On the contrary, when this feature is included in the input, details of the machine gun will appear in the corresponding optical reconstruction image. This change is also intuitively reflected in the final 3D reconstruction model.

3.3. Simulation SAR with Domain Adaption for Target Recognition

Maintaining complete consistency in imaging conditions between simulations and actual measurements is nearly impossible for target SAR images. At the same time, there are inevitable errors between the actual models of the 3D model obtained in this paper, leading to the gap between the simulated and real domains. We propose a target recognition method based on joint domain loss and classification loss by dynamic weight to achieve cross-domain SAR target recognition.
We use labeled data in the source domain for supervised learning and obtain the classification loss through a classification task. Then, we use unlabeled data in the source and target domains to evaluate the feature distribution gap between them and obtain the domain loss. As shown in Figure 5, after obtaining the classification loss L y and domain loss L d , they are combined to jointly optimize the feature extractor of the network. The formula can be abstracted as
L = L y + λ L d
L d = D i s t a n c e ( D s , D t )
where λ is a constant. D s is unlabeled data from the source domain, D t is unlabeled data from the target domain, and D i s t a n c e is a function that distinguishes the distance between D s and D t .
However, constant λ cannot dynamically reflect the changes in classification loss L y and domain loss L d as training progresses. Given the shortcomings of the fixed weight strategy mentioned above, we introduce dynamic weight instead of λ for domain loss L d , which dynamically adjusts with increasing training batches and can more accurately match the training process, improving the overall performance of unsupervised domain adaptation. The dynamic weight W n can be abstracted as
W n = W n 1 × 1.1 , if W < 10 W i n i , Otherwise
herein, the subscript n signifies the epoch within the training process, with W n representing the weight parameter at the epoch n. W i n i is the initial value assigned to the weight. This formulation introduces a dynamic mechanism that adjusts the weight W in accordance with the progression of training epochs, thus dynamically adjusting the impact of domain loss L d on the training process.
We employed several methods, such as BNM (Batch Nuclear-norm Maximization) [52], Deep CORAL (Correlation Alignment) [53], and DANN (Domain Adversarial Neural Networks) [54] as the distance function. From the experimental results, it has been proven that this dynamic weighting can enhance the network’s recognition and domain adaptation capabilities, thereby improving its cross-domain SAR target recognition performance.
The framework proposed in this paper mainly includes the SAR simulation part and the ZSL target recognition part. The following formula is a summary of the SAR simulation section.
Optical RSIs Image caption Semantic Information Stable Diffusion Target Reconstruction Image LRM Target 3 D Model SBR SAR simulation
After extracting the target semantic information from the optical remote sensing images using the image captioning method, the key features of the target are transformed into optical reconstructed images, thereby achieving controllable 3D modeling of key features. The SBR method is employed for the simulation of SAR data with a target 3D model. A domain adaptation method based on dynamic weights is employed to minimize the domain shift between the simulated SAR and measured SAR data, thereby achieving transductive ZSL target recognition.

4. Dataset and Setting

4.1. Datasets for Target Recognition

The moving and stationary target acquisition and recognition (MSTAR) dataset comprises X-band SAR images with a resolution of 0.3 m × 0.3 m, encompassing ten categories of vehicle targets [55]. To evaluate the effectiveness of the SAR simulation proposed in this paper, the simulated data in the SAMPLE dataset were employed for comparison. The SAMPLE dataset contains data on five vehicle types that overlap with the MSTAR dataset: 2S1, BTR70, BMP2, T72, and ZSU23-4 [9]. The relevant information is displayed in Figure 6.
The civilian vehicle target dataset used to validate the proposed method was obtained by imaging four civilian vehicle targets using a rotary wing drone equipped with an SAR imaging system, as shown in Figure 6. The data include HH, HV, VH, and VV polarization modes in the X-band, as well as optical data of the targets. Each target is surrounded every 10° to form 36 images, with four polarization modes for each imaging, which means each target has 144 measured SAR images.
The sample numbers of MSTAR, SAMPLE, and our dataset are listed in Table 1, Table 2 and Table 3.

4.2. Dataset for Fine-Tune

This paper necessitates the training of two modules: the Query module of the VLP model, which is used to extract semantic information from RSIs, and the SD model, which is used to generate the target image. As described in the subsequent experimental section, experiments were conducted on military and civilian vehicles. Due to the difficulty in obtaining optical RSIs of military targets, this study directly achieved 3D modeling and SAR simulation of military vehicle targets based on semantic information. For civilian vehicles, the entire process of extracting target semantic information from optical RSIs and conducting SAR simulation is included. It can be seen from Figure 7 that the military vehicle targets only used dataset (a), while the civilian vehicles used datasets (b) and (c).
As shown in Figure 7, dataset (a) is a military vehicle dataset used to fine-tune the SD model. This includes over 100 images for each category, 2S1, BTR70, BMP2, T72, and ZSU23-4, as well as corresponding feature texts. For example, when generating images, the target category was “T72, tank”, the target structure was “machine gun, unresponsive armor, tracks”, and the target attitude was “vehicle focus, side view”.
Dataset (b) and dataset (c) represent the dataset of civilian vehicle targets. Dataset (b) is employed to train Query in order to extract the requisite semantic information from optical RSIs. This includes target categories such as “Box trucks” and “Dongfeng”, as well as key features such as “three-axle wheels, detachable carriages, military” and “motor vehicles”. Dataset (c) is employed to fine-tune the SD model, which encompasses four target categories: box trucks, dump trucks, rollers, and box trucks. Each category is represented by over 100 images and corresponding feature texts. For instance, the feature text for box trucks includes the target category “Box trucks, Dongfeng”, and the target structural features “detachable carriages, three-axle wheels”. Dataset (b) comprises optical RSIs of civilian vehicles, which have been used to train an image captioning model for the extraction of target semantic information from optical remote sensing images. Dataset (c) is primarily composed of optical close-range images of civilian vehicles, which have been used to train SD models, thereby enabling the generation of target optical reconstructed images from semantic information for 3D reconstruction.

4.3. Experiment Platform and Setting

The experiments were performed on an Intel i9-12900k CPU and NVIDIA RTX 3090 GPU, using the PyTorch platform with Python version 3.8 and CUDA 11.6. The VLP model and the stable diffusion model were fine-tuned using a Tesla V100.
We selected a stochastic gradient descent (SGD) optimizer during the training process in target recognition. The learning rate was set to 0.001, and the momentum parameter was fixed at 0.9. To ensure reproducibility and control for random initialization effects, a deterministic seed value of 3407 was established for all the stochastic processes within the experiments. The SAR images here have been resized to a size of 128 × 128 in all the experiments.

5. Experiment and Results

In order to evaluate the effectiveness of the simulation method proposed in this paper and verify the effectiveness of the framework we proposed for SAR target recognition under ZSL conditions based on optical RSIs, this section is divided into the following three parts:
  • Target Semantic Information Diffusion to 3D Model and SAR Simulation: This part focuses on five types of targets for MSTAR, achieving 3D model construction and SAR simulation guided by target key features in semantic information, and comparing and analyzing with measured SAR. This is intended to verify the reliability and effectiveness of the SAR simulation data obtained by the proposed method.
  • Simulation SAR with Domain Adaptation For SAR Target Recognition: This part aims to explore the effectiveness of the proposed classification loss domain adaptation method and dynamic weighted domain loss strategy in alleviating the domain offset problem between simulated SAR and measured SAR. We have also successfully achieved SAR target recognition capability under zero sample conditions.
  • Civilian Vehicle SAR Target Recognition: This part will apply the methods proposed in this paper to specific application scenarios. On the dataset we collected, semantic information from optical RSIs was extracted for SAR simulation on civilian vehicle targets, followed by target recognition under ZSL conditions. This part directly tests the performance and feasibility of the proposed method in practical and specific target category recognition tasks.

5.1. Target Semantic Information Diffusion to 3D Model and SAR Simulation

Because it is difficult to obtain optical RSIs of military vehicle targets to extract semantic information, we manually set the key feature of target semantic information here. Figure 8 shows the key feature, generated images, and 3D models of the 2S1, T72, and ZSU234. Figure 8 also depicts the SAR simulated images generated based on these 3D models, with imaging angles spanning 0–180°. This reflects the ability of trained SD models to generate images based on key feature descriptions and can be used to construct target 3D models through an LRM.
The multiple-view images of the obtained target 3D model demonstrate that the generative diffusion model can generate a 3D model that is visually similar to the target. For example, complex structures such as the turrets, barrels, and tracks of the target will exhibit pronounced scattering effects on SAR images, which can be observed to have achieved satisfactory restoration. Additionally, the visual effect observed in the obtained simulation images is comparable to that of SAMPLE’s simulated images and also highly analogous to the measured images from MSTAR. For vehicle targets, targets with strong reflections and shadows caused by imaging mechanisms are very important features. Taking 2S1 as an illustration, Figure 9 compares the SAMPLE simulation image, the simulation image obtained in this paper, and the MSTAR measured image. It can be seen that at similar imaging angles, the target (the left) and the shaded (the right) have very similar visual features.
The cosine similarity can effectively measure the degree of difference between two samples. In Figure 10, eight different imaging azimuths of 2S1 were selected from SAMPLE and the SAR data we simulated; we calculated the cosine similarity with 299 measured samples from MSTAR, and plotted them. Although the simulation data generated in this paper have slightly lower similarity values than those of the SAMPLE data (the average similarity of SAMPLE is 0.7435, and the average similarity of this paper’s simulation is 0.7154), it can be seen from Figure 10 that the similarity between the two is similar in distribution. Although the similarity between SAMPLE and our simulated images is relatively low, at around 70°, 145°, and 225°, compared to the actual measured images, the overall distribution indicates a high degree of similarity.
For SAR images, the quality of the image itself is also very important. The equivalent number of looks (ENL) and the radiometric resolution (RadRe) are important indicators for evaluating the quality of SAR images.
The ENL reflects the intensity of speckle noise in SAR images. The smaller the ENL, the lower the speckle noise contained in the image, and the higher the image quality. The ENL can be calculated using the following formula:
ENL = μ 2 σ 2
where μ is the mean intensity of the image, and σ 2 is the variance of the intensity.
The RadRe is an indicator used to measure the grayscale resolution of SAR images, which distinguishes the backscattering coefficient of targets by describing the radiation quality of each pixel. The formula for calculating RadRe can be expressed as
RadRe = 10 × log 10 σ μ + 1
where μ and σ are consistent with the previous text.
As indicated in Table 4, the quality of SAR simulation images can be evaluated. The values in the table are averages, which are calculated separately for each image and then averaged. The ENL is a measure of the intensity of speckle noise in an image, with higher values indicating lower noise levels but also indicating lower image contrast. RadRe quantifies the grayscale resolution of an image, with higher values indicating more detailed grayscale information. It can be observed that in comparison to SAMPLE, the values of the simulation images are analogous to those of MSTAR. In contrast to the SAMPLE, the images exhibit a lower ENL and a higher RadRe, indicating that although the images display a higher level of noise, they also demonstrate enhanced contrast and better quality.
Consequently, it can be proved that converting semantic information into a 3D model for SAR simulation through generative diffusion models is a viable approach, capable of producing SAR simulation images that are similar to measured SAR images.

5.2. Simulation SAR with Domain Adaptation for SAR Target Recognition

The previous analysis examined the simulated SAR obtained by the method proposed in this paper from a visual perspective. The following analysis examines the gain of the measured SAR target recognition from the simulated SAR.

5.2.1. Directly Training under ZSL Condition

In order to explore the potential of simulated SAR images under ZSL conditions, this study focuses on SAR images of five types of targets, and trains and evaluates their classification performance on measured data directly using simulated data. The selected network is ResNet50, and two simulation data sources were compared: simulation images from the SAMPLE dataset and SAR images simulated using the method proposed in this paper.
Figure 11 shows four confusion matrices, which are the results of training directly with ResNet50 and training with DANN. Although the direct training of simulation data can achieve an accuracy of 37.80% and 38.59%, the confusion matrix shows the limitations of using simulation data directly. The network tends to classify most samples into one or two categories rather than correctly classifying the data. This is due to the domain shift between the simulated and measured SAR images.
The t-SNE (t-distributed Stochastic Neighbor Embedding) visualization analysis can better display this issue [56]. In the MSTAR measured data, even with changes in imaging angles (such as 15° and 17°), the data of the same target can still be well clustered together, indicating the consistency of the measured data in feature distribution. As shown in Figure 12a, there is not only a clear domain gap between the simulation data and its corresponding measured samples but also the measured images of all targets exhibit tight clustering, forming a significant distinction from the simulation images, highlighting the common domain gap problem between the simulated and measured data. This issue has occurred on both the SAMPLE and the data simulated by method we proposed. Therefore, it is necessary to use domain usage methods to narrow the domain shifts.

5.2.2. Training with Domain Adaption under ZSL Conditions

As shown in the Table 5, this paper uses three different distance functions between source domain D s and target domain D t for domain adaptation. Specifically, we have selected BNM, Deep Coral, and DANN, which were trained using the SAMPLE dataset and our simulation SAR data. The weight among them, λ , refers to the weight parameters in Equation (8), and W i n i refers to the weight parameter dynamic weight we used. BNM, Deep CORAL, and DANN, as distance functions, measure different distances between the source and target domains. This paper compares these distance functions. BNM maximizes the nuclear norm of the batch output matrix, enhancing prediction discriminability and diversity. Deep Coral minimizes domain discrepancy by aligning the covariance of source and target domains, reducing domain shift, and promoting domain agnosticism. It employs a Siamese network with Coral discrepancy metrics between streams. DANN extracts features and inputs them into a classifier and domain discriminator, which are trained with a gradient reversal layer to identify source domain features [52,53,54].
From the Table 5, it can be seen that different distance functions have different effects on λ . The performance is also different; for example, BNM’s accuracy decreases as the weight increases, while the accuracy of Deep Coral and DANN does not. The dynamic weight method proposed in this paper can achieve a better performance than that with fixed weights when the initial value is 10. Therefore, the domain adaptation method with dynamic weights is also used to train our simulation SAR. Analyzing the training results, it can be seen that DANN can achieve the best performance, reaching 51.81% and 50.31% for five types of targets. From the confusion matrix, it can be seen that after domain training, the network did not classify all the samples into one or two categories like direct training, but did indeed learn the correct features for classification. By visualizing the feature vectors processed by dynamic DANN, it can be seen that they can be mixed together and effectively achieve a narrow domain shift.
As illustrated in Figure 12b, the network with domain adaptation is able to extract features from both simulated and measured data. The impact of domain shift has been significantly reduced, and the domain distance has narrowed. This not only demonstrates the effectiveness of the SAR simulation method we proposed but also verifies the effectiveness of the domain adaptation method for dynamic weights in this paper.

5.3. Civilian Vehicle SAR Target Recognition

This part verifies the full framework process of extracting target semantic information from optical RSIs and generating them into 3D models for SAR simulation on a civilian vehicle dataset. At the same time, domain adaptation methods are also used to achieve target recognition under ZSL conditions. The dataset used for training is shown in Figure 6 and the datasets used for fine-tuning are shown in Figure 7.

5.3.1. Extracting Semantic Information from Optical RSIs for SAR Simulation

As shown in Figure 13, semantic information containing target categories and key features can be extracted from optical RSIs, which can then be used to generate the 3D model of the target. It can be seen that the generated model is visually similar to the real target. Figure 14 shows the comparison of the SAR simulated images and measured images. In contrast to MSTAR, the measured data of civil vehicles used in this paper exhibit poor imaging quality and is characterized by a considerable degree of noise. Conversely, the simulated images are devoid of noise. However, due to the relatively simple structural composition of civilian vehicles, which lacks the complex scattering structures commonly found in military vehicles, such as gun barrels and machine guns, the simulated images and measured images obtained in this paper exhibit comparable structural features. From the Figure 14, it can be seen that the simulation data and the measured data are very similar in terms of the target structure. Furthermore, the experiments have demonstrated that high-quality simulation data can still yield gains in low-quality measured SAR target recognition.

5.3.2. Simulation SAR with Domain Adaption for Target Recognition

Table 6 shows the results of directly training the simulation data and testing the measured data under ZSL conditions. Ten iterations of training were conducted for each of the following classic networks: ConvNeXt-T, Vgg19, AlexNet, and ResNet50 [57,58,59,60]. Each iteration of training lasts 100 epochs. The average accuracy is the average ± standard deviation of the accuracy of the ten iterations. The training parameters are shown in the table. In contrast to MSTAR, which employs direct training of simulation data but does not result in an enhanced recognition accuracy, the direct training of simulation data for civilian vehicles has been demonstrated to effectively improve the recognition accuracy. From the four confusion matrices on the right side of Figure 15, it can be seen that several classic networks have learned effective features and have not been classified into one or two categories. The ResNet network has the best classification performance among them. The four confusion matrices on the right side of the figure represent ConvNeXt-T, Vgg19, AlexNet, and ResNet50, respectively. The confusion matrix originates from the testing result that is closest to the average of ten testing results.
As shown in Table 7, on the basis of the ResNet50 network, using the domain adaptation method based on domain loss and classification loss proposed in this paper, the accuracy directly increased from about 63.72% to 80.35%.
From the results, it can also be seen that domain adaptation does not necessarily lead to an improvement in the performance of the network; for example, BNM and DeepCoral do not perform better than direct training under all weights λ . This is mainly because civilian vehicles have a simple structure, and direct training can achieve reasonable results. Also, different distance functions and weights λ need to be dynamically combined to achieve good results. The dynamic weighting method we proposed in this paper significantly improves the accuracy.

6. Conclusions

This paper proposes an innovative framework to address the challenge of zero-shot learning in SAR target recognition. It utilizes the rich semantic information in optical remote sensing images and transfers it to the SAR domain through 3D modeling and SAR simulation methods. In particular, this study employs VLP models to extract target semantic information in optical RSIs and transfers it to 3D models through generative diffusion models. This method is not only fast and convenient, but also provides a new approach for SAR simulation starting from optical RSIs. The experimental results demonstrate that the simulation images obtained by our method are visually similar to those obtained by traditional methods. Moreover, the domain adaptation method is used to narrow the inevitable domain shift between the simulation domain and the measured domain in order to perform target recognition under ZSL conditions and further measure the quality of the simulation data in this paper. The results demonstrate that the domain adaptation method proposed in this paper significantly enhances the performance of SAR target recognition. Furthermore, the simulation data in this paper also display a similar performance to the simulation data obtained from finely constructed models. However, the proposed framework is currently limited to vehicles, and in the future, we will consider extending it to targets of interest for SAR, such as aircraft and ships. We believe that the method we proposed to extract semantic information from optical RSIs for target reconstruction and SAR simulation can effectively improve the accuracy of target recognition on other targets as well.

Author Contributions

Conceptualization, J.W.; methodology, J.W.; software, J.W.; validation, J.W.; writing—original draft preparation, J.W.; supervision, H.S. and T.T.; project administration, L.L. and K.J.; data processing, Q.H.; visualization, Y.S.; literature collection, J.W. All authors have read and agreed to the published version of the manuscript.

Funding

This work was supported by the National Natural Science Foundation of China under Grant Number 61971426, the Natural Science Foundation of Hunan Province of China under Grant Number 2024JJ6466, and the Postdoctoral Fellowship Program of CPSF under Grant Number GZC20233545.

Data Availability Statement

The original contributions presented in the study are included in the article, further inquiries can be directed to the corresponding author.

Acknowledgments

The authors would like to thank the reviewers and editors who provided valuable comments and suggestions for this article.

Conflicts of Interest

The authors declare no conflicts of interest.

References

  1. Li, J.; Yu, Z.; Yu, L.; Cheng, P.; Chen, J.; Chi, C. A comprehensive survey on SAR ATR in deep-learning era. Remote Sens. 2023, 15, 1454. [Google Scholar] [CrossRef]
  2. Chen, S.; Wang, H.; Xu, F.; Jin, Y.Q. Target classification using the deep convolutional networks for SAR images. IEEE Trans. Geosci. Remote Sens. 2016, 54, 4806–4817. [Google Scholar] [CrossRef]
  3. Song, Q.; Xu, F. Zero-shot learning of SAR target feature space with deep generative neural networks. IEEE Geosci. Remote Sens. Lett. 2017, 14, 2245–2249. [Google Scholar] [CrossRef]
  4. Huang, Z.; Wu, C.; Yao, X.; Zhao, Z.; Huang, X.; Han, J. Physics inspired hybrid attention for SAR target recognition. Isprs J. Photogramm. Remote Sens. 2024, 207, 164–174. [Google Scholar] [CrossRef]
  5. Lv, X.; Qiu, X.; Yu, W.; Xu, F. Simulation Aided SAR Target Classification via Dual Branch Reconstruction and Subdomain Alignment. IEEE Trans. Geosci. Remote Sens. 2023, 61, 5214414. [Google Scholar] [CrossRef]
  6. Song, Q.; Chen, H.; Xu, F.; Cui, T.J. EM Simulation-Aided Zero-Shot Learning for SAR Automatic Target Recognition. IEEE Geosci. Remote Sens. Lett. 2019, 17, 1092–1096. [Google Scholar] [CrossRef]
  7. Inkawhich, N.; Inkawhich, M.J.; Davis, E.K.; Majumder, U.K.; Tripp, E.; Capraro, C.; Chen, Y. Bridging a gap in SAR-ATR: Training on fully synthetic and testing on measured data. IEEE J. Sel. Top. Appl. Earth Obs. Remote Sens. 2021, 14, 2942–2955. [Google Scholar] [CrossRef]
  8. Lyu, X.; Qiu, X.; Yu, W.; XU, F. Simulation-assisted SAR target classification based on unsupervised domain adaptation and model interpretability analysis. J. Radars 2022, 11, 168–182. [Google Scholar]
  9. Lewis, B.; Scarnati, T.; Sudkamp, E.; Nehrbass, J.; Rosencrantz, S.; Zelnio, E. A SAR dataset for ATR Development: The Synthetic and Measured Paired Labeled Experiment (SAMPLE). In Proceedings of the Algorithms for Synthetic Aperture Radar Imagery XXVI, Baltimore, MD, USA, 18 April 2019; Zelnio, E., Garber, F.D., Eds.; SPIE: Bellingham, WA, USA, 2019; p. 17. [Google Scholar] [CrossRef]
  10. Song, Y.; Li, J.; Gao, P.; Li, L.; Tian, T.; Tian, J. Two-Stage Cross-Modality Transfer Learning Method for Military-Civilian SAR Ship Recognition. IEEE Geosci. Remote Sens. Lett. 2022, 19, 1–5. [Google Scholar] [CrossRef]
  11. Shi, Y.; Du, L.; Guo, Y.; Du, Y. Unsupervised Domain Adaptation Based on Progressive Transfer for Ship Detection: From Optical to SAR Images. IEEE Trans. Geosci. Remote Sens. 2022, 60, 1–17. [Google Scholar] [CrossRef]
  12. Li, H.; Xu, F.; Yang, W.; Yu, H.; Xiang, Y.; Zhang, H.; Xia, G.S. Learning to Find the Optimal Correspondence Between SAR and Optical Image Patches. IEEE J. Sel. Top. Appl. Earth Obs. Remote Sens. 2023, 16, 9816–9830. [Google Scholar] [CrossRef]
  13. Zhang, X.; Feng, S.; Zhao, C.; Sun, Z.; Zhang, S.; Ji, K. MGSFA-Net: Multiscale Global Scattering Feature Association Network for SAR Ship Target Recognition. IEEE J. Sel. Top. Appl. Earth Obs. Remote Sens. 2024, 17, 4611–4625. [Google Scholar] [CrossRef]
  14. Pourpanah, F.; Abdar, M.; Luo, Y.; Zhou, X.; Wang, R.; Lim, C.P.; Wang, X.Z.; Wu, Q.M.J. A Review of Generalized Zero-Shot Learning Methods. IEEE Trans. Pattern Anal. Mach. Intell. 2023, 45, 4051–4070. [Google Scholar] [CrossRef] [PubMed]
  15. Wei, Q.R.; He, H.; Zhao, Y.; Li, J.A. Learn to Recognize Unknown SAR Targets From Reflection Similarity. IEEE Geosci. Remote Sens. Lett. 2022, 19, 1–5. [Google Scholar] [CrossRef]
  16. Wei, Q.R.; Chen, C.Y.; He, M.; He, H.M. Zero-shot SAR target recognition based on classification assistance. IEEE Geosci. Remote Sens. Lett. 2023, 20, 1–5. [Google Scholar] [CrossRef]
  17. Ma, Y.; Pei, J.; Zhang, X.; Huo, W.; Zhang, Y.; Huang, Y.; Yang, J. An Optical Image-Aided Approach for Zero-Shot SAR Image Scene Classification. In Proceedings of the 2023 IEEE Radar Conference (RadarConf23), San Antonio, TX, USA, 1–4 May 2023; pp. 1–6. [Google Scholar]
  18. Silva, J.D.; Magalhães, J.; Tuia, D.; Martins, B. Large Language Models for Captioning and Retrieving Remote Sensing Images. arXiv 2024, arXiv:2402.06475. [Google Scholar]
  19. Zhao, K.; Xiong, W. Exploring region features in remote sensing image captioning. Int. J. Appl. Earth Obs. Geoinf. 2024, 127, 103672. [Google Scholar] [CrossRef]
  20. Radford, A.; Kim, J.W.; Hallacy, C.; Ramesh, A.; Goh, G.; Agarwal, S.; Sastry, G.; Askell, A.; Mishkin, P.; Clark, J.; et al. Learning transferable visual models from natural language supervision. In Proceedings of the International Conference on Machine Learning, PMLR, Virtual, 18–24 July 2021; pp. 8748–8763. [Google Scholar]
  21. Dosovitskiy, A.; Beyer, L.; Kolesnikov, A.; Weissenborn, D.; Zhai, X.; Unterthiner, T.; Dehghani, M.; Minderer, M.; Heigold, G.; Gelly, S.; et al. An image is worth 16x16 words: Transformers for image recognition at scale. arXiv 2020, arXiv:2010.11929. [Google Scholar]
  22. Chen, Y.; Yan, Q. LFSMIM: A Low-Frequency Spectral Masked Image Modeling Method for Hyperspectral Image Classification. IEEE Geosci. Remote Sens. Lett. 2024, 21, 5502705. [Google Scholar] [CrossRef]
  23. Liu, F.; Chen, D.; Guan, Z.; Zhou, X.; Zhu, J.; Ye, Q.; Fu, L.; Zhou, J. RemoteCLIP: A Vision Language Foundation Model for Remote Sensing. arXiv 2023, arXiv:2306.11029. [Google Scholar] [CrossRef]
  24. Hu, Y.; Yuan, J.; Wen, C.; Lu, X.; Li, X. RSGPT: A Remote Sensing Vision Language Model and Benchmark. arXiv 2023, arXiv:2307.15266. [Google Scholar]
  25. Auer, S.; Bamler, R.; Reinartz, P. RaySAR-3D SAR simulator: Now open source. In Proceedings of the 2016 IEEE International Geoscience and Remote Sensing Symposium (IGARSS), Beijing, China, 10–15 July 2016; pp. 6730–6733. [Google Scholar]
  26. Hammer, H.; Schulz, K. Coherent simulation of SAR images. In Proceedings of the Image and Signal Processing for Remote Sensing XV, Berlin, Germany, 31 August–3 September 2009; Volume 7477, pp. 406–414. [Google Scholar]
  27. Balz, T.; Stilla, U. Hybrid GPU-based single-and double-bounce SAR simulation. IEEE Trans. Geosci. Remote Sens. 2009, 47, 3519–3529. [Google Scholar] [CrossRef]
  28. Ødegaard, N.; Knapskog, A.O.; Cochin, C.; Louvigne, J.C. Classification of ships using real and simulated data in a convolutional neural network. In Proceedings of the 2016 IEEE Radar Conference (RadarConf), Philadelphia, PA, USA, 2–6 May 2016; pp. 1–6. [Google Scholar]
  29. Hong, Y.; Zhang, K.; Gu, J.; Bi, S.; Zhou, Y.; Liu, D.; Liu, F.; Sunkavalli, K.; Bui, T.; Tan, H. Lrm: Large reconstruction model for single image to 3d. arXiv 2023, arXiv:2311.04400. [Google Scholar]
  30. Poole, B.; Jain, A.; Barron, J.T.; Mildenhall, B. Dreamfusion: Text-to-3d using 2d diffusion. arXiv 2022, arXiv:2209.14988. [Google Scholar]
  31. Lin, C.H.; Gao, J.; Tang, L.; Takikawa, T.; Zeng, X.; Huang, X.; Kreis, K.; Fidler, S.; Liu, M.Y.; Lin, T.Y. Magic3d: High-resolution text-to-3d content creation. In Proceedings of the IEEE/CVF Conference on Computer Vision and Pattern Recognition, Vancouver, BC, Canada, 17–24 June 2023; pp. 300–309. [Google Scholar]
  32. Liu, R.; Wu, R.; Van Hoorick, B.; Tokmakov, P.; Zakharov, S.; Vondrick, C. Zero-1-to-3: Zero-shot one image to 3d object. In Proceedings of the IEEE/CVF International Conference on Computer Vision, Paris, France, 2–6 October 2023; pp. 9298–9309. [Google Scholar]
  33. Liu, M.; Shi, R.; Chen, L.; Zhang, Z.; Xu, C.; Wei, X.; Chen, H.; Zeng, C.; Gu, J.; Su, H. One-2-3-45++: Fast single image to 3d objects with consistent multi-view generation and 3d diffusion. In Proceedings of the IEEE/CVF Conference on Computer Vision and Pattern Recognition, Seattle, WA, USA, 17–21 June 2024; pp. 10072–10083. [Google Scholar]
  34. Tochilkin, D.; Pankratz, D.; Liu, Z.; Huang, Z.; Letts, A.; Li, Y.; Liang, D.; Laforte, C.; Jampani, V.; Cao, Y.P. Triposr: Fast 3d object reconstruction from a single image. arXiv 2024, arXiv:2403.02151. [Google Scholar]
  35. Ramesh, A.; Pavlov, M.; Goh, G.; Gray, S.; Voss, C.; Radford, A.; Chen, M.; Sutskever, I. Zero-Shot Text-to-Image Generation. arXiv 2021, arXiv:2102.12092. [Google Scholar]
  36. Ramesh, A.; Dhariwal, P.; Nichol, A.; Chu, C.; Chen, M. Hierarchical Text-Conditional Image Generation with CLIP Latents. arXiv 2022, arXiv:2204.06125. [Google Scholar]
  37. Cao, H.; Tan, C.; Gao, Z.; Xu, Y.; Chen, G.; Heng, P.A.; Li, S.Z. A survey on generative diffusion models. IEEE Trans. Knowl. Data Eng. 2024, 36, 2814–2830. [Google Scholar] [CrossRef]
  38. Song, J.; Meng, C.; Ermon, S. Denoising diffusion implicit models. arXiv 2020, arXiv:2010.02502. [Google Scholar]
  39. Rombach, R.; Blattmann, A.; Lorenz, D.; Esser, P.; Ommer, B. High-resolution image synthesis with latent diffusion models. In Proceedings of the IEEE/CVF Conference on Computer Vision and Pattern Recognition, New Orleans, LA, USA, 18–24 June 2022; pp. 10684–10695. [Google Scholar]
  40. Huang, Z.; Pan, Z.; Lei, B. What, where, and how to transfer in SAR target recognition based on deep CNNs. IEEE Trans. Geosci. Remote Sens. 2019, 58, 2324–2336. [Google Scholar] [CrossRef]
  41. Peng, J.; Huang, Y.; Sun, W.; Chen, N.; Ning, Y.; Du, Q. Domain adaptation in remote sensing image classification: A survey. IEEE J. Sel. Top. Appl. Earth Obs. Remote Sens. 2022, 15, 9842–9859. [Google Scholar] [CrossRef]
  42. Rostami, M.; Kolouri, S.; Eaton, E.; Kim, K. Deep transfer learning for few-shot SAR image classification. Remote Sens. 2019, 11, 1374. [Google Scholar] [CrossRef]
  43. Ru, L.; Lingjun, Z.; Qishan, H.; Kefeng, J.; Gangyao, K. Intelligent technology for aircraft detection and recognition through SAR imagery: Advancements and prospects. J. Radars 2023, 13, 307–330. [Google Scholar]
  44. Wang, K.; Zhang, G.; Leung, H. SAR target recognition based on cross-domain and cross-task transfer learning. IEEE Access 2019, 7, 153391–153399. [Google Scholar] [CrossRef]
  45. Li, J.; Li, D.; Xiong, C.; Hoi, S. Blip: Bootstrapping language-image pre-training for unified vision-language understanding and generation. In Proceedings of the International conference on machine learning. PMLR, Baltimore, MD USA, 17–23 July 2022; pp. 12888–12900. [Google Scholar]
  46. Turc, I.; Chang, M.W.; Lee, K.; Toutanova, K. Well-read students learn better: On the importance of pre-training compact models. arXiv 2019, arXiv:1908.08962. [Google Scholar]
  47. Wikipedia Contributors. T-72 Tank at CFB Borden—Wikimedia Commons. Available online: https://commons.wikimedia.org/wiki/File:T72_cfb_borden_1.JPG (accessed on 26 July 2024).
  48. Hu, E.J.; Shen, Y.; Wallis, P.; Allen-Zhu, Z.; Li, Y.; Wang, S.; Wang, L.; Chen, W. Lora: Low-rank adaptation of large language models. arXiv 2021, arXiv:2106.09685. [Google Scholar]
  49. Caron, M.; Touvron, H.; Misra, I.; Jégou, H.; Mairal, J.; Bojanowski, P.; Joulin, A. Emerging properties in self-supervised vision transformers. In Proceedings of the IEEE/CVF International Conference on Computer Vision, Montreal, BC, Canada, 11–17 October 2021; pp. 9650–9660. [Google Scholar]
  50. Chan, E.R.; Lin, C.Z.; Chan, M.A.; Nagano, K.; Pan, B.; De Mello, S.; Gallo, O.; Guibas, L.J.; Tremblay, J.; Khamis, S.; et al. Efficient geometry-aware 3d generative adversarial networks. In Proceedings of the IEEE/CVF Conference on Computer Vision and Pattern Recognition, New Orleans, LA, USA, 18–24 June 2022; pp. 16123–16133. [Google Scholar]
  51. He, X.Y.; Zhou, X.Y.; Cui, T.J. Fast 3D-ISAR image simulation of targets at arbitrary aspect angles through nonuniform fast Fourier transform (NUFFT). IEEE Trans. Antennas Propag. 2012, 60, 2597–2602. [Google Scholar] [CrossRef]
  52. Cui, S.; Wang, S.; Zhuo, J.; Li, L.; Huang, Q.; Tian, Q. Towards discriminability and diversity: Batch nuclear-norm maximization under label insufficient situations. In Proceedings of the IEEE/CVF Conference on Computer Vision and Pattern Recognition, Seattle, WA, USA, 13–19 June 2020; pp. 3941–3950. [Google Scholar]
  53. Sun, B.; Saenko, K. Deep coral: Correlation alignment for deep domain adaptation. In Computer Vision–ECCV 2016 Workshops: Amsterdam, The Netherlands, October 8–10 and 15–16, 2016, Proceedings, Part III 14; Springer: New York, NY, USA, 2016; pp. 443–450. [Google Scholar]
  54. Ganin, Y.; Lempitsky, V. Unsupervised domain adaptation by backpropagation. In Proceedings of the International Conference on Machine Learning, PMLR, Lille, France, 7–9 July 2015; pp. 1180–1189. [Google Scholar]
  55. Diemunsch, J.R.; Wissinger, J. Moving and stationary target acquisition and recognition (MSTAR) model-based automatic target recognition: Search technology for a robust ATR. In Proceedings of the Algorithms for Synthetic Aperture Radar Imagery V, Orlando, FL, USA, 13–17 April 1998; SPIE: Bellingham, WA, USA, 1998; Volume 3370, pp. 481–492. [Google Scholar]
  56. Van der Maaten, L.; Hinton, G. Visualizing data using t-SNE. J. Mach. Learn. Res. 2008, 9, 2579–2605. [Google Scholar]
  57. Liu, Z.; Mao, H.; Wu, C.Y.; Feichtenhofer, C.; Darrell, T.; Xie, S. A convnet for the 2020s. In Proceedings of the IEEE/CVF Conference on Computer Vision and Pattern Recognition, New Orleans, LA, USA, 18–24 June 2022; pp. 11976–11986. [Google Scholar]
  58. Karen, S. Very deep convolutional networks for large-scale image recognition. arXiv 2014, arXiv:1409.1556. [Google Scholar]
  59. Krizhevsky, A.; Sutskever, I.; Hinton, G.E. ImageNet classification with deep convolutional neural networks. Commun. ACM 2017, 60, 84–90. [Google Scholar] [CrossRef]
  60. He, K.; Zhang, X.; Ren, S.; Sun, J. Deep residual learning for image recognition. In Proceedings of the IEEE Conference on Computer Vision and Pattern Recognition, Las Vegas, NV, USA, 27–30 June 2016; pp. 770–778. [Google Scholar]
Figure 1. Framework of our method.
Remotesensing 16 02927 g001
Figure 2. Extracting target semantic information from optical remote sensing image.
Remotesensing 16 02927 g002
Figure 3. Target semantic information diffusion to 3D model (example image of T-72 tank from Wikimedia Commons [47]).
Remotesensing 16 02927 g003
Figure 4. The influence of target key features on SAR simulation.
Remotesensing 16 02927 g004
Figure 5. Simulation SAR with domain adaption for target recognition.
Remotesensing 16 02927 g005
Figure 6. The dataset used in this paper: (a) MSTAR, (b) civilian vehicle dataset.
Remotesensing 16 02927 g006
Figure 7. Dataset for fine-tuning: (a) military vehicle fine-tuning set, (b) civilian vehicle semantic extraction set, (c) civilian vehicle fine-tuning set.
Remotesensing 16 02927 g007
Figure 8. Generating 3D models based on target semantic information.
Remotesensing 16 02927 g008
Figure 9. Comparison between simulated SAR and measured SAR, the target and shadow are circled with red lines respectively.
Remotesensing 16 02927 g009
Figure 10. Cosine similarity between simulated and measured images. (a) SAMPLE. (b) Our simulated SAR.
Remotesensing 16 02927 g010
Figure 11. Confusion matrix for five types of military targets. (a) SAMPLE simulated SAR direct training. (b) Our simulated SAR direct training. (c) SAMPLE simulated SAR with DANN- W n . (d) Our simulated SAR with DANN- W n .
Remotesensing 16 02927 g011
Figure 12. t-SNE of five types of military targets. (a) SAMPLE simulated SAR direct training. (b) SAMPLE simulated SAR with DANN- W n .
Remotesensing 16 02927 g012
Figure 13. Generating 3D models of civilian vehicles using target semantic information.
Remotesensing 16 02927 g013
Figure 14. A comparison of the measured and simulated SAR of civilian vehicles (the top column is the measured image, and the bottom column is the simulated image).
Remotesensing 16 02927 g014
Figure 15. Confusion matrix of SAR civilian vehicle target recognition. (a) DANN- W n . (b) Confusion matrix of ConvNeXt-T. (c) Confusion matrix of Vgg19. (d) Confusion matrix of AlexNet. (e) Confusion matrix of ResNet50.
Remotesensing 16 02927 g015
Table 1. MSTAR dataset.
MSTAR Serial N°2S1 (b01)BMP2 (SN_9563)BTR70 (SN_C71)T72 (SN_132)ZSU23-4 (d08)
number274195196196274
Table 2. SAMPLE dataset.
SAMPLE2S1BMP2BTR70T72ZSU23-4
qpm-synth17410792108174
Table 3. Our dataset.
Civil VehicleBox TruckDump TruckRoad RollerVan
SAR sample144144144144
Table 4. The ENL and RadRe of SAR images.
ENL2S1BMP2BTR70T72ZSU23-4
MSTAR1.301.791.951.250.60
SAMPLE3.684.124.623.413.45
My simulation1.211.421.321.211.23
RadRe2S1BMP2BTR70T72ZSU23-4
MSTAR2.772.482.372.823.68
SAMPLE1.831.751.661.881.88
My simulation2.822.662.732.822.80
Table 5. Accuracy of simulated SAR with domain adaption.
MethodsData for TrainWeight λ Weight W ini 2S1BMP2BTR70T72ZSU23-4Overall Accuracy (%)
BNMSAMPLE1/54.155.1378.0621.4349.6443.08
BNMSAMPLE5/16.7917.9586.7352.550.0031.19
BNMSAMPLE10/11.687.1863.2771.9410.5829.96
Deep CoralSAMPLE1/68.615.1362.7637.7829.9342.03
Deep CoralSAMPLE5/71.538.7266.3334.1833.5844.23
Deep CoralSAMPLE10/34.3129.7458.1641.3337.5939.65
DANNSAMPLE1/63.1410.7730.1035.7136.8637.36
DANNSAMPLE5/54.7411.7964.8044.390.0034.10
DANNSAMPLE10/36.5011.7963.2748.4739.7839.74
BNMSAMPLE/1027.373.0879.5961.7375.9149.87
Deep CoralSAMPLE/1033.2121.0363.2750.5161.6846.17
DANNSAMPLE/1058.0340.5123.9853.5772.2651.81
BNMMy simulation/106.5712.8274.494.0889.0538.85
Deep CoralMy simulation/1029.5634.8737.2470.9223.3637.44
DANNMy simulation/1019.7144.1039.8065.8281.7550.31
Table 6. The results of the SAR civilian vehicle target recognition by directly training.
ModelsEpochIterationAverage Accuracy (%)
ConvNeXt-T1001024.22 ± 1.63
Vgg191001062.01 ± 6.71
AlexNet1001059.51 ± 3.77
ResNet501001063.72 ± 1.86
Table 7. The results of the SAR civilian vehicle target recognition training with domain adaptation.
MethodsWeight λ Weight W ini Box TruckDump TruckRoad RollerVanOverall Accuracy (%)
BNM1/85.4213.890.6972.2243.06
BNM5/84.7279.8659.7236.1165.10
BNM10/51.3997.9259.728.3354.34
Deep Coral1/94.4440.9723.6190.2864.58
Deep Coral5/89.5838.8945.8381.2563.89
Deep Coral10/90.9754.1728.4774.3161.98
DANN1/84.7279.8665.9783.3378.47
DANN5/82.6475.0063.1981.2575.52
DANN10/85.4255.5652.7884.7269.62
BNM/1084.7254.1738.8993.0667.71
Deep Coral/1087.5061.1159.7287.5073.96
DANN/1093.7582.6459.7284.0380.35
Disclaimer/Publisher’s Note: The statements, opinions and data contained in all publications are solely those of the individual author(s) and contributor(s) and not of MDPI and/or the editor(s). MDPI and/or the editor(s) disclaim responsibility for any injury to people or property resulting from any ideas, methods, instructions or products referred to in the content.

