Article

Predicting Particle Size and Soil Organic Carbon of Soil Profiles Using VIS-NIR-SWIR Hyperspectral Imaging and Machine Learning Models

by
Karym Mayara de Oliveira
1,
João Vitor Ferreira Gonçalves
1,
Renato Herrig Furlanetto
2,*,
Caio Almeida de Oliveira
1,
Weslei Augusto Mendonça
1,
Daiane de Fatima da Silva Haubert
1,
Luís Guilherme Teixeira Crusiol
3,
Renan Falcioni
1,
Roney Berti de Oliveira
1,
Amanda Silveira Reis
1,
Arney Eduardo do Amaral Ecker
4 and
Marcos Rafael Nanni
1
1
Department of Agronomy, State University of Maringa, Av. Colombo, 5790, Maringa 87020-900, Parana, Brazil
2
Gulf Coast Research and Education Center, University of Florida, Wimauma, FL 33598, USA
3
Embrapa Soja (Empresa Brasileira de Pesquisa Agropecuária), Londrina 86044-764, Parana, Brazil
4
Department of Agronomy, Centro Universitário Ingá (UNINGÁ), Rod. PR 317, 6114, Maringa 87035-510, Parana, Brazil
*
Author to whom correspondence should be addressed.
Remote Sens. 2024, 16(16), 2869; https://doi.org/10.3390/rs16162869
Submission received: 7 June 2024 / Revised: 30 July 2024 / Accepted: 2 August 2024 / Published: 6 August 2024
(This article belongs to the Special Issue Remote Sensing for Soil Environments)

Abstract

Modeling spectral reflectance data using machine learning algorithms presents a promising approach for estimating soil attributes. Nevertheless, a comprehensive investigation of the most effective models, parameters, wavelengths, and data acquisition techniques is essential to ensure optimal predictive accuracy. This work aimed to (a) explore the potential of the soil spectral signature obtained in different spectral bands (VIS-NIR, SWIR, and VIS-NIR-SWIR) and, by using hyperspectral imaging and non-imaging sensors, in the predictive modeling of soil attributes; and (b) analyze the accuracy of different ML models in predicting particle size and soil organic carbon (SOC) applied to the spectral signature of different spectral bands. Six soil monoliths, located in the central north region of Parana, Brazil, were collected and scanned via hyperspectral cameras (VIS-NIR camera and SWIR camera) and spectroradiometer (VIS-NIR-SWIR) in the laboratory. The spectral signature of the soils was analyzed and subsequently applied to ML models to predict particle size and SOC. Each set of data obtained by the different sensors was evaluated separately. The algorithms used were k-nearest neighbors (KNN), support vector machine (SVM), random forest (RF), linear regression (LR), artificial neural network (NN), and partial least square regression (PLSR). The most promising predictive performance was observed for the complete VIS-NIR-SWIR spectrum, followed by SWIR and VIS-NIR. Meanwhile, KNN, RF, and NN models were the most promising algorithms in estimating soil attributes for the dataset obtained from both sensors. The general mean R2 (determination coefficient) values obtained using these models, considering the different spectral bands evaluated, were around 0.99, 0.98, and 0.97 for sand prediction, and around 0.99, 0.98, and 0.96 for clay prediction. The lower performances, obtained for the datasets from both sensors, were observed for silt and SOC, with R2 results between 0.40 and 0.59 for these models. KNN demonstrated the best predictive performance. Integrating effective ML models with robust sample databases, obtained by advanced hyperspectral imaging and spectroradiometers, can enhance the accuracy and efficiency of soil attribute prediction.

1. Introduction

Soil particle size has a crucial implication in the physical, chemical, and biological characteristics of soil, strongly influencing important properties such as soil structure, water and thermal regime, nutrient accessibility to plants, diversity of microorganisms, plant growth, and soil quality [1,2]. In parallel, quantifying soil organic carbon (SOC) is crucial as it influences various soil properties, including fertility, water retention, and structural stability. Additionally, SOC management has significant global implications and has become a key public policy focus in recent years [3,4], particularly in the context of efforts to reduce carbon emissions. Measuring these properties is one of the tools used in interpreting soil characteristics and defining efficient management practices, optimizing soil use combined with the preservation of this natural resource.
Currently, the most used method in Brazil for measuring particle size is the pipette and densimeter method, and the Walkley–Black method is mainly used to determine SOC [5]. Although these methods are accurate and standardized, they require investments in reagents that are eventually discarded and could pollute the environment. Moreover, they demand significant labor and time for sampling and analysis. In this context, several authors have studied applications of VIS-NIR-SWIR (visible, near infrared, and shortwave infrared) spectroscopy techniques in determining particle size [6,7,8] and SOC [6,9], as well as determining other soil attributes that are also important tools for adequate soil management, such as water content [10,11], determination of iron oxides [12], and even classification of soil orders and suborders [13,14,15].
Attributes of the soil directly influence its spectral signature due to its interaction with the electromagnetic radiation (EMR) emitted into the soil by a light source. The interaction can result in EMR reflectance, absorbance, and even absorption characteristics at specific points in the spectral signature, depending on the interaction component [1]. This interaction process allows soil characterization and attribute estimation through soil spectral reflectance [1,16,17].
Spectral signatures modeled using machine learning (ML) algorithms with robust mathematical components have been studied as a tool for predicting soil attributes. In this context, Sorenson et al. (2018) [18] verified the accuracy of RF (random forest) applied to VIS-NIR-SWIR spectra in SOC prediction and found an R2 of 0.96. Cezar et al. (2021) [19] evaluated VIS-NIR-SWIR spectra using a non-imaging sensor and partial least square regression (PLSR) model for soil organic matter (SOM) prediction. These authors obtained an R2 of 0.86 in the data calibration and 0.30 in the prediction stage. With this same objective, Reis et al. (2021) [20] obtained VIS-NIR-SWIR spectra using an image sensor and modeled via PLSR, resulting in an R2 of 0.75 in the SOM prediction. Xu et al. (2021) [21] performed predictive models of total nitrogen (TN) and microbial nitrogen (MBN) using VIS-NIR spectra and the models support vector machine (SVM), PLSR, RF, k-nearest neighbor (KNN), artificial neural networks (ANN), cubist regression tree (Cubist) and extreme gradient boosting (XGBoost), and obtained R2 values between 0.85 and 0.94 for TN and between 0.34 and 0.61 for MBN using these models. The authors Srisomkiew et al. (2021) [22] estimated pH, SOM, P, K, Ca, Mg, Fe, Cu, Mn, and Zn using multiple linear regression (MLR) and VIS-NIR-SWIR satellite images and found R2 values between 0.50 and 0.79 for these soil attributes. Zolfaghari et al. (2022) [23] applied RF and SVM to spectral signatures and obtained R2 values of 0.91, 0.56, and 0.72 for predicting sand, silt, and clay, respectively.
Evaluating the performance of different predictive ML models using different spectral bands and a varied database can guide the selection of models whose mathematical composition promotes better performance when applied to the prediction of soil attributes. This model selection can save time and budget, as well as speed up the development of promising predictive techniques. However, most research works bring results from a few models applied to data from one or a few hyperspectral sensors, which may limit the comparison and selection of the most promising models for soil databases. Furthermore, verifying the behavior of data obtained by imaging and non-imaging sensors can benefit the understanding of the influence of data acquisition methods on the generated models.
In this context, this work aimed to (a) explore the potential of the soil spectral signature obtained in different spectral bands and, by imaging (VIS-NIR and SWIR sensors) and non-imaging (VIS-NIR-SWIR) sensors, in the predictive modeling of soil attributes; and (b) analyze the accuracy of different ML models applied to the spectral signature of different spectral bands in predicting particle size and SOC, to promote the selection of the most promising models and verify the effectiveness of the method in supporting analytical techniques for measuring soil attributes.

2. Material and Methods

2.1. Sample Collection and Preparation

Six soil monoliths measuring 0.12 m × 1.60 m were collected between March 2022 and January 2023 from soil profiles located in the north-central region of Paraná, Brazil (Figure 1). The profiles were previously classified according to the SiBCS (Brazilian System of Soil Classification) and soil taxonomy standards [24] (Table 1). The collection points were determined based on obtaining the main soil classes in the region [25].
The AK, TK, and THL soils were obtained in the border region between the Paranapanema formation, characterized by thick and inflated basalt flows, and the Goio Erê formation, characterized by fine to very fine subarcosean sandstones [25]. TE, KE, and AU were found between the Paranapanema and Pitanga formations, characterized by pahoehoe basalt flows and a large amount of iron oxides, especially hematite, characteristic of the region.
From the six monoliths, a total of 95 soil samples were collected every 10 cm depth to determine SOC content, and a total of 190 soil samples were collected every 5 cm depth to determine particle size (sand, silt, and clay) (Table 1). SOC results were obtained using the Walkley–Black method, while particle size was analyzed via the pipette method and wet sieving using 0.1 mol L−1 NaOH as a dispersing agent [5]. The attributes sand, silt, clay, and SOC significantly influence the spectral reflectance of soils [1,13,26,27]. Therefore, in this work, we performed the prediction of these attributes based on the spectral signature.

2.2. Spectroscopic Measurement and Preprocessing

2.2.1. VIS-NIR and SWIR Spectral Measurements by Imaging Sensors

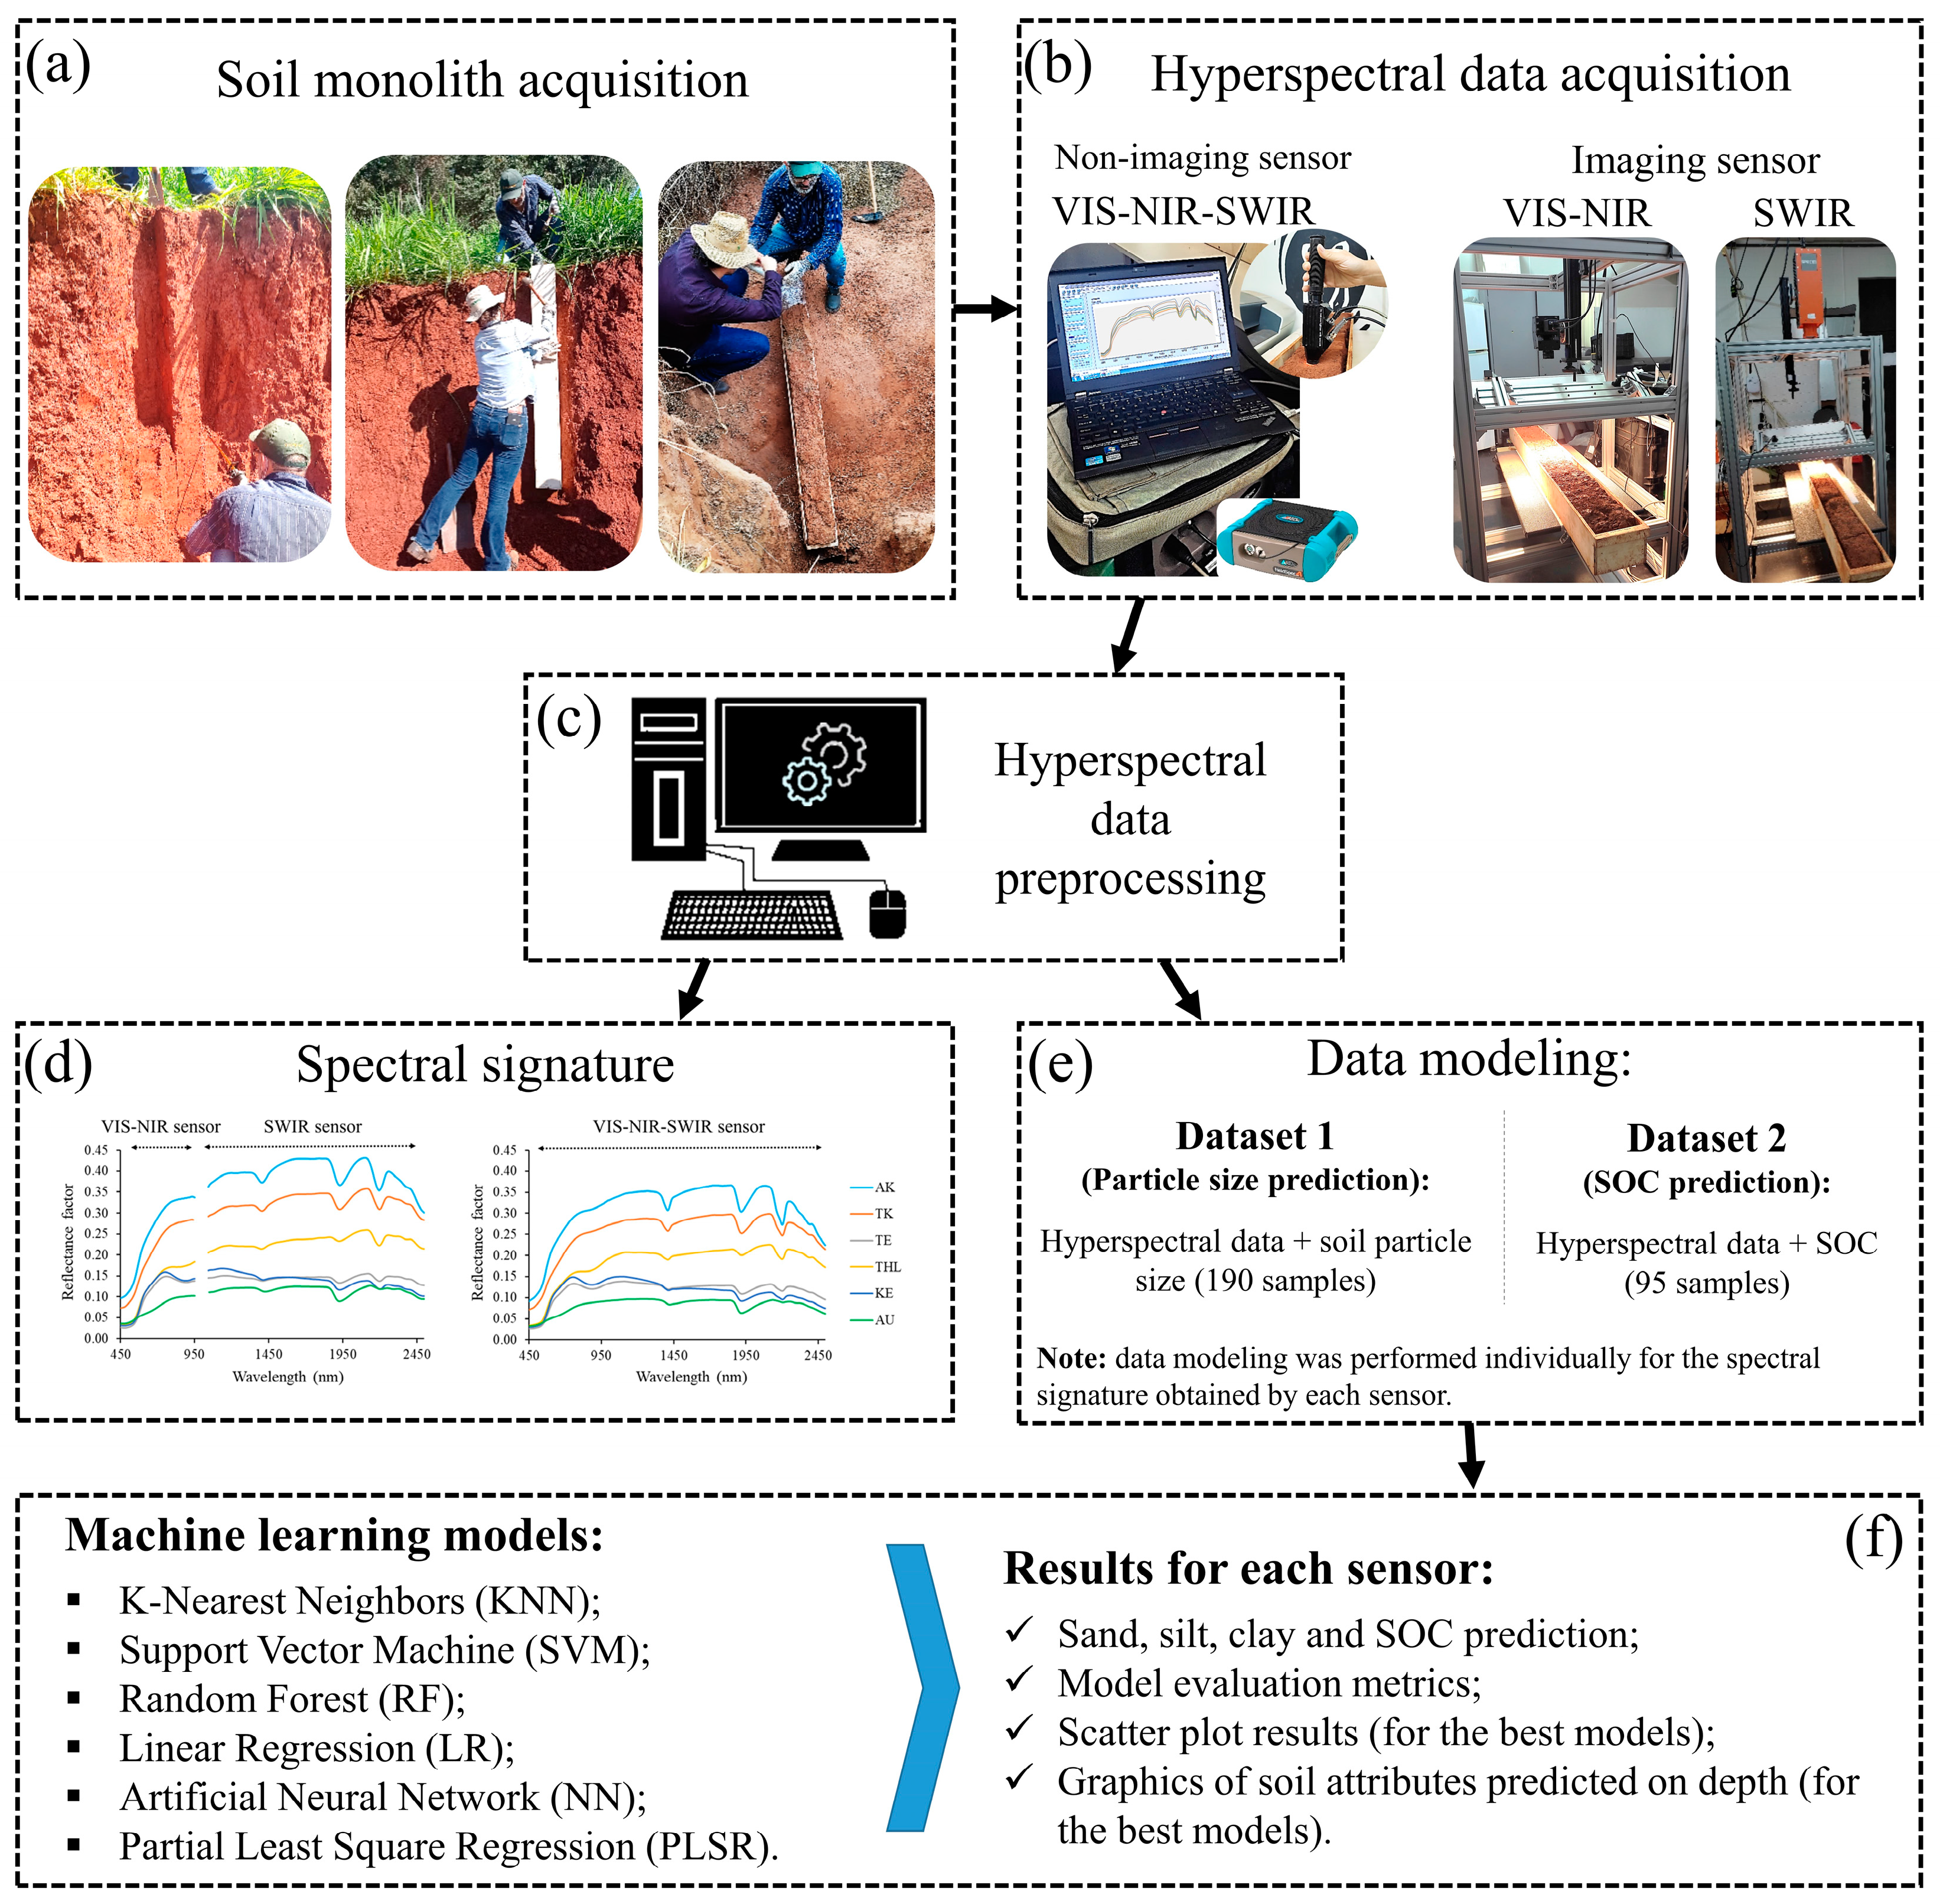
After air-drying the monoliths, the monoliths were scanned using hyperspectral cameras in the laboratory, as shown in Figure 2. For this purpose, a metallic platform (Single Core Scanner) was used, consisting of support for the camera and a conveyor belt controlled by remote control. The speed of the conveyor belt varied depending on the camera used and their respective frame configurations. The sensors used to obtain hyperspectral images were a Headwall Photonics® (Bolton, MA, USA) VIS-NIR hyperspectral camera (400 to 1000 nm, 823 bands) and a SWIR Spectral Imaging hyperspectral camera (1000 to 2500 nm, 272 bands). The height configuration of the camera about the soil monolith varied according to the FOV (field of view) of each sensor, interpreted according to the verification of the image transmitted by the equipment screen.
The images obtained in digital numbers were converted to reflectance using the “Scan normalization” plugin added to the ENVI software version 5.3 (Exelis Visual Information Solutions, Inc., Boulder, CO, USA). The plugin works with the “White Reference” standards obtained from the Spectralon standard plate (Labsphere®, North Sutton, NH, USA) and “Dark Reference” provided by the sensor system, and returns the spectral image in reflectance. This process is necessary to ensure that images accurately reflect the intrinsic properties of objects, regardless of capture conditions, providing a solid foundation for reliable analyses and comparisons. Then, spectral reflectance samples were collected from the monoliths using the ROI (Region of Interest) tool in the ENVI 5.3 software (Exelis Visual Information Solutions, Inc.). With this tool, polygons were generated at every 5 cm deep in each soil profile to relate these spectra with the particle size samples obtained at this same depth, resulting in 190 polygons. We also generated polygons at every 10 cm depth in each soil profile to relate the spectrum to the SOC samples obtained at this same depth in the soil profile, resulting in 95 polygons. SOC did not present abrupt differences along the profile; therefore, soil samples and, consequently, spectral samples were obtained at greater spacing than those for particle size. Each polygon is composed of a substantial number of pixels, from which the mean reflectance was obtained, resulting in a spectral signature value for each polygon at different wavelengths.
The monoliths were scanned individually. Furthermore, the spectral signature results obtained by each of the sensors were evaluated separately, resulting in the estimation of soil attributes using the VIS-NIR sensor and the estimation of soil attributes using the SWIR sensor. Spectral signature graphs were also generated for each of the suborders and sensors used.

2.2.2. VIS-NIR-SWIR Spectral Measurements by Non-Imaging Sensor

Spectral signature samples were collected at every 5 cm depth in each soil profile to correlate with the particle size samples obtained at this same depth (n = 190). Spectral signature samples were also collected every 10 cm deep in each soil profile to relate to the SOC samples (n = 95). These data were obtained through the ASD Fieldspec 3 Jr Spectroradiometer (350 to 2500 nm), using the ASD Contact Probe accessory connected to the Fieldspec by a fiber optic cable, which standardizes the incident radiation, eliminating interference from external light through its light source (Figure 2) [28]. The Spectralon plate (Labsphere®) was used as a reflectance reference.
Spectral data (radiance format) were processed and converted to reflectance, according to Equation (1), in ViewSpec PRO® v6.2 software (Analytical Spectral Devices, Inc., Boulder, CO, USA). Then, graphs were generated for the visual analysis of the spectral signature of each suborder.
R e f l e c t a n c e   ( ρ ) = S o i l   r a d i a n c e L a m b e r t i a n   r a d i a n c e

2.3. Data Modeling

Prediction of Soil Attributes Based on ML Models and Spectral Signature Obtained by Imaging Sensors and Non-Imaging Sensor

The spectral signature (all bands available by the sensors) and particle size results obtained from each soil monolith at different depths were combined into a single dataset to generate robust models, resulting in dataset 1 (n = 190 for particle size). The same was conducted for SOC, generating dataset 2 (n = 95 for SOC). These two datasets were generated for each of the sensors used in this work (imaging VIS-NIR, imaging SWIR, and non-imaging VIS-NIR-SWIR), and the attribute prediction results were evaluated separately for each sensor.
The spectral signatures of the datasets obtained from all sensors were pre-processed with Savitzky–Golay filter (polynomial order 2 and window 7) and Gaussian smoothing, as well as the preprocessing based on the requirements of each learner (a process performed by the software).
Analysis of outliers was performed using Hotteling’s T2 and Leverage test (p ≤ 0.05), as reported by Furlanetto et al. (2024) [29], utilizing The Unscrambler X version 10.4 software (CAMO Software, Oslo, Norway). Posteriorly, ML models were applied to spectral signatures to predict soil attributes by performing the leave-one-out cross-validation method. For each model used, variations of the hyperparameters were tested to achieve the highest possible accuracy while avoiding overfitting.
The pre-processing and soil attributes prediction was conducted in the Orange Data Mining software version 3.32.0 [30] and in The Unscrambler® X version 10.4 software (CAMO Software, Norway), depending on the availability of the model in each software. The tables and graphs of the results were generated with the assistance of Excel 2016 version. The following ML models used were the following:
K-nearest neighbors (KNN) is a machine learning technique that uses a distance metric to find the k most similar instances in the training data for a new instance and takes the mean outcome of the neighbors as the prediction [31];
Support vector machine (SVM) is a binary classifier that adjusts the position of the dividing line between classes based on sample vectors [31,32], separating the attribute space with a hyperplane, thus maximizing the margin between the instances of different classes or class values;
Random forest (RF) is a nonlinear algorithm that builds a binary tree from training data, leading to a single prediction. Each tree is developed from a bootstrap sample from the training data. Initially, the data are subdivided into two subsets using a single-feature k and a threshold tk. Then, the subset is divided using the same logic and continues subdividing the data until reaching the maximum depth selected in the algorithm parameters [31,33,34];
Linear regression (LR): the variables to be input into this model must meet the prerequisites of having a Gaussian distribution, being relevant to the output variable, and not being highly correlated with each other (a problem called collinearity) (Brownlee, 2016). A linear model predicts by simply computing a weighted sum of the input features plus a constant called the bias term (also called the intercept term) [33];
Artificial neural network (NN): inspired by biological neural networks, NNs are composed of units that combine multiple binary inputs and produce a single output [33,35].
Partial least square regression (PLSR): PLSR models matrices X and Y simultaneously to find the latent variables (also called principal components) in X that best predict the latent variables in Y [32,36]. This regression method provides a model with an equation expressed by the regression coefficients, from which the predicted Y values are calculated.
The performance of the models was evaluated using the root mean square error (RMSE), ratio of performance to deviation (RPD), and coefficient of determination (R2) parameters. RMSE indicates the mean error in estimating data using the same unit of measurement as the measured attribute. RPD is the ratio between the attribute’s standard deviation and the RMSE related to the attribute’s prediction [37], and R2 brings the percentage of how much the result can be explained by the model. For interpretation, lower values in RMSE and higher values in R2 indicate the quality of the model obtained [38,39]. For RPD, models with RPD values greater than 2 indicate that they can be used accurately for prediction. Models with RPD values between 1.4 and 2 are satisfactory but need to be improved, while models with an RPD less than 1.4 have low or no predictive capacity [40]. In addition, graphs were presented with the prediction results of attributes at different sampling depths, and for each soil monolith, were reported from the models generated via the most promising learners.

3. Results

3.1. Descriptive Analysis of Soil Spectral Behavior

The mean spectral signature of each soil suborder obtained by the VIS-NIR and SWIR hyperspectral imaging sensors and by the VIS-NIR-SWIR non-imaging sensor is presented in Figure 3. Analyzing the spectral reflectance, it is noted that the spectra obtained by imaging and non-imaging sensors are homogeneous, presenting similar spectral behavior trends for each suborder, and showing very close reflectance factor values. This behavior is expected given the calibration of the sensors with the standard White Reference plate.
In Figure 3, it can also note great variability in the overall reflectance between the suborders. This fact occurs due to the differences in particle size between these soils. The suborders AK, TK, and THL have the highest albedo values, respectively, as well as the highest sand contents (Table 1) in relation to the other suborders. Meanwhile, TE, KE, and AU have the highest clay contents (Table 1) and lowest albedo values.
Soil organic matter (SOM) and, consequently, SOC also have a great influence on the spectral signature of soils. This fact can be noted by observing the spectral reflectance of the AU suborder. Despite having clay content very similar to suborder KE, AU presents SOC content twice as high as KE in the topsoil horizon, a fact that resulted in a spectral signature with greater reflectance absorption for AU when compared to KE.

3.2. Soil Attributes Prediction Based on ML Models and VIS-NIR Hyperspectral Reflectance Obtained by Imaging Sensor

The performance of the ML models in the soil attribute prediction can be analyzed through the indicators found in Table 2. For the sand prediction, an R2 above 0.84 was obtained, indicating that the predictive results obtained were precisely explained using the models. The RPD oscillated between 1.84 and 5.80, demonstrating that the LR model could be improved, while the others presented satisfactory accuracy in predicting this attribute. As for RMSE, it resulted in a predictive error of 8.22, 10.23, and 12.74 g kg−1 for the SVM, PLSR, and LR models, while for KNN, RF, and NN, the error was 3.87, 5.80, and 7.15 g kg−1, indicating better performance for these last three models when it comes to sand prediction.
In the scatter plot of data measured versus predicted using the model (Figure 4), it is possible to visually check the performance of the most promising models (KNN, RF, and NN) in predicting sand. As seen in Figure 4 and the statistical parameters (Table 2), KNN was the most promising model among the evaluated models for sand prediction.
For silt, R2 values obtained ranged between 0.24 and 0.56. Furthermore, the errors observed in attribute prediction (RMSE) were between 1.35 and 1.77 g kg−1. The values observed for RPD were between 1.03 and 1.20. The results observed for these parameters indicate the low performance of the models in predicting silt, and for this reason, a silt scatterplot comparing measured versus predicted samples was not presented.
Analyzing clay, R2 values between 0.88 and 0.98 for PLSR and KNN were obtained, respectively. The observed RMSE values were 8.84, 10.59, and 12.69 g kg−1 for the SVM, PLSR, and LR models, while the lowest prediction errors were 4.07, 6.13, and 6.28 g kg−1 for KNN, NN, and RF, respectively. Considering the variation in clay content of the samples between 60 and 930 g kg−1 (Table 1), the model (KNN) with the best performance produced an error in predicting clay of around 6.8% for samples with low clay content, and 0.44% for samples with high clay content. Checking the RPD results, LR showed low accuracy (RPD of 1.78), while PLSR and SVM demonstrated promising accuracy (2.11 and 2.49, respectively). However, the best accuracies were observed for the RF, NN, and KNN models (3.46, 3.55, and 5.31, respectively). Analyzing the scatter plot data distribution (Figure 4) and statistical parameters (Table 2), KNN was the most promising model for the clay estimation obtained.
For SOC, the R2 values observed were between 0.18 and 0.45. RMSE results were between 4.07 and 4.97 g dm−3 for KNN and LR, and RPD were between 1.02 and 1.12 for LR and KNN. Combining the performance parameters of the models with the visualization of the data scatter plot graph (Figure 4), the lowest performance of the models in predicting SOC is noted, despite being considered an attribute of great influence on the spectral signature of soils [6,15,41].
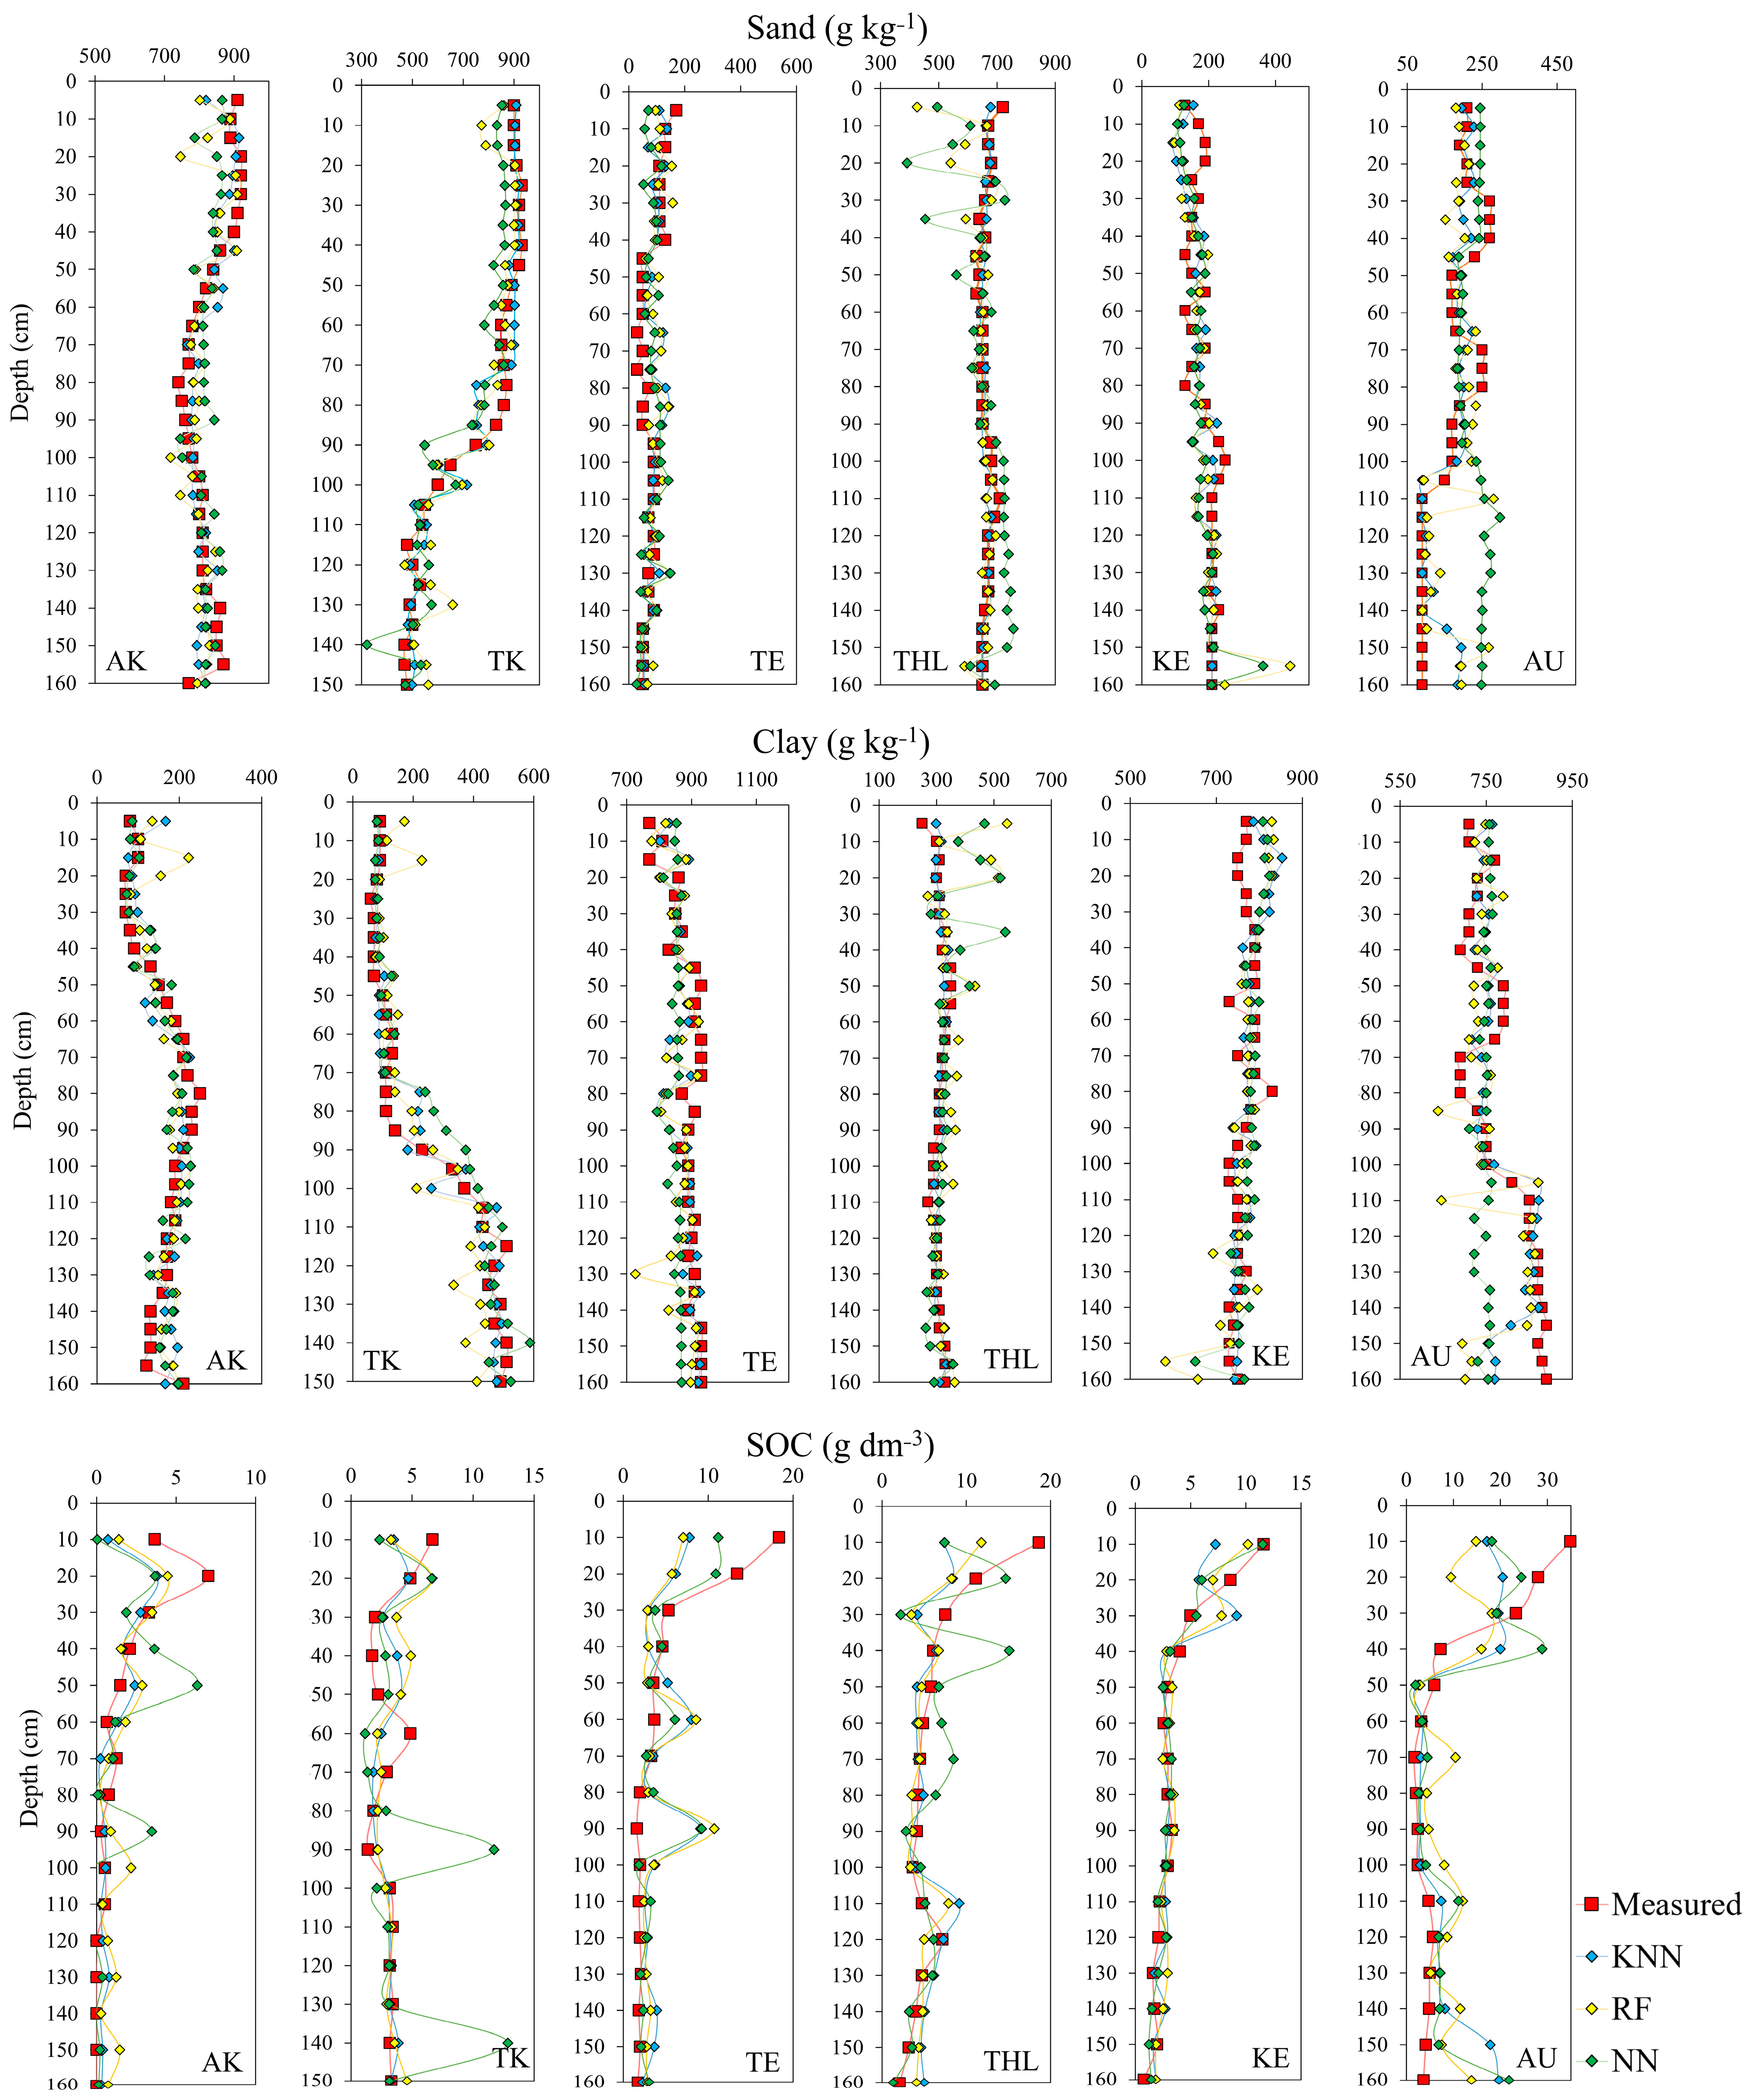
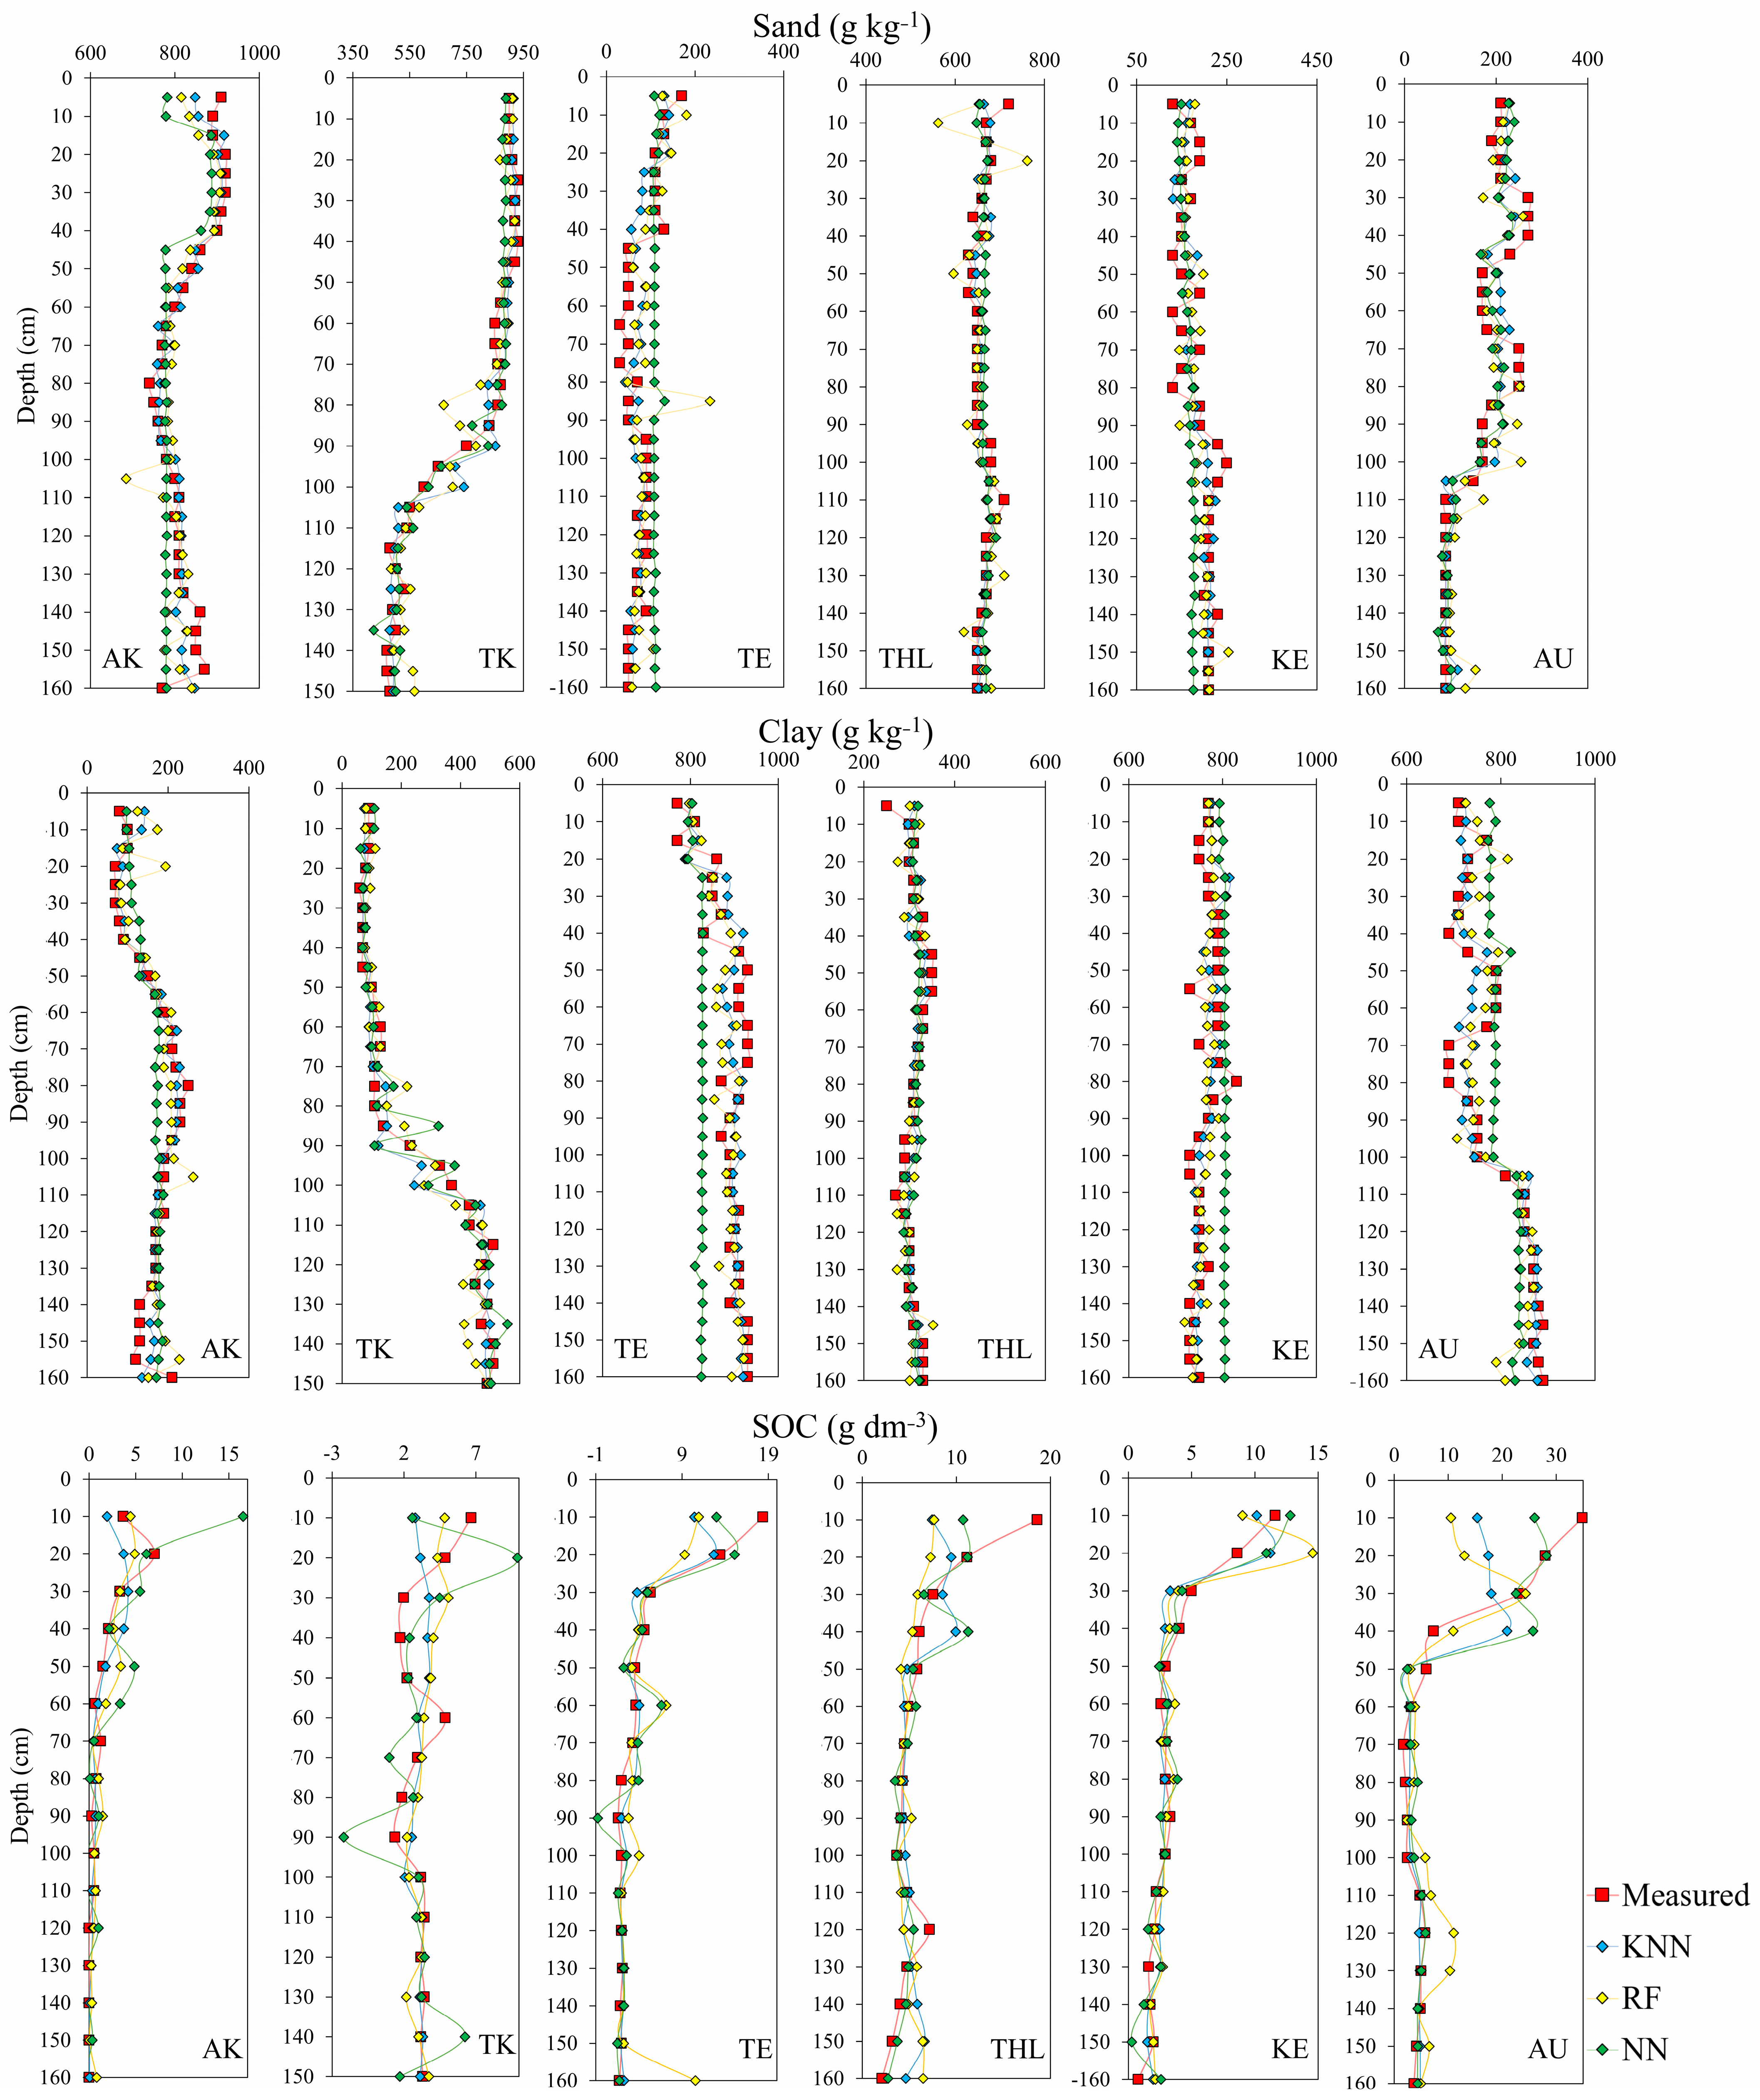
Figure 5 presents the attribute prediction results at different depths generated via the best models. Although the three models presented significant and very similar prediction parameter results (Table 2), the predictive performance of the KNN model at different depth layers is remarkable. Meanwhile, the RF and NN models present significant particle size prediction errors in the topsoil layers (Figure 5), especially when it comes to sandy soil suborders (AK, TK, and THL). Soils derived from fine sandstone are known to have a lot of quartz but very low levels of iron oxides due to the source material. Iron oxides have a significant impact on the VIS-NIR spectral signature [26,42], while quartz is better characterized and therefore modeled by SWIR spectra.
The TE and KE soils, derived from the Paranapanema and Pitanga formations, are characterized by basalt flows rich in iron oxides and showed better prediction performances in the different layers. For the AU suborder, also derived from the Paranapanema region, only the NN model demonstrated low predictive performance in the subsoil layer.
For SOC (Figure 5), the topsoil layer also presented high prediction errors when compared to the subsoil layers. As mentioned, the high variability of SOC content observed in the different depth layers of the monolith, combined with the sampling spacing (10 cm spacing) and low sample amount, may have negatively influenced the modeling of this attribute.

3.3. Soil Attributes Prediction Based on ML Models and SWIR Hyperspectral Reflectance Obtained by Imaging Sensor

Table 3 presents the performance results of the models in predicting soil attributes. The R2 values obtained for sand and clay were between 0.86 and 0.99, with better performance presented using the KNN model. For SOC, the R2 results were between 0.19 and 0.60 for the SVM and KNN models. Meanwhile, silt presented R2 values between 0.14 and 0.56 for the SVM and KNN models. Sand and clay presented RPD results above 2 for most models (from 1.98 to 6.37), indicating satisfactory accuracy for the models evaluated. For silt and SOC, RPD results lower than the limit of 1.4 indicate that the models have low/no predictive capacity.
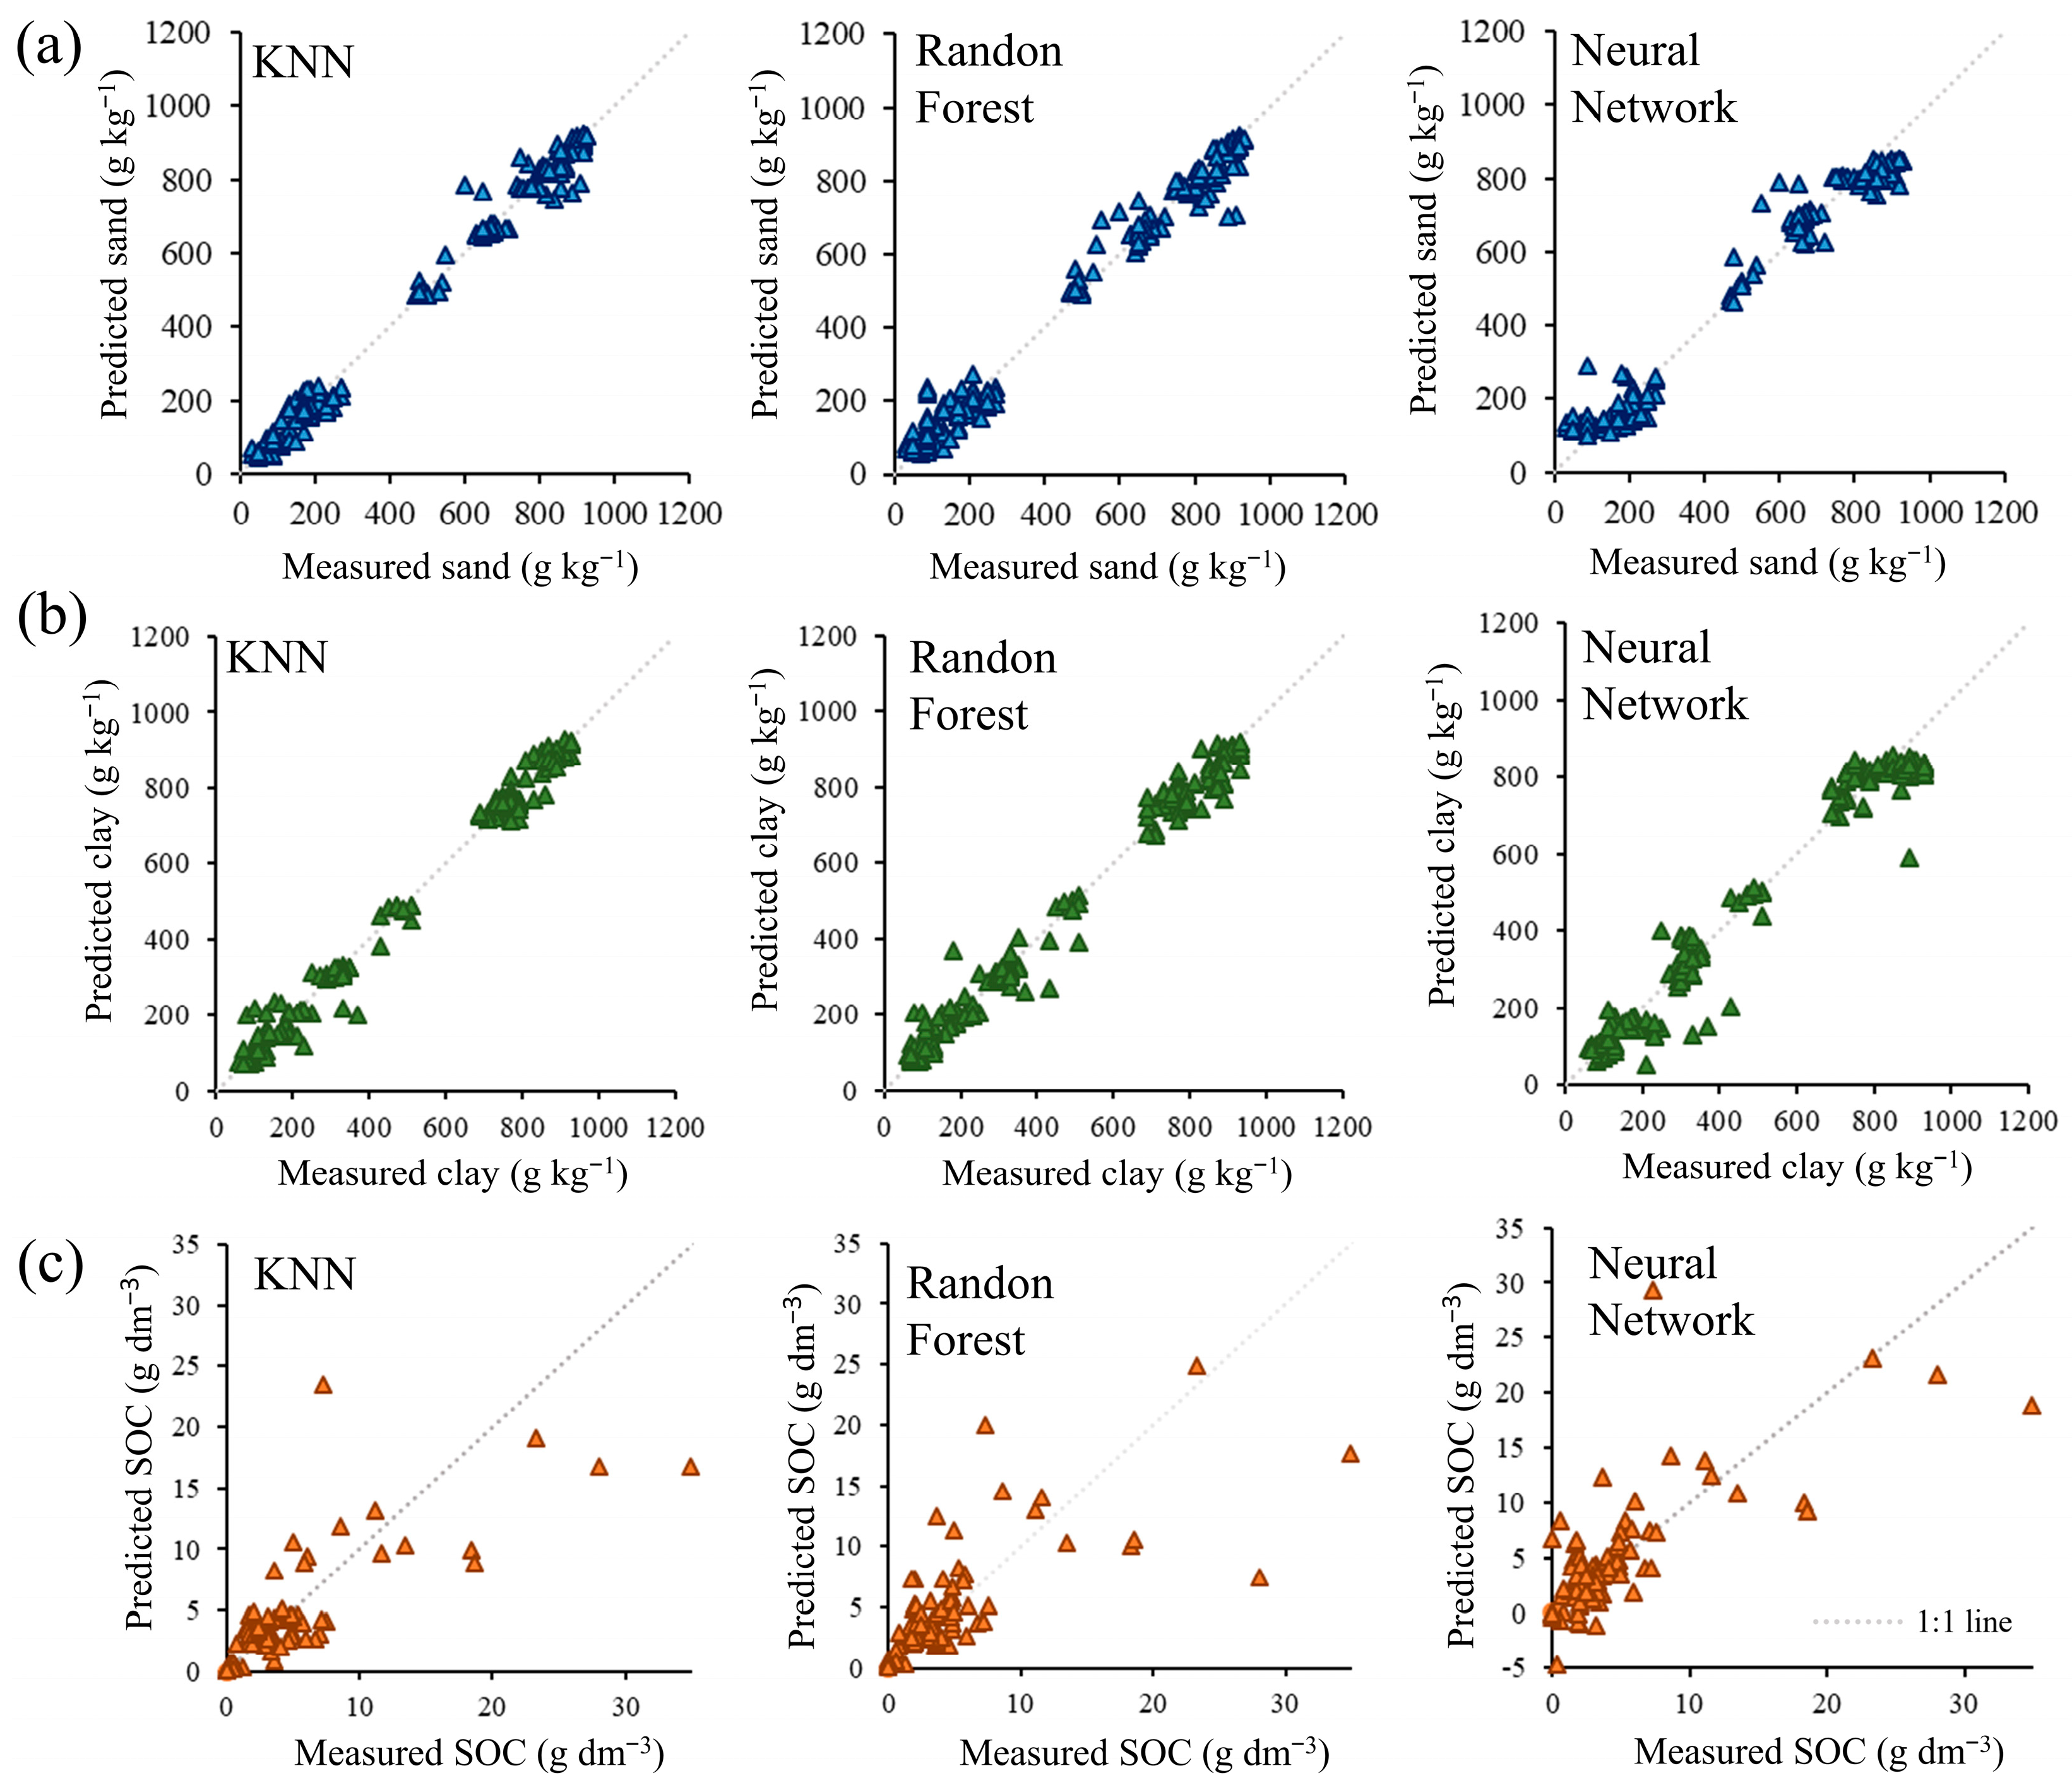
As for the RMSE parameter, sand and clay resulted in 3.5, 4.5, and 5.6 g kg−1 for the KNN, RF, and NN models, and errors around 10 g kg−1 for the other models. These results combined with the visualization of the scatter plot of sand and clay data (Figure 6a,b) indicate that KNN, RF, and NN were the most promising models in estimating these attributes. A similar result was observed for silt and SOC which, despite demonstrating low prediction accuracy seen in the model evaluation parameters (Table 3) and in the scattered distribution of SOC data (Figure 6c), in general, also presented the evaluation parameters most promising for KNN, RF, and NN.
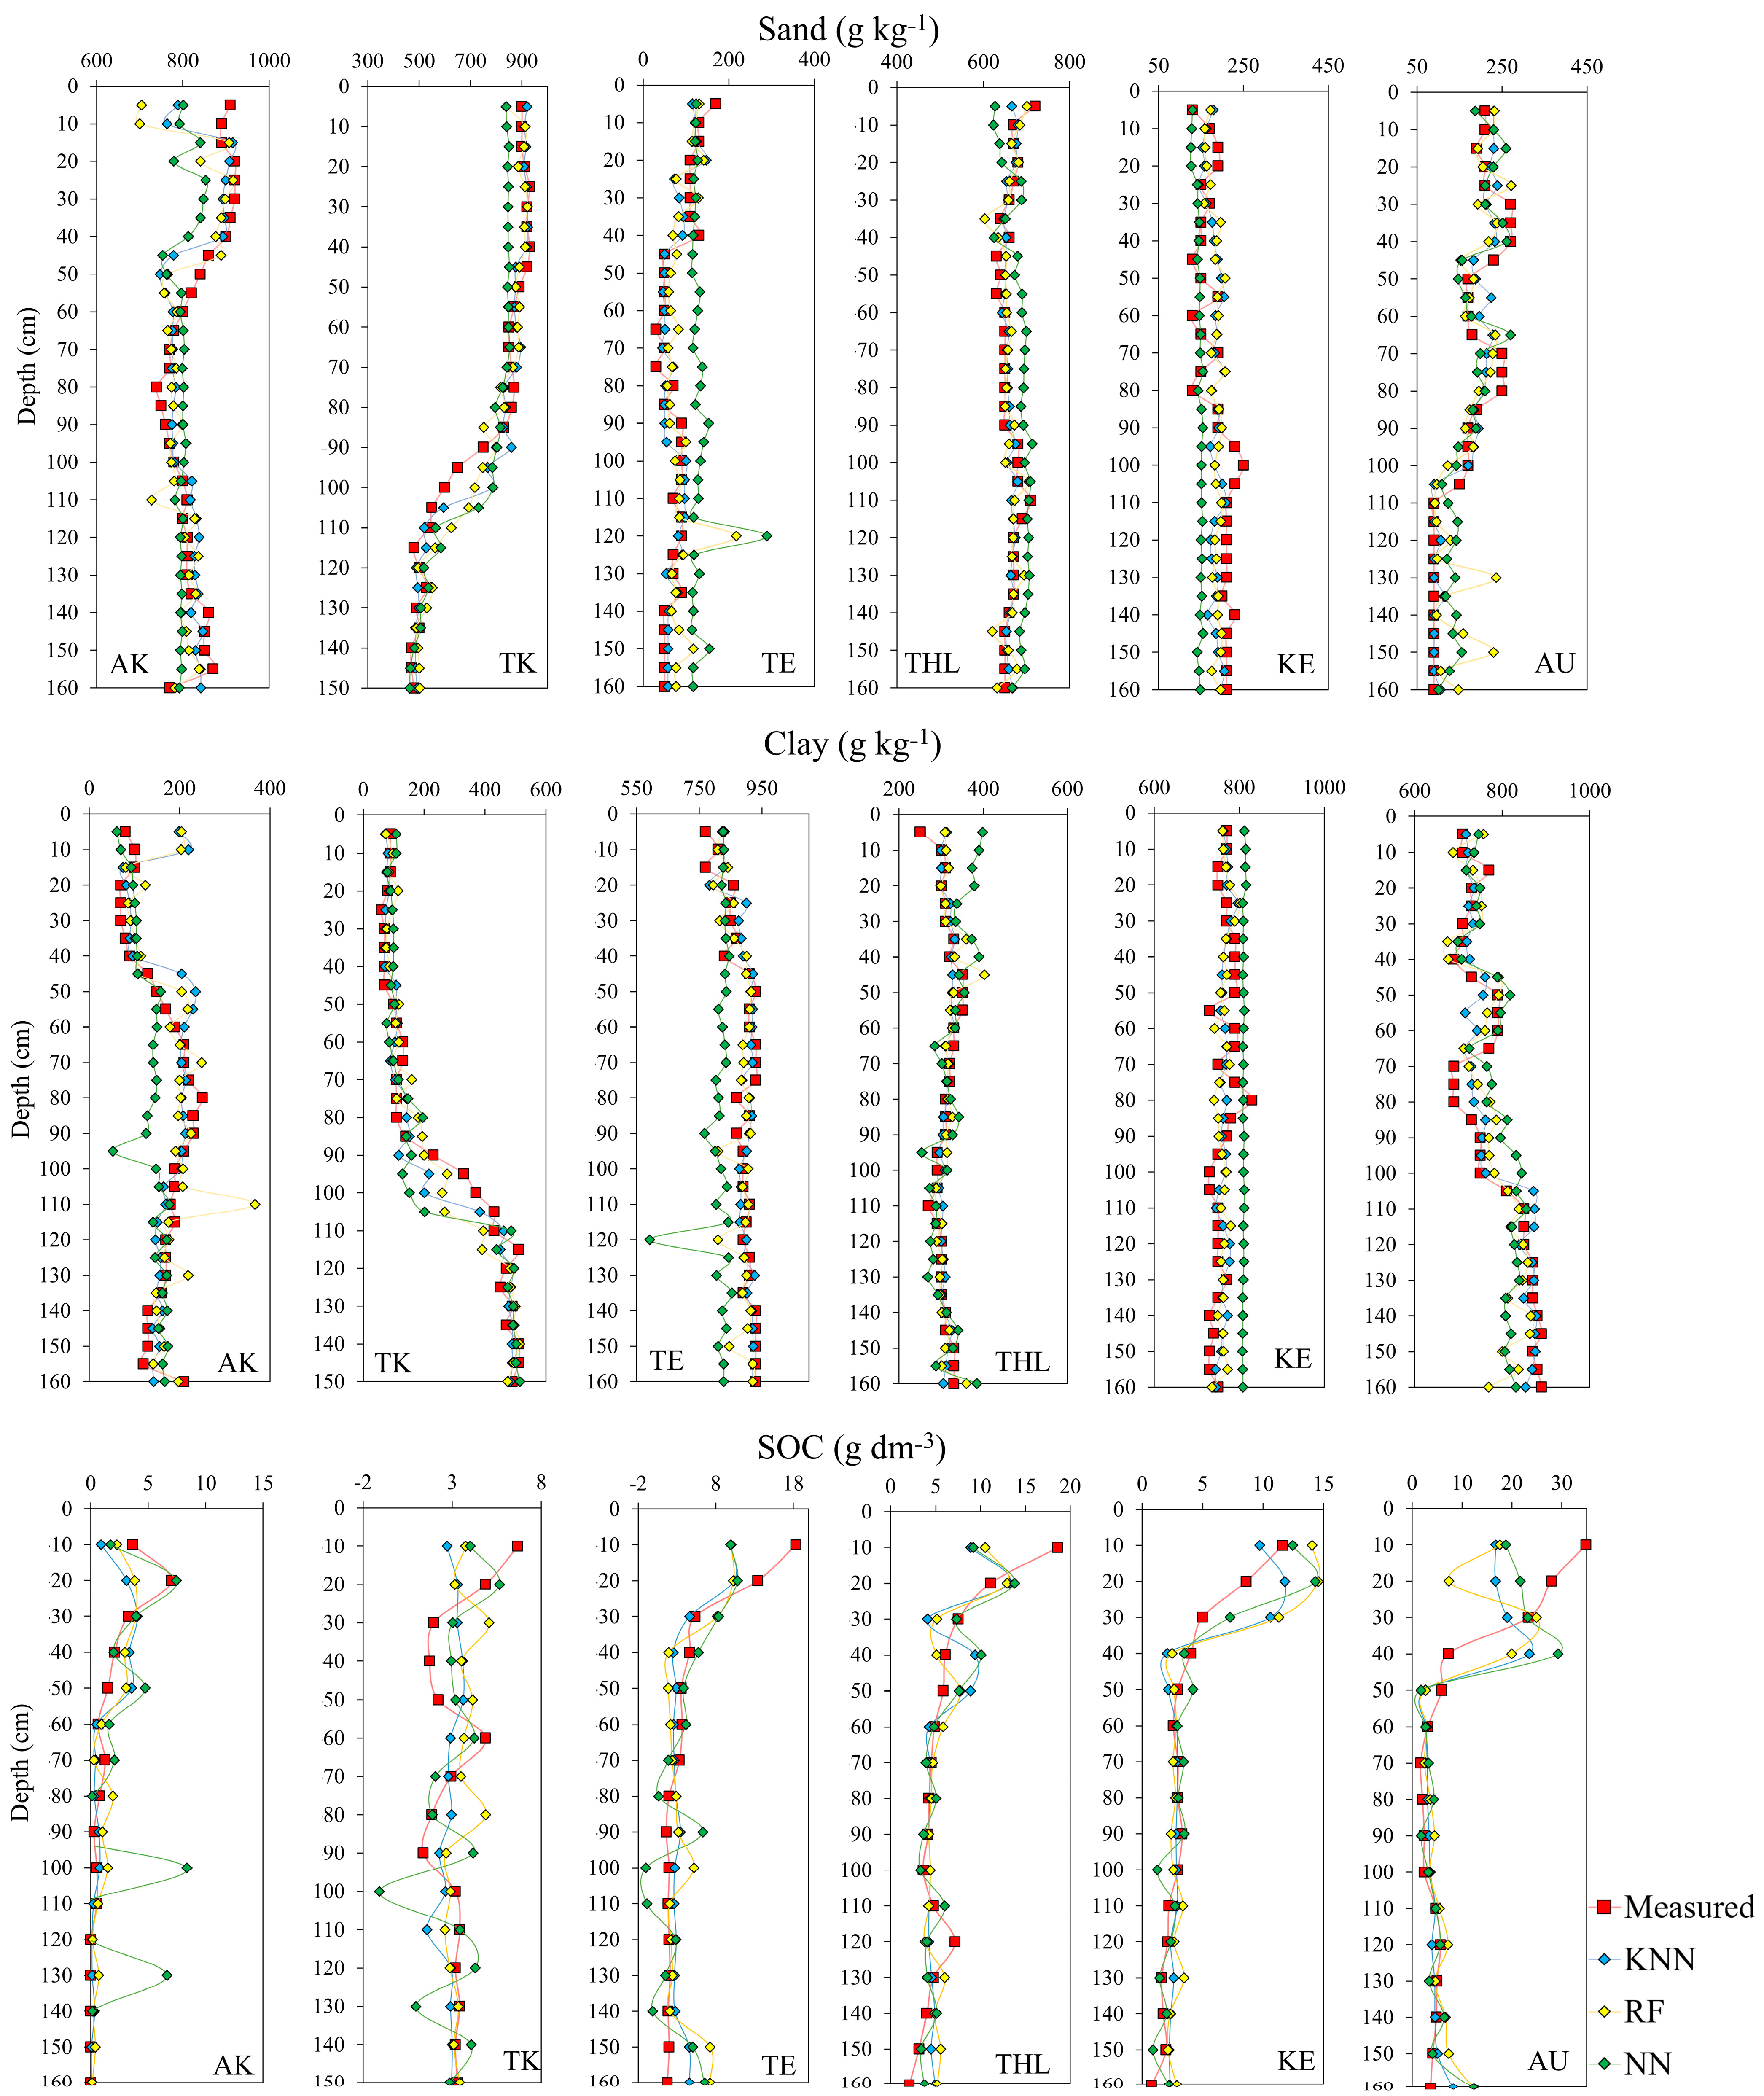
Figure 7 presents the particle size and SOC prediction results at different depths, estimated using the best models. It is possible to observe outliers of predictive errors for sand and clay in the AK, TE, and AU suborders. However, most of the predicted data were allocated very close to the samples measured at depth, indicating high performance for predicting sand and clay with these models, as seen in Table 3. In suborder TK, it can be seen that, even with the large variation in particle size content between the topsoil and subsoil layers (variation from 470 to 930 g kg−1 of sand and 60 to 510 g kg−1 of clay, according to Table 1), the models showed a trend in confusing the texture transition layer (90 to 110 cm deep), followed by a high predictive performance for sand and clay for most of the samples. Meanwhile, SOC results continue to indicate low predictive accuracy (Figure 7), especially in the topsoil layers. Even so, KNN presented the best performance in predicting sand, clay, and SOC, as seen in Table 3, while NN presented the largest prediction deviations for these databases.

3.4. Soil Attributes Prediction Based on ML Models and VIS-NIR-SWIR Hyperspectral Reflectance Obtained by Non-Imaging Sensor

The R2 values for predicting sand and clay (Table 4) were between 0.93 and 0.99, indicating satisfactory performance in predicting these attributes for all models evaluated, especially KNN, RF, and NN. All models generated for these attributes resulted in an RPD above 2, indicating excellent predictive capacity. Analyzing the RMSE results, sand and clay presented 2.88, 3.74, and 4.17 g kg−1 for the KNN, NN, and RF models, respectively, and RMSE variation of around 7 g kg−1 for the other models. Checking the dispersion of sand and clay data (Figure 8a,b), points very close to the 1:1 line were noted, indicating accuracy in the prediction of sand and clay using the KNN, RF, and NN models.
For SOC, R2 values varied between 0.21 and 0.69, with the best performance observed for the NN model, while silt had an R2 variation between 0.32 and 0.66 and the best-performing model was KNN. As for RPD, only the NN model achieved a SOC predictive capacity classified as good/needs improvement, while the other models resulted in low predictive capacity. For silt, the RPD indicated low/no predictive capacity for all models evaluated. Analyzing the RMSE results for SOC prediction, it can be observed that the KNN, RF, and NN models presented lower values compared to the others. Checking the results of R2, RPD, and data distribution with a dispersed trend (Figure 8c), it is possible to conclude that the models generated for SOC prediction presented low accuracy in this work. Even working with data from a large spectrum such as VIS-NIR-SWIR, the high data variability combined with the sample amount seems to be a negative factor for data modeling. For silt, KNN, RF, PLSR, and NN were the most promising models, despite low predictive accuracy.
Figure 9 presents the attribute prediction results at different depths generated using the most promising models. Some predictive error outliers around can be noted for sand and clay, especially for the RF and NN models. However, the general trend is prediction results very close to the attributes measured by laboratory analyses, especially when it comes to the KNN model, indicating the high performance of this model. The in-depth prediction results observed for SOC showed more promising results when analyzing the complete VIS-NIR-SWIR spectrum presented in this topic when compared to VIS-NIR and SWIR spectra evaluated separately in the previous topics, especially when analyzing the prediction from KNN models and RF.
The amplitude of VIS-NIR-SWIR spectra presented more accurate predictive models when compared to VIS-NIR and SWIR evaluated separately. The spectral information related to iron oxides in VIS-NIR spectra combined with the reflectance of clay minerals in SWIR spectra seems to provide information that makes data modeling more robust.

4. Discussion

4.1. Soil Spectral Behavior

The different amplitudes of the spectral signature of the soil suborders are attributed especially to the composition of soil particle size and SOM content. Soils with a high sand content have higher reflectance values than soils with a high clay content, especially due to the abundance of quartz in their mineralogical composition, a mineral with a high reflectance characteristic [1,26]. Furthermore, iron oxides and other clay minerals significantly impact the spectral signature [26,42].
In the meantime, SOM (and consequently SOC) can absorb EMR across the entire VIS-NIR-SWIR reflectance spectrum. As a result, the higher the SOM content, the lower the reflectance across the soil’s spectral signature. In large quantities, SOM can hide the soil mineralogy characteristics [6,13,15,20,41].
These soil properties, originating from its source material and formation processes, influence the spectral characteristics of the soil due to the electronic process and vibrations that occur at the atomic level when EMR interacts with soil particles [1,13]. These processes occur in the VIS-NIR-SWIR spectral regions, covering the wavelength range from 400 nm to 2500 nm, as well as the mid-infrared (MIR) region (2500–25,000 nm), which can be used to assess the relationship between soil properties and their spectral behavior [1,16,17].

4.2. Soil Attributes Prediction Based on ML Models and Hyperspectral Reflectance

The prediction of soil attributes using machine learning models is significantly influenced by the variance of the data inherent to the dataset, the quantity and quality of the data entered into the model, and also the correlation between the analyzed variables. Predicting particle size, for example, depends on the variance of the data, as well as the correlation with certain soil components, such as quartz (sand) and various types of clays, organic matter, carbonates, and oxides [43]. Generally, sand and clay predictions are obtained with high R2 values, as seen in this work. The results of Franceschini et al. (2015) [37] corroborated the results of this work. These authors collected VIS-NIR-SWIR spectra from soil samples using a spectroradiometer, modeled the spectral data using the PLSR model, and found R2 values of 0.92 and 0.85 in predicting clay and sand. However, they obtained high RMSE values, which were 22.4 and 32.9 g kg−1, while we obtained lower RMSE results (between 3.43 and 11.24 g kg−1). Also, working with sand and clay prediction from VIS-NIR-SWIR spectra, Zhao et al. (2021) [44] obtained R2 values of 0.60 and 0.77, modeling data via PLSR, while Zolfaghari et al. (2022) [23] found R2 values of 0.91 and 0.79 by modeling spectral data with an RF model. Nevertheless, Liu et al. (2020) [2] found different results from this work. These authors collected soil samples from China at different depths with the aim of predictive modeling of sand and clay using environmental factors, including weather variables, parent materials, terrain, vegetation, and soil conditions, and the RF model. The results obtained were low R2 values, around 0.48 and 0.46, for predicting these soil attributes.
Silt generally presents low predictive accuracy results. Cezar et al. (2012) [45] observed that the sand and clay fractions present an influence with a linear trend on the spectral signature of soils, increasing or decreasing the albedo proportionally to the content of these attributes, while silt presents a curvilinear (hyperbolic) behavior and a low significant influence on the spectral signature of soils. Liu et al. (2020) [2] found R2 values around 0.45 for silt prediction with the RF model. Nanni et al. (2021) [27] obtained low accuracy for silt prediction, reaching R2 values of 0.05 and 0.21 and RMSEs of 24.9 and 15.5 g kg−1 for spectral data obtained by imaging and non-imaging sensors and modeled using PLSR. Cobliski et al. (2020), Zhao et al. (2021), and Zolfaghari et al. (2022) [1,23,44] also observed low R2 values when predicting silt using VIS-NIR-SWIR spectra.
In this study, we obtained low predictive accuracy for SOC, despite it being considered a significant attribute influencing the spectral signature of soils [6]. The highest concentrations of SOC were observed in the topsoil (Table 1). This is mainly due to organic materials such as aboveground and belowground plant residues, as well as root exudates and soluble plant components carried by precipitation, which are most abundant in this layer. These materials are then converted into carbonaceous substances by soil microorganisms and other organisms [46]. Meanwhile, SOC content observed in subsoil samples ranged from low (7.28 g dm−3) to zero (Table 1). The high variability of SOC contents among topsoil and subsoil samples, combined with the sample amount, may have negatively influenced the modeling of this attribute.
In contrast to the low accuracy observed for SOC prediction in this work, with a dataset of 95 samples, Xu, S. et al. (2020) [47] evaluated SOC estimation based on VIS-NIR image and PLSR, NN, SVM, Cubist regression tree, and Gaussian process regression models, and obtained R2 values of 0.82, 0.91, 0.93, 0.90, and 0.91, and RMSEs of 2.40, 1.70, 1.54, 1.85, and 1.72 g kg−1, using a robust dataset consisting of 214 samples. Meanwhile, Sorenson et al. (2018) [18] worked with a dataset of 201 samples of VIS-NIR-SWIR data and machine learning models to estimate SOC and obtained R2 values of 0.93 and 0.74 for the Cubist model and PLSR. In this context, we understand that the number and variability of samples can influence the predictive results of this variable. In addition, corroborating the importance of sample spacing in data variability and modeling, Liu et al. (2023) [48] worked with SOC prediction in profiles of five soil monoliths based on VIS-NIR spectra and the RF model. These authors performed a sampling scheme every 1, 5, and 10 cm depth and concluded that SOC prediction was more efficient under the sampling scheme at every 1 cm depth.
Liu et al. (2021) [49] obtained promising predictive accuracy for SOM, an attribute directly related to the SOC content. These authors collected VIS-NIR-SWIR spectra from a dataset of 190 soil samples, applied a competitive adaptive weighting algorithm (CARS) for characteristic wavelength selection and RF for predictive modeling, and obtained an R2 of 0.96. Tahmasbian et al. (2018) [36] used VIS-NIR images combined with PLSR to estimate total SOC and obtained an R2 of 0.82 in calibration and 0.67 in validating data from a sampling set consisting of 120 samples. Reis et al. (2021) [20] concluded that the modeling of VIS-NIR-SWIR spectra allowed not only the prediction and estimation of different SOM contents but also the discrimination of different soil depths. In addition, Tajik et al. (2020) [50] used satellite images combined with topographic attributes and soil properties, such as pH and particle size, to estimate the SOC content at different soil depths using the models PLSR, SVM, RF, KNN, generalized linear model (GLM), and recursive partitioning and regression trees (rpart). The results of the validation revealed that GLM, SVM, and RF for the first depth and PLSR, GLM, SVM, and RF for the second depth were the most accurate ML algorithms in ensemble modeling based on RMSE. Srisomkiew et al. (2021) [22] obtained soil attribute prediction maps using satellite images and the multiple linear regression (MLR) model. For this purpose, the soil spectra and terrain variables were set as the independent variables. These authors obtained an R2 of 0.76 for pH prediction and 0.71 for SOM, and R2 values varying between 0.50 and 0.79 for different soil fertility attributes, and concluded that indices such as brightness, saturation, coloration, normalized difference water, and moisture stress were the most important predictor variables, significantly correlated with various soil properties. Bogaert et al. (2023) [51] performed KNN and RF for SOC estimation and obtained R2 values of 0.50 and 0.56.

4.3. Performance of VIS-NIR, SWIR, and VIS-NIR-SWIR Wavelengths in Predicting Soil Attributes

VIS-NIR spectra are a region of great importance for particle size prediction. The main information provided by the VIS region for estimating soil texture is related to soil tone, in which soils with darker tones generally have higher clay content and lower sand content than soils with lighter tones, considering the comparison between soils with the same moisture content and source material [6]. In the study performed by Coblinski et al. (2020) [1], the VIS band was most influential in predicting sand, especially due to the color property of the soil, which was dominated by hematite in their work, a mineral that presents its characteristics in this spectral range. Meanwhile, Viscarra Russel et al. (2006) [17] observed that the peaks found in the spectral signature of soils at 460, 540, and 650 nm were important for predicting sand content, while for predicting clay content, data from the MIR (mid-infrared) region demonstrated better performance.
Soil spectroscopy in SWIR spectra is represented especially by the spectral characteristics of minerals such as quartz, kaolinite, vermiculite, montmorillonite, and illite, among others [1,6,8,44,52], which are promoted by the interaction of these minerals with EMR. In this work, SWIR spectra seem more effective in estimating soil attributes than VIS-NIR spectra, even working with a smaller number of bands (272 bands for SWIR and 823 for VIS-NIR).
The estimation of clay, sand, and silt are highly influenced by the wavelength range of the VIS spectral region between 400 and 600 nm, also in the SWIR region between 1900 and 2400 nm, mainly attributed to the presence of absorption characteristics of the phenolic, amide, and aliphatic groups between 2200 and 2220 nm [6]. The authors also mention that the typical absorption characteristics related to the clay fraction of the soil are different and depend on the predominant clay mineral. Nanni et al. (2021) [27] observed a strong correlation at wavelengths 1420, 1885, 2160, 2200, 2260, 2320 for clay prediction, wavelengths 560, 1060, 1480, 1840, 2200, 2360 for sand prediction and wavelengths 580, 1420, 1900, 2195, 2205 for SOC prediction using the PLSR model, indicating that the entire VIS-NIR-SWIR spectrum presents crucial information for predicting soil attributes, as we observed in our work.

5. Conclusions

The results obtained in this work indicate that all VIS-NIR and SWIR spectra are suitable for predicting particle size and SOC. However, the hyperspectral data obtained by the SWIR imaging sensor appear more effective in estimating soil attributes than the data obtained by the VIS-NIR imaging sensor, and the full VIS-NIR-SWIR spectrum obtained by spectroradiometer presented more accurate predictive models when compared to VIS-NIR and SWIR evaluated separately.
In general, the SVM, LR, and PLSR models presented the lowest accuracy results in predicting particle size and SOC, with R2 values around 0.93, 0.89, and 0.91, respectively, in predicting sand, and around 0.91, 0.88, and 0.91, respectively, in clay prediction. For silt prediction, the R2 values obtained using the same models were around 0.30, 0.33, and 0.5, respectively, and for SOC, we obtained an R2 around 0.29, 0.22, and 0.42, respectively. These are mean values obtained by comparing results from all evaluated spectral bands. Meanwhile, KNN, RF, and NN models were the most promising models in estimating particle size and SOC, with R2 values around 0.99, 0.98, and 0.97 for sand prediction, R2 values around 0.59, 0.57, and 0.40 in silt prediction, R2 values around 0.99, 0.98, and 0.96 for clay, and R2 values around 0.56, 0.48, and 0.51 for SOC prediction. These values are also mean data for all spectral bands evaluated. Among these models, KNN was the most promising model, with RMSEs of 3.4, 1.3, and 3.6 g kg−1 for sand, silt, and clay, and 3.6 g dm−3 for SOC.
The results of this work demonstrated that integrating effective ML models with robust sample databases, obtained by advanced hyperspectral imaging and spectroradiometers, can increase the accuracy and efficiency of soil attribute prediction, especially sand and clay. From future perspectives, we believe that increasing the sample composition of the database followed by predictive modeling using the most promising learners found in this work can develop a rapid method for measuring soil attributes and implement a promising tool to support analytical methods.

Author Contributions

Conceptualization, K.M.d.O.; data curation, K.M.d.O.; formal analysis, K.M.d.O. and J.V.F.G.; funding acquisition, K.M.d.O. and R.H.F.; investigation, K.M.d.O. and L.G.T.C.; methodology, K.M.d.O. and J.V.F.G.; project administration, K.M.d.O.; resources, K.M.d.O.; software, K.M.d.O. and J.V.F.G.; supervision, K.M.d.O.; validation, K.M.d.O.; visualization, K.M.d.O., R.B.d.O., A.S.R., M.R.N., R.H.F., W.A.M., D.d.F.d.S.H., A.E.d.A.E. and C.A.d.O.; writing—original draft, K.M.d.O.; writing—review and editing, K.M.d.O., R.F., J.V.F.G., R.H.F. and L.G.T.C. All authors have read and agreed to the published version of the manuscript.

Funding

This study was financed by the Coordenação de Aperfeiçoamento de Pessoal de Nível Superior: 001.

Data Availability Statement

The original contributions presented in the study are included in the article, further inquiries can be directed to the corresponding author/s.

Acknowledgments

Thanks are due to Programa de Pós-Graduação em Agronomia (PGA-UEM) at the State University of Maringá for encouragement and supporting communication.

Conflicts of Interest

The authors declare no conflicts of interest. The funders had no role in the design of the study; in the collection, analyses, or interpretation of data; in the writing of the manuscript; or in the decision to publish the results.

References

  1. Coblinski, J.A.; Giasson, É.; Demattê, J.A.M.; Dotto, A.C.; Costa, J.J.F.; Vašát, R. Prediction of Soil Texture Classes through Different Wavelength Regions of Reflectance Spectroscopy at Various Soil Depths. Catena 2020, 189, 104485. [Google Scholar] [CrossRef]
  2. Liu, F.; Zhang, G.-L.; Song, X.; Li, D.; Zhao, Y.; Yang, J.; Wu, H.; Yang, F. High-Resolution and Three-Dimensional Mapping of Soil Texture of China. Geoderma 2020, 361, 114061. [Google Scholar] [CrossRef]
  3. Ben-Dor, E.; Chabrillat, S.; Demattê, J.A.M.; Taylor, G.R.; Hill, J.; Whiting, M.L.; Sommer, S. Using Imaging Spectroscopy to Study Soil Properties. Remote Sens. Environ. 2009, 113, S38–S55. [Google Scholar] [CrossRef]
  4. Sorenson, P.T.; Quideau, S.A.; Rivard, B.; Dyck, M. Distribution Mapping of Soil Profile Carbon and Nitrogen with Laboratory Imaging Spectroscopy. Geoderma 2020, 359, 113982. [Google Scholar] [CrossRef]
  5. Teixeira, P.C.; Donagemma, G.K.; Fontana, A.; Teixeira, W.G. Manual de Métodos de Análise de Solo, 3rd ed.; Embrapa: Brasília, Brazil, 2017. [Google Scholar]
  6. Castaldi, F.; Palombo, A.; Santini, F.; Pascucci, S.; Pignatti, S.; Casa, R. Evaluation of the Potential of the Current and Forthcoming Multispectral and Hyperspectral Imagers to Estimate Soil Texture and Organic Carbon. Remote Sens. Environ. 2016, 179, 54–65. [Google Scholar] [CrossRef]
  7. da Silva Chagas, C.; de Carvalho, W., Jr.; Bhering, S.B.; Calderano Filho, B. Spatial Prediction of Soil Surface Texture in a Semiarid Region Using Random Forest and Multiple Linear Regressions. Catena 2016, 139, 232–240. [Google Scholar] [CrossRef]
  8. Rawlins, B.G.; Kemp, S.J.; Milodowski, A.E. Relationships between Particle Size Distribution and VNIR Reflectance Spectra Are Weaker for Soils Formed from Bedrock Compared to Transported Parent Materials. Geoderma 2011, 166, 84–91. [Google Scholar] [CrossRef]
  9. Li, S.; Shi, Z.; Chen, S.; Ji, W.; Zhou, L.; Yu, W.; Webster, R. In Situ Measurements of Organic Carbon in Soil Profiles Using Vis-NIR Spectroscopy on the Qinghai-Tibet Plateau. Environ. Sci. Technol. 2015, 49, 4980–4987. [Google Scholar] [CrossRef]
  10. Richter, K.; Palladino, M.; Vuolo, F.; Dini, L.; D’Urso, G. Spatial distribuition of soil water contente from airborne termal and optical remote sensing data. Remote Sens. Agric. Ecosyst. Hydrol. 2009, 7472, 209–219. [Google Scholar] [CrossRef]
  11. Sobrino, J.A.; Franch, B.; Mattar, C.; Jiménez-Muñoz, J.C.; Corbari, C. A Method to Estimate Soil Moisture from Airborne Hyperspectral Scanner (AHS) and ASTER Data: Application to SEN2FLEX and SEN3EXP Campaigns. Remote Sens. Environ. 2012, 117, 415–428. [Google Scholar] [CrossRef]
  12. Sellitto, V.M.; Fernandes, R.B.A.; Barrón, V.; Colombo, C. Comparing Two Different Spectroscopic Techniques for the Characterization of Soil Iron Oxides: Diffuse versus Bi-Directional Reflectance. Geoderma 2009, 149, 2–9. [Google Scholar] [CrossRef]
  13. Oliveira, K.M.; Falcioni, R.; Gonçalves, J.V.F.; Oliveira, C.A.; Mendonça, W.A.; Crusiol, L.G.T.; Oliveira, R.B.; Furlanetto, R.H.; Reis, A.S.; Nanni, M.R. Rapid Determination of Soil Horizons and Suborders Based on VIS-NIR-SWIR Spectroscopy and Machine Learning Models. Remote Sens. 2023, 15, 4859. [Google Scholar] [CrossRef]
  14. Xu, H.; Xu, D.; Chen, S.; Ma, W.; Shi, Z. Rapid Determination of Soil Class Based on Visible-near Infrared, Mid-Infrared Spectroscopy and Data Fusion. Remote Sens. 2020, 12, 1512. [Google Scholar] [CrossRef]
  15. Zhang, Y.; Hartemink, A.E.; Huang, J. Spectral signatures of soil horizons and soil orders–An exploratory study of 270 soil profiles. Geoderma 2021, 389, 114961. [Google Scholar] [CrossRef]
  16. Epiphanio, J.C.N.; Formaggio, A.R.; de Morisson Valeriano, M.; de Oliveira, J.B. Comportamento Espectral de Solos do Estado de São Paulo; Instituto Nacional de Pesquisas Espaciais: São José dos Campos, Brazil, 1992. [Google Scholar]
  17. Viscarra Rossel, R.A.; Walvoort, D.J.J.; McBratney, A.B.; Janik, L.J.; Skjemstad, J.O. Visible, near Infrared, Mid Infrared or Combined Diffuse Reflectance Spectroscopy for Simultaneous Assessment of Various Soil Properties. Geoderma 2006, 131, 59–75. [Google Scholar] [CrossRef]
  18. Sorenson, P.T.; Quideau, S.A.; Rivard, B. High Resolution Measurement of Soil Organic Carbon and Total Nitrogen with Laboratory Imaging Spectroscopy. Geoderma 2018, 315, 170–177. [Google Scholar] [CrossRef]
  19. Cezar, E.; Nanni, M.R.; Crusiol, L.G.T.; Sun, L.; Chicati, M.S.; Furlanetto, R.H.; Rodrigues, M.; Sibaldelli, R.N.R.; Silva, G.F.C.; de Oliveira, K.M.; et al. Strategies for the Development of Spectral Models for Soil Organic Matter Estimation. Remote Sens. 2021, 13, 1376. [Google Scholar] [CrossRef]
  20. Reis, A.S.; Rodrigues, M.; Alemparte Abrantes dos Santos, G.L.; Mayara de Oliveira, K.; Furlanetto, R.H.; Teixeira Crusiol, L.G.; Cezar, E.; Nanni, M.R. Detection of Soil Organic Matter Using Hyperspectral Imaging Sensor Combined with Multivariate Regression Modeling Procedures. Remote Sens. Appl. Soc. Environ. 2021, 22, 100492. [Google Scholar] [CrossRef]
  21. Xu, S.; Wang, M.; Shi, X.; Yu, Q.; Zhang, Z. Integrating Hyperspectral Imaging with Machine Learning Techniques for the High-Resolution Mapping of Soil Nitrogen Fractions in Soil Profiles. Sci. Total Environ. 2021, 754, 142135. [Google Scholar] [CrossRef]
  22. Srisomkiew, S.; Kawahigashi, M.; Limtong, P. Digital Mapping of Soil Chemical Properties with Limited Data in the Thung Kula Ronghai Region, Thailand. Geoderma 2021, 389, 114942. [Google Scholar] [CrossRef]
  23. Zolfaghari, A.A.; Toularoud, A.A.S.; Baghi, F.; Mirzaee, S. Spatial Prediction of Soil Particle Size Distribution in Arid Agricultural Lands in Central Iran. Arab. J. Geosci. 2022, 15, 1574. [Google Scholar] [CrossRef]
  24. Staff, S.S. Keys to Soil Taxonomy; United States Department of Agriculture: Washington, DC, USA, 2014. [Google Scholar]
  25. Besser, M.L.; Brumatti, M.; Spisila, A.L. Mapa Geológico e de Recursos Minerais do Estado do Paraná; Programa Geologia, Mineração e Transformação Mineral; Escala 1:600.000; SGB-CPRM: Curitiba, Brazil, 2021. [Google Scholar]
  26. Demattê, J.A.M.; Bellinaso, H.; Romero, D.J.; Fongaro, C.T. Morphological Interpretation of Reflectance Spectrum (MIRS) Using Libraries Looking towards Soil Classification. Sci. Agric. 2014, 71, 509–520. [Google Scholar] [CrossRef]
  27. Nanni, M.R.; Demattê, J.A.M.; Rodrigues, M.; dos Santos, G.L.A.A.; Reis, A.S.; de Oliveira, K.M.; Cezar, E.; Furlanetto, R.H.; Crusiol, L.G.T.; Sun, L. Mapping Particle Size and Soil Organic Matter in Tropical Soil Based on Hyperspectral Imaging and Non-Imaging Sensors. Remote Sens. 2021, 13, 1782. [Google Scholar] [CrossRef]
  28. Furlanetto, R.H.; Nanni, M.R.; Mizuno, M.S.; Crusiol, L.G.T.; da Silva, C.R. Identification and Classification of Asian Soybean Rust Using Leaf-Based Hyperspectral Reflectance. Int. J. Remote Sens. 2021, 42, 4177–4198. [Google Scholar] [CrossRef]
  29. Furlanetto, R.H.; Crusiol, L.G.T.; Nanni, M.R.; de Oliveira, A., Jr.; Sibaldelli, R.N.R. Hyperspectral Data for Early Identification and Classification of Potassium Deficiency in Soybean Plants (Glycine max (L.) Merrill). Remote Sens. 2024, 16, 1900. [Google Scholar] [CrossRef]
  30. Demsar, J.; Curk, T.; Erjavec, A.; Gorup, C.; Hocevar, T.; Milutinovic, M.; Mozina, M.; Polajnar, M.; Toplak, M.; Staric, A.; et al. Orange: Data Mining Toolbox in Python. J. Mach. Learn. Res. 2013, 14, 2349–2353. [Google Scholar] [CrossRef]
  31. Brownlee, J. Machine Learning Mastery with Python: Understand Your Data, Create Accurate Models and Work Projects End-To-End; Machine Learning Mastery: Melbourne, Australia, 2016. [Google Scholar]
  32. Furlanetto, R.H.; Crusiol, L.G.T.; Gonçalves, J.V.F.; Nanni, M.R.; de Oliveira, A., Jr.; de Oliveira, F.A.; Sibaldelli, R.N.R. Machine Learning as a Tool to Predict Potassium Concentration in Soybean Leaf Using Hyperspectral Data. Precis. Agric. 2023, 24, 2264–2292. [Google Scholar] [CrossRef]
  33. Geron, A. Hands-On Machine Learning with Scikit-Learn & TensorFlow: Concepts, Tools and Techniques to Build Intelligent Systems; O’Reilly Media: Sebastopol, CA, USA, 2017. [Google Scholar]
  34. Jeune, W.; Francelino, M.R.; de Souza, E.; Fernandes Filho, E.I.; Rocha, G.C. Multinomial Logistic Regression and Random Forest Classifiers in Digital Mapping of Soil Classes in Western Haiti. Rev. Bras. Cienc. Solo 2018, 42, e0170133. [Google Scholar] [CrossRef]
  35. Kriegeskorte, N.; Golan, T. Neural network models and deep learning. Curr. Biol. 2019, 29, R231–R236. [Google Scholar] [CrossRef]
  36. Tahmasbian, I.; Xu, Z.; Boyd, S.; Zhou, J.; Esmaeilani, R.; Che, R.; Hosseini Bai, S. Laboratory-Based Hyperspectral Image Analysis for Predicting Soil Carbon, Nitrogen and Their Isotopic Compositions. Geoderma 2018, 330, 254–263. [Google Scholar] [CrossRef]
  37. Franceschini, M.H.D.; Demattê, J.A.M.; da Silva Terra, F.; Vicente, L.E.; Bartholomeus, H.; de Souza Filho, C.R. Prediction of Soil Properties Using Imaging Spectroscopy: Considering Fractional Vegetation Cover to Improve Accuracy. Int. J. Appl. Earth Obs. Geoinf. 2015, 38, 358–370. [Google Scholar] [CrossRef]
  38. Barmeier, G.; Hofer, K.; Schmidhalter, U. Mid-Season Prediction of Grain Yield and Protein Content of Spring Barley Cultivars Using High-Throughput Spectral Sensing. Eur. J. Agron. 2017, 90, 108–116. [Google Scholar] [CrossRef]
  39. Rasooli Sharabian, V.; Noguchi, N.; Ishi, K. Significant Wavelengths for Prediction of Winter Wheat Growth Status and Grain Yield Using Multivariate Analysis. Eng. Agric. Environ. Food 2014, 7, 14–21. [Google Scholar] [CrossRef]
  40. Chang, C.-W.; Laird, D.A.; Mausbach, M.J.; Hurburgh, C.R. Near-infrared Reflectance Spectroscopy–Principal Components Regression Analyses of Soil Properties. Soil Sci. Soc. Am. J. 2001, 65, 480–490. [Google Scholar] [CrossRef]
  41. Demattê, J.A.; Araújo, S.R.; Fiorio, P.R.; Fongaro, C.T.; Nanni, M.R. Espectroscopia VIS-NIR-SWIR na avaliação de solos ao longo de uma topossequência em Piracicaba (SP). Rev. Ciência Agron. 2015, 46, 679–688. [Google Scholar] [CrossRef]
  42. Viscarra Rossel, R.A.; Behrens, T. Using Data Mining to Model and Interpret Soil Diffuse Reflectance Spectra. Geoderma 2010, 158, 46–54. [Google Scholar] [CrossRef]
  43. Soriano-Disla, J.M.; Janik, L.J.; Viscarra Rossel, R.A.; Macdonald, L.M.; McLaughlin, M.J. The Performance of Visible, Near-, and Mid-Infrared Reflectance Spectroscopy for Prediction of Soil Physical, Chemical, and Biological Properties. Appl. Spectrosc. Rev. 2014, 49, 139–186. [Google Scholar] [CrossRef]
  44. Zhao, D.; Arshad, M.; Li, N.; Triantafilis, J. Predicting Soil Physical and Chemical Properties Using Vis-NIR in Australian Cotton Areas. Catena 2021, 196, 104938. [Google Scholar] [CrossRef]
  45. Cezar, E.; Nanni, M.R.; Chicati, M.L.; de Souza, I.G., Jr.; da Costa, A.C.S. Avaliação e Quantificação Das Frações Silte, Areia e Argila Por Meio de Suas Respectivas Reflectâncias. Rev. Bras. Cienc. Solo 2012, 36, 1157–1166. [Google Scholar] [CrossRef][Green Version]
  46. Novais, R.F.; Alvarez, V.V.H.; Barros, N.F.; Fontes, R.L.F.; Cantarutti, R.B.; Neves, J.C.L. Fertilidade do Solo; Sociedade Brasileira de Ciências do Solo: Viçosa, Brazil, 2007. [Google Scholar]
  47. Xu, S.; Wang, M.; Shi, X. Hyperspectral Imaging for High-Resolution Mapping of Soil Carbon Fractions in Intact Paddy Soil Profiles with Multivariate Techniques and Variable Selection. Geoderma 2020, 370, 114358. [Google Scholar] [CrossRef]
  48. Liu, S.; Chen, J.; Guo, L.; Wang, J.; Zhou, Z.; Luo, J.; Yang, R. Prediction of Soil Organic Carbon in Soil Profiles Based on Visible–near-Infrared Hyperspectral Imaging Spectroscopy. Soil Tillage Res. 2023, 232, 105736. [Google Scholar] [CrossRef]
  49. Liu, J.; Dong, Z.; Xia, J.; Wang, H.; Meng, T.; Zhang, R.; Han, J.; Wang, N.; Xie, J. Estimation of Soil Organic Matter Content Based on CARS Algorithm Coupled with Random Forest. Spectrochim. Acta A Mol. Biomol. Spectrosc. 2021, 258, 119823. [Google Scholar] [CrossRef] [PubMed]
  50. Tajik, S.; Ayoubi, S.; Zeraatpisheh, M. Digital Mapping of Soil Organic Carbon Using Ensemble Learning Model in Mollisols of Hyrcanian Forests, Northern Iran. Geoderma Reg. 2020, 20, e00256. [Google Scholar] [CrossRef]
  51. Bogaert, P.; Taghizadeh-Mehrjardi, R.; Hamzehpour, N. Model averaging of machine learning algorithms for digital soil mapping: A minimum variance framework. Geoderma 2023, 437, 116604. [Google Scholar] [CrossRef]
  52. Camargo, L.A.; Marques, J., Jr.; Barrón, V.; Alleoni, L.R.F.; Pereira, G.T.; Teixeira, D.D.B.; de Souza Bahia, A.S.R. Predicting Potentially Toxic Elements in Tropical Soils from Iron Oxides, Magnetic Susceptibility and Diffuse Reflectance Spectra. Catena 2018, 165, 503–515. [Google Scholar] [CrossRef]
Figure 1. Sample point distribution map (a) and AK, TK, TE, THL, KE, and AU soil monolith images (b) subdivided into horizons. AK: Arenic Kandiustults, TK: Typic Kandiaqualfs, TE: Typic Eutrudox, THL: Typic Hapludox Loamy, KE: Kandiudalfic Eutrudox, and AU: Aquic Udorthents.
Remotesensing 16 02869 g001
Figure 2. Flowchart for data acquisition and processing. (a) Shaping, structuring, and collecting the monolith, (b) collecting spectral data by non-imaging sensor and imaging sensor, (c) hyperspectral data preprocessing, (d) spectral fingerprint analysis, (e) database for soil attributes prediction, (f) machine-learning model analysis.
Remotesensing 16 02869 g002
Figure 3. Mean spectral signature of soil suborders based on hyperspectral sensors. (a) VIS-NIR and SWIR imaging sensors, (b) VIS-NIR-SWIR non-imaging sensor. The interruption in the spectral signature of imaging sensors indicates the change in the sensor. AK: Arenic Kandiustults, TK: Typic Kandiaqualfs, TE: Typic Eutrudox, THL: Typic Hapludox Loamy, KE: Kandiudalfic Eutrudox, AU: Aquic Udorthents.
Remotesensing 16 02869 g003
Figure 4. Data distribution of (a) sand, (b) clay, and (c) soil organic carbon, measured versus predicted based on VIS-NIR spectra and k-nearest neighbors (KNN), random forest (RF), and neural network (NN) models. The dashed line indicates the 1:1 line to illustrate deviations between predicted and measured data.
Remotesensing 16 02869 g004
Figure 5. Soil attributes measured and predicted in different soil layers based on VIS-NIR spectra and k-nearest neighbors (KNN), random forest (RF), and neural network (NN) models. Sand and clay were sampled every 5 cm, and soil organic carbon (SOC) was sampled every 10 cm. AK: Arenic Kandiustults, TK: Typic Kandiaqualfs, TE: Typic Eutrudox, THL: Typic Hapludox Loamy, KE: Kandiudalfic Eutrudox, AU: Aquic Udorthents.
Remotesensing 16 02869 g005
Figure 6. Data distribution of (a) sand, (b) clay, and (c) soil organic carbon, measured versus predicted based on SWIR spectra and k-nearest neighbors (KNN), random forest (RF), and neural network (NN) models. The dashed line indicates the 1:1 line illustrating deviations between predicted and measured data.
Remotesensing 16 02869 g006
Figure 7. Soil attributes measured and predicted in different soil layers based on SWIR spectra and k-nearest neighbors (KNN), random forest (RF), and neural network (NN) models. Sand and clay were sampled every 5 cm, and soil organic carbon (SOC) was sampled every 10 cm. AK: Arenic Kandiustults, TK: Typic Kandiaqualfs, TE: Typic Eutrudox, THL: Typic Hapludox Loamy, KE: Kandiudalfic Eutrudox, AU: Aquic Udorthents.
Remotesensing 16 02869 g007
Figure 8. Data distribution of (a) sand, (b) clay, and (c) soil organic carbon, measured versus predicted based on VIS-NIR-SWIR spectra and k-nearest neighbors (KNN), random forest (RF), and neural network (NN) models. The dashed line indicates the 1:1 line to illustrate deviations between predicted and measured data.
Remotesensing 16 02869 g008
Figure 9. Soil attributes measured and predicted in different soil layers based on VIS-NIR-SWIR spectra and k-nearest neighbors (KNN), random forest (RF), and neural network (NN) models. Sand and clay sampled every 5 cm, and soil organic carbon (SOC) sampled every 10 cm. AK: Arenic Kandiustults, TK: Typic Kandiaqualfs, TE: Typic Eutrudox, THL: Typic Hapludox Loamy, KE: Kandiudalfic Eutrudox, AU: Aquic Udorthents.
Remotesensing 16 02869 g009
Table 1. Taxonomic classification of soils and properties for the samples used to build predictive models.
Taxonomy UnitsID 2Layern 3SandSiltClayn 4SOC 5
SiBCS 1Soil Taxonomy(Part. Size)Max ± Min
(g kg−1)
(SOC)Max ± Min
(g dm−3)
Argissolo Vermelho Ta Distrófico Arenic KandiustultsAKTopsoil8920 ± 89010 ± 10100 ± 7057.04 ± 1.49
Subsoil24870 ± 74030 ± 10250 ± 120111.25 ± 0
Gleissolo Háplico Ta Distrófico Typic KandiaqualfsTKTopsoil5930 ± 90010 ± 1090 ± 6036.67 ± 1.98
Subsoil25930 ± 47030 ± 10510 ± 70124.87 ± 1.37
Latossolo Vermelho Eutrófico Typic EutrudoxTETopsoil4170 ± 110100 ± 30860 ± 770318.36 ± 5.35
Subsoil28130 ± 3060 ± 10930 ± 830144.63 ± 1.61
Latossolo Vermelho Distrófico Typic Hapludox LoamyTHLTopsoil7720 ± 64030 ± 20330 ± 250418.6 ± 6.07
Subsoil25710 ± 63040 ± 10350 ± 270127.16 ± 2.1
Nitossolo Vermelho Eutrófico Kandiudalfic EutrudoxKETopsoil8190 ± 130100 ± 60790 ± 750411.61 ± 4.02
Subsoil24250 ± 13080 ± 20830 ± 730113.3 ± 0.77
Gleissolo Háplico Ta Eutrófico Aquic UdorthentsAUTopsoil5210 ± 19080 ± 40770 ± 710334.87 ± 23.3
Subsoil27270 ± 9080 ± 20890 ± 690137.28 ± 1.73
Total 190 95
1 Brazilian Soil Classification System, 2 Abbreviation for identification, 3 Number of samples for particle size (sand, silt, and clay), 4 Number of samples for SOC, 5 Soil organic carbon.
Table 2. Statistical parameters of soil attributes prediction based on machine learning models and VIS-NIR spectra.
AttributesParametersModel
KNNSVMRFLRNNPLSR
SandRMSE (g kg−1)3.878.225.8012.727.1510.23
RPD5.802.773.891.843.172.29
R20.990.930.970.840.950.90
SiltRMSE (g kg−1)1.351.751.441.771.621.47
RPD1.201.041.151.031.081.13
R20.560.260.500.240.370.47
ClayRMSE (g kg−1)4.078.846.2812.696.1310.59
RPD5.312.493.461.783.552.11
R20.980.920.960.830.960.88
SOCRMSE (g dm−3)4.074.844.214.974.504.77
RPD1.121.031.101.021.061.03
R20.450.220.410.180.330.24
KNN: k-nearest neighbors, SVM: support vector machine, RF: random forest, LR: linear regression, NN: artificial neural network, PLSR: partial least square regression, RMSE: root mean square error, RPD: ratio of performance to deviation, R2: coefficient of determination.
Table 3. Statistical parameters of soil attribute prediction based on machine learning models and SWIR spectra.
AttributesParametersModel
KNNSVMRFLRNNPLSR
SandRMSE (g kg−1)3.5210.034.4610.765.6310.23
RPD6.372.295.042.144.002.24
R20.990.900.980.880.970.90
SiltRMSE (g kg−1)1.351.881.301.541.681.52
RPD1.211.011.241.111.061.12
R20.560.140.590.430.320.44
ClayRMSE (g kg−1)3.4311.244.0611.016.478.83
RPD6.301.985.322.023.362.48
R20.990.860.980.870.950.92
SOCRMSE (g dm−3)3.494.963.894.713.883.77
RPD1.251.021.151.041.161.18
R20.600.190.500.260.500.53
KNN: k-nearest neighbors, SVM: support vector machine, RF: random forest, LR: linear regression, NN: artificial neural network, PLSR: partial least square regression, RMSE: root mean square error, RPD: ratio of performance to deviation, R2: coefficient of determination.
Table 4. Statistical parameters of soil attribute prediction based on machine learning models and VIS-NIR-SWIR spectra.
AttributesParametersModel
KNNSVMRFLRNNPLSR
SandRMSE (g kg−1)2.887.164.177.893.747.94
RPD7.803.175.392.886.002.86
R20.990.950.980.940.990.94
SiltRMSE (g kg−1)1.191.431.261.681.421.31
RPD1.331.161.271.061.161.23
R20.660.500.620.320.510.59
ClayRMSE (g kg−1)2.897.343.528.045.027.47
RPD7.472.986.142.724.322.91
R20.990.940.990.930.970.94
SOCRMSE (g dm−3)3.304.063.804.893.053.86
RPD1.301.121.171.021.391.15
R20.640.460.520.210.690.50
KNN: k-nearest neighbors, SVM: support vector machine, RF: random forest, LR: linear regression, NN: artificial neural network, PLSR: partial least square regression, RMSE: root mean square error, RPD: ratio of performance to deviation, R2: coefficient of determination.
Disclaimer/Publisher’s Note: The statements, opinions and data contained in all publications are solely those of the individual author(s) and contributor(s) and not of MDPI and/or the editor(s). MDPI and/or the editor(s) disclaim responsibility for any injury to people or property resulting from any ideas, methods, instructions or products referred to in the content.