Abstract
Detecting aircraft targets in Synthetic Aperture Radar (SAR) images is critical for military and civilian applications. However, due to SAR’s special imaging mechanism, aircraft targets often consist of scattering points with large fluctuations in intensity. This often leads to the detector failing to detect weak scattering points. Not only that, previous SAR image aircraft-object-detection models have focused more on detecting and locating targets, with little emphasis on target recognition. This paper proposes a scattering-point-intensity-adaptive detection and recognition network (SADRN). In order to correctly detect the target area, we propose a Self-adaptive Bell-shaped Kernel (SBK) within the detector, which constructs a bell-shaped two-dimensional distribution centered on the target center, making the detection “threshold” for the target decrease from the center towards the periphery, reducing the missed alarms of weak scattering points at the edges of the target. To help the model adapt to multi-scale targets, we propose the FADLA-34 backbone network, aggregating information from feature maps across different scales. We also embed CBAM into the detector, which enhances the attention to the target area in the spatial dimension and strengthens the extraction of useful features in the channel dimension, reducing interference from the complex background clutter on object detection. Furthermore, to integrate detection and recognition, we introduce the multi-task head, which utilizes the three feature maps from the backbone network to generate the detection boxes and categories of the targets. Finally, the SADRN achieves superior detection and recognition performance on the SAR-AIRcraft-1.0, exceeding other mainstream methods. Visualization and analysis further confirm the effectiveness and superiority of the SADRN.
1. Introduction
Synthetic Aperture Radar (SAR) is a ground-based observation system that utilizes the continuous movement of radar antennas on a flying platform to simulate a long antenna, thus achieving high-resolution imaging. SAR observes the Earth’s surface all-day and all-weather, possessing strong penetration capabilities and capable of acquiring high-quality image information [1,2,3]. Therefore, SAR is applied in various fields, such as soil detection, disaster monitoring, environmental surveillance, and military reconnaissance, where it offers unique advantages that are difficult to replace with other remote sensing methods. Airport aircraft, as typical targets, have wide applications in both military and civilian domains. Hence, aircraft object detection in SAR images has become one of the current research hotspots.
Traditional SAR image object-detection methods primarily rely on manual extraction of target scattering features and the CFAR algorithm [4]. Manual extraction of target features relies mainly on previous object detection experience and expert analysis. When the target background becomes complex, manual feature extraction becomes difficult. This results in a significantly reduced accuracy and a lack of robustness in detection. CFAR is a common object-detection algorithm in radar systems, which adaptively estimates the statistical characteristics of complex background noise to obtain target echoes, thus achieving object detection. Considering the non-uniformity of the background, several researchers have explored the statistical characteristics of target echoes and background clutter, proposing many improved algorithms for CFAR, such as CA-CFAR [5], SO-CFAR [6], VI-CFAR [7], OS-CFAR [8], etc. CA-CFAR and SO-CFAR are both mean-type CFAR detectors, which take the average of the sampled power of target echoes within the reference window as an estimate of the background clutter power. CA-CFAR minimizes the missed alarm rate of SAR image object detection to the greatest extent, but it does not adequately tackle the challenge of multi-target occlusion. SO-CFAR enhances the ability to detect multiple targets; however, a significant drawback is the high false alarm rate observed in the edge regions of background clutter. VI-CFAR adjusts the threshold and window size according to the actual situation, improving the precision of object detection and reducing the false alarm rate, but it requires more computational resources. OS-CFAR sorts the sampling data in ascending order within the reference window and selects the k-th value as the background clutter power, further improving the model’s accuracy in multi-object detection, but still suffers from a high false alarm rate in the edge regions of background clutter.
In recent years, as SAR imaging technology advances, SAR images have increased in scale, and the information in the images has become more complex. This poses higher demands on the detection performance of targets in SAR images, and traditional detection methods struggle to satisfy the practical application requirements for both detection accuracy and speed. SAR imaging technology exhibits different polarization modes and illumination angles under different working modes, and targets in SAR images often exhibit different aspect angles. At this point, conventional SAR image object-detection methods have difficulty efficiently and accurately completing detection, and their generalization ability is also insufficient. As a result, there have been many SAR image object-detection methods involving deep learning. Deep learning leverages the greater feature extraction capability of the convolutional neural network (CNN) to better utilize the correlation characteristics of scattering points in SAR images. It has unique advantages in detection accuracy. Detection methods based on deep learning are classified into two main categories: one-stage and two-stage methods. Two-stage methods initially employ a Region Proposal Network (RPN) to propose several regions of interest (RoI) where targets may exist and then further refine these regions for object detection and recognition. Classic models of such a method include Fast R-CNN [9], Faster R-CNN [10], Cascade R-CNN [11], etc. Jiao et al. [12] constructed a ship detection model utilizing Faster R-CNN and validated its effectiveness in multi-scale ship detection in SAR images. The one-stage method infers target bounding boxes and performs classification directly based on the target features extracted by CNNs, saving a significant amount of computational resources and time. Common one-stage methods include RetinaNet [13], SSD [14], YOLOv7 [15], CornetNet [16], etc. Zhou et al. [17] designed a lightweight network inspired by YOLO, which adopts small convolutions to extract image features and adds bidirectional dense connection modules to reduce network complexity. This approach achieves high-precision detection of SAR image targets with less memory and computational cost.
Considering the influence of complex background clutter, the precision of the object detection of the above-mentioned deep learning models is affected by SAR images. Wang et al. [18] conducted a rapid candidate target search using the saliency region method, followed by precise detection using a CNN. He et al. [19] addressed the scattering mechanism of SAR images and constructed a multi-layer parallel network using deep features and component information to reduce the false alarms of aircraft detection. Guo et al. [20] combined an Attention Pyramid Network (APN) with Scatter Information Enhancement (SIE) for aircraft detection within SAR images under complex backgrounds and dense target arrangements. However, aircraft detection within SAR images remains challenging because of SAR’s complex imaging mechanism. Aircraft within SAR images are represented by a series of scattering points with large fluctuations in intensity, making targets prone to being divided into multiple discrete components. Moreover, there are many irrelevant devices around land aircraft, which also appear as multiple strong scattering points in SAR images, leading to confusion with aircraft and increasing the difficulty of detection. The scattering characteristics of different categories of aircraft are relatively similar, and under different imaging angles, targets of the same category also exhibit different scattering characteristics, resulting in large intra-class differences, making the recognition task of aircraft difficult. Furthermore, most of the previous research has focused solely on object detection, without the classification of aircraft.
To address the challenges mentioned above, the paper proposes a scattering-point-intensity-adaptive detection and recognition network (SADRN) to enhance the performance of integrated detection and recognition for aircraft targets amidst complex backgrounds and multi-scale cases. Considering the small aircraft targets in SAR images, directly predicting rectangular detection boxes for these targets is difficult and prone to missed alarms. The model predicts the target center instead of the rectangular detection box. Simultaneously, it constructs a Self-adaptive Bell-shaped Kernel (SBK), which constructs a bell-shaped two-dimensional distribution centered on the target center, making the detection “threshold” for the target decrease from the center towards the periphery, reducing the missed alarms of weak scattering points at the edges of the target. Since aircraft targets in SAR images exhibit multi-scale characteristics, the paper proposes the full-aggregation DLA-34 backbone network (FADLA-34) to aggregate the multi-scale feature maps from different network stages, reducing missed alarms on small targets. The backbone network finally outputs three feature maps: the different categories’ heatmap of the target center, the offset map of the target center, and the size map of the object-detection boxes. Meanwhile, to minimize interference from complex backgrounds on aircraft detection, we embedded the Convolutional Block Attention Module (CBAM) [21] into the FADLA-34 backbone network, which assigns weights to the feature map generated by each convolutional block from the channel dimension and spatial dimension, measuring the contribution of different regions to detection and recognition. In the channel dimension, it utilizes different features extracted from different channels to more sufficiently describe aircraft. In the spatial dimension, it enhances the distinction between target regions and the background, suppressing clutter interference from complex backgrounds. To achieve the integrated detection and recognition of the network, we constructed a multi-task head, which utilizes three feature maps output by the backbone network. The recognition result is the category of the heatmap with the highest pixel value at the center of the target, while the other two feature maps are used to generate the detection box of the target. The concept of integrated detection and recognition is illustrated in Figure 1.
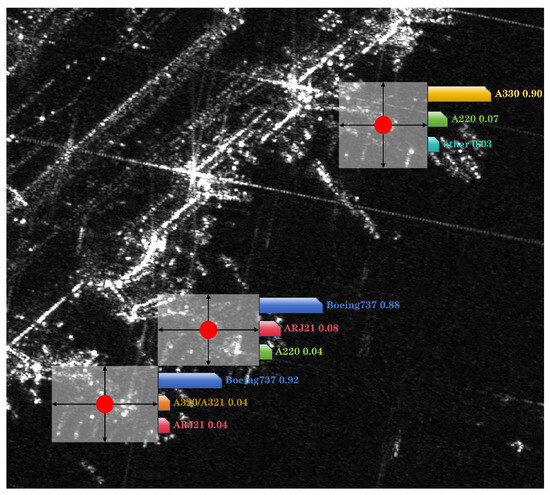
Figure 1.
We propose a model that views the detection target as the target center. The size of the target is inferred from the feature of the target center. The model ultimately generates object-detection boxes and a category probability distribution.
The following are the summarized contributions we have made in this work:
(1) The proposed SADRN enhances the detection capability of multi-scale targets by predicting the target center instead of the bounding box. Additionally, we constructed a Self-adaptive Bell-shaped Kernel (SBK), which constructs a bell-shaped two-dimensional distribution centered on the target center, making the equivalent detection “threshold” for the target decrease from the center towards the periphery, reducing the missed alarms of weak scattering points at the target edges. The detection and recognition performance of the SADRN on the high-resolution SAR aircraft detection and recognition dataset (SAR-AIRcraft-1.0) outperforms current mainstream networks.
(2) We introduce the full-aggregation DLA-34 backbone network (FADLA-34) to address the challenges in detection and recognition caused by the characteristics of aircraft in SAR images. DLA-34 aggregates the multi-scale feature maps across different network stages, reducing the missed alarms for small aircraft targets in SAR images. Meanwhile, CBAM is embedded in the backbone network, considering the attention to the channel dimension and the spatial dimension. The channel attention module utilizes different features extracted from different channels to sufficiently describe aircraft targets in SAR images. The spatial attention module strengthens the difference between the target regions and background in SAR images to minimize interference from complex background clutter on object detection.
(3) We utilized the multi-task head to realize the integration of detection and recognition, which utilizes three feature maps output by the backbone network: the different categories’ heatmap of the target center, the offset map of the target center, and the size map of the object-detection boxes. The recognition result is the category of the heatmap with the highest pixel value at the center of the target, while the other two feature maps are used for generating the detection box of the target.
2. Related Work
2.1. CNN-Based Object Detection
The CNN has strong feature-extraction capabilities on images and has been widely used in recent years in the field of computer vision. Today, CNN-based object-detection methods have surpassed traditional detection methods and become the mainstream approach for object detection. Now, CNN-based object-detection methods are primarily divided into two categories, namely two-stage and one-stage detectors.
Two-stage detectors initially utilize the RPN to perform feature extraction on images and generate RoIs, then classify and post-process these RoIs. The main focus of this method is on how to improve the capabilities of feature extraction of the RPN on images to improve the correct probability of generating RoIs, thus enhancing the accuracy of object detection. These methods build upon RoIs, mainly represented by the series of algorithms known as R-CNNs: Fast R-CNN [9], Faster R-CNN [10], Cascade R-CNN [11], etc. The R-CNN was the first to apply the CNN to the domain of object detection, exhibiting excellent detection performance, with CNN-extracted deep features replacing traditional features such as HOG and SIFT. Fast R-CNN advances upon R-CNN by introducing the RoI pooling layer, which converts multi-scale RoIs into feature maps of the same scale, significantly increasing detection speed. Faster R-CNN [10] abandons selective search methods and conventional sliding windows, generating RoIs directly using the RPN, greatly improving the speed of RoI generation and, thus, enhancing detection performance. Cascade R-CNN [11] designs multiple cascaded R-CNNs, using progressively increased IoU thresholds to train each detector, effectively enhancing the detection performance of the network.
One-stage detectors predict target classification and position directly based on features extracted by the CNN, generating final prediction results in a single detection step without the need to generate RoIs. Therefore, compared to two-stage detectors, they have faster detection speeds. However, the accuracy may decrease when detecting small targets because two-stage detectors perform fine-grained processing on each region after generating the RoIs, thereby achieving more accurate object detection. Typical one-stage detectors include the SSD [14] and RetinaNet [13]. The SSD [14] detects targets using multi-scale feature maps, making it highly adaptable to targets of different scales. RetinaNet [13] first proposed the Focal loss function, reducing the impact of extremely imbalanced positive and negative sample ratios on the accuracy of one-stage detectors.
2.2. CNN-Based SAR Image Aircraft Detection
Due to advancements in deep learning and SAR image resolution, the CNN has found successful applications in SAR image object detection. However, owing to the special imaging mechanism of SAR, aircraft targets are typically composed of scattering points with large fluctuations in intensity. This often leads to missed alarms of weak scattering points.
However, the SSD [14] and RetinaNet [13] mentioned above are both anchor-based detectors, where anchors are predefined detection boxes for targets using sliding windows. Currently, many anchor-free detectors have emerged, eliminating the need to preset a large number of anchors through sliding windows, further improving the model’s detection speed. CornerNet [16] is an anchor-free network proposed in recent years, using the bottom-right and the top-left corners of the object-detection box to jointly represent the detection box.
To reduce the missed alarms of target’s weak scattering points, we introduce an anchor-free target detector, which transforms delineating the object-detection box into locating the center on the target. Since the targets on the SAR images are mostly discrete scattering points, most anchors generated by anchor-based detectors frame only one scattering point of the target, thus wasting computational costs and reducing the accuracy of detection. Our method first detects the center of the target and then predicts the target size, allowing it to determine the target area at a more granular level. These advantages make it suitable for detecting aircraft in SAR images. When anchor-based detection methods preset anchors, if the predicted value of a pixel is 1, then the point is determined to be within the anchor area, and if the predicted value is 0, it is determined as the background. This determination method is too strict for weak scattering points within the target, causing missed alarms of weak scattering points, ultimately leading to inaccurate positioning of the target area. To avoid this situation, we constructed a bell-shaped two-dimensional distribution centered on the target center, which is determined by the statistical characteristics of the scattering points. This causes the equivalent detection “threshold” for scattering points to decrease from the center towards the periphery, reducing the missed alarms of weak scattering points at the target edges. The differences between the method we propose and the standard anchor-based detector are illustrated in Figure 2.
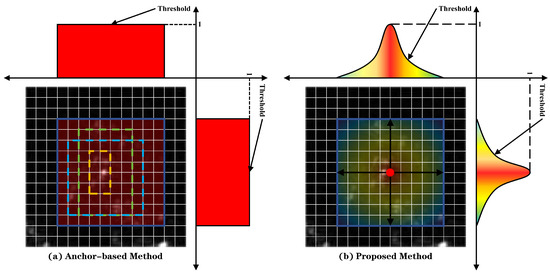
Figure 2.
The differences between our proposed anchor-free method and the standard anchor-based method. (a) The dashed boxes represent anchors; the solid blue boxes represent the ground truth; the color indicates the level of the equivalent detection “threshold”. (b) The model first detects the center point and then infers the information of the object-detection box. The equivalent detection “threshold” decreases from the center outward.
Moreover, targets are often multi-scale and blurry and are heavily influenced by background interference, making object detection in SAR images using the CNN still a challenging problem. To improve the accuracy of SAR image object detection, the attention module is embedded into CNNs, which allows CNNs to autonomously learn and selectively focus on feature extraction in the target regions of SAR images, reducing interference from background clutter on object detection, thereby improving the model’s effectiveness and generalization capability.
In the aspect of aircraft detection within SAR images, Zhao et al. [22] developed a novel pyramid attention expansion network. The network simultaneously embeds multi-branch dilated convolution modules (MBDCMs) and CBAM, refining redundant information to highlight important features of aircraft. Huang et al. [23] integrated an efficient channel attention module into YOLO5s, effectively suppressing irrelevant background information while enhancing the speed and accuracy of the network. This integration endows the model with robust anti-interference capabilities. Zhao et al. [24] proposed the attentional feature refinement and alignment network (AFRAN) by adding the attention feature fusion module (AFFM) to fully integrate high-level semantic features and low-level texture features of aircraft. Kang et al. [25] proposed the scattering feature relationship network (SFR-Net), which not only integrates contextual feature attention, but also expands the receptive field to facilitate capturing global information. This enhancement leads to improved target localization accuracy. Lin et al. [26] integrated a weakly supervised deformable convolution module (WSDCM) and CBAM, accurately locating aircraft spots while effectively suppressing interference.
To tackle the detection challenges arising from complex background clutter and the multi-scale characteristic of targets, we introduce a backbone network, aggregating information from multi-scale feature maps to reduce missed alarms for small targets. Additionally, it embeds CBAM to enhance attention on target regions, which assigns weights to the feature map generated by each convolutional block from the channel dimension and the spatial dimension, measuring the contribution from different regions to detection and recognition.
Furthermore, previous studies on SAR image aircraft object detection primarily focused on locating rectangular detection boxes for aircraft targets, but neglected target classification. Performing detection and recognition tasks simultaneously causes their interference with each other, resulting in a decline in the performance of both tasks. Given this, we constructed a multi-task head to achieve integrated detection and recognition, which makes the model exhibit excellent performance.
3. Methods
Due to the special imaging mechanism of SAR images, aircraft targets are typically composed of scattering points with large intensity variations, making the detection prone to missed alarms of weak scattering points. Aircraft targets in SAR images exhibit multi-scale characteristics, which can lead to missed alarms of small targets. The clutter from complex backgrounds often affects object detection, then reduces detection accuracy. Furthermore, previous SAR image target detectors only focused on locating targets, lacking the ability of target classification. To address these issues in SAR image aircraft object detection, we propose the SADRN architecture, simultaneously possessing excellent multi-task capabilities.
3.1. Scattering-Point-Intensity-Adaptive Detection and Recognition Network
The overall architecture of the network structure we propose, SADRN, is illustrated in Figure 3. It consists of four modules: the full-aggregation DLA-34 (FADLA-34) backbone, Self-adaptive Bell-shaped Kernel (SBK), Convolutional Block Attention Module (CBAM), and multi-task head. In SAR images, aircraft targets exhibit multi-scale characteristics, often leading to missed alarms of small targets. Therefore, to improve the model’s detection accuracy for multi-scale targets, we constructed the FADLA-34 backbone. The input of FADLA-34 is SAR images , and its output consists of three feature maps, the heatmap of the target center , the offset map of the target center , and the size map of the object-detection boxes , where W and H denote the size of the input SAR image, C denotes the number of aircraft categories, and R denotes the downsampling stride, typically set to 4 by default. The three feature maps are utilized by the multi-task head for integrated detection and recognition. FADLA-34 integrates information from different scale feature maps at various stages of the network. To mitigate interference from background clutter, CBAM is embedded within the FADLA-34 backbone network. CBAM calculates the weights for the channel dimension and the spatial dimension of the input feature maps through pooling and other operations. The input feature maps are then sequentially multiplied by the channel weights and spatial weights to obtain processed feature maps. These processed feature maps enhance attention on the target area. In SAR images, the significant intensity variations of the target scattering points often result in false alarms. The SBK maps a bell-shaped two-dimensional distribution around each target center in the heatmap’s ground truth . The heatmap’s ground truth Y processed by the SBK is then used to train the heatmap. Since the pixel values at the edges of the bell-shaped distribution are relatively low, it reduces the detection “threshold” for weak scattering points at the edges of the target, enabling the model to better locate the target area. The multi-task head is utilized to achieve integrated detection and recognition. For the same target, among the heatmap of different categories, the multi-task head selects the heatmap with the highest pixel value at the target center. The category to which this heatmap belongs is considered as the model’s recognition result. Meanwhile, the multi-task head utilizes the offset map and size map to generate the detection box for the target.

Figure 3.
Architecture of the proposed method. A single SAR image serves as the input of this network and will first be processed in the FADLA-34 backbone with the embedded CBAM for feature extraction. The ground truth generated by the SBK module is used to train the network to predict the heatmap. The multi-task head achieves the integration of detection and recognition and outputs the detection and recognition results.
3.2. The Design of Loss Function
The FADLA-34 backbone predicts the target center heatmap , target center offset map , and detection box size map .
Let represent the collection of the predicted center heatmap for each class. When the prediction result , this indicates that the point at coordinates in the heatmap of category c is detected as the target center, while indicates that the point is detected as background. Let the ground truth heatmap of the target center be denoted as Y. Next, an SBK is mapped around each target center of Y. The processed ground truth Y is used to train the heatmap. The loss function for the heatmap adopts the Focal loss [13], denoted as in Equation (1):
where and denote the hyper-parameters of the Focal loss. In the experiments, and . N denotes the number of target centers in SAR image I.
By minimizing the loss function , at the true center , where , the predicted value will approach 1 during training. Conversely, at the non-center, where , the predicted value will gradually approach 0.
represents the predicted offset of the center. In inference, due to the downsampling performed by the backbone network, there will be accuracy errors when the predicted center points are remapped to the original image. Therefore, each center point requires additional offset . In SAR images I, the coordinate denotes the center of target k. After downsampling by the backbone, the corresponding coordinate is obtained as , where and . represents the ground truth used for training the offset of the center. All categories c share the same offset map . The L1 loss is adopted as the loss function for the offset of the center, denoted as in Equation (2):
where denotes the predicted offset for the center of target k and N denotes the number of target centers in SAR image I.
By minimizing the loss function , the predicted offset approaches the true offset during training.
represents the predicted size of the object-detection boxes, which uses and to, respectively, represent the predicted width and height of the detection boxes. Let denote the detection box of target k. The size of target k is denoted as . represents the ground truth used for training the size of the detection boxes. All categories c share the same size map . The loss function for the size of targets uses the L1 loss, denoted as in Equation (3):
where denotes the predicted size of the target k and N denotes the number of target centers in SAR image I.
By minimize the loss function , the predicted size of the detection box approaches the true size during training.
The overall loss function for the SADRN network can be described by Equation (4):
where and are used to balance the influence of each loss function on the experiment. We set these to the default as and .
3.3. Multi-Scale Aircraft-Detection and -Recognition Model
Addressing the multi-scale characteristic of aircraft targets in SAR images, we propose that the FADLA-34 backbone network consists of DLA-34 [27] and the Deformable Convolution Network (DCN) [28]. The structure of FADLA-34 is shown in Figure 4. DLA-34, serving as an image-classification network, possesses the ability of hierarchical skip connections to aggregate the feature maps of different sizes to improve the adaptability to multi-scale targets of the network in SAR images. Meanwhile, deformable convolution is utilized in the fusion of feature maps. Unlike regular convolution operations, deformable convolution can adaptively extract effective features within the target region, enabling the model to better accommodate the irregular shape of aircraft in SAR images. When SAR image is input in the backbone network, FADLA-34 first employs the DLA-34 network to extract multi-scale feature maps from different network stages, followed by the DCN to upsample and aggregate these feature maps to the same scale. FADLA-34 ultimately outputs , which contains three feature maps: heatmap , offset map , and size map . The size of these feature maps is four-times smaller than the input SAR image I.
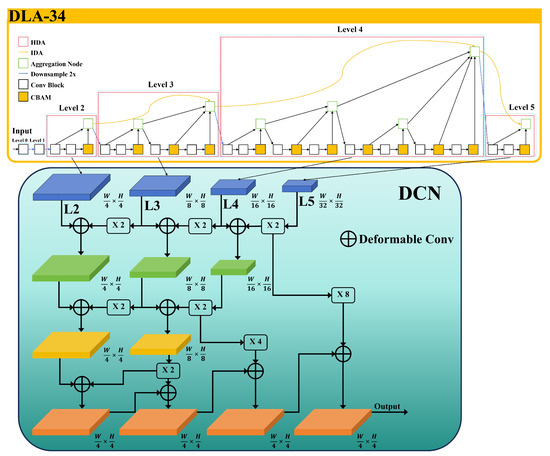
Figure 4.
The structure diagram of FADLA-34. L2, L3, L4, and L5 are the output feature maps of each corresponding level in DLA-34. The fusion symbol represents that two feature maps of the same size are fused using deformable convolution. The symbol represents that the feature map undergoes a upsampling. The symbol represents a upsampling. The symbol represents an upsampling.
3.3.1. DLA-34
DLA-34 [27] is divided into six levels from Level 0 to Level 5, with connections between different levels through Iterative Deep Aggregation (IDA) and Hierarchical Deep Aggregation (HDA), and the downsample stride for each level is 2. The operations between Level 0 and Level 1 are the same, where the input feature map undergoes convolution once, followed by downsampling, and then, outputs the feature map. The operations in the remaining levels are more complex, involving convolution, the aggregation node, and embedded CBAM. We will introduce CBAM in the following subsection.
In DLA-34, we utilize aggregation nodes to merge feature maps from different layers or blocks into a single feature output, which is illustrated in Figure 5. The aggregation node chooses a convolution followed by batch normalization and, finally, activates the feature map by the sigmoid nonlinear function.

Figure 5.
The structure diagram of the aggregation node.
The IDA iteratively aggregates subsequent network stages starting from the shallowest network stage, allowing shallow feature information to propagate to the subsequent stages. The structure of the IDA is shown in Figure 6.
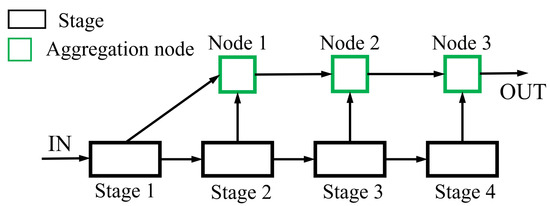
Figure 6.
The structure diagram of the IDA.
The HDA focuses on the connections between blocks within a network stage. Using a tree-like structure, the HDA integrates features output by blocks within each stage multiple times. The structure shown in Figure 7 is an HDA with a depth of 3. The HDA function is defined by the following Equation (5):
where denotes the HDA structure with depth n and R and L denote the child nodes in the HDA structure, as defined in Equations (6) and (7).
where B denotes the convolution block.
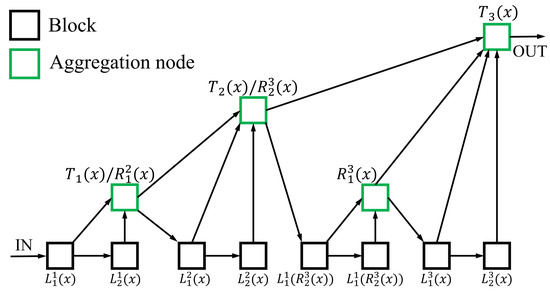
Figure 7.
The structure diagram of the HDA.
3.3.2. Deformable Convolution Network
The DCN [28] extracts four multi-scale feature maps (L2 to L5) output by each level of the DLA-34 network. These feature maps are sequentially upsampled and fused into one feature map for output. In the DCN, deformable convolution is used instead of standard convolution.
When the shape of a target varies significantly, standard convolution operations struggle to adapt due to their small receptive fields, which increases the difficulty of feature extraction. Deformable convolution adds a learnable offset to each pixel point in the receptive field. These offsets are generated through a standard convolution operation. The spatial dimension of the offset field aligns with the input feature map, and the channel dimension is , where N represents the number of pixels contained in the receptive field of the convolution kernel. The resulting receptive field is no longer a traditional square, but rather matches the shape of the target. The difference in receptive fields between the deformable convolution and standard convolution is illustrated in Figure 8. First, we assume that the grid Z defines all coordinates of the pixels in the convolution kernel in the following Equation (8).
When performing the standard convolution operation with this kernel at coordinate on the feature map x, the convolution output is as shown in Equation (9).
where y denotes the output feature map, denotes the enumeration of the coordinates in Z, and denotes the weight at coordinates on the convolution kernel.
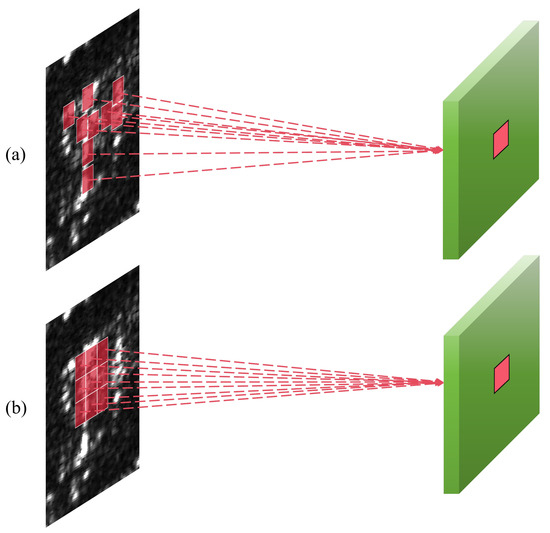
Figure 8.
The difference in receptive fields between deformable convolution and standard convolution. (a) Deformable convolution. (b) Standard convolution.
In deformable convolution, the receptive field is no longer confined to a square. Compared to standard convolution, an offset is added at each coordinate of input feature map x, where . The deformable convolution output is shown in Equation (10):
The deformable convolution is shown in Figure 9; the input feature map first generates an offset field with channels by convolution. Each pixel contains two offset values, one for the horizontal direction and one for the vertical direction. These offset values are then applied to each coordinate of the input feature map x.
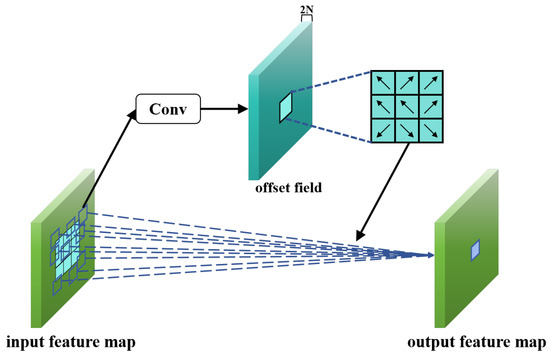
Figure 9.
The schematic diagram of deformable convolution.
3.4. Attention Module
CBAM [21] comprises two components: the Channel Attention Module (CAM) and Spatial Attention Module (SAM). CAM exploits different features extracted by different channels to provide a sufficient description of the target, enabling the network to concentrate more on feature information in the target area. SAM utilizes the differences between the target region and background clutter within SAR images to reduce complex background interference on object detection. Figure 10 shows the overall framework of CBAM.

Figure 10.
The overall framework of CBAM.
CAM and SAM calculate the input feature map through pooling and other steps, obtaining weights for the channel dimension and the spatial dimension. Next, the input feature map is multiplied by the channel weights and spatial weights sequentially to produce the output feature map. The output feature map strengthens the attention on the target area.
The framework of CAM is illustrated in Figure 11. Firstly, the input feature map undergoes separate max pooling (MaxPool) and average pooling (AvgPool) operations in the spatial dimension, obtaining two types of weights for the channel dimension. Then, the two weights pass through the multi-layer perceptron (MLP) layer for nonlinear feature transformation, followed by summation. The output weights for each channel are activated using the sigmoid function. These weights are then used to multiply with the input features to achieve CAM. The output feature map serves as the input feature for the subsequent SAM. The output weights of CAM are represented in Equation (11).
where F represents the input feature map of CAM, represents the AvgPool layer, represents the MaxPool layer, represents the multi-layer perceptron layer, represents the sigmoid activation function, and represents the output weights of CAM.

Figure 11.
The framework of CAM.
The framework of SAM is illustrated in Figure 12. The feature map output by CAM serves as the input to SAM. The feature map undergoes MaxPool and AvgPool separately along the channel dimension, obtaining two types of weights for the spatial dimension. Subsequently, these two types of spatial weights are concatenated and undergo a standard convolution with a filter kernel size of to obtain the output weights. The output weights are activated using the sigmoid function. These weights are then used to multiply with the input features to achieve SAM. The output feature map serves as the final output of CBAM. The output weights of SAM are represented in Equation (12).
where represents the input feature map of SAM, represents convolution with a filter kernel size of , and represents the output weights of SAM.

Figure 12.
The framework of SAM.
3.5. Self-Adaptive Bell-Shaped Kernel
In typical models, object detection is achieved by having the model identify whether each pixel is part of the target region. If a pixel’s predicted value is 1, the pixel is classified as belonging to the target region; if the predicted value is 0, the pixel is classified as the background. In SAR images, the scattering points forming aircraft targets have large fluctuations in intensity. When using typical models for object detection in SAR images, the weak scattering point components at the edges of targets are prone to being misclassified as the background. This causes the detection boxes obtained by typical models to usually fail to fully enclose the targets, significantly reducing the IoU values with the ground truth. Object detection models typically consider predictions successful when the IoU between the detection box and the ground truth is greater than 0.5. However, when the models miss too many edge weak scattering points, the IoU of the target drops below 0.5, leading to an excessive number of missed alarms for aircraft targets.
The SBK maps the two-dimensional bell-shaped distribution determined by the statistical characteristics of scattering points to each target center in the heatmap’s ground truth. This ensures that the equivalent “threshold” for the detection of scattering points decreases from the center to the surroundings. We utilized the processed ground truth to train the model to predict the heatmap. At this point, the predictable values of weak scattering points at the edges of targets are no longer just the “strict” 0 and 1, reducing the problem of inaccurate target area localization caused by the model’s failure to detect weak scattering points.
Among the various two-dimensional bell-shaped distributions, we chose the representative two-dimensional Gaussian distribution as an example, then mapped the Gaussian distribution to each target center in the ground truth, as illustrated in Figure 13. The self-adaptive two-dimensional Gaussian distribution is represented in Equation (13):
where denotes the value of pixel in ground truth , denotes the coordinate of the target center in the ground truth, and denotes the adaptive parameter used to adjust the size of the Gaussian distribution.
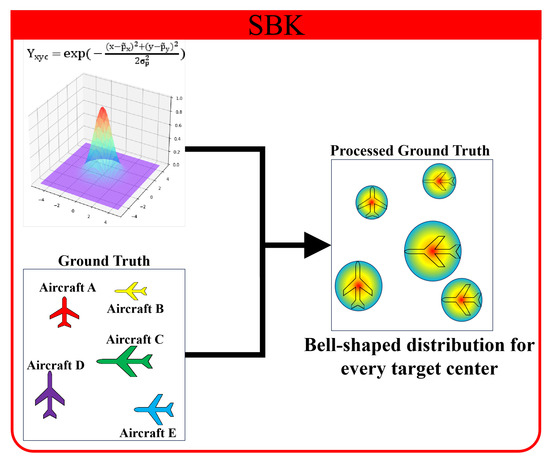
Figure 13.
The process diagram of mapping the SBK to the ground truth.
As shown in Figure 13, in the processed heatmap’s ground truth Y, the pixel value around the target center in the heatmap for the target category channel changes. During the training stage, the pixel value in Y is introduced into the loss function in Equation (1). Specifically, the addition of the term reduces the loss value for weak scattering points at the edges of targets. This finally reduces the model’s equivalent detection “threshold” for weak scattering points during the testing stage.
3.6. Integrated Detection and Recognition Head
The multi-task head utilizes three feature maps predicted by the backbone network, heatmap , offset map , and size map , to accomplish integrated detection and recognition of aircraft, as illustrated in Figure 14. The head can derive the coordinates of the center for each target from and compare the predicted values of the target center at the same position across different channels. The channel corresponding to the maximum predicted value indicates the class of the target. Since the backbone network performs downsampling of the feature maps with a stride of 4, when the feature maps are resized to the original image size, there are precision errors in the center coordinates. The predicted center offsets help restore the center coordinates to the coordinates of the original image. The head generates object-detection boxes based on the predicted sizes corresponding to each target center in , thus completing the integration of detection and recognition.

Figure 14.
The structure of the multi-task head.
4. Results and Discussion
In this section, we initially introduce the experiment setup and the metrics used for evaluation. Then, we compare our aircraft detection and recognition integrated model with other competitive CNN models. Finally, the experiments demonstrate the outstanding detection and recognition performance and remarkable background clutter interference resistance capability of our model.
4.1. Dataset and Setup
Our experimentation was performed on the public dataset: SAR-AIRcraft-1.0 [29]. It is provided by the China High-resolution Earth Observation System (CHEOS) program and the Aerospace Information Research (AIR) Institute, Chinese Academy of Sciences. The SAR-AIRcraft-1.0 dataset consists of images collected from the Gaofen-3 satellite, with single-polarization mode and a spatial resolution of 1 m×1 m, using spotlight imaging mode. Taking into account the scale of airports and the number of parked aircraft, the dataset primarily includes image data from three civilian airports: Beijing Capital International Airport, Shanghai Hongqiao Airport, and Taiwan Taoyuan Airport. It comprises images of four different sizes: 800 × 800, 1000 × 1000, 1200 × 1200, and 1500 × 1500 pixels, totaling 4368 images and 16,463 aircraft instances. The specific aircraft categories include A220, A320/321, A330, ARJ21, Boeing 737, Boeing 787, and others, where “other” represents aircraft instances not belonging to the remaining six categories. The optical and SAR images of aircraft instances are shown in Figure 15. The numbers of the training and test instances for each category are shown in Table 1.

Figure 15.
The optical and SAR images of all categories of aircraft in the SAR-AIRcraft-1.0 dataset. (a) A220, (b) A320/A321, (c) A330, (d) ARJ21 (e) Boeing 737, (f) Boeing 787, and (g) other.

Table 1.
The numbers of the training and test aircraft instances in SAR images.
For training and testing, we input SAR images of the original size and uniform image size to . As a result, the feature maps obtained from the backbone network keep a high resolution of to help the model detect small targets. Specifically, our model was trained with the Adam optimizer with the hyperparameters = 0.9 and = 0.999, and a batch size of eight for 140 epochs. The base learning rate was set as and was dropped by a factor of ten at the 90th and 120th epochs. An NVIDIA RTX 2060 GPU with PyTorch 1.4 executed the proposed method.
4.2. Evaluation Metrics
4.2.1. Detection Metrics
The evaluation of our proposed method’s detection performance involved metrics such as precision (P), recall (R), average precision (AP), mean AP (mAP), and the F1 score (F1). Equation (14) defines the precision and recall.
where (true positives) denotes the accurately detected aircraft number, (false positives) denotes the false alarm number for aircraft, and (False Negatives) denotes the missed alarm number for aircraft. Typically, when a predicted bounding box’s Intersection over Union (IoU) with the ground truth is higher than 0.5, it is considered a TP. Otherwise, it is considered as an FP. Additionally, a ground truth without a corresponding predicted bounding box is considered an FN.
The F1 score is the metric that measures the balance between precision and recall. We utilized the F1 score to reflect the comprehensive performance of the models, and the calculation formula is shown in Equation (15).
The precision–recall curve (PRC) can illustrate the connection between precision and recall. Each aircraft category has its corresponding PRC, with precision as the vertical axis and recall as the horizontal axis. The AP is defined as the area under the PRC. The mAP is calculated as the average of the AP for all aircraft categories. The calculation formulas of the AP and mAP are shown in Equation (16).
where C denotes the aircraft category number and denotes the AP of category j. In this paper, represents the AP with an IoU threshold of 0.5, and similarly, represents the AP with an IoU threshold of 0.75.
4.2.2. Recognition Metrics
Our proposed method’s recognition performance was assessed based on the recognition accuracy (Acc). The definition of Acc is shown in Equation (17)
where denotes the correctly recognized aircraft number in category j, C denotes the aircraft category number, and denotes the total aircraft number.
4.3. Detection Performance Comparison
We compared our proposed method with various object-detection models in detection performance, including two-stage CNNs Faster R-CNN [10], Cascade R-CNN [11], the anchor-free classic model Reppoints [30], and SAR image object-detection methods like SKG-Net [31] and SA-Net [29]. In the detection task, we considered all aircraft targets as positive samples and the background as negative samples.
As shown in Table 2, the SADRN demonstrated the highest performance in terms of both the AP and F1 score. SA-Net performed closely to our proposed method. Compared to SA-Net, the SADRN achieved performance improvements of 4.3%, 14.6%, and 10.1% in terms of the F1 score, , and , respectively. CBAM assigns weights to the feature map in the channel dimension and the spatial dimension, enhancing attention to the target area and reducing interference from complex background clutter. At the same time, the SBK lowers the detection “threshold” for weak scattering points, enabling the model to better locate the target area. The other three networks performed moderately in the detection task, but Cascade R-CNN achieved the best precision. The two-stage detector poses more aircraft RoIs through the RPN, and Cascade R-CNN uses a multi-network cascading structure, gradually increasing the IoU threshold during inference, thus reducing false alarms (false positives).

Table 2.
Detection performance of different methods on the SAR-AIRcraft-1.0 dataset.
4.4. Recognition Performance Comparison
We compared our proposed method with various networks on recognition performance, including ResNet-50 [32], ResNet-101 [32], ResNeXt-50 [33], ResNeXt-101 [33], and the Swin Transformer [34].
As shown in Table 3, we present the overall Acc for each method, as well as the Acc for each aircraft category. It can be observed that the recognition results of the A320/321 aircraft were excellent for each model, as the A320/321 aircraft are relatively large, with a length of over 40 m, making them easy to distinguish. ResNeXt outperformed ResNet on the overall Acc and most categories’ Acc. ResNeXt, which builds upon the residual network, utilizes multiple groups of parallel convolutions to enhance the network’s expressive power, enabling it to better capture detailed features of the targets. The Swin Transformer is a novel network model, but it did not show outstanding recognition capability compared to previous models like ResNet and ResNeXt. The Swin Transformer has a more complex structure, leading to more training difficulties, and the quantity and quality of the dataset samples may affect the model’s test results. The SADRN not only achieved the best overall Acc, but also outperformed in the recognition of most aircraft categories. Compared to the second-best performing ResNeXt-101, the SADRN showed a 12.83% improvement in the overall Acc. The FADLA-34 backbone network we proposed aggregates several feature maps across different network stages, effectively extracting feature information for different categories of targets. The FADLA-34 backbone network enables the SADRN to more accurately distinguish aircraft of different categories. Thus, it can be seen that the SADRN can effectively accomplish the target recognition task.

Table 3.
Recognition performance of different methods on the SAR-AIRcraft-1.0 dataset.
To further evaluate the model performance and illustrate more detailed recognition results, we plot the confusion matrix of the algorithm models to display the recognition performance of different network structures. As shown in Figure 16, the values on the diagonal represent the recognition accuracy of each class. The aircraft categories predicted by the model are represented on the horizontal axis, while the true categories are represented on the vertical axis. From the confusion matrices of ResNet and the Swin Transformer, it is evident that the recognition of the A330, ARJ21, and Boeing 737 aircraft was more challenging. Because these categories of aircraft have smaller sizes, the models cannot capture sufficient detailed features, resulting in low recognition accuracy. Due to the similarity in features among different aircraft categories, confusion frequently occurred in the recognition task. Many aircraft categories were prone to be misidentified as Boeing 787 aircraft. Because of the powerful feature-extraction capability of FADLA-34, the SADRN exhibited minimal confusion between different categories of aircraft with similar features and achieved the highest recognition accuracy for all aircraft categories.

Figure 16.
The confusion matrices of different methods.
4.5. Integrated Detection and Recognition Performance Comparison
This paper conducts comparative experiments on integrated detection and recognition between the SADRN and five different methods, Faster R-CNN [10], Cascade R-CNN [11], Reppoints [30], SKG-Net [31], and SA-Net [29]. The mAP metric integrates precision and recall across different aircraft categories. In this experiment, the integrated detection and recognition performance of each model was evaluated using the mAP.
Table 4 displays the metrics for different methods. The Boeing 737 and A220 aircraft exhibited higher detection difficulty compared to other categories. The SADRN achieved the best performance in the across most aircraft categories, with the reaching 95.0%.

Table 4.
The integrated detection and recognition performance of different methods when the IoU threshold is 0.5.
Furthermore, we utilized a more stringent to assess each model. The evaluation results are displayed in Table 5. The SADRN continued to achieve the best performance in the across most aircraft categories, with its significantly surpassing other models, reaching 71.5%. In Table 4 and Table 5, the SADRN achieved good performance on the mAP metric. Our multi-task head first extracts the category information from the heatmap to achieve target recognition and then utilizes the target position information from the offset map and the size map to accomplish the detection task. The multi-task head reduces the entanglement between detection and recognition tasks and enables the model to excel in integrated detection and recognition performance for each category. These results validate the superior integrated detection and recognition performance of the SADRN.

Table 5.
The integrated detection and recognition performance of different methods when the IoU threshold is 0.75.
To visually compare each model, we plot the F1 curves for different networks at IoU = 0.5 and 0.75, showing the F1 scores at different confidence thresholds, as shown in Figure 17. The SADRN achieved the best performance in the F1 score at all confidence thresholds, because the FADLA-34 backbone network aggregates feature maps of different scales, enhancing the model’s multi-scale detection performance, while the SBK aids the model in adapting to the scattering points with large fluctuations in intensity, enabling the model to better localize target areas. As a result, the SADRN effectively reduced false alarms and missed alarms at the same time, creating a good balance between the precision and recall metrics.
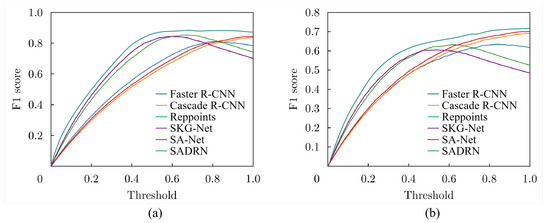
Figure 17.
The F1 curves of different methods. (a) IoU = 0.5. (b) IoU = 0.75.
4.6. Ablation Study
In this section, we conduct several ablation experiments to analyze the effectiveness of each module of the SADRN. To ensure fairness in comparison, each model was provided with the same parameter settings and trained separately. All experimental results are presented in Table 6, and the PRCs of different models at an IoU threshold of 0.5 are shown in Figure 18. It can be seen that each module of the SADRN significantly improved the detection performance of the model. Compared to the baseline, the SADRN improved by 4.5% in terms of the and a remarkable 6.2% in terms of the , indicating more accurate object localization. Next, we analyze the effect of each module in detail.

Table 6.
Performance of each module in the SADRN on the SAR-AIRcraft-1.0 dataset.
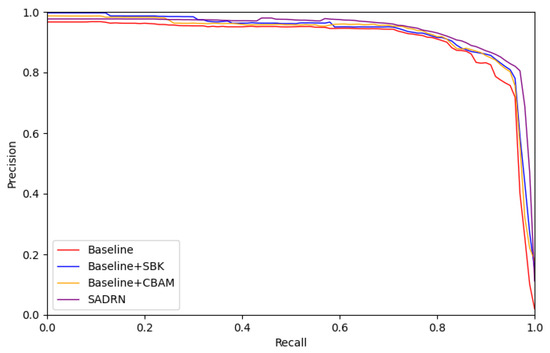
Figure 18.
The PRCs of different modules under the IoU threshold of 0.5 on the SAR-AIRcraft- 1.0 dataset.
4.6.1. Effectiveness of SBK
The experimental results in Table 6 and Figure 18 demonstrate the effectiveness of the SBK. Compared to the baseline, the SBK significantly improved the model’s performance by 4.3% on the and 5.3% on the . This indicates that the SBK enables the model to more accurately locate target areas, resulting in an increased IoU between the detection boxes and the ground truth.
Therefore, we present the detection results with and without the SBK for the baseline in Figure 19, comparing the IoU between their detected boxes and the ground truth. From Figure 19b,c, it can be seen that the detection boxes in the model with the SBK aligned more closely with the ground truth, whereas the baseline without the SBK missed weak scattering points at the edges of targets. This led to a significant decrease in the IoU between the detection boxes and the ground truth. When the IoU fell below 0.5, the model classified the target as the background, resulting in missed alarms. Based on the above results, it can be concluded that the SBK successfully altered the equivalent detection “threshold” in the target area, resulting in a lowered detection “threshold” for weak scattering points at the target edges. This demonstrates the effective improvement of the SBK for the model’s target localization accuracy.
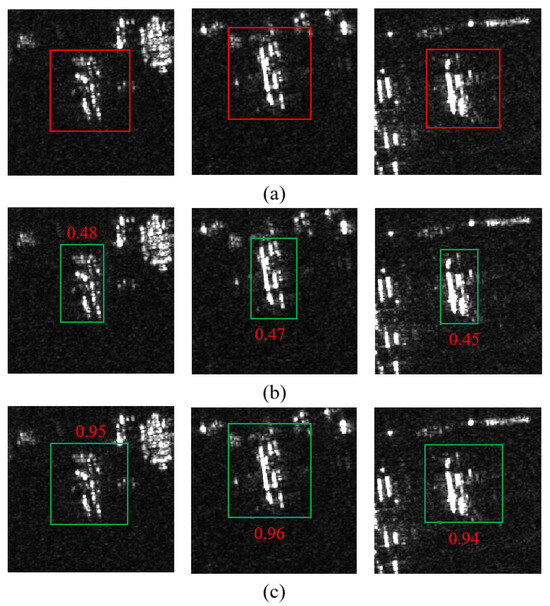
Figure 19.
Detection results of the baseline with and without the SBK. The red rectangle denotes the ground truth box, the green rectangle denotes the detection box predicted by the network, and the red number denotes the IoU between the detection box and the ground truth. (a) Ground truth. (b) Baseline. (c) Baseline+SBK.
4.6.2. Effectiveness of CBAM
The experimental results in Table 6 show the effectiveness of CBAM. Compared to the baseline, CBAM improved the precision by 2.1%. Since the precision is used to measure the quantitative relationship between true positives and false positives, an increase in the precision indicates a reduction in the false alarms.
Thus, we compare the detection results among different models in Figure 20, presenting the performance of missed alarms and false alarms for each model. In Figure 20, it is evident that our model shows fewer instances of missed alarms. The detection results of Reppoints showed relatively more false alarms, because Reppoints uses point proposals instead of anchors. In SAR images, strong clutter and aircraft targets have similar features as scattering points, leading Reppoints to easily mistake strong clutter for target point proposals. Compared to the baseline, the model with CBAM added reduced false alarms, because the baseline is affected by background clutter, making it prone to misidentifying ground clutter as aircraft targets. CBAM allows the model to concentrate on extracting features from the target area, thereby reducing false alarms.
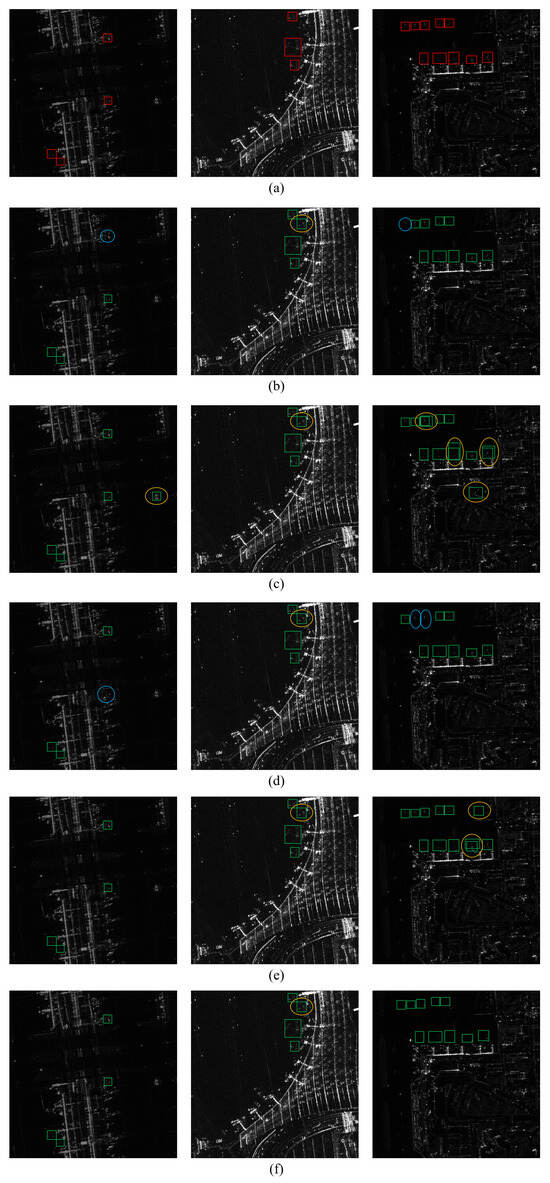
Figure 20.
Detection results of different methods. The red rectangle denotes the ground truth box, the green rectangle denotes the detection box predicted by the network. The yellow circle denotes a false alarm, and the blue circle denotes a missed alarm. (b) Faster R-CNN. (c) Reppoints. (d) Cascade R-CNN. (e) Baseline. (f) Baseline+CBAM.
Furthermore, to show the anti-background clutter interference capability brought by CBAM, we compare the detection and recognition results and the visualization of the attention between the baseline with and without CBAM in Figure 21. From the left column in Figure 21a,b, the confidence corresponding to recognized categories in the model with CBAM is significantly higher compared to the baseline. Moreover, from the right column in Figure 21a,b, the model with CBAM exhibits a more concentrated attention on the target regions, because CBAM assigns weights to the feature maps, highlighting the features that contribute more to distinguishing the targets from the background. Thus, CBAM reduces background clutter interference. The above results demonstrate the effective improvement of CBAM for the detection and recognition performance of the SADRN.
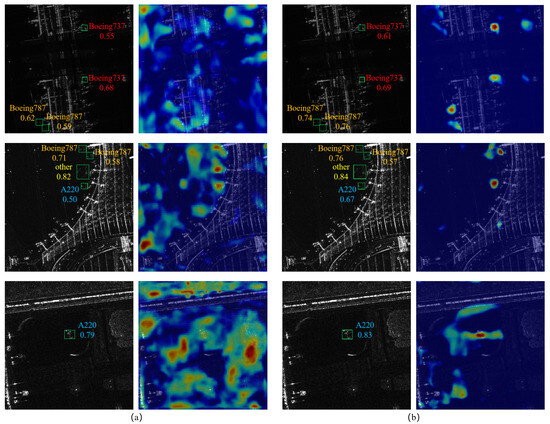
Figure 21.
Detection and recognition visualization of the baseline with and without CBAM. The green rectangle denotes the detection box predicted by the network. The recognized category and the corresponding confidence adjacent to the detection box. (a) Detection and recognition results and attention visualization of the baseline. (b) Detection and recognition results and attention visualization of the baseline with CBAM.
5. Conclusions
This paper proposes a scattering-point-intensity-adaptive detection and recognition network (SADRN). The proposed FADLA-34 backbone network aggregates feature maps across different scales, enhancing the detection performance for multi-scale targets. CBAM is embedded in the backbone network to make the model pay more attention to target area feature extraction, reducing the interference caused by complex ground background clutter. The proposed SBK achieves a variable equivalent detection “threshold”, reducing missed alarms of weak scattering points of aircraft and enabling more accurate localization of target areas. The multi-task head is used to integrate detection and recognition, reducing the entanglement between the two tasks and achieving good performance in both the detection and recognition tasks. The experimental results on the SAR-AIRcraft-1.0 dataset validated the effectiveness of the SADRN. The comparison results showed that the SADRN outperforms other mainstream methods in both detection and recognition performance.
Author Contributions
Conceptualization, X.Y. and C.D.; methodology, software, validation, writing—original draft preparation, writing—review and editing, visualization, data curation, X.Y.; supervision, C.D.; funding acquisition, C.D. and X.Y. All authors have read and agreed to the published version of the manuscript.
Funding
The work of Chuan Du was supported in part by the Open Fund of Science and Technology on Electromagnetic Scattering Key Laboratory under Grant 61424090112, in part by the Startup Foundation for Introducing Talent of Nanjing University of Information Science and Technology (NUIST) under Grant 2023r019, and in part by the NUIST Students’ Platform for Innovation and Entrepreneurship Training Program under Grant 202410300120Y.
Data Availability Statement
The original contributions presented in the study are included in the article, further inquiries can be directed to the corresponding author.
Conflicts of Interest
The authors declare no conflicts of interest.
References
- Zhang, F.; Yao, X.; Tang, H.; Yin, Q.; Hu, Y.; Lei, B. Multiple mode SAR raw data simulation and parallel acceleration for Gaofen-3 mission. IEEE J. Sel. Top Appl. Earth Obs. Remote Sens. 2018, 11, 2115–2126. [Google Scholar] [CrossRef]
- Brown, W.M. Synthetic aperture radar. IEEE Trans. Aerosp. Electron. Syst. 1967, AES-3, 217–229. [Google Scholar] [CrossRef]
- Moreira, A.; Prats-Iraola, P.; Younis, M.; Krieger, G.; Hajnsek, I.; Papathanassiou, K.P. A tutorial on synthetic aperture radar. IEEE Geosci. Remote Sens. Mag. 2013, 1, 6–43. [Google Scholar] [CrossRef]
- Rohling, H. Radar CFAR Thresholding in Clutter and Multiple Target Situations. IEEE Trans. Aerosp. Electron. Syst. 1983, AES-19, 608–621. [Google Scholar] [CrossRef]
- Raghavan, R. Analysis of CA-CFAR processors for linear-law detection. IEEE Trans. Aerosp. Electron Syst. 1992, 28, 661–665. [Google Scholar] [CrossRef]
- Akhtar, J. Training of neural network target detectors mentored by SO-CFAR. In Proceedings of the 2020 28th European signal processing conference (EUSIPCO), Amsterdam, The Netherlands, 18–22 January 2021; pp. 1522–1526. [Google Scholar]
- Smith, M.E.; Varshney, P.K. VI-CFAR: A novel CFAR algorithm based on data variability. In Proceedings of the 1997 IEEE National Radar Conference, Syracuse, NY, USA, 13–15 May 1997; pp. 263–268. [Google Scholar]
- Blake, S. OS-CFAR theory for multiple targets and nonuniform clutter. IEEE Trans. Aerosp. Electron. Syst. 1988, 24, 785–790. [Google Scholar] [CrossRef]
- Girshick, R. Fast r-cnn. In Proceedings of the IEEE International Conference on Computer Vision, Santiago, Chile, 7–13 December 2015; pp. 1440–1448. [Google Scholar]
- Ren, S.; He, K.; Girshick, R.; Sun, J. Faster r-cnn: Towards real-time object detection with region proposal networks. IEEE Trans. Pattern Anal. Mach. Intell. 2016, 39, 1137–1149. [Google Scholar] [CrossRef] [PubMed]
- Cai, Z.; Vasconcelos, N. Cascade r-cnn: Delving into high quality object detection. In Proceedings of the IEEE Conference on Computer Vision and Pattern Recognition, Salt Lake City, UT, USA, 18–23 June 2018; pp. 6154–6162. [Google Scholar]
- Jiao, J.; Zhang, Y.; Sun, H.; Yang, X.; Gao, X.; Hong, W.; Fu, K.; Sun, X. A Densely Connected End-to-End Neural Network for Multiscale and Multiscene SAR Ship Detection. IEEE Access 2018, 6, 20881–20892. [Google Scholar] [CrossRef]
- Lin, T.Y.; Goyal, P.; Girshick, R.; He, K.; Dollár, P. Focal loss for dense object detection. In Proceedings of the IEEE International Conference on Computer Vision, Venice, Italy, 22–29 October 2017; pp. 2980–2988. [Google Scholar]
- Liu, W.; Anguelov, D.; Erhan, D.; Szegedy, C.; Reed, S.; Fu, C.Y.; Berg, A.C. Ssd: Single shot multibox detector. In Proceedings of the Computer Vision–ECCV 2016: 14th European Conference, Amsterdam, The Netherlands, 11–14 October 2016; Proceedings, Part I 14. Springer: Cham, Switzerland, 2016; pp. 21–37. [Google Scholar]
- Wang, C.Y.; Bochkovskiy, A.; Liao, H.Y.M. YOLOv7: Trainable bag-of-freebies sets new state-of-the-art for real-time object detectors. In Proceedings of the IEEE/CVF Conference on Computer Vision and Pattern Recognition, Vancouver, BC, Canada, 17–24 June 2023; pp. 7464–7475. [Google Scholar]
- Law, H.; Deng, J. Cornernet: Detecting objects as paired keypoints. In Proceedings of the European Conference on Computer Vision (ECCV), Munich, Germany, 8–14 September 2018; pp. 734–750. [Google Scholar]
- Zhou, L.; Wei, S.; Cui, Z.; Fang, J.; Yang, X.; Ding, W. Lira-YOLO: A lightweight model for ship detection in radar images. J. Syst. Eng. Electron. 2020, 31, 950–956. [Google Scholar] [CrossRef]
- Siyu, W.; Xin, G.; Hao, S.; Xinwei, Z.; Xian, S. An aircraft detection method based on convolutional neural networks in high-resolution SAR images. J. Radars 2017, 6, 195–203. [Google Scholar]
- He, C.; Tu, M.; Xiong, D.; Tu, F.; Liao, M. A component-based multi-layer parallel network for airplane detection in SAR imagery. Remote Sens. 2018, 10, 1016. [Google Scholar] [CrossRef]
- Guo, Q.; Wang, H.; Xu, F. Scattering enhanced attention pyramid network for aircraft detection in SAR images. IEEE Trans. Geosci. Remote Sens. 2020, 59, 7570–7587. [Google Scholar] [CrossRef]
- Woo, S.; Park, J.; Lee, J.Y.; Kweon, I.S. Cbam: Convolutional block attention module. In Proceedings of the European Conference on Computer Vision (ECCV), Munich, Germany, 8–14 September 2018; pp. 3–19. [Google Scholar]
- Zhao, Y.; Zhao, L.; Li, C.; Kuang, G. Pyramid attention dilated network for aircraft detection in SAR images. IEEE Geosci. Remote Sens. Lett. 2020, 18, 662–666. [Google Scholar] [CrossRef]
- Huang, M.; Yan, W.; Dai, W.; Wang, J. EST-YOLOv5s: SAR Image Aircraft Target Detection Model Based on Improved YOLOv5s. IEEE Access 2023, 11, 113027–113041. [Google Scholar] [CrossRef]
- Zhao, Y.; Zhao, L.; Liu, Z.; Hu, D.; Kuang, G.; Liu, L. Attentional Feature Refinement and Alignment Network for Aircraft Detection in SAR Imagery. IEEE Trans. Geosci. Remote Sens. 2022, 60, 5220616. [Google Scholar] [CrossRef]
- Kang, Y.; Wang, Z.; Fu, J.; Sun, X.; Fu, K. SFR-Net: Scattering Feature Relation Network for Aircraft Detection in Complex SAR Images. IEEE Trans. Geosci. Remote Sens. 2022, 60, 5218317. [Google Scholar] [CrossRef]
- Lin, S.; Huang, X.; Li, M. Scattering Speckle Information Extraction Network for Aircraft Detection in SAR Images. In Proceedings of the 2021 2nd International Conference on Artificial Intelligence and Computer Engineering (ICAICE), Hangzhou, China, 5–7 November 2021; pp. 700–703. [Google Scholar] [CrossRef]
- Yu, F.; Wang, D.; Shelhamer, E.; Darrell, T. Deep layer aggregation. In Proceedings of the IEEE Conference on Computer Vision and Pattern Recognition, Salt Lake City, UT, USA, 18–22 June 2018; pp. 2403–2412. [Google Scholar]
- Dai, J.; Qi, H.; Xiong, Y.; Li, Y.; Zhang, G.; Hu, H.; Wei, Y. Deformable convolutional networks. In Proceedings of the IEEE International Conference on Computer Vision, Venice, Italy, 22–29 October 2017; pp. 764–773. [Google Scholar]
- Zhirui, W.; Yuzhuo, K.; Xuan, Z.; Yuelei, W.; Ting, Z.; Xian, S. Sar-aircraft-1.0: High-resolution sar aircraft detection and recognition dataset. J. Radars 2023, 12, 906–922. [Google Scholar]
- Yang, Z.; Liu, S.; Hu, H.; Wang, L.; Lin, S. Reppoints: Point set representation for object detection. In Proceedings of the IEEE/CVF International Conference on Computer Vision, Seoul, Republic of Korea, 27 October–2 November 2019; pp. 9657–9666. [Google Scholar]
- Fu, K.; Fu, J.; Wang, Z.; Sun, X. Scattering-keypoint-guided network for oriented ship detection in high-resolution and large-scale SAR images. IEEE J. Sel. Top. Appl. Earth Obs. Remote. Sens. 2021, 14, 11162–11178. [Google Scholar] [CrossRef]
- He, K.; Zhang, X.; Ren, S.; Sun, J. Deep residual learning for image recognition. In Proceedings of the IEEE Conference on Computer Vision and Pattern Recognition, Las Vegas, NV, USA, 27–30 June 2016; pp. 770–778. [Google Scholar]
- Xie, S.; Girshick, R.; Dollár, P.; Tu, Z.; He, K. Aggregated residual transformations for deep neural networks. In Proceedings of the IEEE Conference on Computer Vision and Pattern Recognition, Honolulu, HI, USA, 21–27 July 2017; pp. 1492–1500. [Google Scholar]
- Liu, Z.; Lin, Y.; Cao, Y.; Hu, H.; Wei, Y.; Zhang, Z.; Lin, S.; Guo, B. Swin transformer: Hierarchical vision transformer using shifted windows. In Proceedings of the IEEE/CVF International Conference on Computer Vision, Montreal, BC, Canada, 11–17 October 2021; pp. 10012–10022. [Google Scholar]
Disclaimer/Publisher’s Note: The statements, opinions and data contained in all publications are solely those of the individual author(s) and contributor(s) and not of MDPI and/or the editor(s). MDPI and/or the editor(s) disclaim responsibility for any injury to people or property resulting from any ideas, methods, instructions or products referred to in the content. |
© 2024 by the authors. Licensee MDPI, Basel, Switzerland. This article is an open access article distributed under the terms and conditions of the Creative Commons Attribution (CC BY) license (https://creativecommons.org/licenses/by/4.0/).