Article

Application of Deep Learning for Segmenting Seepages in Levee Systems

1
Canizaro Livingston Gulf States Center for Environmental Informatics, The University of New Orleans, New Orleans, LA 70148, USA
2
Department of Computer Science, The University of New Orleans, New Orleans, LA 70148, USA
3
US Army Corps of Engineers, Engineer Research and Development Center, Vicksburg, MS 39180, USA
4
US Army Corps of Engineers, New Orleans, LA 70118, USA
*
Author to whom correspondence should be addressed.
Remote Sens. 2024, 16(13), 2441; https://doi.org/10.3390/rs16132441
Submission received: 20 May 2024 / Revised: 29 June 2024 / Accepted: 1 July 2024 / Published: 3 July 2024

Abstract

:
Seepage is a typical hydraulic factor that can initiate the breaching process in a levee system. If not identified and treated on time, seepages can be a severe problem for levees, weakening the levee structure and eventually leading to collapse. Therefore, it is essential always to be vigilant with regular monitoring procedures to identify seepages throughout these levee systems and perform adequate repairs to limit potential threats from unforeseen levee failures. This paper introduces a fully convolutional neural network to identify and segment seepage from the image in levee systems. To the best of our knowledge, this is the first work in this domain. Applying deep learning techniques for semantic segmentation tasks in real-world scenarios has its own challenges, especially the difficulty for models to effectively learn from complex backgrounds while focusing on simpler objects of interest. This challenge is particularly evident in the task of detecting seepages in levee systems, where the fault is relatively simple compared to the complex and varied background. We addressed this problem by introducing negative images and a controlled transfer learning approach for semantic segmentation for accurate seepage segmentation in levee systems.

1. Introduction

Levees play an essential role in flood control, reducing the risk of the detrimental effects of flooding on human lives, property, and infrastructure [1]. Like most human-made structures, there is the threat of these levees degrading over time. Several deficiencies contributing to the deterioration and eventual failure of levee systems include the formation of cracks, sand boils, seepages, animal burrowing, and sinkholes, among others [1]. Primarily, if not addressed in a timely manner, the combination of one or more of these faults developed over time causes a levee breach, leading to catastrophic failure of the levee system [2]. Therefore, identifying and locating these deficiencies allows for the timely monitoring and maintenance of a levee system, minimizing the threat of potential levee failure.
In the New Orleans District, the U.S. Army Corps of Engineers (USACE) has been monitoring the integrity of levee structures since the Flood Control Act of 1928 authorized USACE to construct and maintain these structures [3]. USACE field inspectors have systematically gathered images of levees over time to identify, understand, and locate these deficiencies. The images reveal faults in the various regions, such as the crest, floodwalls, slopes, and the levee structures’ surroundings. Among several notable faults, we have chosen three crucial faults: cracks, sand boils, and seepages, due to their history of causing disastrous events [2,4,5,6]. The next three sections focus on delving into these three image datasets and analyzing how each fault contributes to the failure of levees while also detailing the image selection and pre-processing methodology to build segmentation models that assist with the efficient monitoring and maintenance of levees.
Semantic segmentation is a process that involves object detection and the allocation of a semantic label or category to each pixel of objects. Semantic segmentation algorithms provide a detailed understanding of the context through a pixel-level analysis of the images [7]. In recent years, deep learning-based semantic segmentation methods have achieved significant breakthroughs due to the progress in large datasets, powerful computing power (GPUs and TPUs), and optimization algorithms. Most state-of-the-art architectures for semantic segmentation are based on convolutional neural networks [8] to extract a meaningful representation of objects from the images. The existing deep learning algorithms have shown increased accuracy in various application domains, ranging from biomedical imaging, autonomous driving [9], scene understanding [10], to remote sensing operations [11] in comparison to the traditional segmentation methods relying on mathematical and statistical approaches and manual feature engineering [7,12,13].
The CNN-based encoder–decoder-formatted architecture leverages the power of convolutional operations to perform feature extraction through encoders and then map feature vectors to segmentation masks through decoders [8]. FCNs [14] are the foundation of modern encoder–decoder-based successful deep learning models for semantic segmentation that modify the structure of CNNs and other networks by replacing fully connected layers with convolutional layers to generate a segmentation mask of the same size as the input. Another architecture, SegNet [15], is an encoder–decoder-based architecture that uses pooling indices from the encoder to upsample feature maps in the decoder to improve segmentation, preserving high-resolution information. Likewise, PSPNet [16] uses the pretrained ResNet101 as the feature extraction layer and introduces the pyramid pooling module on top of the encoder to integrate global contextual information by pooling features at different scales. U-Net [17], on the other hand, is a widely popular architecture, especially in medical image segmentation tasks with challenging and small datasets, where overfitting is a common problem. U-Net is an encoder–decoder architecture with connections between corresponding encoder and decoder blocks, facilitating high-resolution features combined with low-resolution contextual information. U-Net++ [18] improves on U-Net through nested and dense skip connections that promote deep supervision without increasing the depth of U-Net architecture. VNet [19] is similar to U-Net, using 3D convolutional layers, and is used for 3D volumetric image segmentation.
Furthermore, to optimize the performance of semantic segmentation architectures, DeepLabv2 [20] and DeepLabv3 [21] introduced the Atrous Spatial Pyramid Pooling (ASPP) model that applies atrous convolution to gather multi-scale information and reduces computation instead of using fully connected layers. Attention U-Net, proposed by Oktay et al. in [22], is designed to help the model focus on more relevant image regions during the segmentation process. Attention U-Net extends the original architecture by incorporating attention gates to enhance the model’s ability to focus on relevant image areas during segmentation. This approach can lead to improved performance, especially in cases where the objects of interest are small or have a complex background. MultiResUNet [23] extends the U-Net architecture to capture multi-scale features more efficiently. It features multi-resolution blocks in both the encoder and decoder paths and employs residual connections to facilitate the flow of gradients during training. Building upon these advancements in semantic segmentation architectures, our work makes the following key contributions:
  • A dataset featuring labeled seepage areas in the images for the semantic segmentation task.
  • A proposed architectural design that features a pretrained model as an integrated feature extractor for encoder blocks to improve efficiency and reduce extensive training data needs.
  • A proposed controlled transfer learning approach that incorporates a pyramidal pooling channel spatial attention model and Principal Component Analysis (PCA) in a parallel manner, followed by a residual connection for facilitating better information flow between layers.
The experimental evaluations indicate that the proposed algorithm accurately segments seepages and outperforms state-of-the-art semantic segmentation algorithms. Overall, the proposed architecture and the building blocks contribute to the field by demonstrating the potential of deep learning and semantic segmentation for seepage detection in levee systems and providing a more accurate and efficient approach to this critical task.

2. Background

A common reason for a levee system’s failure during a flood is due to seepage-related problems that may arise from cracks developed on the system, liquefaction, the porous soil of the levee, or even prolonged floodwater exposure [24]. If not identified and treated on time, seepages can eventually lead to collapse, with subsequent breaches causing severe damage. Seepage is a typical hydraulic factor that can initiate the breaching process of the levee [1]. One cause of seepage is cracks in the levee system, which provide a channel for water to permeate through. This infiltrating water moves via the soil or porous layers within the levee, resulting in seepage in the surrounding areas [24]. In addition, seepage can weaken levees by reducing soil cohesion and causing soil particles to migrate outward. Seepage flow causes fluctuations in pore water pressure, which can result in internal erosion and impact the stability of the embankment. This can lead to levee failure, which can have devastating consequences [25,26,27]. As illustrated in Figure 1, a cross-sectional view of a levee system shows how high water levels in a river can force water to infiltrate through a permeable sand aquifer, resulting in cracks, seepage, and the emergence of a sand boil on the surface as sand and water are forced up from the porous region.
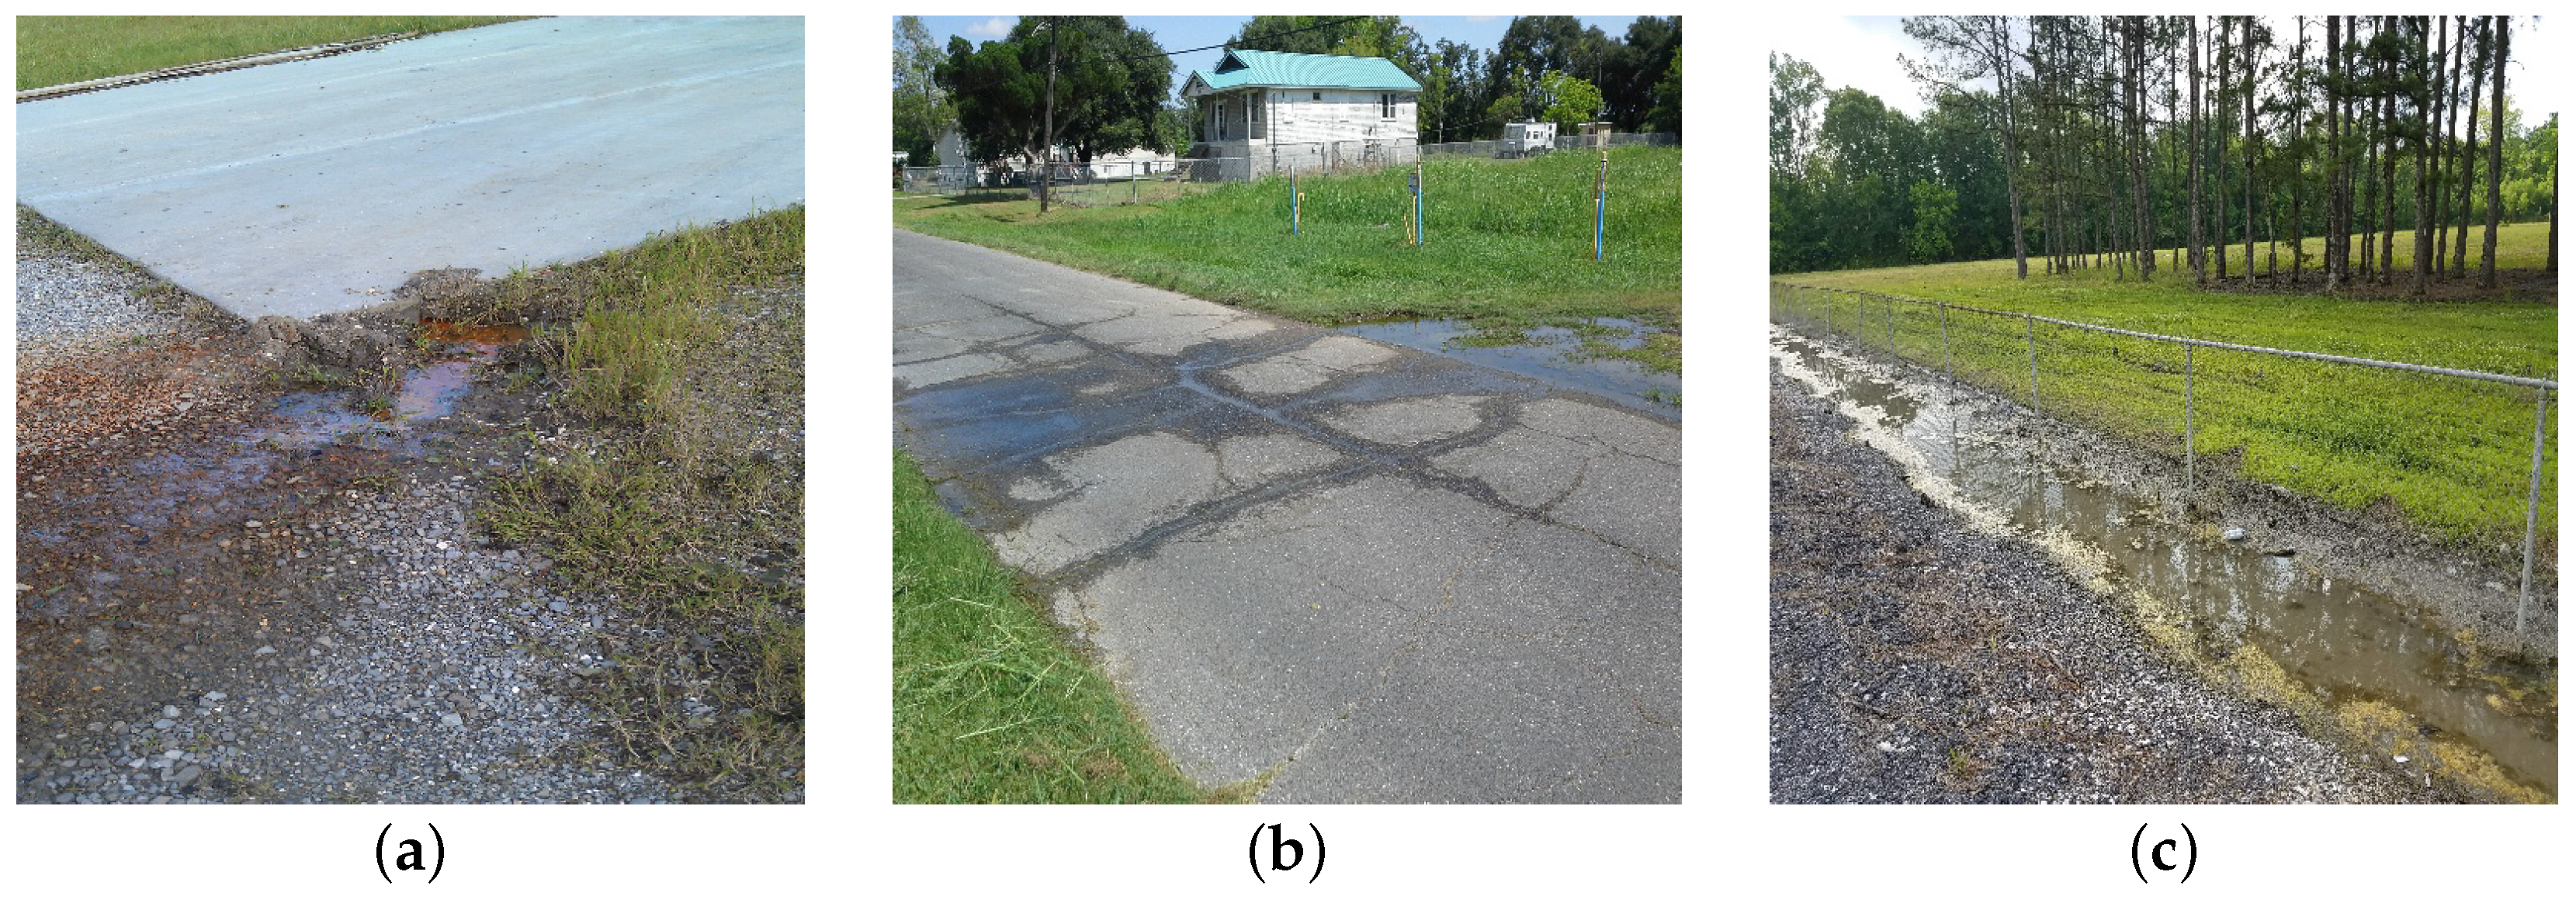
Moreover, when a levee is exposed to floodwater for a more extended period, it could lead to saturation in the levee that causes subsequent degradation over time until eventual collapse occurs [27]. Figure 2 depicts the levee with seepage formation. Seepage can be a severe problem for levees, weakening the levee structure and leading to collapse.

3. Research Gap

Deep learning and semantic segmentation techniques offer transformative advantages for seepage detection in levee systems, surpassing traditional methods in several key aspects. Firstly, these advanced technologies yield exceptional accuracy and efficiency, being particularly effective in pinpointing seepage that is either minute or elusive. Secondly, they facilitate analysis across extensive image datasets of levee structures, promoting a more thorough and frequent evaluation of these critical systems. Thirdly, the approach is markedly more cost-effective than conventional practices, significantly reducing human intervention and equipment needs. Moreover, it opens avenues for remote and automated detection, substantially lowering health and safety risks for field personnel. Consequently, this study is focused on harnessing the strengths of deep learning and semantic segmentation to effectively tackle the inherent challenges of manual seepage detection in levee systems.
Machine learning and deep learning approaches for applications in levee system monitoring are still in their early stages [28,29,30]. Especially, in [28,30], the authors investigated machine learning algorithms and proposed a stacking-based algorithm for detecting cracks and sand boils from images using a bounding box approach for object detection. The object detection approach provides a bounding region for sand boils and is particularly useful when the precise boundaries of the object are not required. In contrast, the semantic segmentation approach allows for pixel-level identification and precise localization of the faults, offering a distinct advantage over the traditional bounding box approach. Therefore, this work primarily showcases the feasibility of using deep learning-based semantic segmentation approaches for detecting cracks, sand boils, and seepages.
U-Net variants have a unique structure, with an encoding path that captures spatial or contextual information and a symmetric decoding path that enables precise localization. These types of architectures are well suited to problems that require both context and precision to identify the location and boundary of the object. U-Net architecture has shown remarkable performance, even with limited training data, accommodating complex and irregular object shapes, textures, and edges—characteristics shared by faults in the levee systems, such as cracks, sand boils, and seepages. Since obtaining training and evaluation data for these levee system faults is challenging, CNN-based end-to-end image segmentation architectures appear suitable for their detection. Recent studies have shown that U-Net-like architectures have practical applications in levee crack [29,31] and sinkhole [32] detection. These papers propose a low-weight architecture and powerful building blocks that capture multi-scale features from the images.
Furthermore, deep learning and semantic segmentation for fault segmentation in levee systems offer several advantages over traditional methods. First, they can achieve superior accuracy and efficiency in locating faults, even those that are small or difficult to notice. Second, this approach can be applied to extensive datasets of levee images, enabling more comprehensive and frequent monitoring of levee systems. Third, it can be more cost-effective than conventional methods, necessitating minimal human intervention and equipment. Thus, this study addresses these challenges by leveraging deep learning and semantic segmentation techniques.

4. Enhanced Feature Representation

4.1. Residual Depthwise Separable Inception Block

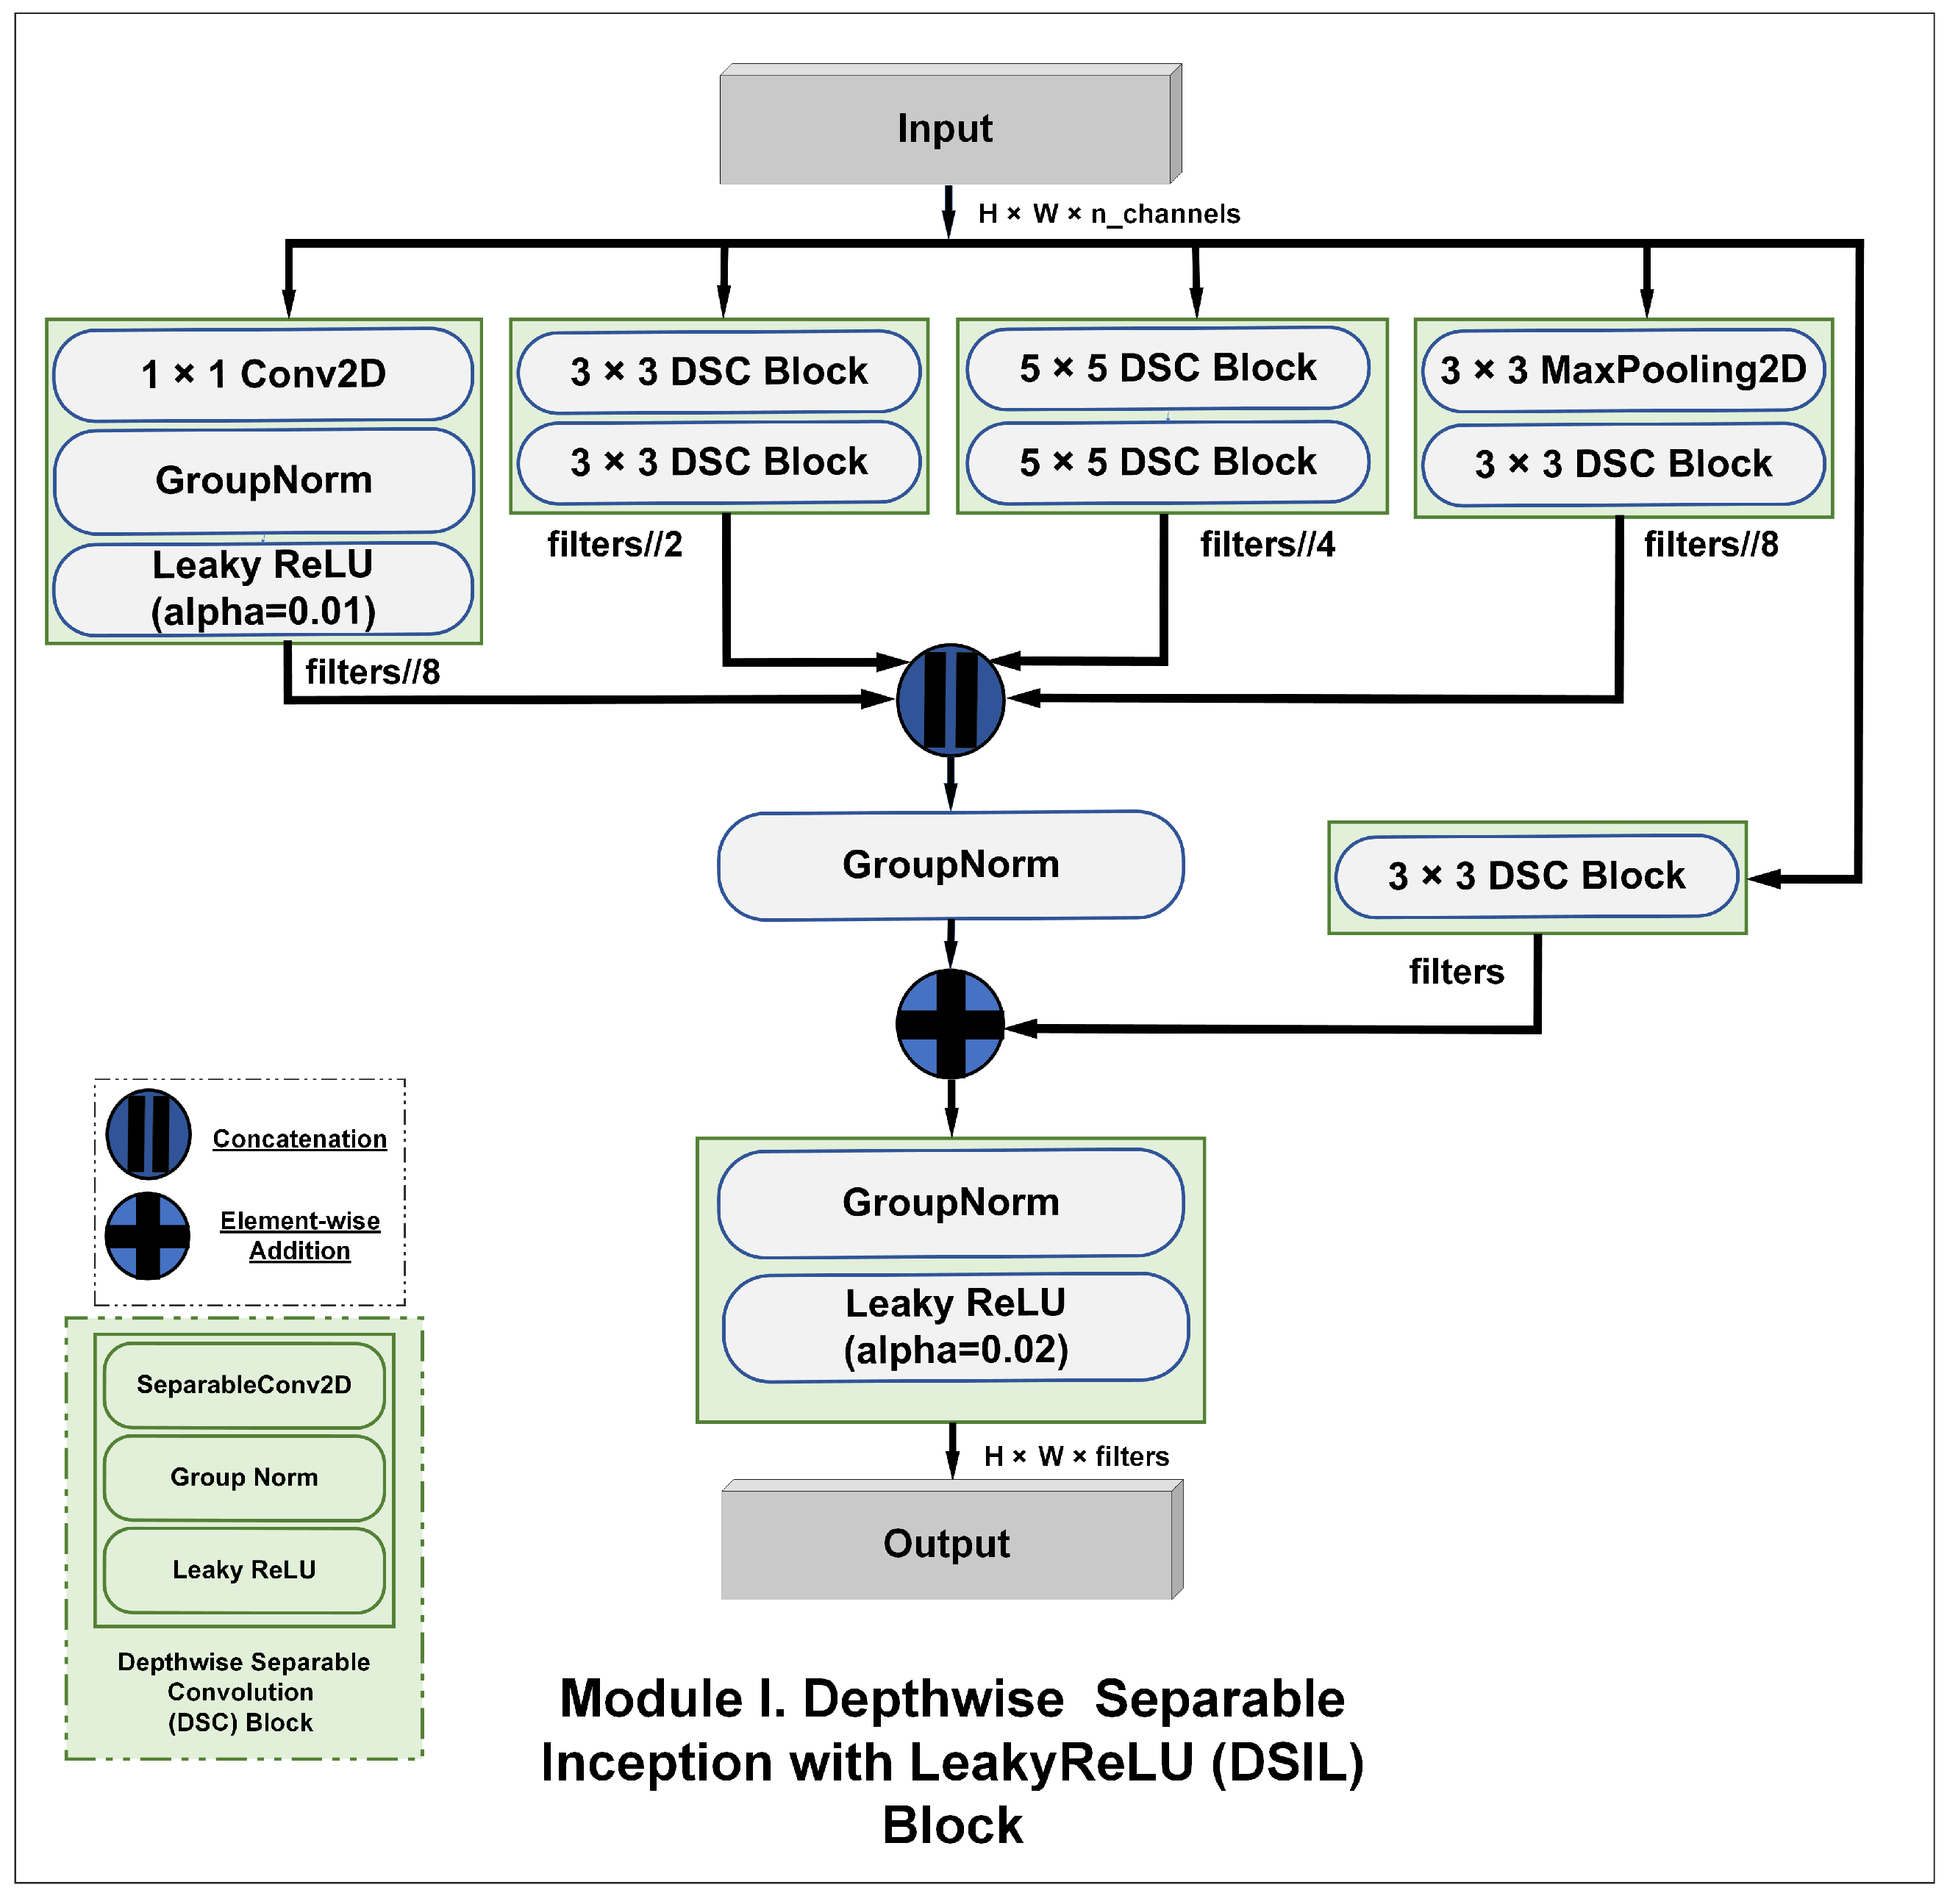
The LeakyReLU Inception Module, shown in Figure 3, is designed to capture multi-scale features while limiting the number of training parameters. It employs depthwise separable convolutions with filters of sizes 3 × 3 and 5 × 5, along with a standard 1 × 1 convolution. Each convolution operation is followed by group normalization (GN) and LeakyReLU activation to improve model convergence and robustness. A residual connection is added to facilitate better information flow between layers. It takes an input tensor of size [batch_size, height, width, n_channels_in], where batch_size is the number of examples in a mini-batch, height and width are the spatial dimensions of the feature maps, and n_channels is the number of input channels (i.e., depth). The module applies three parallel operations with a 1 × 1 convolution for a channel-wise linear combination, a 3 × 3 depthwise separable convolution, and a 5 × 5 depthwise separable convolution. The outputs are concatenated along the channel dimension. A final 1 × 1 convolution is applied to the concatenated tensor to learn an optimal combination of the multi-scale features. The number of filters in this convolution determines the number of output channels, n_channels_out. The use of depthwise separable convolutions limits the number of training parameters, even though we are using larger filter sizes with an increased number of output channels. Each convolution operation is followed by GN [33] and LeakyReLU activation with a fixed alpha value of 0.01. The alpha value determines the slope of the activation function for negative inputs, allowing a small gradient flow and enabling the model to learn more complex features. While ReLU sets all negative outputs to zero, LeakyReLU allows a small, non-zero gradient when the unit is not active. This is controlled by the alpha parameter, typically set to a small value between 0.01 and 0.3. A smaller alpha value, such as 0.01, results in a slight slope for negative inputs, while a larger value like 0.3 gives a steeper slope. The optimal alpha value depends on the specific problem and architecture. GN standardizes the concatenated feature map for each channel independently but across all spatial locations in that channel. This reduces dependency on the batch size and internal covariate shift and helps ensure that all channels have the same scale. Likewise, LeakyReLU prevents the “dying ReLU” problem by allowing small negative activation values and improving the model’s ability to learn more complex and nuanced features [34]. The combination of group normalization and LeakyReLU allows the model to converge faster and achieve better performance, stability, and robustness, especially when the batch size is small for the seepage dataset.

4.2. Attention Modules

Attention mechanisms play a crucial role in enabling the model to focus on relevant regions during the segmentation process. The proposed SeepageNet architecture incorporates two novel attention modules: Multiscale Spatial Attention (MSSA) and Dual Pooling Spatial-Channel Attention (DPSCA). The attention mechanism is a groundbreaking technique, initially introduced in the context of machine translation [35]. It has been widely implemented in computer vision tasks, allowing the model’s feature learning to concentrate on relevant parts of the input while making predictions. Squeeze and Excitation (SE) Block [36] and Convolutional Block Attention Module (CBAM) [33] are two simple yet powerful attention mechanisms that each focus on using pooling and sigmoid layers along with element-wise addition and multiplication operations to emphasize essential features and suppress trivial ones in the network architecture. Another critical concept employed in this study is the concept used in the Pyramid Pooling Module (PPM), introduced in deeplab architecture [20] to capture global contextual information using custom kernel sizes of 1 × 1, 2 × 2, 3× 3, and 6 × 6 strides. The pooling layers of varying scales applied to the input feature map capture relationships and dependencies among different regions of an input feature map. Inspired by these light-weighted attention mechanisms for CNNs, two novel attention modules, the Multi-scale Spatial Attention (MSSA) module and Dual Pooling Spatial-Channel Attention (DPSCA) module, are proposed.

4.2.1. Dual Pooling Spatial-Channel Attention (DPSCA) Module

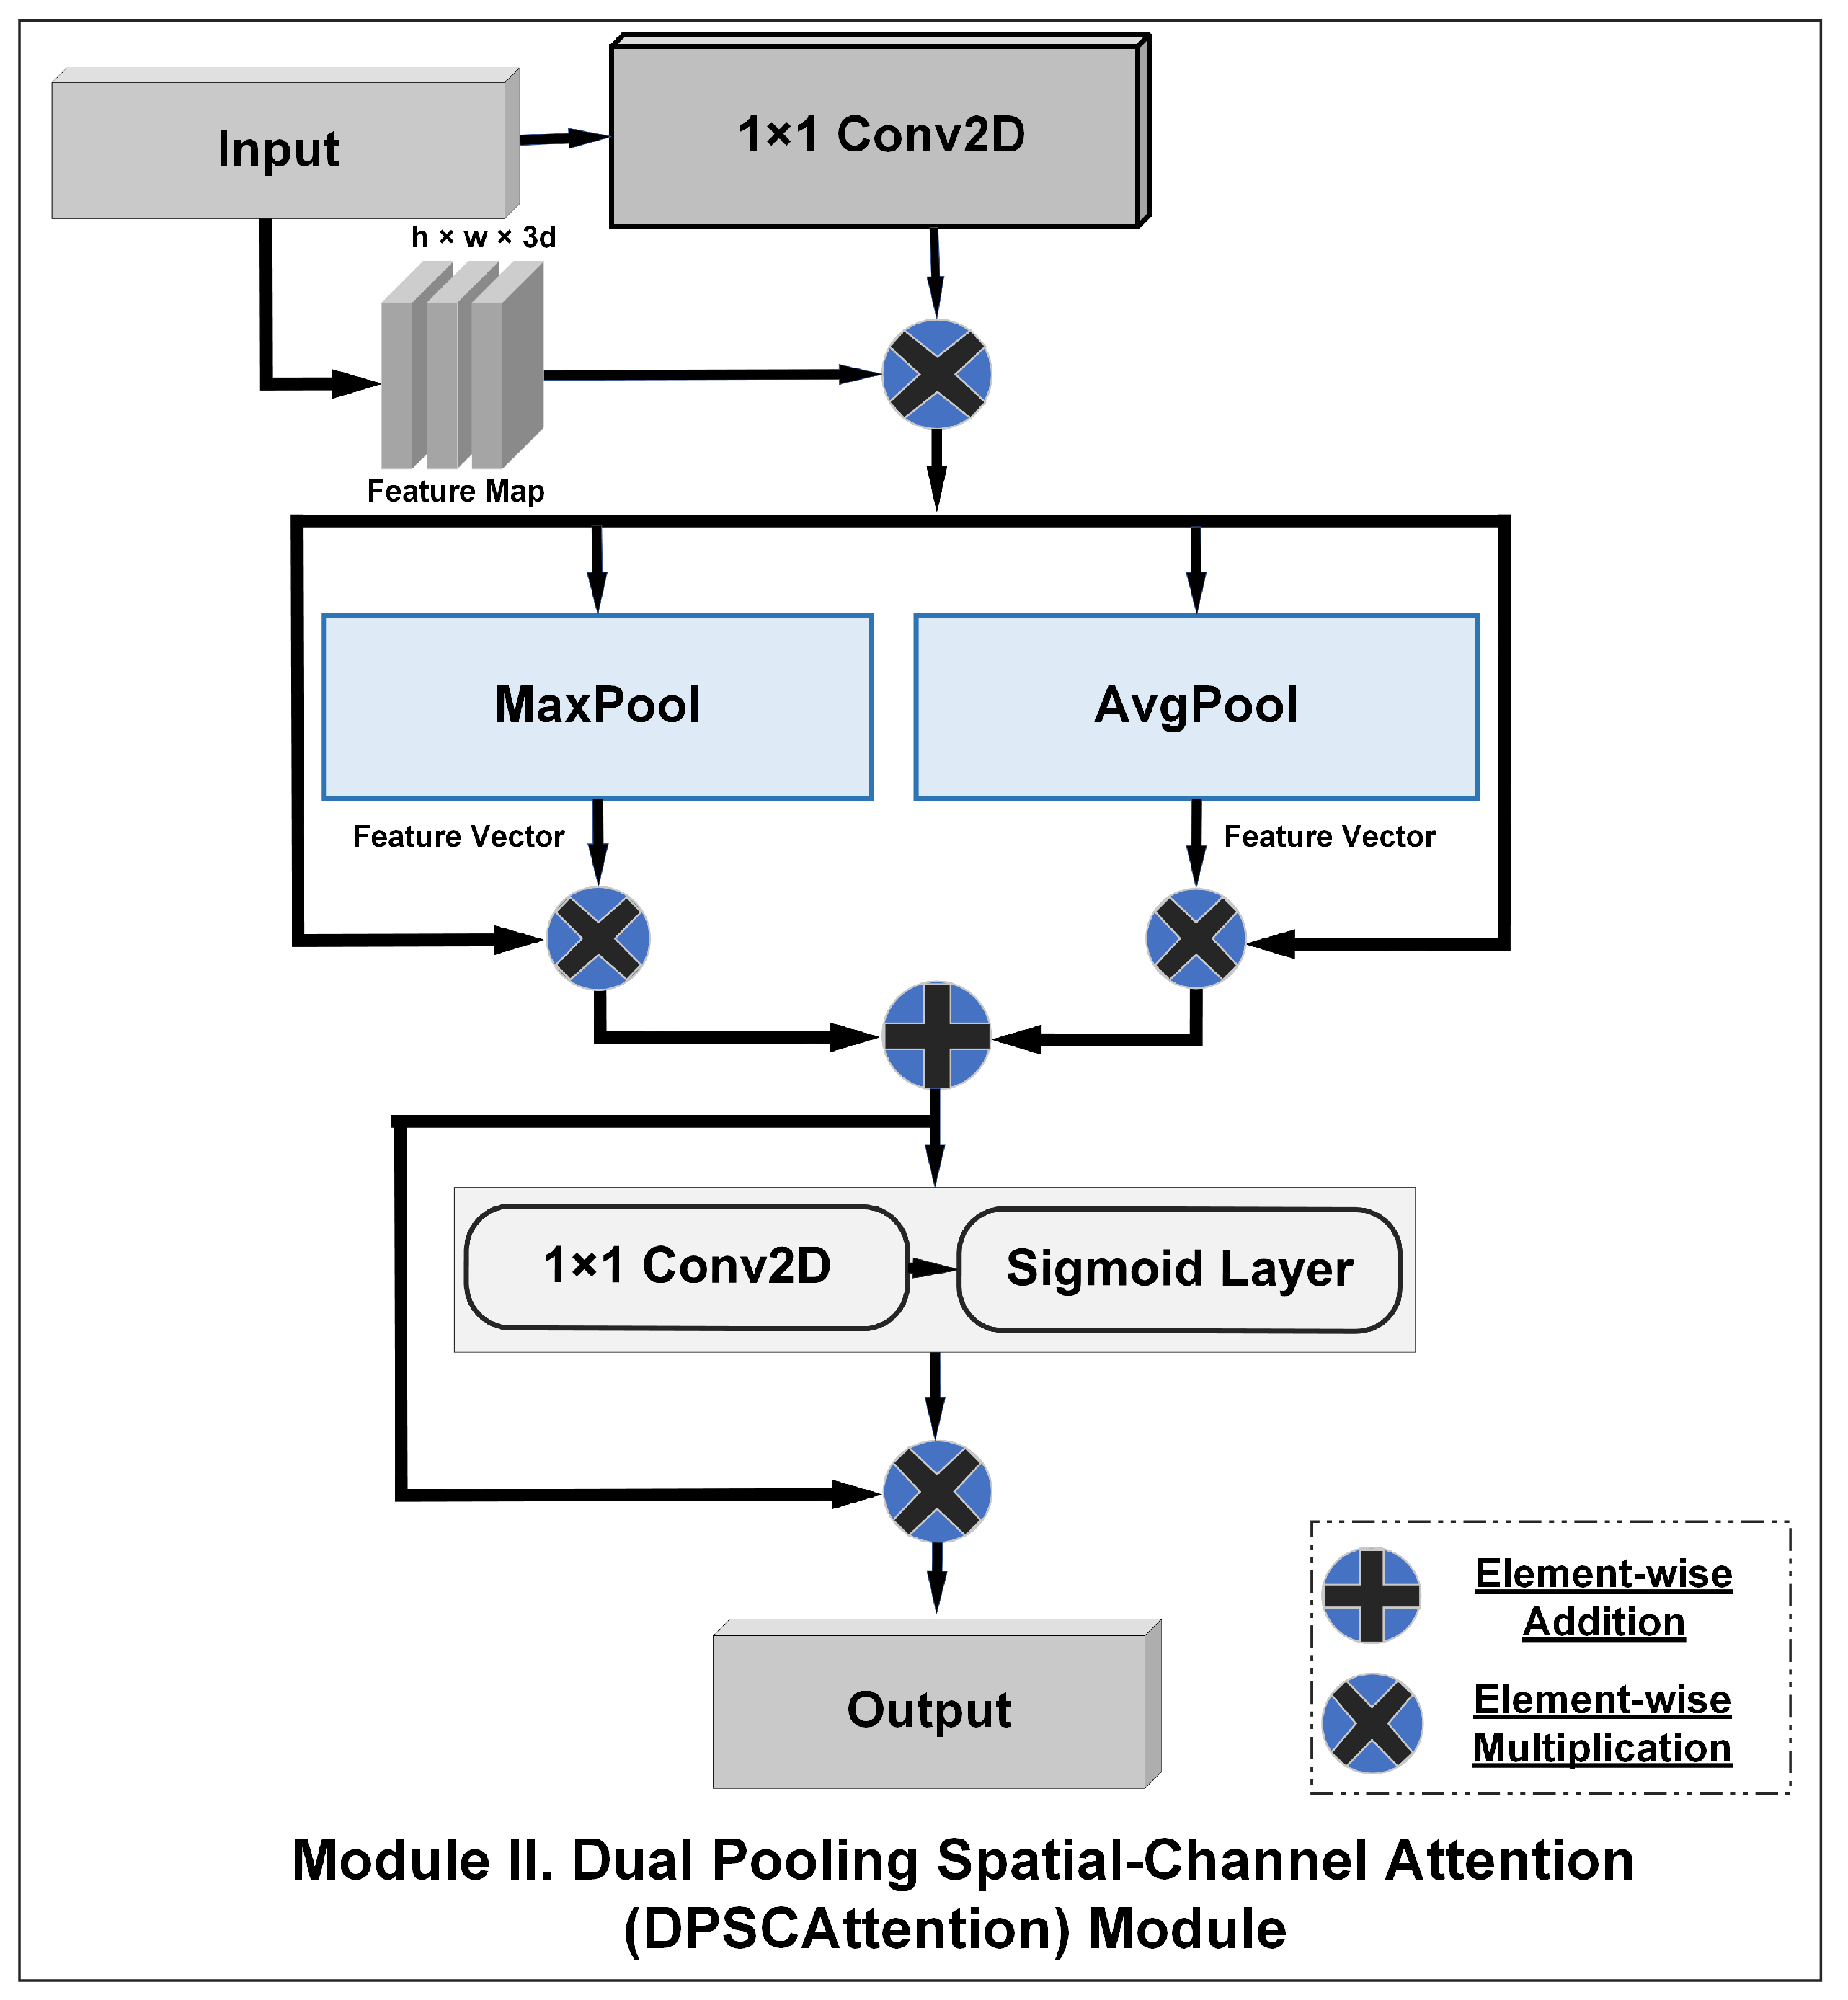
The DPSCA module, also known as attention through filters in the proposed architecture, illustrated in Figure 4, enhances channel-wise feature representation by introducing spatial and channel attention mechanisms. It applies a 1 × 1 convolution layer followed by sigmoid activation to generate attention scores for each spatial location. The attention map is then element-wise multiplied with the input tensor. Dual pooling, consisting of global max pooling and global average pooling, is applied to the weighted input tensor to capture both the most salient features and the average spatial information. At first, a 1 × 1 convolution layer is applied to the input tensor, followed by a sigmoid activation producing a feature map with values between 0 and 1, representing attention scores of each spatial location. This attention map is then element-wise multiplied by the input tensor, creating a modified input tensor where the spatial features have been weighted based on their attention scores. Then comes dual pooling, where global max pooling and global average pooling are applied to the weighted input tensor. These operations help aggregate spatial information into channel descriptors, capturing the input’s average to most salient features. The outputs of these pooling operations serve as the attention scores for channel attention since this module is directly applied to the output of the layer of the pretrained model. This step generates two new feature maps, one corresponding to the average attention and the other to the maximum attention. These two feature maps are combined via element-wise addition, yielding a single feature map through residual connection. It is followed by simple spatial attention using a 1 × 1 convolution and a sigmoid layer to refine the representation further. Finally, the channel–spatial attention-weighted feature map is element-wise multiplied by the original input tensor to effectively amplify the impact of channels that the models have learned to focus on and suppress the less essential ones.

4.2.2. Multi-Scale Spatial Attention (MSSA) Module

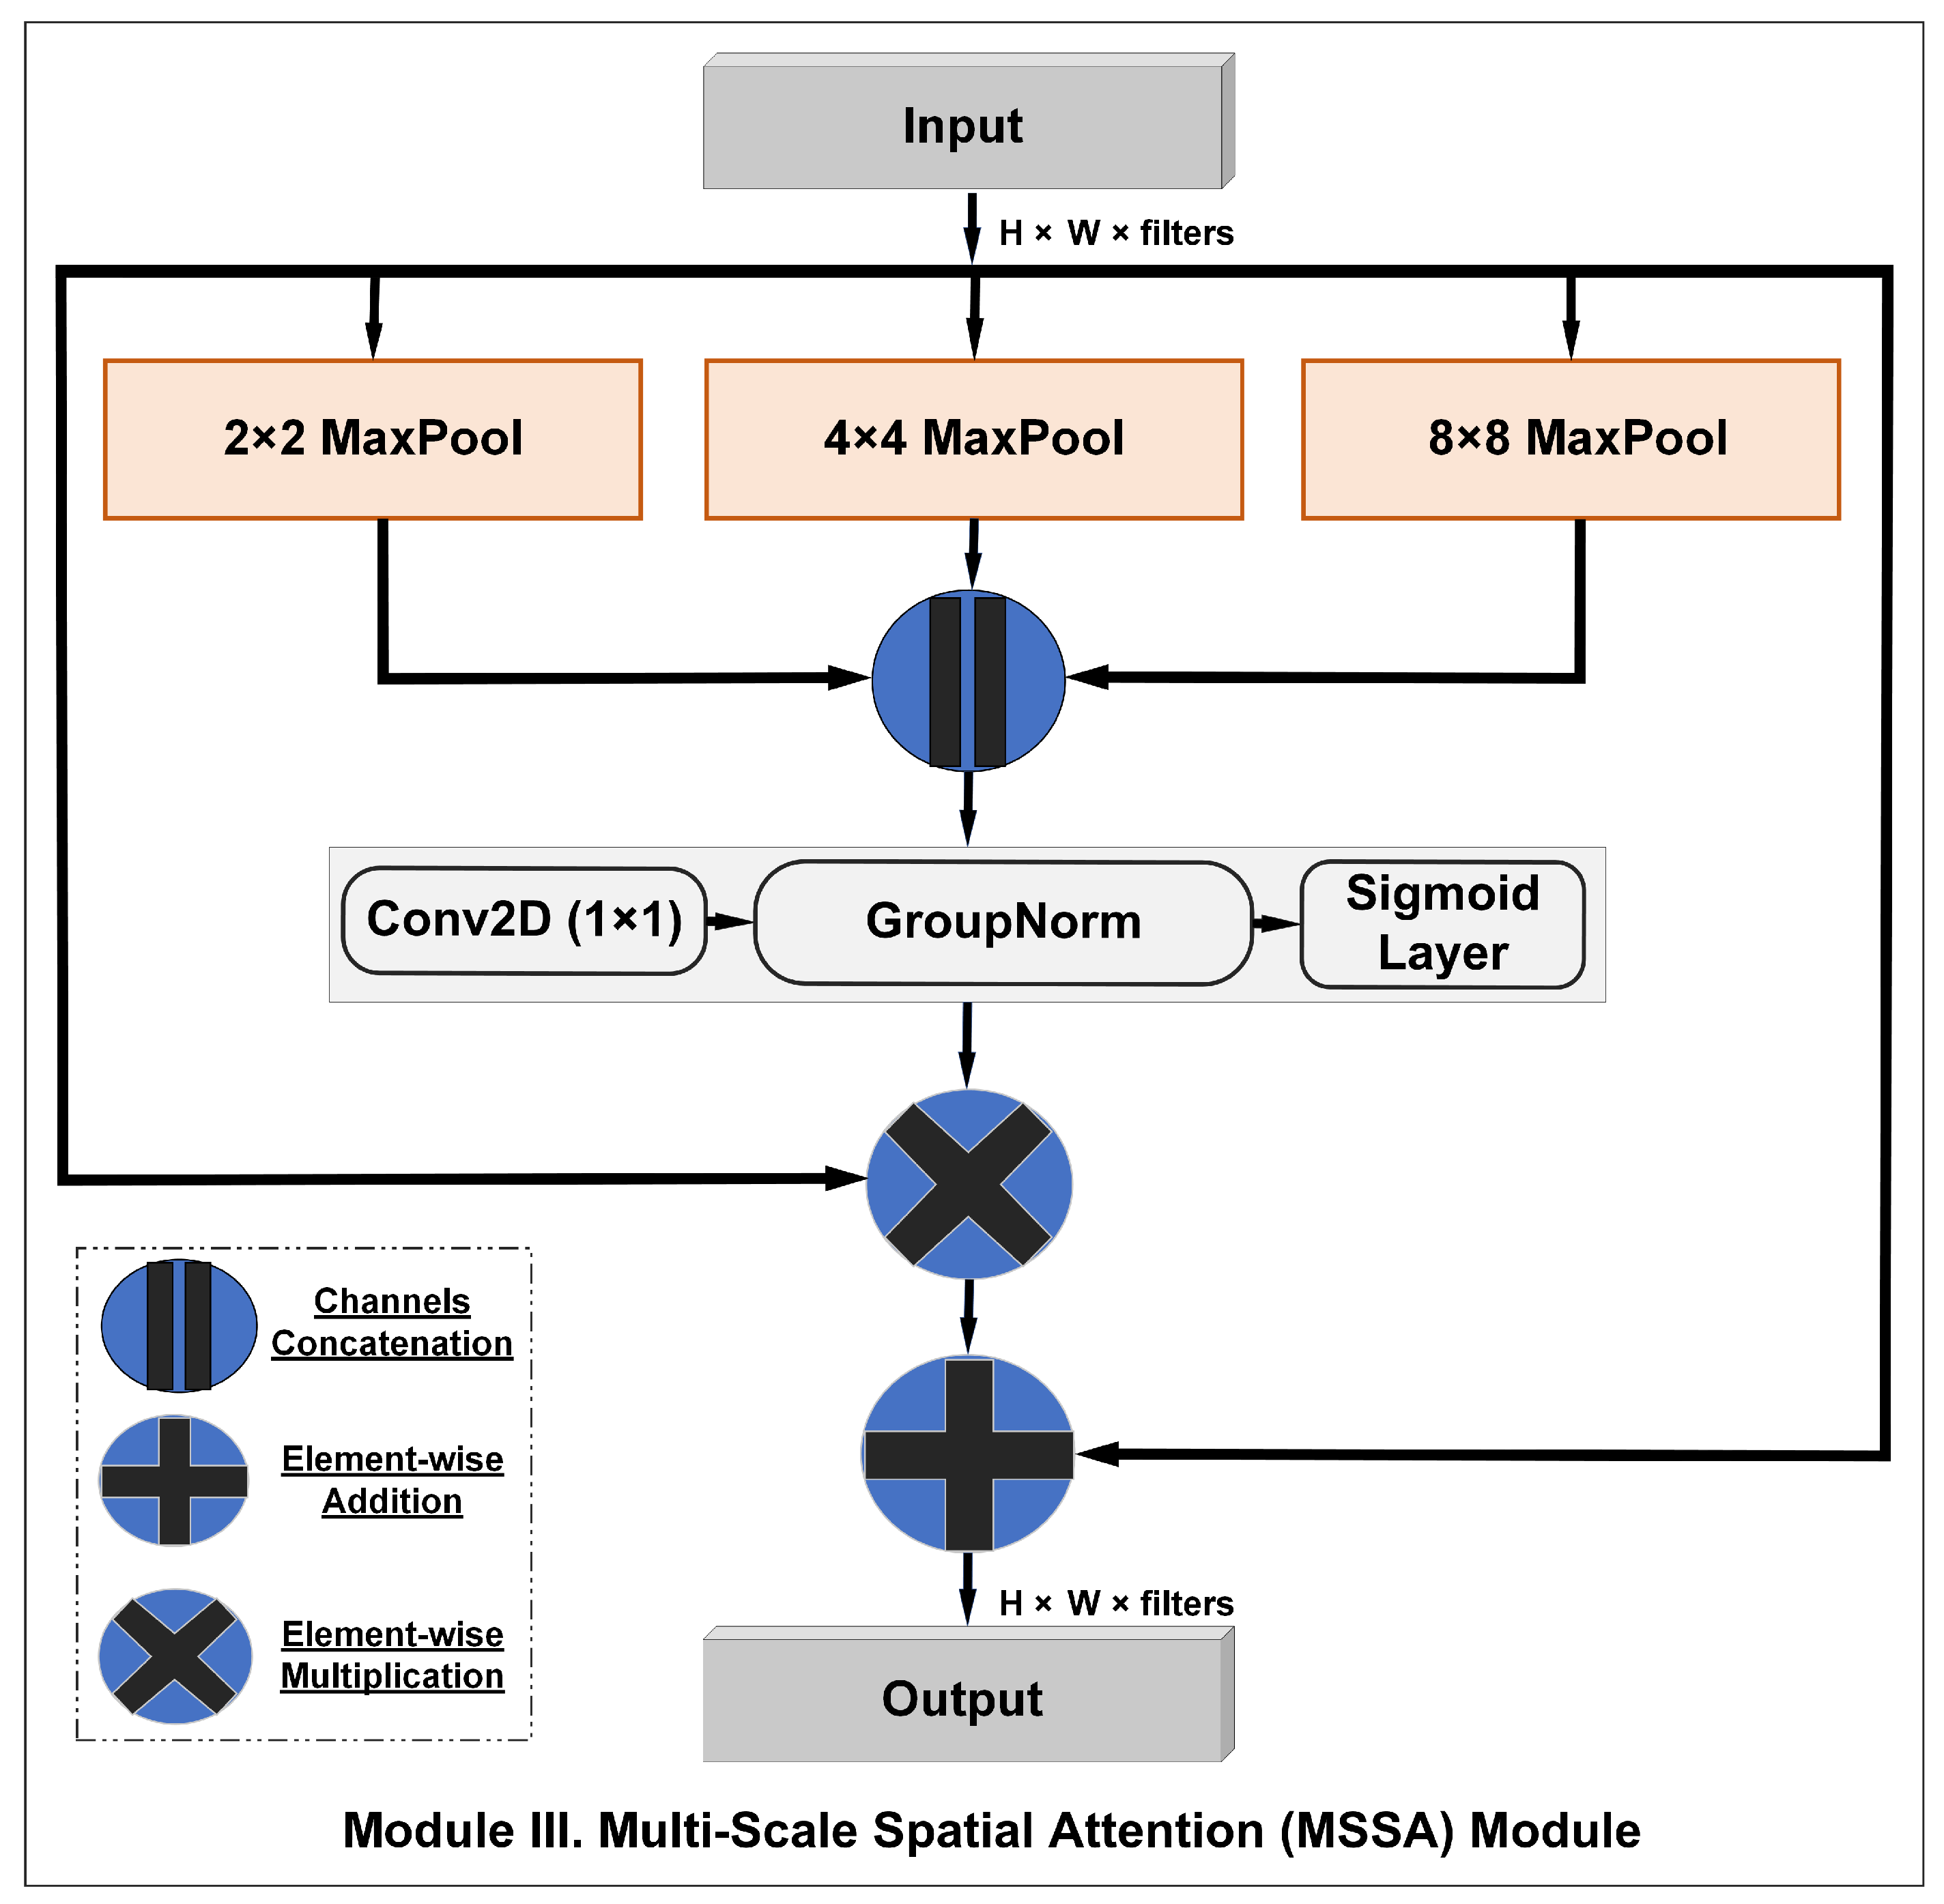
The MSSA module, shown in Figure 5, captures multi-scale spatial information by applying pyramid pooling with different kernel sizes. It employs convolutional layers with kernel sizes of 3 × 3, 5 × 5, and 7 × 7 to extract features at various scales. The outputs are concatenated and passed through a 1 × 1 convolution layer to generate the final attention map. This attention map is then element-wise multiplied with the input tensor to emphasize relevant spatial regions. The main function of this module is to apply spatial pyramid pooling to the input, which captures information at different scales. Using a stride of 1 and varying pooling grids, the model can focus on significant spatial features without reducing input dimensions. A subsequent 1 × 1 convolution layer adjusts channel numbers back to their original value while learning multi-scale feature linear combinations for each channel, effectively learning a linear combination of the multi-scale features for each channel. This technique functions as a type of channel attention where weights are learned to decide which channel should prioritize features from each scale. Group normalization is then used to standardize the feature in every group, enhancing model training stability and performance. The activation function used here is a sigmoid function that maps the feature values to the range of [0, 1], effectively generating a channel attention map. The channel attention map is then multiplied element-wise with the original input tensor. This operation recalibrates the input features based on the channel attention map, amplifying the channels that the model considers important and attenuating the less important ones. The output of this operation and the original input tensor are then added together, forming the final output of the block.

4.3. Partial Fine-Tuning

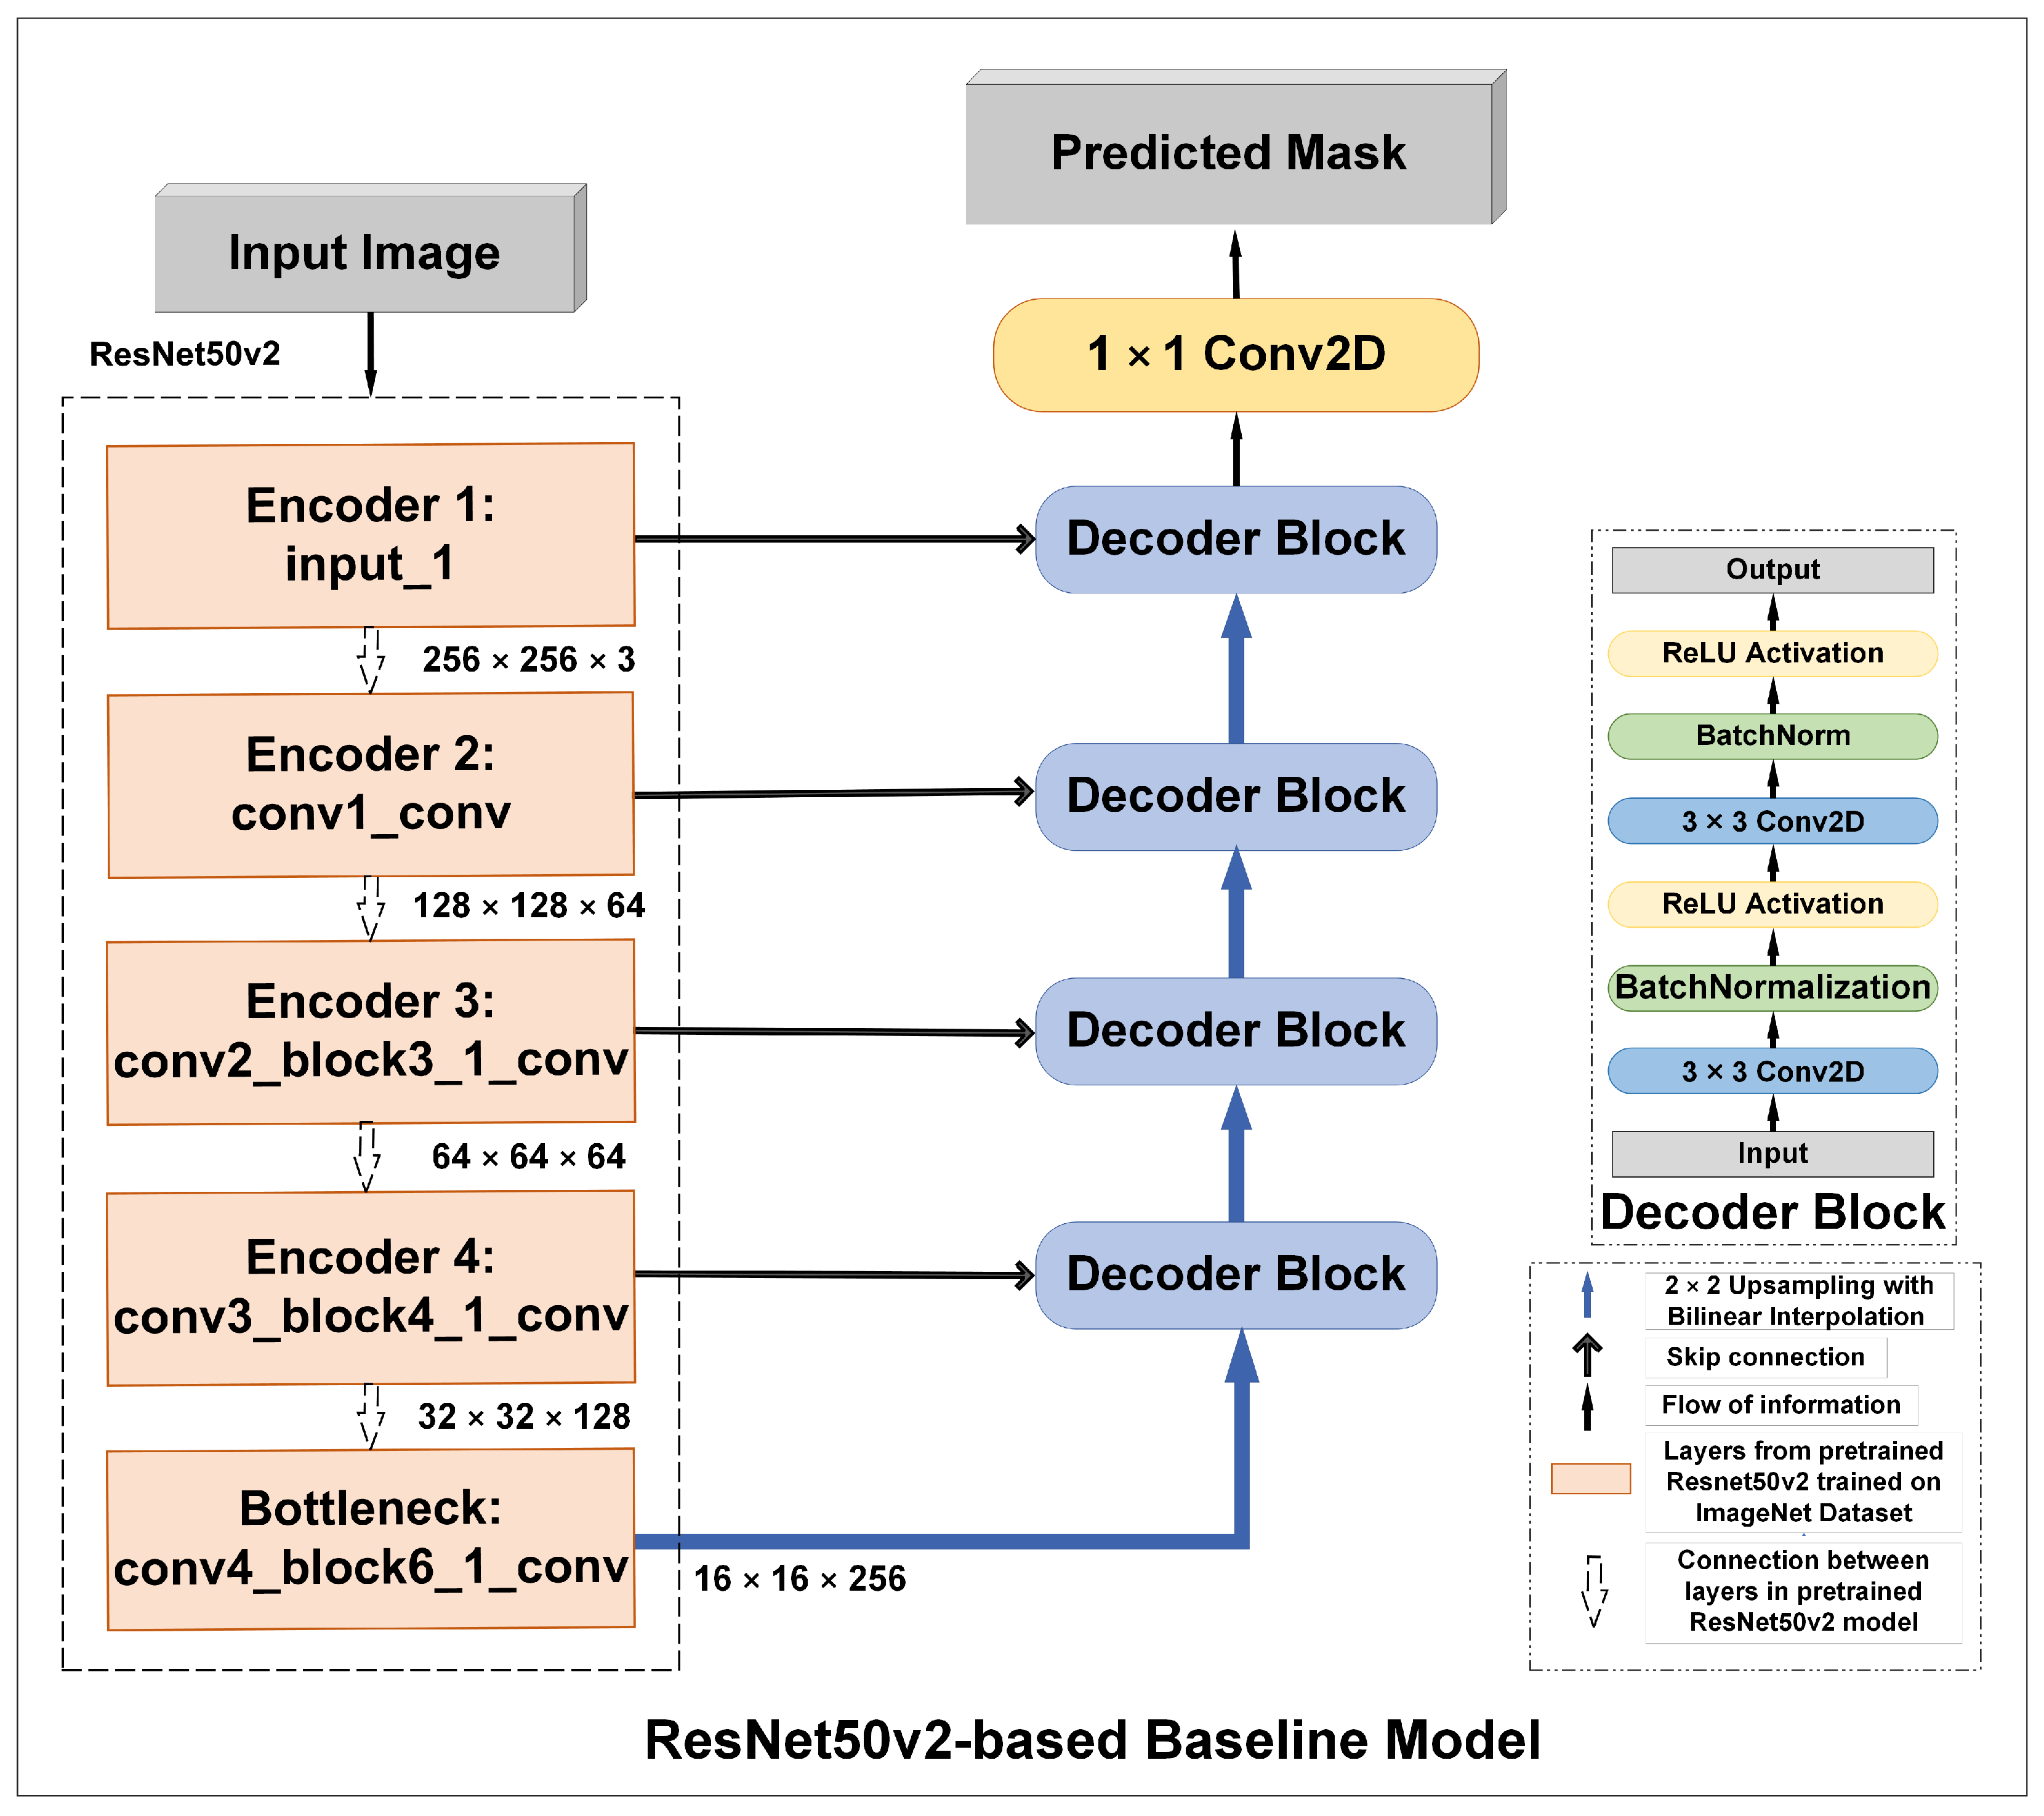
This section describes the proposed partial fine-tuning approach. It explains that the early layers of the pretrained ResNet50v2 model are frozen and used for feature extraction, while the last few layers, including the bottleneck layer, are fine-tuned. This allows the model to adapt to the seepage segmentation task while leveraging the pretrained features. Feature extraction and fine-tuning are well established transfer learning methodologies that are often employed in image segmentation tasks. In this study, a novel approach to partial fine-tuning is proposed, aimed at optimizing the learned representation from a pretrained model, specifically ResNet50v2 [37], which was trained on a large ImageNet dataset [38] (comprising 1.4 million images across 1000 different classes). The hypothesis behind this study is that the early layers of the pretrained model can be utilized for feature extraction while the last few layers, including the bottleneck layer, can be fine-tuned. We incorporate a bottleneck layer for fine-tuning due to its capacity to retain the dataset’s most concise and informative latent representation. This representation plays a critical role in the upsampling path of the model. By employing this strategy, the model is expected to efficiently absorb knowledge from the levee fault dataset while maximizing the relevance of features harnessed from its existing knowledge base. The study essentially involves the implementation of an integrated feature extractor utilizing ResNet50v2. The general idea is presented in Figure 6, showcasing the layers from the ResNet50v2 model.
In the proposed architectures, all the layers except for the last 48 layers of pretrained ResNet50v2 are fine-tuned, while others are frozen. Lower layers of the pretrained model, which are used as the encoders, are kept frozen for feature extractors, whereas the later layers, which include the bottleneck layer, are fine-tuned. The reason for partial fine-tuning is that the lower layers of the pretrained model are responsible for learning low-level features such as edges, blobs, and corners. The latter layers, closer to the output layer, allow the model to adapt to the task-specific task of seepage segmentation. Furthermore, partial fine-tuning reduces the potential for overfitting, as adding more fine-tuned layers would increase the number of training parameters in the network [39].
Another essential technique applied during partial fine-tuning [40] is the use of a low-value learning rate for the optimizer so as not to cause extensive transformations on representations associated with the fine-tuning layer [41]. In addition to this, all the batch normalization (BN) layers in the pretrained model are set as non-trainable layers to keep layers in inference mode. When fine-tuning on a seepage dataset, the data differ significantly from the original ImageNet dataset for training the ResNet50v2 model. This causes batch normalization statistics to be inconsistent, and unfrozen batch normalization will lead to new parameters that do not align with pretrained network optimization. Consequently, freezing batch normalization during fine-tuning prevents parameter conflicts and maintains learned features of the pretrained models without requiring extensive training or facing challenges due to limited data size [42].

4.4. PCA-Based Domain Adaptation

In this study, it is postulated that the integration of PCA into the feature map of pretrained model could increase its adaptability to new domains. Since the pretrained layers already generate a reduced feature map size, PCA is used to compute a new set of orthogonal variables or principal components that represent channels adapting to the seepage dataset’s new domain. Consequently, retraining the 100% variance described by the channels of the feature map helped to reveal underlying patterns and relationships within the batch size of the data to facilitate the training, as depicted in Figure 7. In SeepageNet, all principal components are retained, maintaining channel numbers identical to the inputs. This approach ensures 100% variance coverage in the feature map, focusing on maximizing feature utilization.

5. SeepageNet: Proposed Architecture

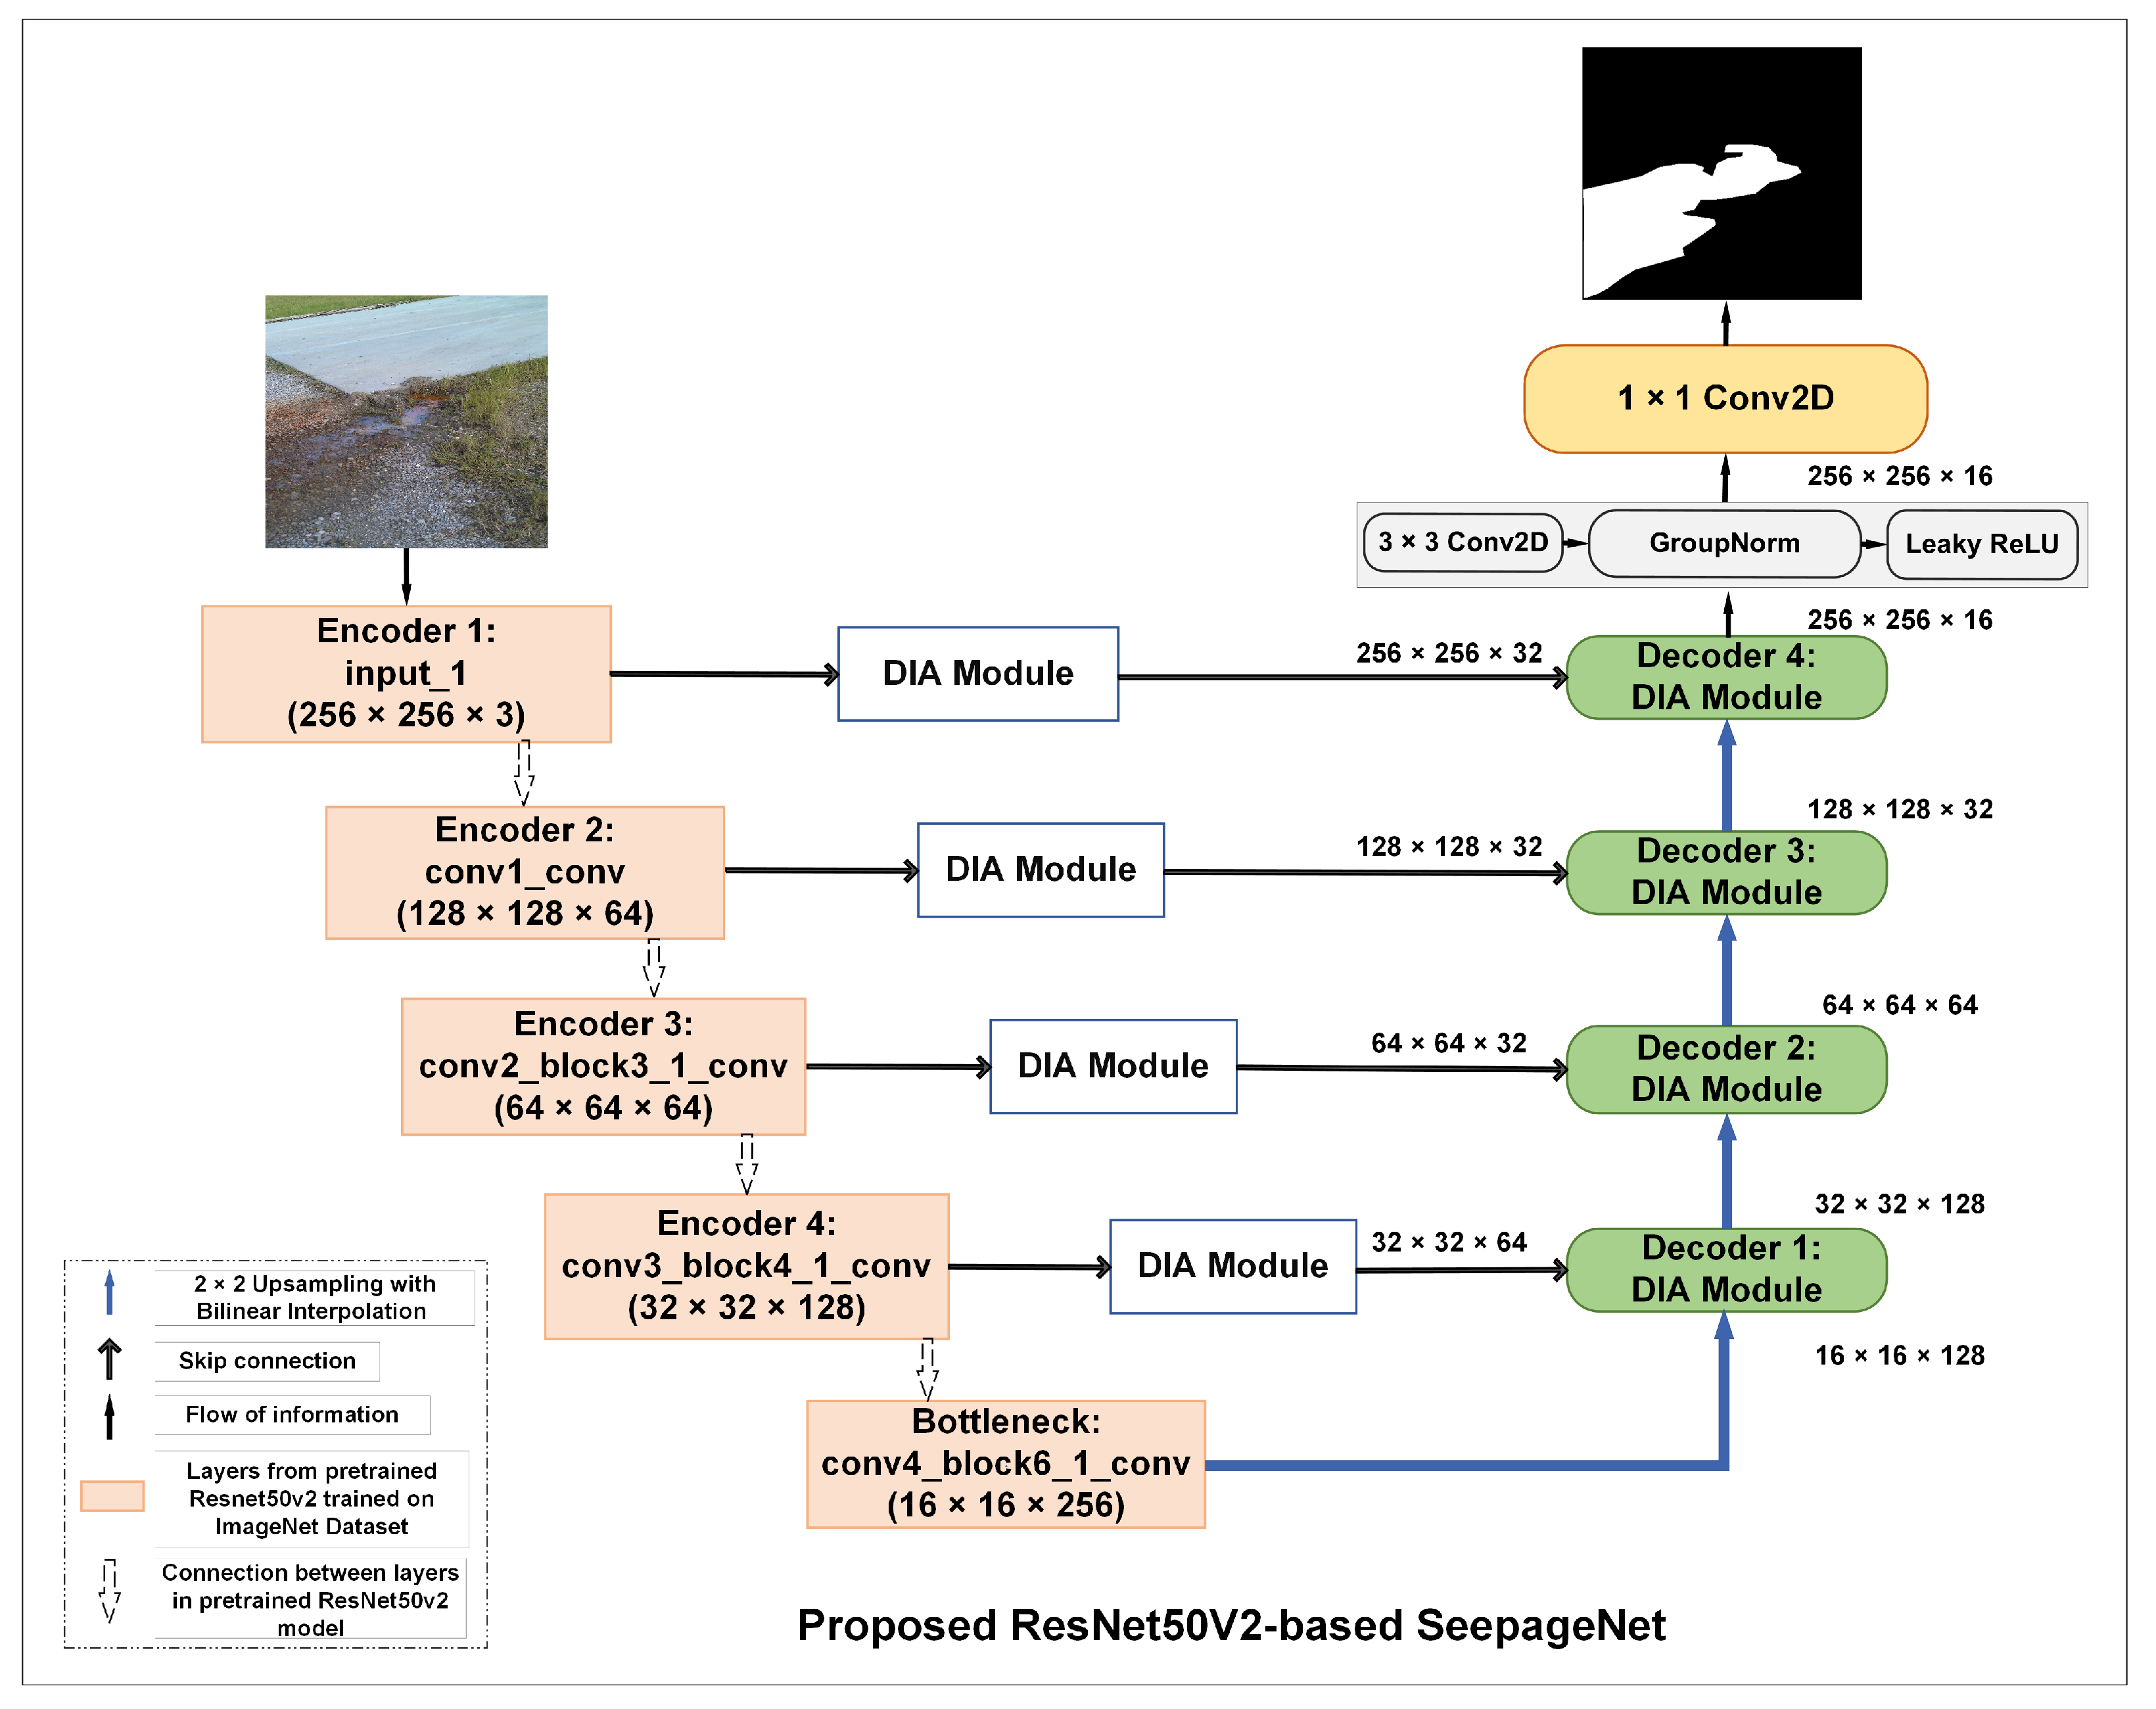
SeepageNet utilizes an encoder–decoder design with a skip connection, incorporating multi-scale filters and a PCA-based channel–spatial attention module to achieve effective feature extraction, as shown in Figure 8. The key objective is to segment seepage regions by reducing the number of training parameters and employing controlled transfer learning through partial fine-tuning and feature compression techniques. SeepageNet implements the partial fine-tuning approach with variations in channel and spatial attention module usage. The architecture integrates domain adaptation via PCA-based feature representation. It integrates an improved pyramidal pooling channel–spatial attention module to enhance the model’s efficacy in selecting relevant features for the target domain. The architecture comprises three primary building blocks, including a depthwise separable convolution and residual connection-based inception-like module, dramatically reducing the number of training parameters and collectively improving the model’s performance in segmenting seepage regions.
The layers from pretrained models represent the encoders as integrated feature extractors. The controlled transfer learning happens in the skip connection where the feature maps from encoders and a bottleneck are passed through the PCA-Depthwise Inception Attention (PDIA) Module. The initial assumption made in SeepageNet is that not all features generated by the layers of pretrained models contribute to the focus on the seepage region in the image. So, the encoder’s feature maps are passed through the DPSCAttention module, which acts as “attention through channels” and proposed depthwise separable inception module, followed by an MSSA module to extract further and refine more salient features. Figure 7 shows the two influential modules used in the architecture.
In the expanding path, decoders use simple upsampling to restore the input image’s spatial dimensions gradually. In each decoder block, the features are upsampled and concatenated with the corresponding output of the PDIA module from the encoder. The combined feature maps are then passed through channel-wise attention, depthwise separable inception, spatial pooling, and, again, the inception module. The final decoder’s output is passed through a 1 × 1 convolution with a channel depth of 1, signifying the binary segmentation mask. The sigmoid activation converts the output values to a range of 0 to 1. The advanced deep learning techniques used in SeepageNet can effectively capture complex patterns in the input data while being computationally efficient.

6. Data

6.1. Seepage Dataset

During floods, seepages can occur in levee systems due to the pressure caused by rising water levels on one side of the structure. This forces porous materials within the levee to allow infiltration, creating a phreatic or seepage line. Seeping water may be observed with visual cues like those shown in Figure 9, such as the modest plant growth and wetlands surrounded by dry land. The seepage regions are irregular in shape with varying sizes. To create datasets for semantic segmentation tasks, a careful selection process was employed to filter and choose relevant images from the extensive collection gathered by field inspectors of the USACE in the New Orleans area over the years. The image selection was based on experts’ suggestions, ensuring that the chosen images effectively represent single or multiple instances of the same faults. Additionally, the selected images feature diverse backgrounds and surroundings, encompassing grassland, concrete, watery, muddy, and pebbly environments. The dataset used in the study includes 364 images for training and 92 images for evaluation of size 512 × 512. We further applied 28 different augmentation techniques [43] to the training dataset which yielded 10,556 augmented images.
The dataset utilized in our research was sourced from the U.S. Army Corps of Engineers of the New Orleans District and has been collected over several years. The analysis of seepage considers factors such as recent rainfall events (e.g., New Orleans experiences an average annual rainfall of 62 inches, with significant variations during hurricane season), the time of year (e.g., minimum rainfall typically occurs in October, with an average of 3.5 inches), the depth of water accumulation (e.g., seepage detected at depths of up to 2 m), and proximity to water bodies (e.g., levees near Lake Pontchartrain and the Mississippi River).
This dataset includes images taken under various environmental conditions, which are key to understanding the occurrence and characteristics of seepages. For instance, in the New Orleans levee areas, seepage is often observed during periods of high river levels, particularly in the spring and early summer when rainfall is more frequent. Conversely, during the drier months of October and November, water accumulation due to seepage is less likely, and any persistent water is more indicative of infiltration rather than surface runoff from rainstorms.

6.2. Data Pre-Processing

The images in the seepage dataset [44] were annotated manually using the VGG Image Annotator tool (VIA) [45] to annotate fault regions in the images and, subsequently, a Python script was used to create masks as ground truths, which took approximately 30 h. A significant challenge in building a deep learning model for real-world scenarios is maintaining the quality of training and evaluation datasets. Figure 9 shows that the sample images from the seepage dataset have diverse textures and backgrounds, deficiencies of different scales, and undefined boundaries. Deep learning models should be robust enough to generalize on such datasets. Thus, the pre-processing approach included carefully selecting original images, generating ground truths, applying augmentation techniques [43], and analyzing the performance of the baseline method. Overall, twenty-eight augmentation techniques were curated for the expanded levee seepage dataset. These techniques created robust, diverse, and representative datasets, promoting more effective learning and better generalization capabilities for the trained models. An iterative approach was taken to identify the most effective augmentation methods experimentally. The augmented levee images were resized to a dimension of 512 × 512 × 3 for the proposed architecture to accommodate computational constraints.
Data augmentation significantly improved SeepageNet’s performance, with the IoU increasing from 53.5% to 60.0%, Dice Coefficient from 64.2% to 71.8%, sensitivity/recall (TPR) from 66.0% to 72.2%, and Specificity (TNR) from 91.4% to 96.4% when comparing the original dataset (364 images) to the augmented dataset (10,556 images). The substantial improvements demonstrate the effectiveness of data augmentation in enhancing the model’s ability to detect and segment seepages accurately by increasing the diversity and quantity of training data, enabling the model to learn more robust features and achieve better generalization and higher accuracy.
The seepage dataset comprises only twenty-one percent of seepage pixels. It is important to note that the dataset exhibits a significant class imbalance, which may introduce biases during model training. Therefore, apart from data pre-processing techniques, the separation of training and independent test images was manually performed to ensure similar representations of images across both sets. Other measures were introduced to tackle the uneven distribution of classes within the seepage dataset, including appropriate loss function and regularizations within the model itself. Furthermore, we added negative images in the training and evaluation datasets to prevent the model from over-segmenting and identifying non-seepage areas as seepage. Adding negative images in the training dataset allows the model to learn from the images not to pick up non-seepage areas as seepage. Subsequently, 110 pothole images [46], 125 levee crack images [31], 200 images of a variety of natural environments, and 250 puddle images [47], were included in the training dataset. Finally, twenty-eight percent of the total 11,245 images were used as validation datasets for early stopping and saving the best model, and the remaining for model training.

7. Selection of State-of-the-Art Models

In our work, we first analyzed the performance of four state-of-the-art encoder–decoder-based models, U-Net [17], MultiResUNet [23], Attention U-Net [22], and U-Net++ [18], in addressing the challenges inherent in three unique datasets. Table 1 shows the statistics of the existing image segmentation models, baseline model, and proposed SeepageNet model, including their parameter and model size whereas Table 2 shows analysis of the performance of different models on the seepage. These selected models are well established in the medical image segmentation domain, where the datasets comprise objects of irregular shapes and variable sizes, often with noisy or poorly defined boundaries. Considering our target datasets—levee system seepages with similar complexities—we hypothesized that these models could handle these challenges. Examining these models and their performance on such datasets provided valuable insights into their applicability to our use case. It also informed future model development tailored to fault detection in levee systems.

8. Metrics and Loss Functions

Accurately detecting and segmenting seepages is crucial in disaster management, and the performance of deep learning models for this task is highly dependent on selecting appropriate loss functions and evaluation metrics. A pixel accuracy alone cannot reflect the performance of segmentation models. As such, the models were evaluated based on their ability to accurately locate seepages and compute overlap scores between the predicted and ground truth masks. Equations (1) and (4) represent DC and MaF1 as evaluation metrics other than IoU and BA. The MaF1 score in Equation (4) provides a balanced measure of the average of precision and recall over all test images, providing a harmonic mean of precision and recall. Likewise, the IoU metric measures the overlap between the predicted and ground truth segmentation mask, whereas DC computes the similarity between predicted and ground truth masks.
In a class imbalance situation, Binary Cross-Entropy (BCE) loss cannot provide comprehensive learning for the model, even though BCE loss helps minimize false positives and false negatives by assigning a higher penalty to these false predictions [48]. Likewise, Dice loss distributes weights for false positives and false negatives equally, which, alone, may not be optimal when the class distribution in the dataset is severely imbalanced. Therefore, an advanced loss function, represented in Equation (5), suitable for datasets with the highly uneven class distribution is used in the study. BCE-Dice loss is calculated by taking the arithmetic mean (average) of these two loss values: Binary Cross-Entropy (BCE) loss and Dice loss. BCE loss focuses on pixel-wise accuracy by comparing each pixel’s predicted probability with its true label. It assigns a higher penalty to false positive and false negative predictions, which helps minimize misclassifications. However, in class-imbalanced situations, BCE alone may not provide comprehensive learning.
On the other hand, Dice loss emphasizes the overlap between the predicted and ground truth segmentations. It equally weights false positives and false negatives, making it less sensitive to class imbalance. By combining BCE and Dice loss via averaging, BCE-Dice loss leverages the strengths of both functions. It encourages the model to optimize pixel-level classification while simultaneously maximizing the overlap between predicted and true object boundaries. This helps improve the overall segmentation accuracy and produce well-defined object contours, even in the presence of severe class imbalance.
By combining these two loss functions, BCE-Dice loss leverages the strengths of both BCE loss, which focuses on pixel-wise accuracy, and Dice loss, which emphasizes the overlap between the predicted and ground truth segmentations. This helps the model to optimize both pixel-level classification and object-level segmentation simultaneously. Precision (P) is the proportion of true positive predictions among all positive predictions made by the model and recall (R), also known as sensitivity, is the proportion of true positive predictions among all actual positive instances in the dataset.
Dice Coefficient : D C = 2 · | Y p r e d i c t e d Y g t | | Y p r e d i c t e d | + | Y g t |
Precision : P = T P T P + F P
Recall : R = T P T P + F N
Macro F 1 Score : M a F 1 = 2 · P r e c i s i o n · R e c a l l P r e c i s i o n + R e c a l l
BCE - Dice Loss : = BCE Loss + ( 1 D C ) 2
In these equations, Y p r e d i c t e d represents the predicted sets of pixels, while Y g t represents the ground truth sets of pixels. T P , F P , and F N represent true positive, false positive, and false negative segmentation of respective fault pixels. Y p represents the predicted probability of the seepage class.

9. Experimental Setup

Segmentation models for all the datasets were trained using the Keras framework, a high-level neural network API written in Python and capable of running on top of TensorFlow, CNTK, or Theano. Keras was developed with a focus on enabling fast experimentation, allowing for easy and fast prototyping through user friendliness, modularity, and extensibility. The NVIDIA K80 GPU used for the computational tasks in training the segmentation models was sourced from NVIDIA Corporation, headquartered in Santa Clara, CA, USA. For each model, the convolutional layers were initialized with the He Initialization [49] method, utilizing a consistent seed value. This ensured that the initial training parameters and the training and validation datasets remained uniform across all models, enabling a controlled comparative analysis environment. A popular stochastic gradient method, the Adam algorithm with a momentum of 0.9, was used as an optimizer [50] to minimize the BCE-Dice Equation (5) loss function for each dataset. The Adam optimizer helped to dynamically adjust the initial learning rate (LR) to 8 × 10⁻⁴, allowing for efficient gradient updates during the optimization process, providing faster convergence and some level of regularization [50]. Further, early stopping was also incorporated in all models when validation DC plateaued for 8 epochs to mitigate overfitting. Additionally, an LR scheduler was implemented, designed to reduce the LR by a factor of 0.06 when the validation loss reached a plateau for 6 epochs. The evaluation metrics used throughout the study were IoU and DC, which are standard practices for evaluating segmentation algorithms in medical imaging [48]. In addition to these metrics, BA and MaF1 were also used to evaluate models, since the primary goal was accurately segmenting faults in levee systems. Likewise, the model demonstrating the highest DC on the validation dataset was saved for evaluation on independent test datasets.

10. Results and Analysis

10.1. Comparison with State of the Art

Our comparative analysis of the performance of different models on the seepage dataset is summarized in Table 3. The segmentation results across these figures indicate that the SeepageNet variations, particularly the SeepageNet-PCA (proposed model), demonstrate superior performance in accurately identifying seepage areas, as evidenced by higher IoU scores and a closer alignment with the ground truth, with the highest IoU score at 60.0%, which is a primary metric for assessing the performance of the model. This model also shows superior performance in terms of DC and MaF1, with scores of 71.8% and 76.4%, respectively. The results indicate that the proposed model not only excels in identifying the correct area of interest but also maintains a balance between precision and recall, as reflected in the TPR and TNR values. This underscores its potential as a robust solution for tasks requiring precise segmentation.
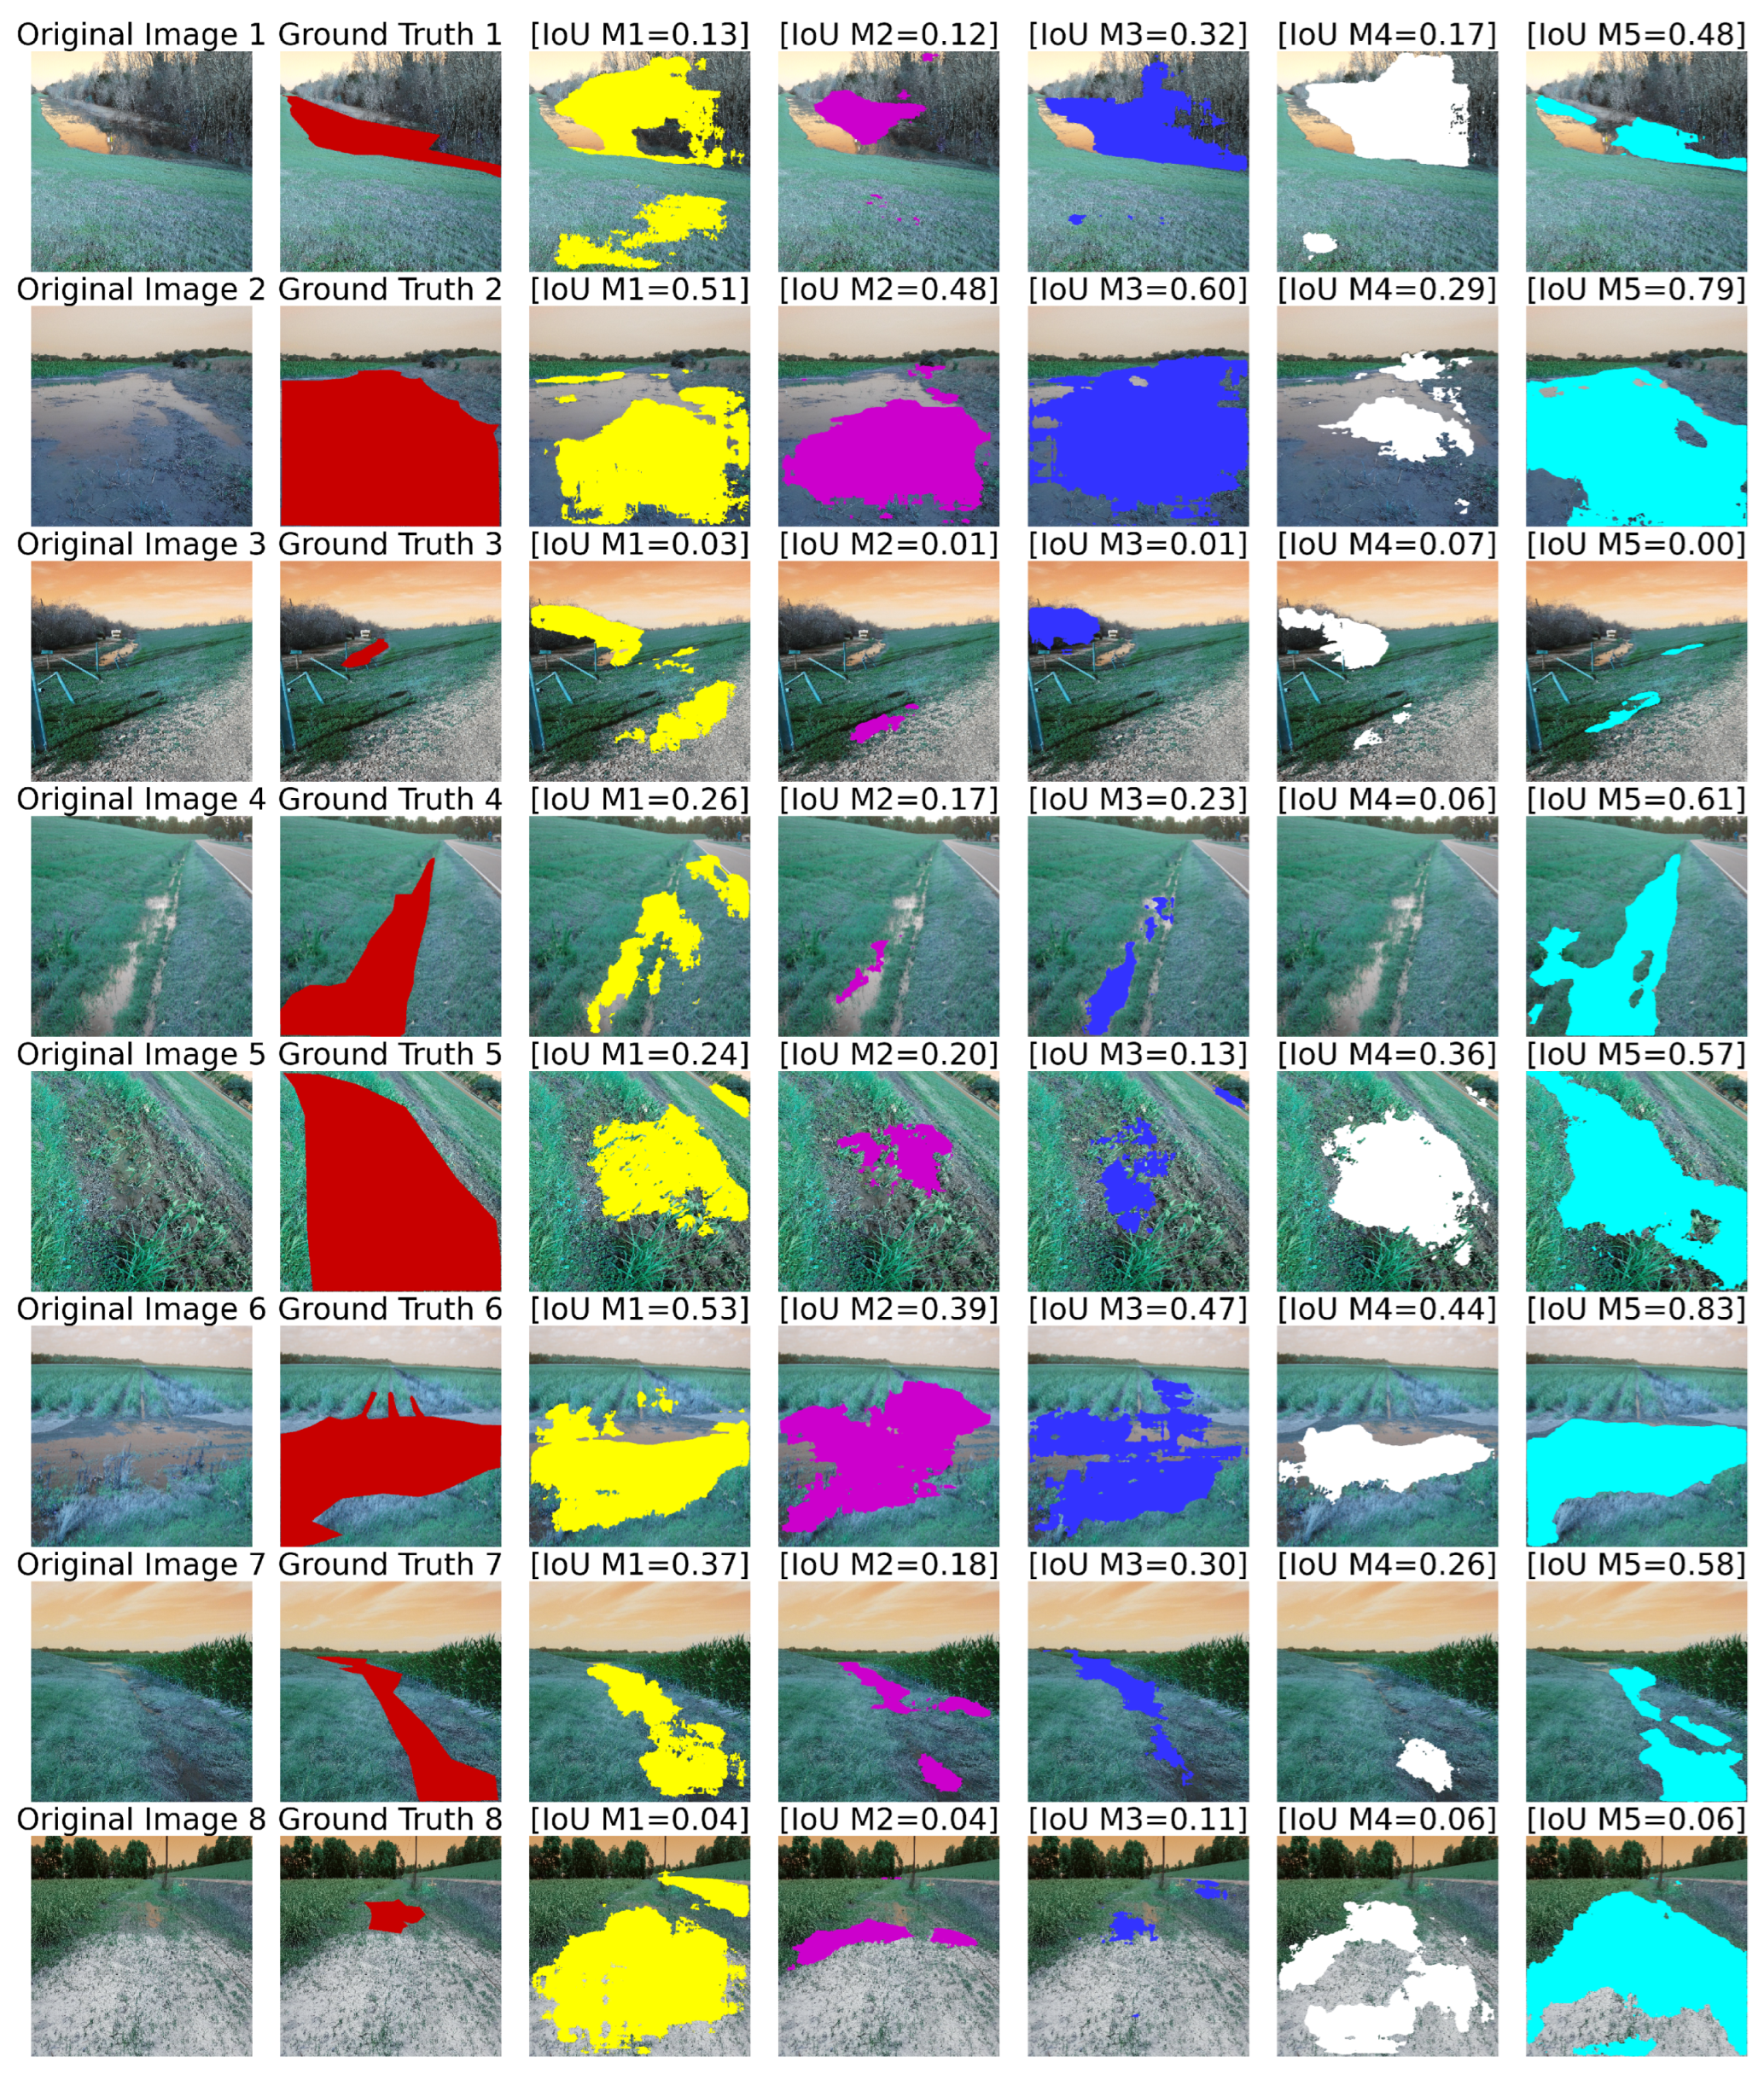
Furthermore, Figure 10 demonstrates the model’s performance on the seepage test dataset compared to the CNN-based state-of-the-art models. Figure 10 showcases a grid layout where each row represents an original image alongside its ground truth seepage area, highlighted in red. Adjacent to the ground truth, the segmentation results from five distinct models (M1 through M5) are displayed, each with a unique color overlay to distinguish their predictions and accompanied by Intersection over Union (IoU) scores. It can be observed that all the models display a spectrum of IoU scores, pointing to inconsistent performance in seepage segmentation. We further notice that the overlapped predicted segmentation masks from the proposed model, M5, indicate that it has instances of close alignment with the ground truth. SeepageNet (M5) consistently presents the highest IoU scores among the models, indicating its strong capability in accurately identifying seepage areas. However, there are difficult examples where models are either under-segmenting, such as presented in row 3, or over-segmenting in row 8 of Figure 10. The reason behind the divergence in the performance is because of lack of samples in the training dataset, with examples representing difficult scenarios as presented in row 3 and row 8. However, IoU scores of the proposed model range from moderate to high, suggesting a generally reliable performance. The SeepageNet variants, especially SeepageNet-PCA, emerge as the most accurate, as evidenced by their consistently high IoU scores, highlighting their potential for effective environmental monitoring. The computation time for running all five models, including U-Net, Multires U-Net, Attention U-Net, and SeepageNet, was approximately 4.5 h in total, with each model requiring around 50 min on average when run on an NVIDIA K80 GPU.

10.2. Results of Ablation Study

The ablation study evaluates the performance of SeepageNet variations, including models with different attention modules and the presence or absence of PCA for feature representation. The proposed attention blocks were replaced by either none, the CBAM block, or the SE block. Specifically, for CBAM, its DPSCAttention module was replaced by its channel attention module, and the MSSA module was replaced by the spatial attention module. The major reason for performing this study is to understand the effects of the proposed attention modules and PCA-based feature refactoring in conjunction with the transfer learning setup implemented in this study.

10.3. Training Workflow Diagram

The training workflow diagram illustrates a comprehensive process for developing segmentation models using a seepage dataset.
The process begins with the initial seepage dataset, which undergoes image pre-processing and curation to enhance data quality. If the resulting dataset is not balanced, data augmentation techniques are applied to address any imbalances. The data are then split into training (70%), validation (15%), and test (15%) sets. The core of the workflow involves training multiple segmentation models in parallel, including U-Net, MultiRes U-Net, Attention U-Net, U-Net++, and a proposed model. After training, the models are evaluated using the test set to assess their performance. The final output of this workflow is a set of segmented images, representing the results of applying the trained models to the test data. This systematic approach ensures thorough preparation of the dataset, comparison of various model architectures, and rigorous evaluation, ultimately aiming to produce high-quality segmentation results for seepage analysis.
The workflow diagram is depicted in Figure 11. After pre-processing and curating the images, the next step is to balance the dataset using 30 data augmentation techniques, as well as training and evaluating the segmentation models, including the proposed model, using the training and validation sets. The final step is testing the models using the test set.

11. Discussion

The SeepageNet-PCA model, incorporating PCA for feature representation, achieved the best performance across most metrics. It demonstrated the highest BA (84.3%) and MaF1 (76.4%). As our datasets are imbalanced, higher values in these two metrics indicate that the model can accurately differentiate between seepage and non-seepage pixels while considering false positives and false negatives. Additionally, this reflects how the addition of PCA significantly improved the model’s performance compared to the SeepageNet-NoPCA variant, indicating the effectiveness of PCA in enhancing feature representation for seepage detection tasks.
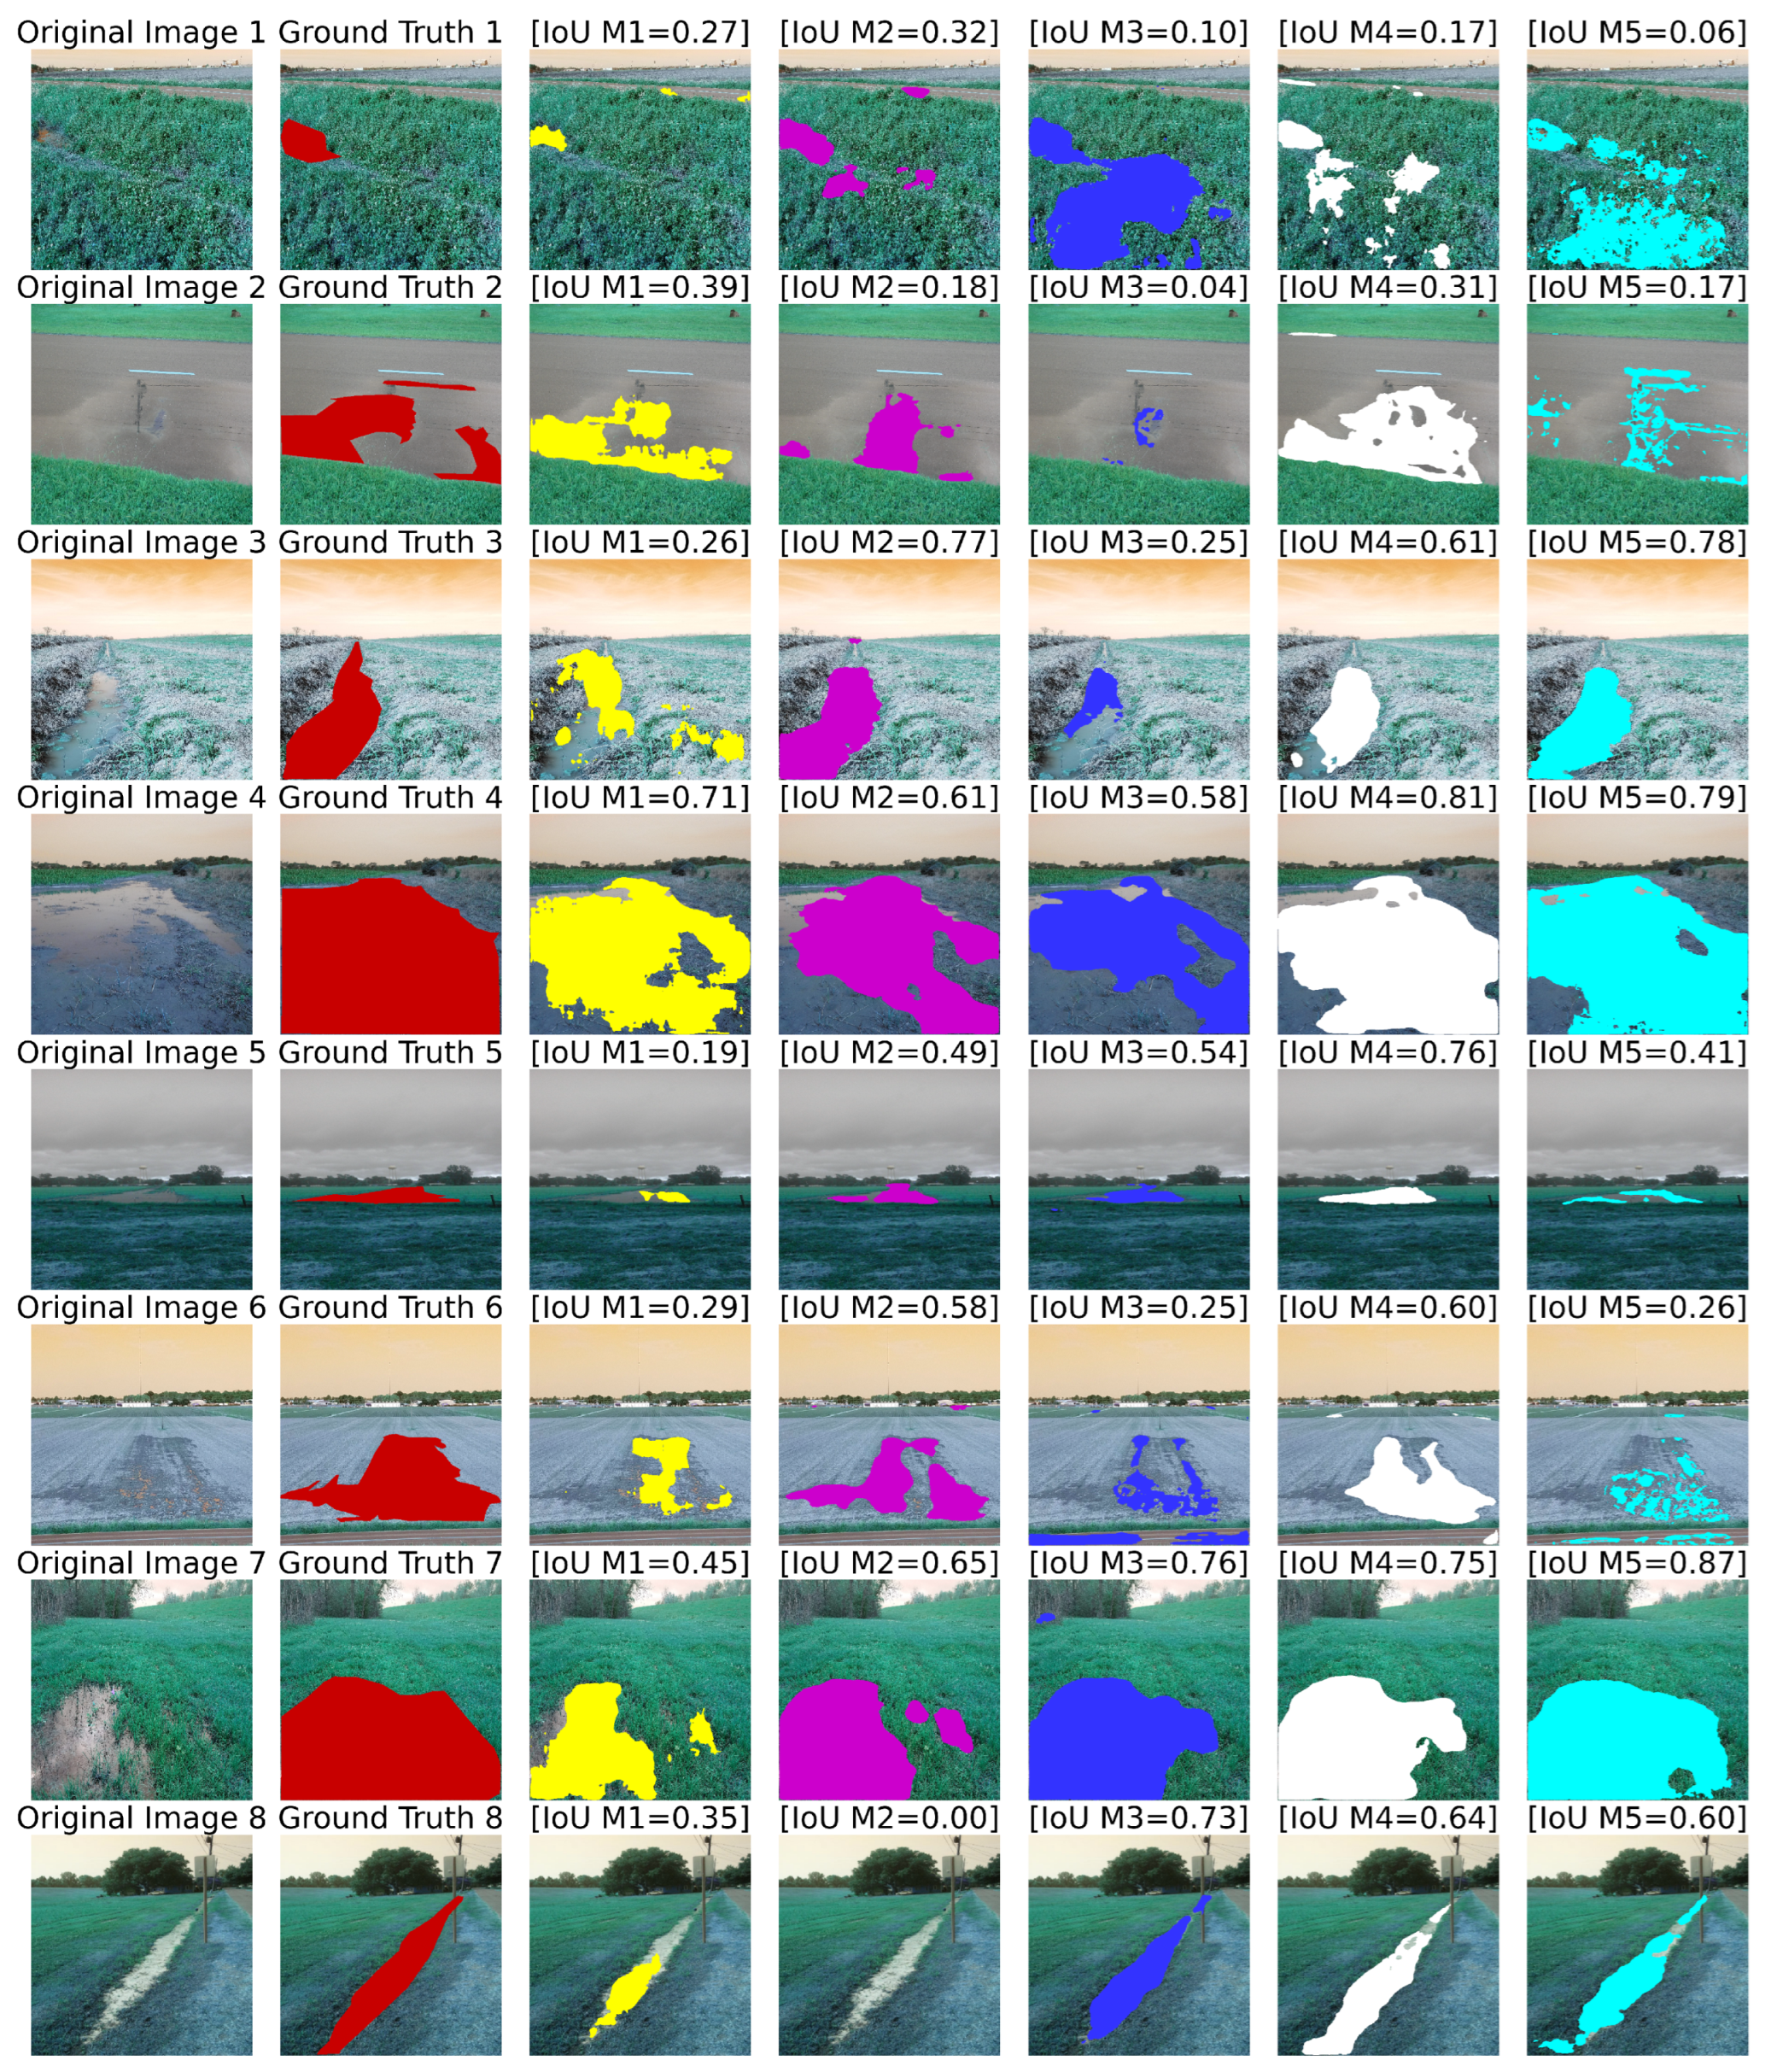
It can be evidenced from Figure 10 and Figure 12 that transfer learning-based models outperform the CNN-based state-of-the-art methods. This is because transfer learning models utilize the pretrained ResNet50v2 model, which has already learned low-level image features from the extensive ImageNet dataset. This gives them a head start in learning nuanced features pertinent to seepage segmentation. In contrast, the existing models start their training from scratch and do not benefit from this pre-acquired knowledge. Furthermore, the introduction of partial fine-tuning enabled transfer learning models to tailor the pretrained model specifically to seepage detection while retaining beneficial low-level features.
Among the attention modules tested, the SeepageNet-CBAM (Convolutional Block Attention Module) and SeepageNet-SE (Squeeze and Excitation) models also showed improved performance over the baseline but not as high as the SeepageNet-PCA model. While SeepageNet-CBAM and SeepageNet-SE are the models with the highest TPR of 72.8% and TNR of 96.4% in comparison to models with the transfer learning approach, SeepageNet-PCA demonstrates balanced TPR and TNR, indicating its effectiveness in accurately identifying both seepage and non-seepage regions. These findings highlight the potential of transfer learning and feature representation techniques in enhancing the performance of semantic segmentation models for specific real-world applications like levee inspection and maintenance. Further visual evidence is presented in Figure 12 where we can observe that models incorporating an attention mechanism are performing consistently better at distinguishing between seepage and non-seepage regions at the pixel level.

Analysis on Negative Samples

Negative samples play a crucial role in deep learning by ensuring dataset balance, enhancing model generalization, and boosting robustness. By incorporating negative samples, models are trained to identify the presence of specific features and recognize their absence, which helps reduce false positives. This approach balances the dataset, particularly when positive samples are limited, preventing model bias towards the more common class. Additionally, training with negative samples equips the model to better handle variations and noise in the data, improving its decision-making capability and overall performance.
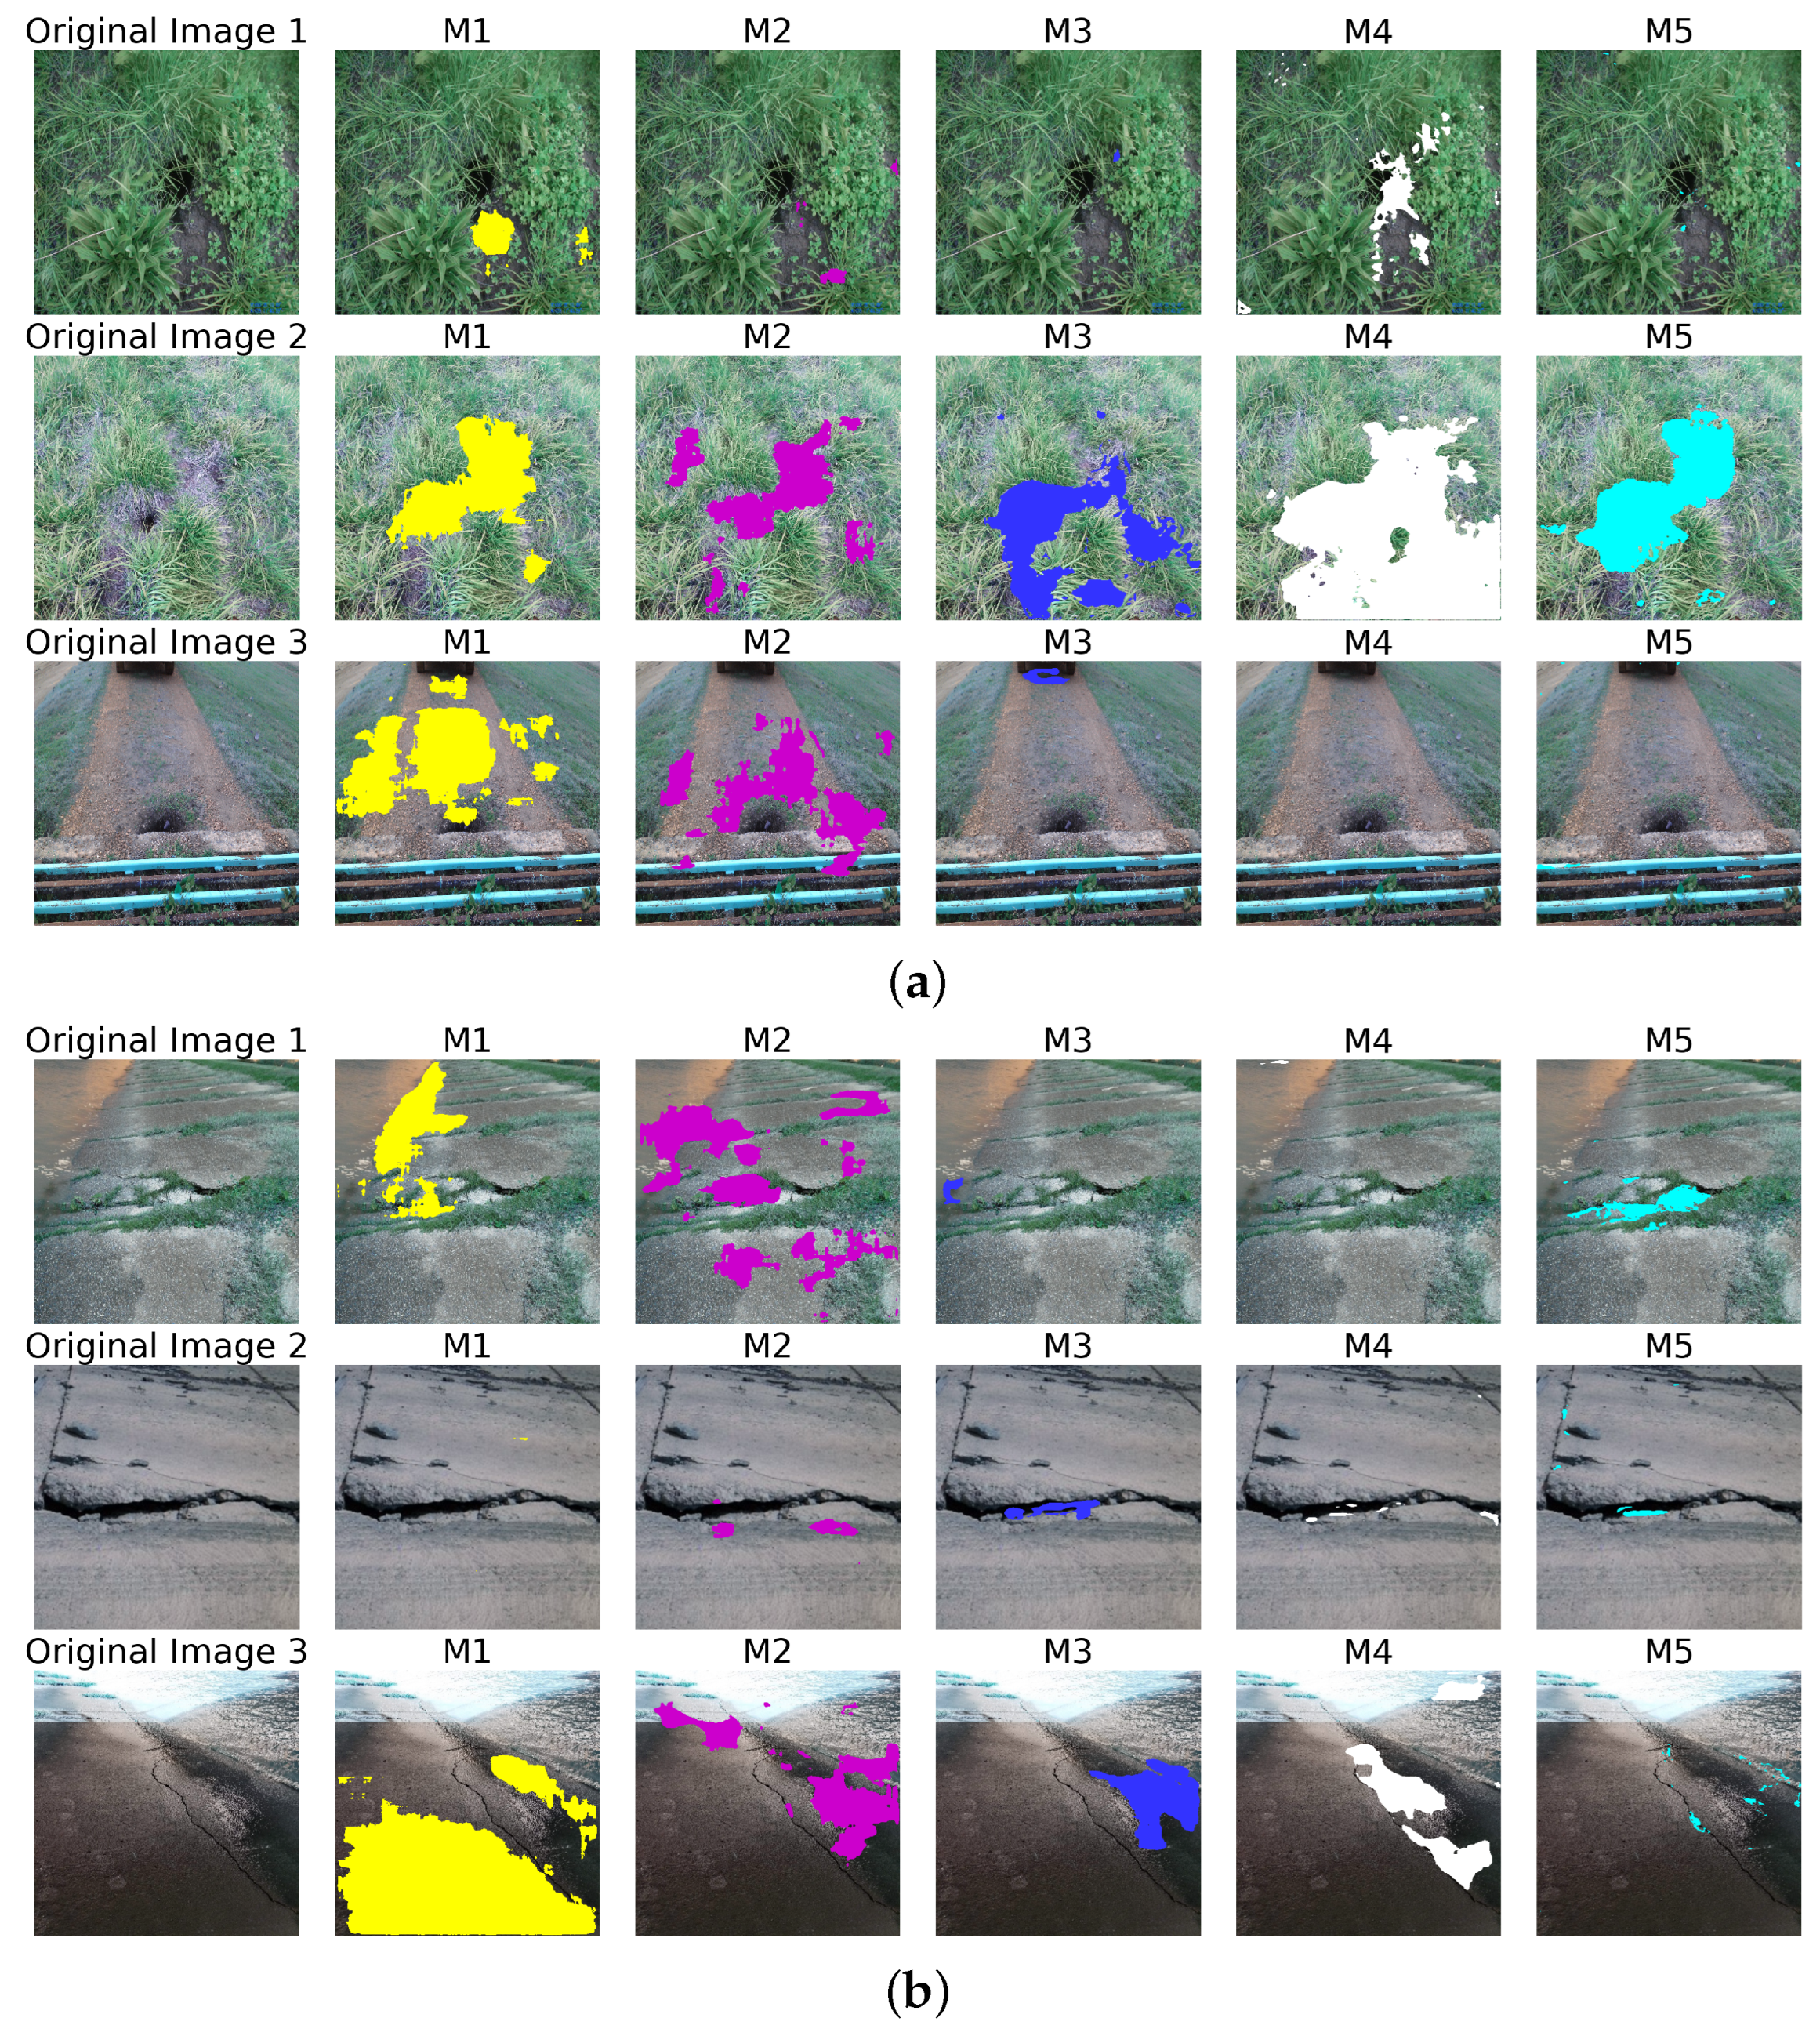
The primary aim of our research is to develop models that can recognize the inherent characteristics of seepage in a levee system. These models should have the capability to differentiate between areas with seepage and those without. One way to assess the effectiveness of the models is by testing them on unseen negative samples, which allows us to gauge their ability to identify and pinpoint seepage regions within complex and variable backgrounds, such as images depicting levees without issues, cracks, animal burrows against different levee backdrops, and pictures of puddles of water for specificity testing. Therefore we compared the best-performing model from the pool of CNN-based existing models, Attention U-Net, with the proposed model. The inference results on negative images are depicted in Figure 13 and Figure 14. These figures demonstrate that the models generally excel at distinguishing between non-seepage regions and actual seepage instances, indicating their effectiveness in reducing false positives within levee systems—a crucial aspect for practical applications.
Figure 13 demonstrates the model’s high specificity and effectiveness in reducing false positives by accurately identifying levees without seepage issues. Figure 14, divided into two parts, further elucidates the model’s performance in complex scenarios. The first part of it highlights the model’s challenge in accurately distinguishing between seepage and non-seepage areas in the presence of animal burrows. Specifically, our SeepageNet model M5 exhibits some limitations, misidentifying animal burrows as seepage in certain instances within the second row of images. This indicates areas where the model’s performance could be enhanced, particularly in distinguishing between similar features that may lead to false positives. Despite this, the model shows commendable performance in the remaining levee images, especially those with cracks, as depicted in the second part of Figure 14. Here, the model’s ability to differentiate between actual seepage and mere cracks is showcased, further affirming its utility in accurately identifying true seepage instances amidst complex backgrounds.
The improved distinction of seepage and non-seepage pixels by SeepageNet largely contributes to the use of proposed attention mechanisms, which helps the model concentrate on the most relevant features for identifying seepages against complex backgrounds. This enhances specificity on negative samples. Likewise, the partial fine-tuning technique enables SeepageNet to leverage prior feature knowledge and adapt it for the specific task of seepage segmentation. This results in more effective feature extraction and attention mechanisms for discerning subtle seepages within complex backgrounds, leading to improved performance on negative samples compared to Attention U-Net, which is the best-performing model among existing CNN-based models.

12. Conclusions

This paper presents a deep neural network, SeepageNet, that uses controlled transfer learning to locate and segment sand boils in images. The model combines convolutional neural networks (CNNs) with depthwise convolution for local information extraction, while the pyramidal pooling channel–spatial attention module is used for global contextual information extraction to segment seepage precisely. Additionally, SeepageNet effectively addresses the vanishing gradient problem during training through residual connections comprising PCA-based transformations of feature maps from the pretrained model and attention module.
Our proposed model, SeepageNet, outperformed CNN-based state-of-the-art methods in seepage segmentation, confirming its suitability for better levee system monitoring tasks. The experimental results demonstrate that SeepageNet achieves superior accuracy and efficiency in locating faults, even those that are small or difficult to notice. This approach can be applied to extensive datasets of levee images, enabling a more comprehensive and frequent monitoring of levee systems. Furthermore, it is more cost-effective than conventional methods, necessitating minimal human intervention and equipment.
The objectives achieved in this study are significant for the field of levee system monitoring. By leveraging deep learning techniques, SeepageNet provides a robust solution for the timely identification and segmentation of seepages in levee systems. This capability is crucial for regular monitoring procedures, allowing for the early detection of infiltrations and enabling timely repairs to mitigate potential threats of unexpected levee failures. The practical application of SeepageNet can significantly enhance the maintenance and safety of levee systems, reducing the risk of catastrophic failures and protecting human lives, property, and infrastructure.

Author Contributions

Conceptualization, M.P., K.N.N., S.S., M.F. and K.P.; Methodology, M.T.H. and M.F.; Software, M.P., P.J.T. and M.T.H.; Validation, P.J.T., M.T.H. and M.F.; Formal analysis, M.P. and M.T.H.; Investigation, M.T.H.; Resources, M.T.H. and M.A.; Data curation, M.P., P.J.T. and K.N.N.; Writing—original draft, M.P., P.J.T. and M.T.H.; Writing—review & editing, M.P., P.J.T., M.T.H., K.N.N., S.S. and M.F.; Visualization, M.T.H.; Supervision, M.T.H., M.F. and M.A.; Project administration, M.T.H.; Funding acquisition, K.P. and M.A. All authors have read and agreed to the published version of the manuscript.

Funding

This research was partly supported by the U.S. Department of the Army–U.S. Army Corps of Engineers (USACE) under contract W912HZ-23-2-0004. The views expressed in this paper are solely those of the authors and do not necessarily reflect the views of USACE.

Data Availability Statement

The https://github.com/manisa/SeepageNet, (accessed on 15 June 2024) code and http://cs.uno.edu/~tamjid/Software/seepage_original_images.zip, (accessed on 27 April 2024) dataset used in this study are publicly available, providing a valuable resource for further research and development in this area.

Conflicts of Interest

The authors declare no conflicts of interest.

Abbreviations

BABalanced Accuracy (BA)
CNNConvolutional Neural Network (CNN)
DCDice Coefficient (DC)
DLDeep Learning (DL)
DPSCAttentionDual Pooling Spatial-Channel Attention (DPSCAttention)
DSCDepthwise Separable Convolution (DSC)
GNGroup Normalization (GN)
IoUIntersection over Union (IoU)
LLMLarge Language Model (LLM)
MaF1Macro F1 score (MaF1)
MSSAMulti-Scale Spatial Attention (MSSA)
PCAPrincipal Component Analysis (PCA)
PDIAPCA-Depthwise Inception Attention (PDIA)
TPRTrue Positive Rate (TPR)
TNRTrue Negative Rate (TNR)

References

  1. National Research Council. Levees and the National Flood Insurance Program: Improving Policies and Practices; National Academies Press: Washington, DC, USA, 2013. [Google Scholar]
  2. Leavitt, W.M.; Kiefer, J.J. Infrastructure interdependency and the creation of a normal disaster: The case of Hurricane Katrina and the city of New Orleans. Public Work Manag. Policy 2006, 10, 306–314. [Google Scholar] [CrossRef]
  3. Federal Emergency Management Agency (FEMA). HIstory of Levees; Federal Emergency Management Agency: Washington, DC, USA, 2020.
  4. Richards, K.; Doerge, B.; Pabst, M.; Hanneman, D.; O’Leary, T. Evaluation and Monitoring of Seepage and Internal Erosion; Leffel, S., Ed.; FEMA: Washington, DC, USA, 2015.
  5. Schaefer, J.A.; O’Leary, T.M.; Robbins, B.A. Assessing the implications of sand boils for backward erosion piping risk. In Proceedings of the Geo-Risk 2017, Denver, CO, USA, 4 June 2017; pp. 124–136. [Google Scholar]
  6. Couvillion, B.R.; Barras, J.A.; Steyer, G.D.; Sleavin, W.; Fischer, M.; Beck, H.; Trahan, N.; Griffin, B.; Heckman, D. Land Area Change in Coastal Louisiana from 1932 to 2010; U.S. Geological Survey: Reston, VA, USA, 2011.
  7. Haralick, R.M.; Shapiro, L.G. Image segmentation techniques. Comput. Vis. Graph. Image Process. 1985, 29, 100–132. [Google Scholar] [CrossRef]
  8. Mo, Y.; Wu, Y.; Yang, X.; Liu, F.; Liao, Y. Review the state-of-the-art technologies of semantic segmentation based on deep learning. Neurocomputing 2022, 493, 626–646. [Google Scholar] [CrossRef]
  9. Feng, D.; Haase-Schütz, C.; Rosenbaum, L.; Hertlein, H.; Gläser, C.; Timm, F.; Wiesbeck, W.; Dietmayer, K. Deep Multi-Modal Object Detection and Semantic Segmentation for Autonomous Driving: Datasets, Methods, and Challenges. IEEE Trans. Intell. Transp. Syst. 2021, 22, 1341–1360. [Google Scholar] [CrossRef]
  10. Minaee, S.; Boykov, Y.Y.; Porikli, F.; Plaza, A.J.; Kehtarnavaz, N.; Terzopoulos, D. Image segmentation using deep learning: A survey. IEEE Trans. Pattern Anal. Mach. Intell. 2021, 44, 3523–3542. [Google Scholar] [CrossRef] [PubMed]
  11. Ma, L.; Liu, Y.; Zhang, X.; Ye, Y.; Yin, G.; Johnson, B.A. Deep learning in remote sensing applications: A meta-analysis and review. ISPRS J. Photogramm. Remote Sens. 2019, 152, 166–177. [Google Scholar] [CrossRef]
  12. Cigla, C.; Alatan, A.A. Region-based image segmentation via graph cuts. In Proceedings of the 2008 15th IEEE International Conference on Image Processing, San Diego, CA, USA, 12–15 October 2008; IEEE: Piscataway, NJ, USA, 2008; pp. 2272–2275. [Google Scholar]
  13. Yu-Qian, Z.; Wei-Hua, G.; Zhen-Cheng, C.; Jing-Tian, T.; Ling-Yun, L. Medical images edge detection based on mathematical morphology. In Proceedings of the 2005 IEEE Engineering in Medicine and Biology 27th Annual Conference, Shanghai, China, 1–4 September 2005; IEEE: Piscataway, NJ, USA, 2006; pp. 6492–6495. [Google Scholar]
  14. Long, J.; Shelhamer, E.; Darrell, T. Fully convolutional networks for semantic segmentation. In Proceedings of the IEEE Conference on Computer Vision and Pattern Recognition, Boston, MA, USA, 7–12 June 2015; pp. 3431–3440. [Google Scholar]
  15. Badrinarayanan, V.; Kendall, A.; Cipolla, R. Segnet: A deep convolutional encoder-decoder architecture for image segmentation. IEEE Trans. Pattern Anal. Mach. Intell. 2017, 39, 2481–2495. [Google Scholar] [CrossRef] [PubMed]
  16. Zhao, H.; Shi, J.; Qi, X.; Wang, X.; Jia, J. Pyramid scene parsing network. In Proceedings of the IEEE Conference on Computer Vision and Pattern Recognition, Honolulu, HI, USA, 21–26 July 2017; pp. 2881–2890. [Google Scholar]
  17. Ronneberger, O.; Fischer, P.; Brox, T. U-net: Convolutional networks for biomedical image segmentation. In Proceedings of the Medical Image Computing and Computer-Assisted Intervention—MICCAI 2015: 18th International Conference, Munich, Germany, 5–9 October 2015; Springer: Berlin/Heidelberg, Germany, 2015; pp. 234–241. [Google Scholar]
  18. Zhou, Z.; Rahman Siddiquee, M.M.; Tajbakhsh, N.; Liang, J. Unet++: A nested u-net architecture for medical image segmentation. In Proceedings of the Deep Learning in Medical Image Analysis and Multimodal Learning for Clinical Decision Support: 4th International Workshop, DLMIA 2018, and 8th International Workshop, ML-CDS 2018, Granada, Spain, 20 September 2018; Springer: Berlin/Heidelberg, Germany, 2018; pp. 3–11. [Google Scholar]
  19. Milletari, F.; Navab, N.; Ahmadi, S.A. V-net: Fully convolutional neural networks for volumetric medical image segmentation. In Proceedings of the 2016 Fourth International Conference on 3D Vision (3DV), Stanford, CA, USA, 25–28 October 2016; IEEE: Piscataway, NJ, USA, 2016; pp. 565–571. [Google Scholar]
  20. Chen, L.C.; Papandreou, G.; Kokkinos, I.; Murphy, K.; Yuille, A.L. Deeplab: Semantic image segmentation with deep convolutional nets, atrous convolution, and fully connected crfs. IEEE Trans. Pattern Anal. Mach. Intell. 2017, 40, 834–848. [Google Scholar] [CrossRef]
  21. Chen, L.C.; Papandreou, G.; Schroff, F.; Adam, H. Rethinking atrous convolution for semantic image segmentation. arXiv 2017, arXiv:1706.05587. [Google Scholar]
  22. Oktay, O.; Schlemper, J.; Folgoc, L.L.; Lee, M.; Heinrich, M.; Misawa, K.; Mori, K.; McDonagh, S.; Hammerla, N.Y.; Kainz, B.; et al. Attention u-net: Learning where to look for the pancreas. arXiv 2018, arXiv:1804.03999. [Google Scholar]
  23. Ibtehaz, N.; Rahman, M.S. MultiResUNet: Rethinking the U-Net architecture for multimodal biomedical image segmentation. Neural Netw. 2020, 121, 74–87. [Google Scholar] [CrossRef]
  24. Michelazzo, G.; Paris, E.; Solari, L. On the vulnerability of river levees induced by seepage. J. Flood Risk Manag. 2018, 11, S677–S686. [Google Scholar] [CrossRef]
  25. Simm, J.; Wallis, M.; Smith, P.; Deniaud, Y.; Tourment, R.; Veylon, G.; Durand, E.; McVicker, J.; Hersh-Burdick, R.; Glerum, J. The significance of failure modes in the design and management of levees-a perspective from the International Levee Handbook team. In Proceedings of the 2nd European Conference on Flood Risk Management, FLOODrisk2012, Rotterdam, The Netherlands, 19–23 November 2012. [Google Scholar]
  26. Sharp, M.; Wallis, M.; Deniaud, F.; Hersch-Burdick, R.; Tourment, R.; Matheu, E.; Seda-Sanabria, Y.; Wersching, S.; Veylon, G.; Durand, E.; et al. The International Levee Handbook; CIRIA: London, UK, 2013. [Google Scholar]
  27. Mazzoleni, M.; Bacchi, B.; Barontini, S.; Di Baldassarre, G.; Pilotti, M.; Ranzi, R. Flooding hazard mapping in floodplain areas affected by piping breaches in the Po River, Italy. J. Hydrol. Eng. 2014, 19, 717–731. [Google Scholar] [CrossRef]
  28. Kuchi, A.; Panta, M.; Hoque, M.T.; Abdelguerfi, M.; Flanagin, M.C. A machine learning approach to detecting cracks in levees and floodwalls. Remote Sens. Appl. Soc. Environ. 2021, 22, 100513. [Google Scholar] [CrossRef]
  29. Panta, M.; Hoque, M.T.; Abdelguerfi, M.; Flanagin, M.C. Pixel-Level Crack Detection in Levee Systems: A Comparative Study. In Proceedings of the IGARSS 2022-2022 IEEE International Geoscience and Remote Sensing Symposium, Kuala Lumpur, Malaysia, 17–22 July 2022; IEEE: Piscataway, NJ, USA, 2022; pp. 3059–3062. [Google Scholar]
  30. Kuchi, A.; Hoque, M.T.; Abdelguerfi, M.; Flanagin, M.C. Machine learning applications in detecting sand boils from images. Array 2019, 3, 100012. [Google Scholar] [CrossRef]
  31. Panta, M.; Hoque, M.T.; Abdelguerfi, M.; Flanangin, M.C. IterLUNet: Deep Learning Architecture for Pixel-Wise Crack Detection in Levee Systems. IEEE Access 2023, 11, 12249–12262. [Google Scholar] [CrossRef]
  32. Alshawi, R.; Hoque, M.T.; Flanagin, M.C. A Depth-Wise Separable U-Net Architecture with Multiscale Filters to Detect Sinkholes. Remote Sens. 2023, 15, 1384. [Google Scholar] [CrossRef]
  33. Wu, Y.; He, K. Group normalization. In Proceedings of the European Conference on Computer Vision (ECCV), Munich, Germany, 8–14 September 2018; pp. 3–19. [Google Scholar]
  34. Dubey, A.K.; Jain, V. Comparative study of convolution neural network’s relu and leaky-relu activation functions. In Applications of Computing, Automation and Wireless Systems in Electrical Engineering: Proceedings of MARC 2018; Springer: Berlin/Heidelberg, Germany, 2019; pp. 873–880. [Google Scholar]
  35. Bahdanau, D.; Cho, K.; Bengio, Y. Neural machine translation by jointly learning to align and translate. arXiv 2014, arXiv:1409.0473. [Google Scholar]
  36. Hu, J.; Shen, L.; Sun, G. Squeeze-and-excitation networks. In Proceedings of the IEEE Conference on Computer Vision and Pattern Recognition, Salt Lake City, UT, USA, 18–23 June 2018; pp. 7132–7141. [Google Scholar]
  37. He, K.; Zhang, X.; Ren, S.; Sun, J. Identity mappings in deep residual networks. In Proceedings of the Computer Vision–ECCV 2016: 14th European Conference, Amsterdam, The Netherlands, 11–14 October 2016; Springer: Berlin/Heidelberg, Germany, 2016; pp. 630–645. [Google Scholar]
  38. Deng, J.; Dong, W.; Socher, R.; Li, L.J.; Li, K.; Fei-Fei, L. Imagenet: A large-scale hierarchical image database. In Proceedings of the 2009 IEEE Conference on Computer Vision and Pattern Recognition, Miami, FL, USA, 20–25 June 2009; IEEE: Piscataway, NJ, USA, 2009; pp. 248–255. [Google Scholar]
  39. Raghu, M.; Zhang, C.; Kleinberg, J.; Bengio, S. Transfusion: Understanding transfer learning for medical imaging. In Proceedings of the Advances in Neural Information Processing Systems 32 (NeurIPS 2019), Vancouver, BC, Canada, 8–14 December 2019; Volume 32. [Google Scholar]
  40. Panta, M.; Hoque, M.T.; Niles, K.N.; Tom, J.; Abdelguerfi, M.; Falanagin, M. Deep Learning Approach for Accurate Segmentation of Sand Boils in Levee Systems. IEEE Access 2023, 11, 126263–126282. [Google Scholar] [CrossRef]
  41. Li, H.; Chaudhari, P.; Yang, H.; Lam, M.; Ravichandran, A.; Bhotika, R.; Soatto, S. Rethinking the hyperparameters for fine-tuning. arXiv 2020, arXiv:2002.11770. [Google Scholar]
  42. Ioffe, S.; Szegedy, C. Batch normalization: Accelerating deep network training by reducing internal covariate shift. In Proceedings of the International Conference on Machine Learning, Lille, France, 6–11 July 2015; PMLR: Warrington, WA, USA, 2015; pp. 448–456. [Google Scholar]
  43. Buslaev, A.; Iglovikov, V.I.; Khvedchenya, E.; Parinov, A.; Druzhinin, M.; Kalinin, A.A. Albumentations: Fast and Flexible Image Augmentations. Information 2020, 11, 125. [Google Scholar] [CrossRef]
  44. Publicly Available Seepage Dataset. Available online: http://cs.uno.edu/~tamjid/Software/seepage_original_images.zip (accessed on 27 April 2024).
  45. Dutta, A.; Zisserman, A. The VIA annotation software for images, audio and video. In Proceedings of the 27th ACM International Conference on Multimedia, Nice, France, 21–25 October 2019; pp. 2276–2279. [Google Scholar]
  46. Fan, R.; Wang, H.; Bocus, M.J.; Liu, M. We learn better road pothole detection: From attention aggregation to adversarial domain adaptation. In Proceedings of the Computer Vision–ECCV 2020 Workshops, Glasgow, UK, 23–28 August 2020; Springer: Berlin/Heidelberg, Germany, 2020; pp. 285–300. [Google Scholar]
  47. Han, X.; Nguyen, C.; You, S.; Lu, J. Single image water hazard detection using fcn with reflection attention units. In Proceedings of the European Conference on Computer Vision (ECCV), Munich, Germany, 8–14 September 2018; pp. 105–120. [Google Scholar]
  48. Jadon, S. A survey of loss functions for semantic segmentation. In Proceedings of the 2020 IEEE Conference on Computational Intelligence in Bioinformatics and Computational Biology (CIBCB), Vina del Mar, Chile, 27–29 October 2020; IEEE: Piscataway, NJ, USA, 2020; pp. 1–7. [Google Scholar]
  49. He, K.; Zhang, X.; Ren, S.; Sun, J. Delving deep into rectifiers: Surpassing human-level performance on imagenet classification. In Proceedings of the IEEE International Conference on Computer Vision, Santiago, Chile, 7–13 December 2015; pp. 1026–1034. [Google Scholar]
  50. Kingma, D.P.; Ba, J. Adam: A method for stochastic optimization. arXiv 2014, arXiv:1412.6980. [Google Scholar]
Figure 1. Illustration of a cross-sectional view of a levee system’s crack, seepage, and sand boil. The high water level in the river forces water to infiltrate through (under seepage) a permeable sand aquifer, resulting in a sand boil on the surface as sand and water emerge from the porous region.
Remotesensing 16 02441 g001
Figure 2. Seepages formed in a levee system. Concrete surface background in (a), asphalt surface in (b), whereas there is a grassland and muddy area background in (c).
Remotesensing 16 02441 g002
Figure 3. Module I used in SeepageNet as a multi-scale filters-based proposed inception module with residual connection using group normalization to standardize the feature map and LeakyReLu activation to add non-linearity.
Remotesensing 16 02441 g003
Figure 4. Dual Pooling Spatial-Channel Attention (DPSCA) Module utilizes global max pooling and global average pooling operations to acquire channel-wise descriptors.
Remotesensing 16 02441 g004
Figure 5. Multi-scale Spatial Attention (MSSA) Module has multi-scale grid size to capture multi-scale relevant spatial details.
Remotesensing 16 02441 g005
Figure 6. Baseline architecture with layers from pretrained ResNet50v2 model as integrated feature extractor with simple convolutional block for skip connection.
Remotesensing 16 02441 g006
Figure 7. PCA as domain adaptation technique for controlled transfer learning in SeepageNet. PDIA module implements a channel-wise concatenation of the output of Spatial PCA projection with the output of Module III.
Remotesensing 16 02441 g007
Figure 8. Proposed SeepageNet architecture featuring an encoder–decoder design with skip connection.
Remotesensing 16 02441 g008
Figure 9. Examples from the seepage dataset. Each example (ad) includes three images: the original image, the ground truth, and the ground truth overlaid on the original image. Notably, seepages are seen in varying backgrounds including a muddy area in (a), asphalt surface in (b), and grassland in (c,d).
Remotesensing 16 02441 g009
Figure 10. Segmentation results on levee images. The red segmentation mask represents the overlay of the seepage region on the original image as ground truth, whereas yellow, purple, dark blue, white, and light blue are the predicted segmentation mask from M1 (U-Net), M2 (MultiResUnet), M3 (Attention U-Net), M4 (U-Net++), and M5 (SeepageNet), respectively, overlaid on the original image.
Remotesensing 16 02441 g010
Figure 11. The training workflow diagram.
Remotesensing 16 02441 g011
Figure 12. Segmentation results on levee images. The red segmentation mask represents the overlay of the seepage region on the original image as ground truth, whereas yellow, purple, dark blue, white, and light blue are the predicted segmentation mask from M1 (Baseline), M2 (SeepageNet-CBAM), M3 (SeepageNet-SE), M4 (SeepageNet-NoPCA), and M5 (SeepageNet-PCA), respectively, overlaid on the original image.
Remotesensing 16 02441 g012
Figure 13. Sample examples of segmentation results on negative images of levees without any issues. The yellow, purple, dark blue, white, and light blue are the predicted segmentation mask from Attention U-Net (M1), Baseline (M2), SeepageNet-CBAM (M3), SeepageNet-SE (M4), and SeepageNet (M5), respectively, overlaid on the original image. As these are negative cases, no ground truth seepage masks are shown.
Remotesensing 16 02441 g013
Figure 14. (a) represents example samples from levee images with animal burrowing. (b) represents example samples from levee images with cracks. Yellow, pink, dark blue, white, and light blue are the predicted segmentation masks by Attention U-Net (M1), Baseline (M2), SeepageNet-CBAM (M3), SeepageNet-SE (M4), and SeepageNet (M5), respectively, overlaid on the the original images.
Remotesensing 16 02441 g014
Table 1. Statistics of existing image segmentation models, baseline model, and proposed SeepageNet model. Here, trainable parameters (TPs), non-trainable parameters (NTPs), and model size (MS) in megabytes (MB) describe architectures.
ModelsTPsNTPsMS (MB)
U-Net7,760,097588891.29
MultiResUNet7,238,22824,52280.05
Attention U-Net8,903,0439728105.02
U-Net++7,238,22824,522107.99
Baseline2,431,6817,456,25658.14
SeepageNet-PCA1,302,3397,546,36846.02
SeepageNet-NOPCA1,175,3157,456,25647.92
Table 2. Metric results of models on the dataset. The best metric results are shown in bold. The model with the highest Intersection over Union (IoU) score should be indicated in both bold and underlined.
ModelsBA (%)IoU (%)DC (%)MaF1 (%)TPR (%)TNR (%)
U-Net79.146.259.965.765.892.5
MultiResUNet72.441.253.258.247.996.9
Attention U-Net78.550.563.068.061.495.5
U-Net++80.548.161.668.171.589.6
Baseline79.851.764.969.863.795.9
SeepageNet-PCA84.360.071.876.472.296.4
Table 3. Metric results of models on the dataset. The best metric results are shown in bold. The model with the highest Intersection over Union (IoU) score is both indicated in bold and underlined.
ModelsBA (%)IoU (%)DC (%)MaF1 (%)TPR (%)TNR (%)
Baseline79.851.764.969.863.795.9
SeepageNet-CBAM83.555.168.173.572.894.2
SeepageNet-SE83.458.470.475.070.396.4
SeepageNet-noPCA83.658.269.975.171.595.8
SeepageNet-PCA84.360.071.876.472.296.4
Disclaimer/Publisher’s Note: The statements, opinions and data contained in all publications are solely those of the individual author(s) and contributor(s) and not of MDPI and/or the editor(s). MDPI and/or the editor(s) disclaim responsibility for any injury to people or property resulting from any ideas, methods, instructions or products referred to in the content.