Technical Note

Tropical Cyclone Impact and Forest Resilience in the Southwestern Pacific

1
ENTROPIE, IRD, University of New Caledonia, University of La Reunion, CNRS, Ifremer, Labex Corail, 98800 Noumea, New Caledonia, France
2
ESPACE-DEV (UMR 228), University of New Caledonia, University of Montpellier, IRD, University of Antilles, University of French Guyana, University of La Réunion, 98800 Noumea, New Caledonia, France
3
AMAP, University of Montpellier, CIRAD, CNRS, INRAE, IRD, 34398 Montpellier, France
*
Author to whom correspondence should be addressed.
Remote Sens. 2022, 14(5), 1245; https://doi.org/10.3390/rs14051245
Submission received: 24 January 2022 / Revised: 23 February 2022 / Accepted: 25 February 2022 / Published: 3 March 2022
(This article belongs to the Topic Natural Hazards and Disaster Risks Reduction)

Abstract

:
Tropical cyclones (TCs) can have profound effects on the dynamics of forest vegetation that need to be better understood. Here, we analysed changes in forest vegetation induced by TCs using the normalized difference vegetation index (NDVI). We used an accurate historical database of TC tracks and intensities, together with the Willoughby cyclone model to reconstruct the 2D surface wind speed structure of TCs and analyse how TCs affect forest vegetation. We used segmented linear models to identify significant breakpoints in the relationship between the reconstructed maximum sustained wind speed (Wmax) and the observed changes in NDVI. We tested the hypothesis that the rate of change in damage caused by TCs to forest and recovery time would increase according to Wmax thresholds as defined in the widely used Saffir–Simpson hurricane wind scale (SSHWS). We showed that the most significant breakpoint was located at 50 m/s. This breakpoint corresponds to the transition between categories 2 and 3 TCs in the SSHWS. Below this breakpoint, damages caused to forest vegetation and the time needed to recover from these damages were negligable. We found a second breakpoint, with a sharp increase in damages for winds >75 m/s. This suggested that extremely intense tropical cyclones, which might be more frequent in the future, can cause extreme damages to forest vegetation. Nevertheless, we found high variation in the observed damages and time needed to recover for a given Wmax. Further studies are needed to integrate other factors that might affect the exposure and resistance to TCs as well as forests’ capacity to recover from these disturbances.

1. Introduction

Tropical cyclones (TCs), also referred to as hurricanes in the North Atlantic and Northeast Pacific and typhoons in the Northwest Pacific, generate high speed winds and heavy rainfalls over large areas. Immediate impacts of TCs on forests can be particularly devastating with damages ranging from defoliation to extensive trunk snapping or tree uprooting. Most studies focused on the local- or landscape–scale damages caused by a single TC (e.g., [1,2,3,4,5,6,7,8,9]). Analyses of the impacts of multiple TCs on larger regional or global scales are needed to better understand how forests respond to these large–scale disturbances in the context of changing TCs intensity [10].
Increasingly available and accurate remote–sensed vegetation index time series and TC trajectories and characteristics databases now allow to analyse the impacts of TCs on forests and their recovery at large spatio–temporal scales (e.g., [11,12,13]). Maximum sustained wind speed (Wmax) appears to be a key parameter to predict changes in vegetation indices. Yet, the direct relationship between local Wmax and the observed vegetation indices dynamics has, to our knowledge, not been explored. We suggest that this could be tackled using simple cyclone models that allow reconstructing the 2D wind speed structure (e.g., [14]) from TC characteristics available in TC databases.
The Saffir–Simpson Hurricane Wind Scale (SSHWS, [15]) is one of the most commonly used TC classifications. It uses Wmax to anticipate the potential damages caused by TCs. SSHWS ranges from category 1 TCs (Wmax between 33 and 42 m/s) which are predicted to mostly damage foliage, to category 5 TCs (Wmax ≥ 70 m/s) which are predicted to cause extensive snapping or uprooting of shrubs and trees (Table 1). On top of that classification, category 3 or higher TCs (Wmax ≥ 50 m/s) are considered as major TCs that can cause devastating to catastrophic damages (https://www.nhc.noaa.gov/aboutsshws.php, accessed on 22 February 2022). Yet, to our knowledge, the potential damages anticipated by the SSHWS have not been confronted concerning actual damages on a regional scale and on multiple storms over a long time period.
Here, we used high–resolution historical database of TC tracks and intensities (IBTrACS, [16]), together with the Willoughby cyclone model [17] to reconstruct the 2D surface wind speed structure of TCs to analyse how TCs affect forest vegetation. Our analyses cover six archipelagos of the south–west Pacific region over the 2000–2020 period. Our understanding of the impacts of TCs on forests in the islands of this region is relatively poor as most studies in this region have been conduced in Australia and on a global scale most studies have focused on the most intense cyclones in the North Atlantic Basin and to a lesser extent in the North West Pacific Basin [18]. We expect that damage caused by TCs to forests and the time needed to recover from these damages would increase with increasing Wmax. We test the hypothesis that the rate of change in damage caused by TCs to forests and the recovery time would increase according to Wmax thresholds as defined in the SSHWS. More particularly, we expect that winds generated by major, category 3 or higher, TCs would result in particularly intense damages.

2. Materials and Methods
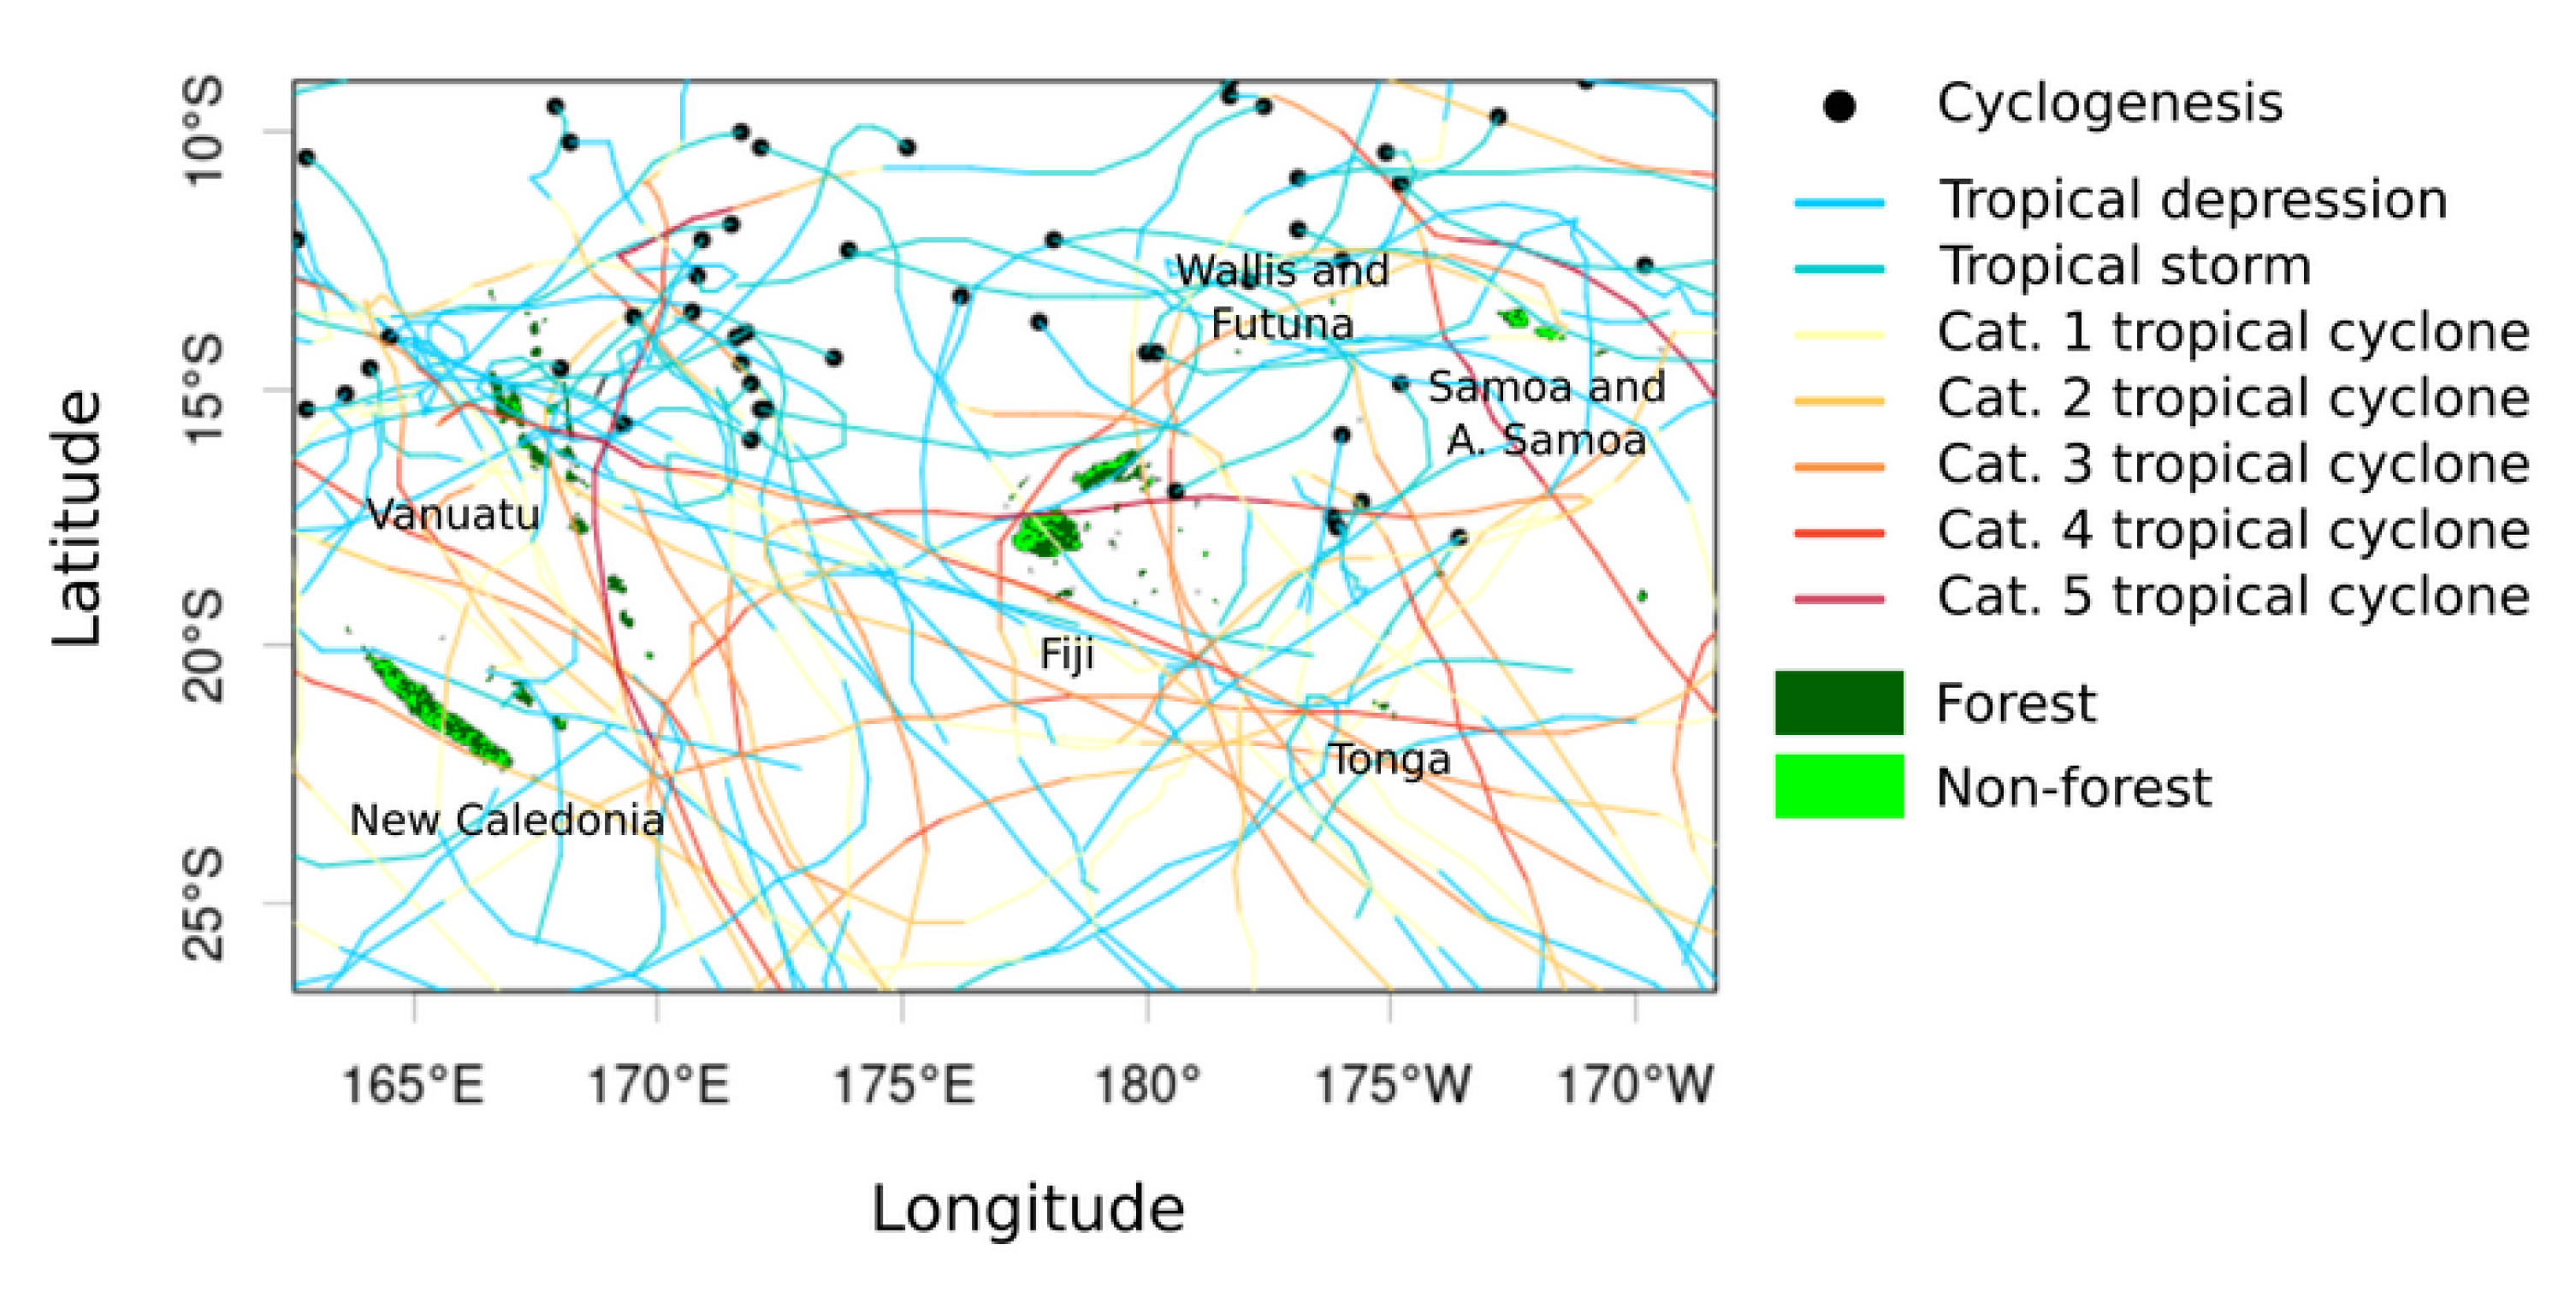
2.1. Study Area

The study area encompasses 76 islands in six archipelagos (New Caledonia, Vanuatu, Fiji, Samoa, Tonga, Wallis and Futuna) located in the South West Pacific basin in longitude 152.3° E–162.5° W and latitude 10.0° S–30.0° S. Small islands, i.e., those less than 5 km long and/or wide were omitted. In this region, TCs mostly occur between November and May during austral summer [19]. On average, 6–8 tropical storms occur in the South West Pacific Basin between November and May with a peak of activity in February–March [20]. There are 2 to 5 tropical storms per decade on land for the considered islands with maximum cyclone densities west of Vanuatu and north of New Caledonia extending into the Coral Sea, between 10° S and 25° S fading off toward Samoa [21].

2.2. Forest Vegetation

Changes in forest vegetation induced by TCs were analysed using the Normalized Difference Vegetation Index (NDVI), one of the most widely used satellite–based vegetation indices [22]. Chlorophyll pigments contained in leaves are responsible for photosynthesis and absorb red light (RED), whereas healthy leaf tissues reflect strongly in the near infrared region (NIR) of the light spectrum. The NDVI is computed as the normalized ratio between RED and NIR reflected by the vegetation and captured by the sensor of the satellite (Equation (1)). The NDVI ranges from −1 to 1 and is positively correlated with the density and health of the vegetation (i.e., the higher the NDVI, the denser or healthier the vegetation) with negative NDVI values corresponding to water areas.
N D V I = ρ ( N I R ) ρ ( R e d ) ρ ( N I R ) + ρ ( R e d ) [ 1 : 1 ]
We used the NDVI from the MOD13Q1 products supplied by the MODIS (Moderate Resolution Imaging Spectroradiometer) sensor that was launched by NASA onboard the Terra satellite in 1999. The MOD13Q1 products have provided NDVI values every 16 days since February 2000 at a 250 m pixel spatial resolution. We extracted NDVI of forested areas using the “tree cover, broadleaved, evergreen, closed to open (>15%)” vegetation class from the global land cover map produced by the European Spatial Agency (https://www.esa.int/Applications/Observing_the_Earth/Space_for_our_climate/ESA_global_land_cover_map_available_online, accessed on 22 February 2022) and resampled at 250 m to match the NDVI resolution. Prior to the analyses, all pixels covered by clouds or water were removed using the pixel reliability files provided by MOD13Q1.

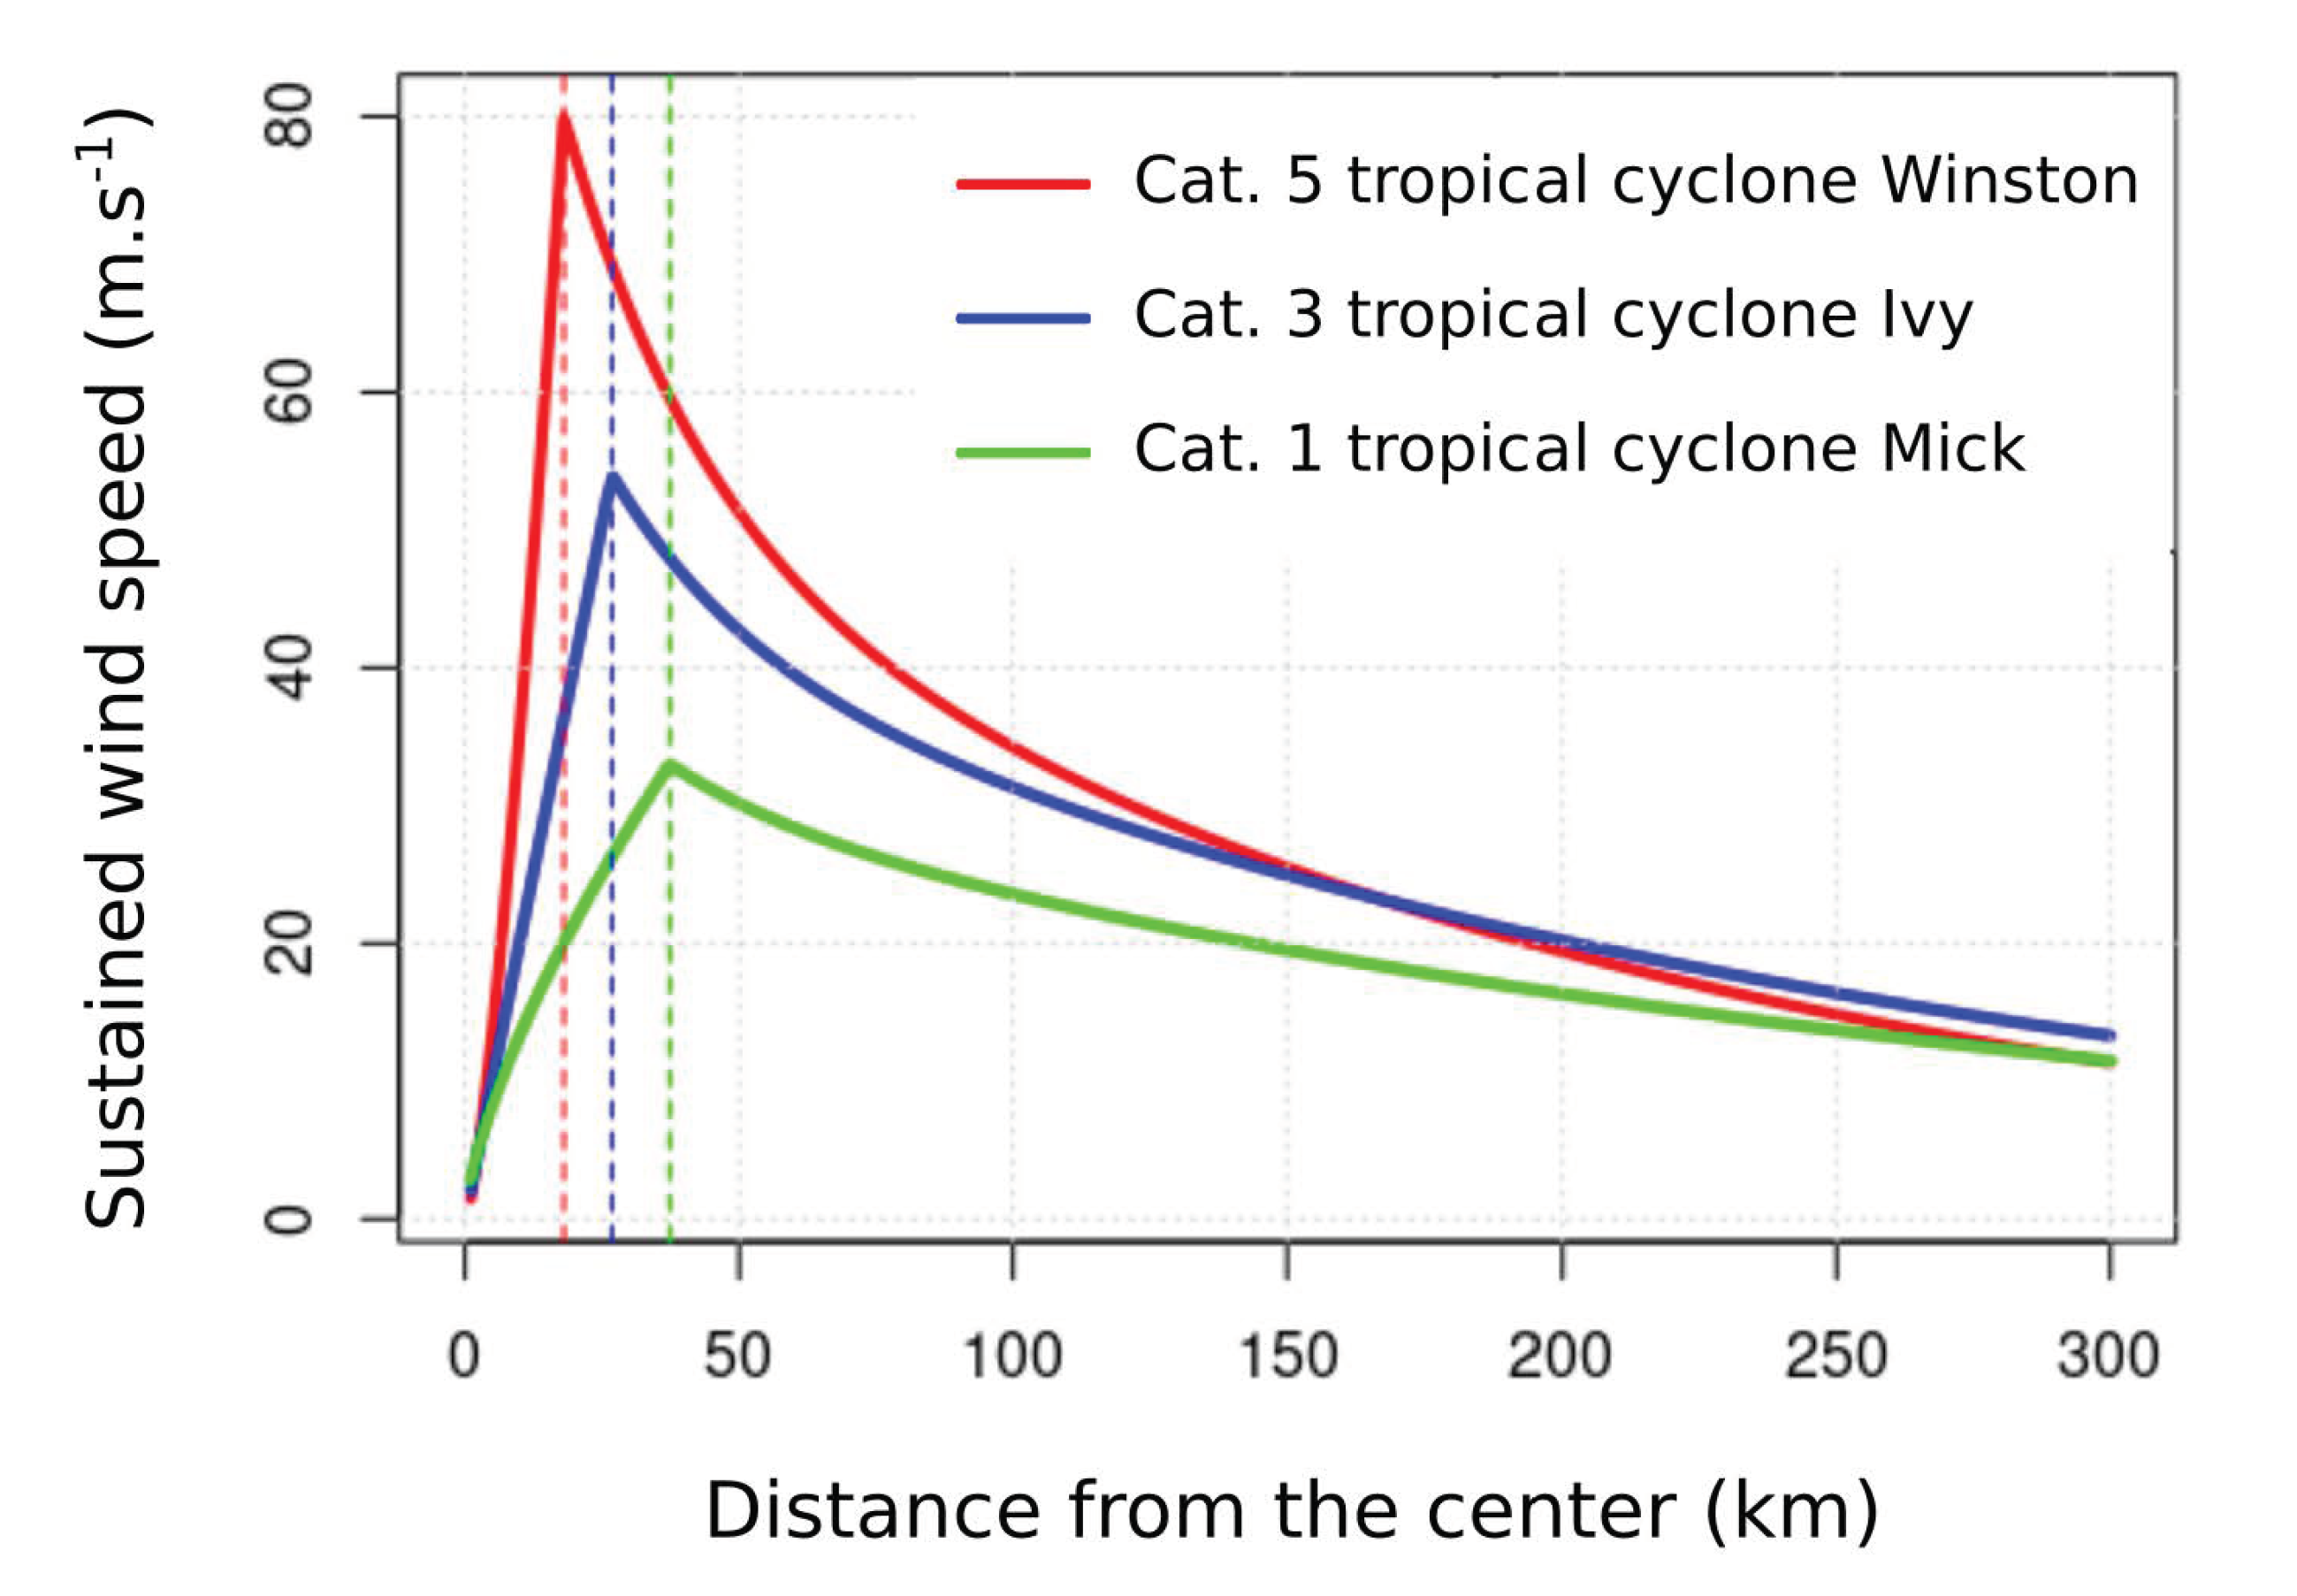
2.3. Tropical Cyclones
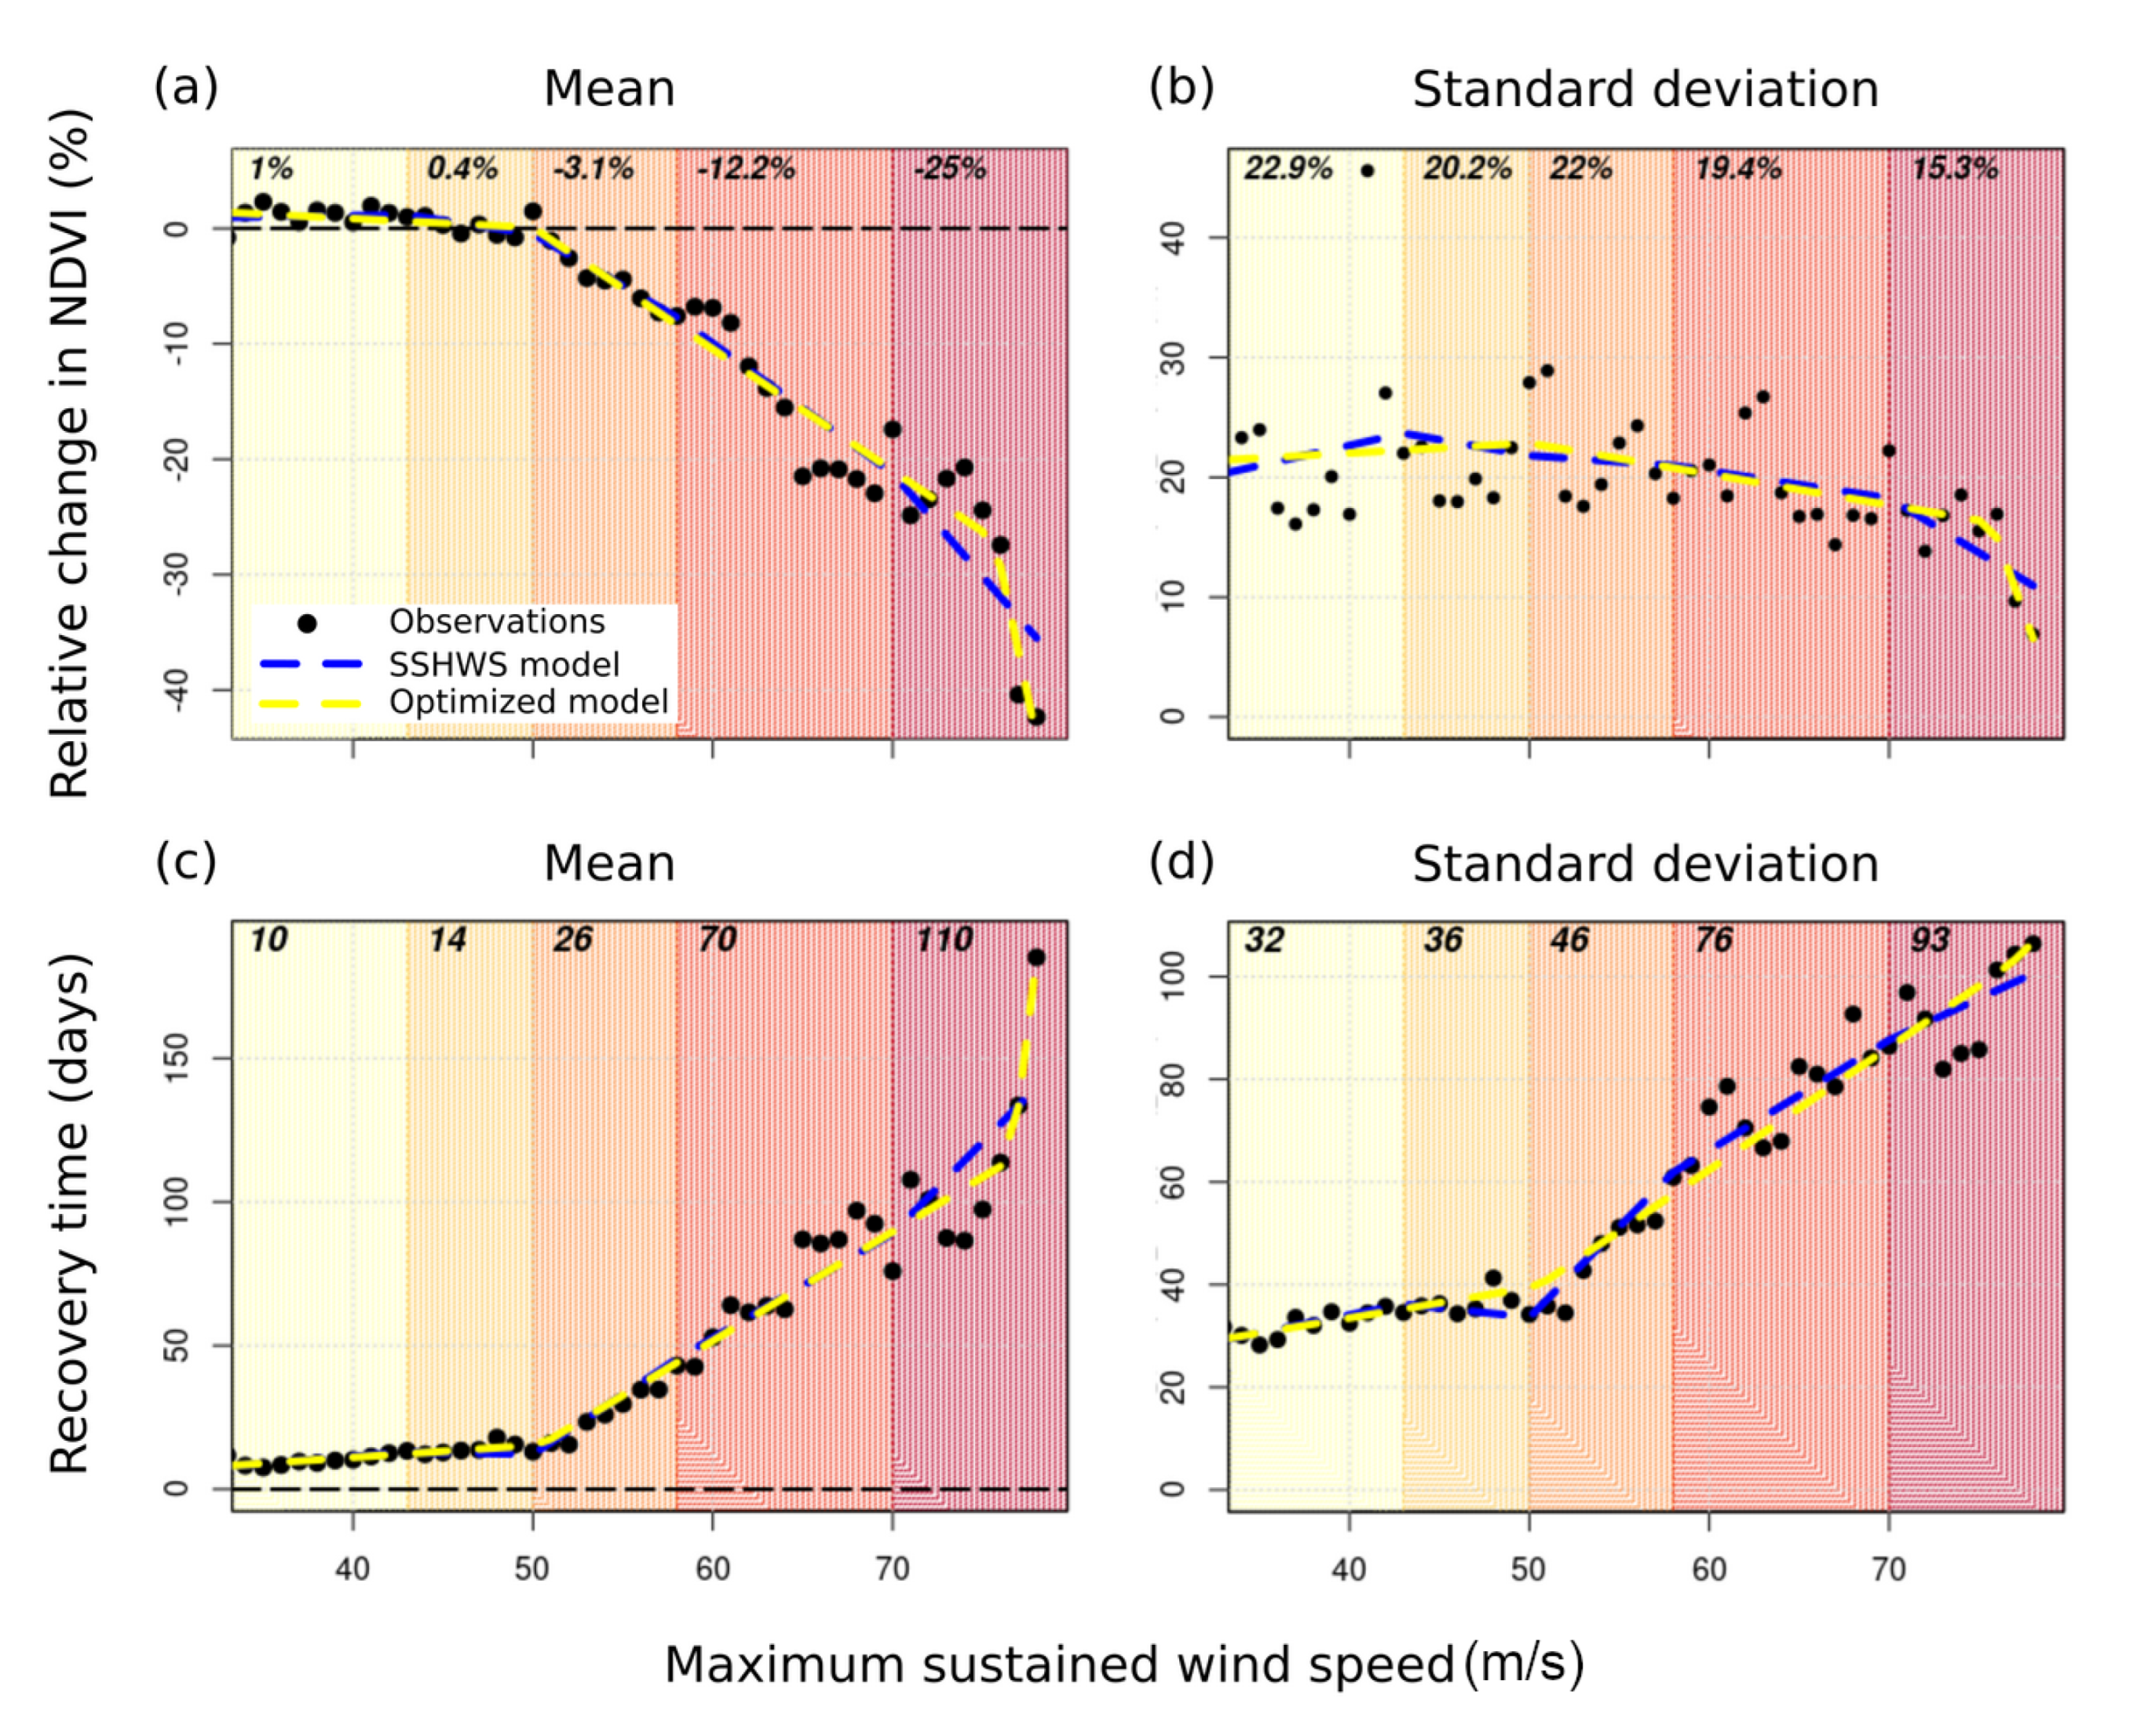
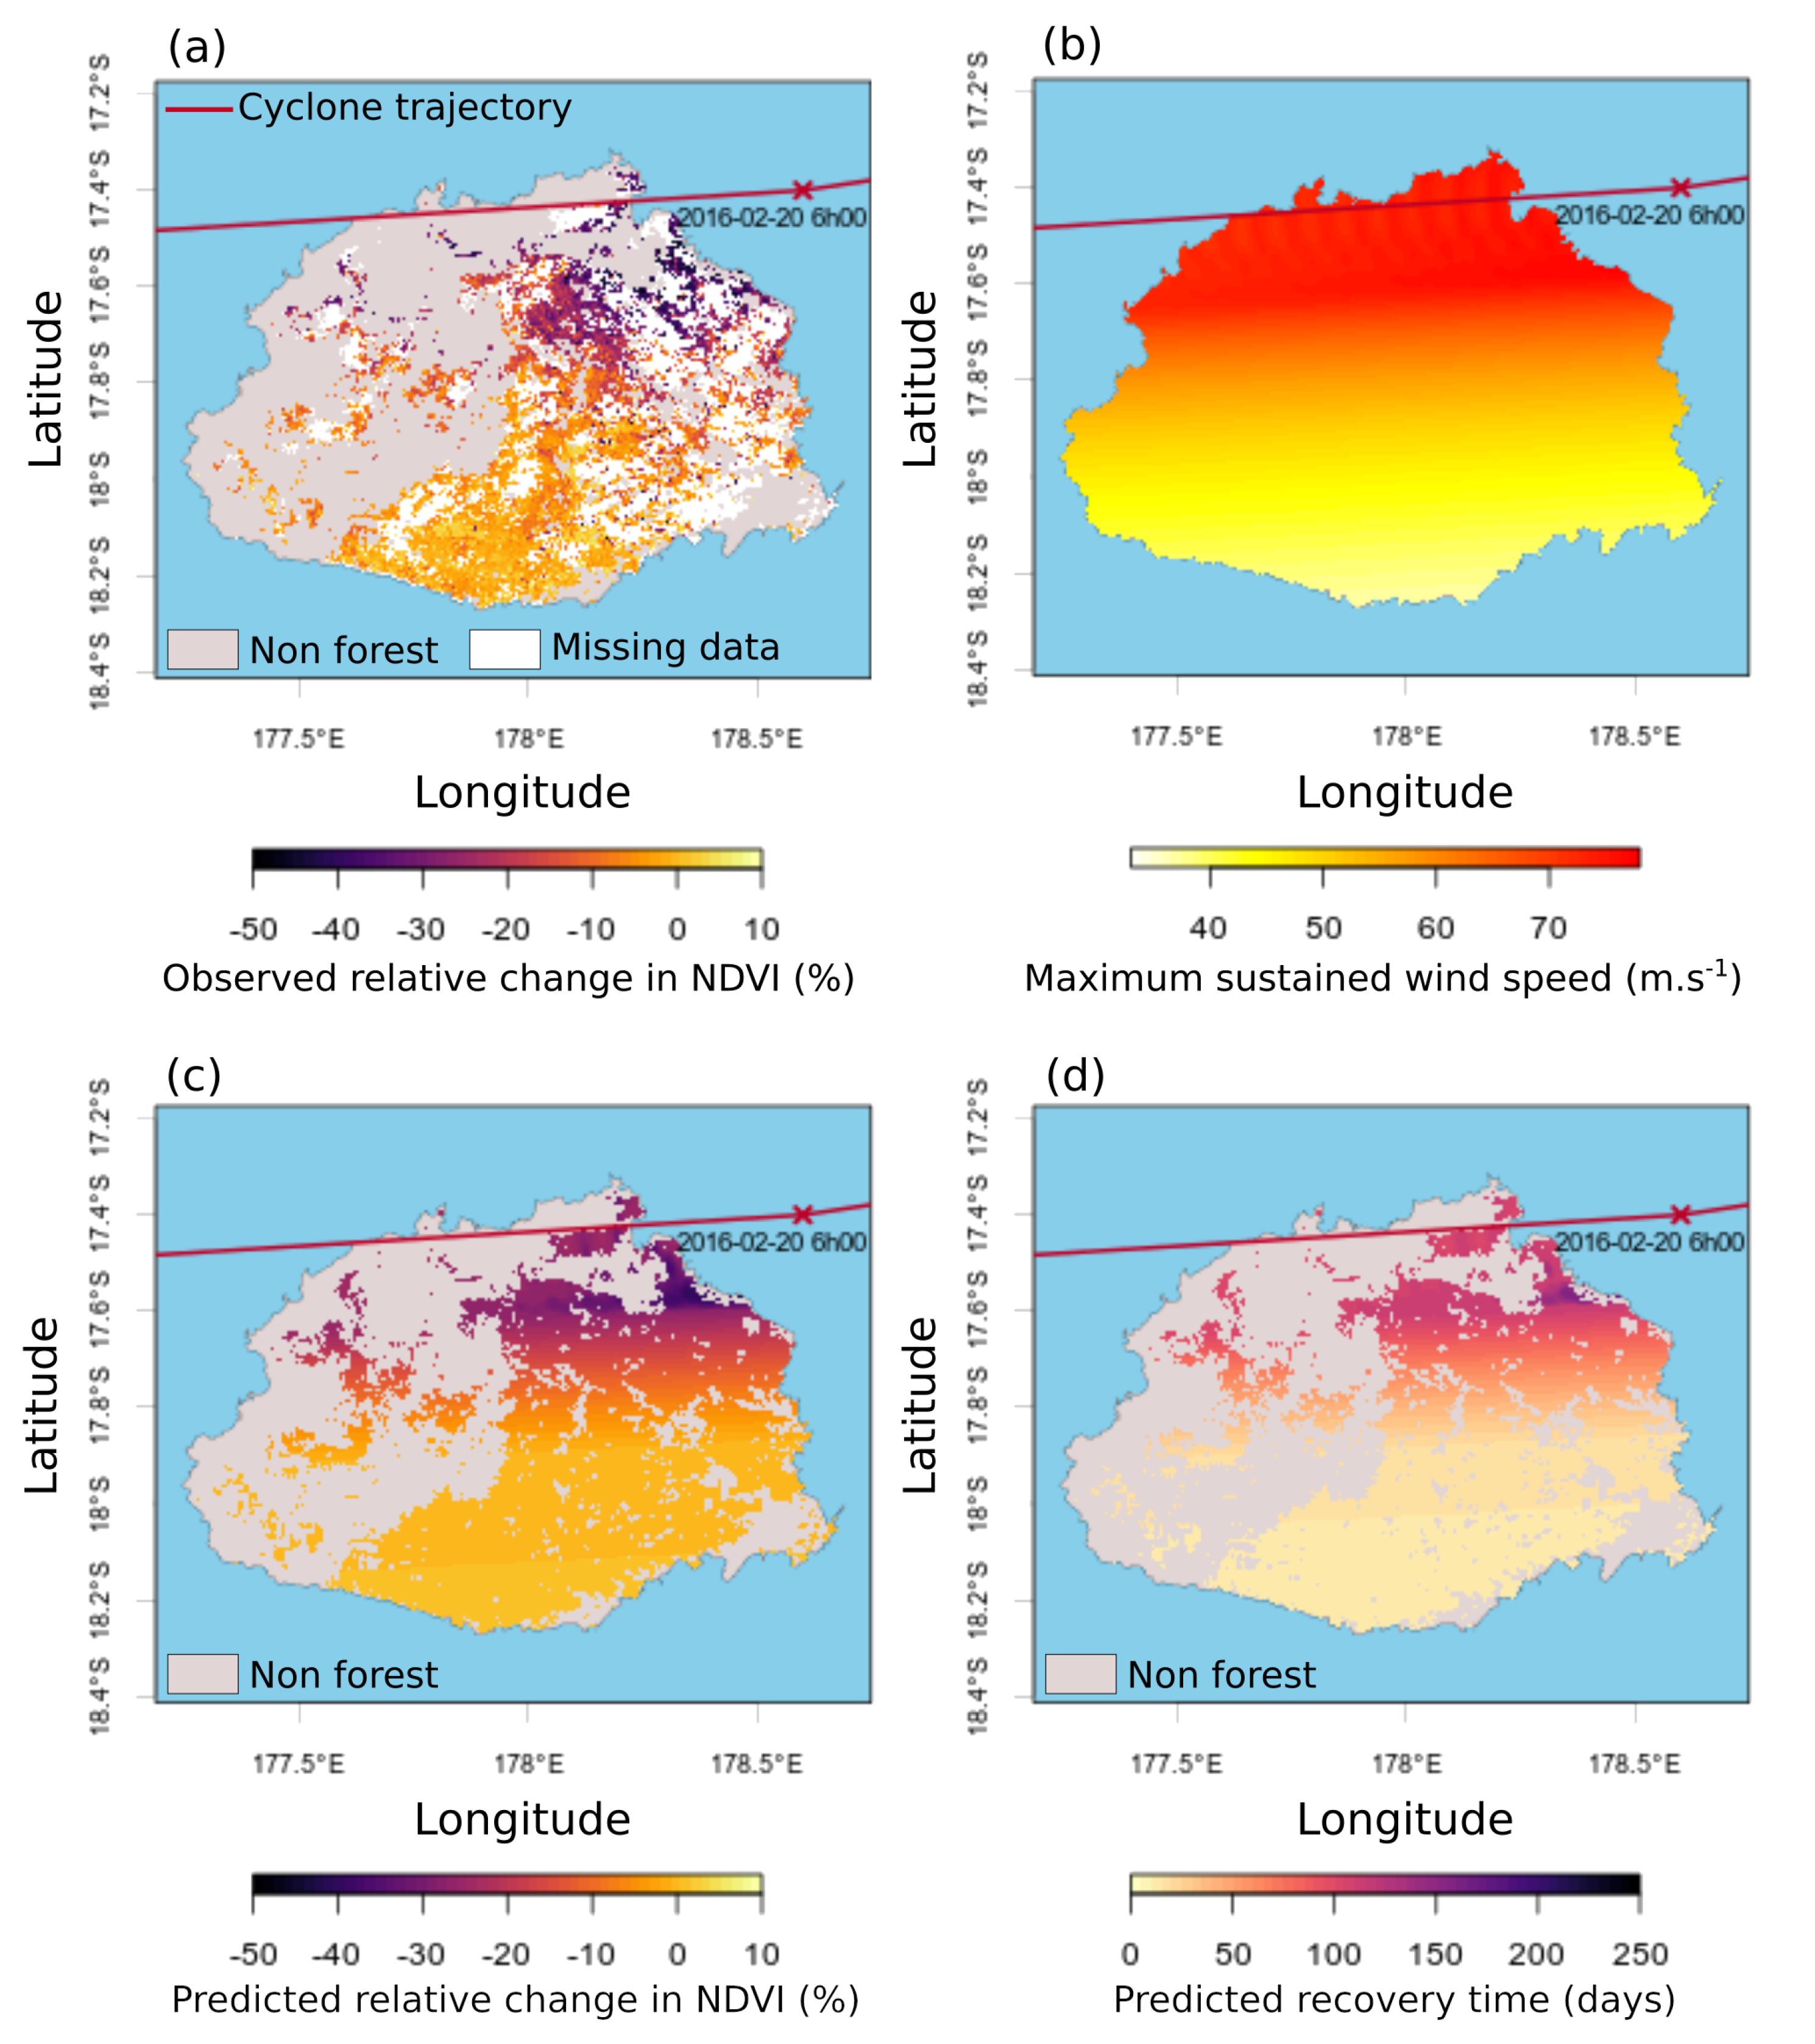
We used the Saffir–Simpson hurricane wind scale (SSHWS, Table 1, [15]) to classify TC intensities. TC trajectories and characteristics were extracted from the IBTrACS database ([16], https://www.ncdc.noaa.gov/ibtracs/, accessed on 22 February 2022). This database provides the positions of each TC center and their maximum 10 min–sustained wind speed (Wmax) every 6 h. We only considered cyclones reaching category 1 or higher (Wmax ≥ 33 m/s). A total of 74 TCs with Wmax ≥ 33 m/s crossed the studied area between 2000 and 2020 (Figure 1).
Following Vincent et al. [23], we then used the Willoughby cyclone model [17] to reconstruct the 2D idealized surface wind speed structure generated by each TC over the 20 year period studied (2000–2020). The Willoughby model (Equation (2)) allows to reconstruct at a given time (t) the 2D surface wind speed structure of a TC based on both the latitude of its center ( Φ ) and the maximum sustained wind speed (Wmax) as provided by the IBTrACS database.
( a ) R M W = 46.4 e 0.0155 W m a x + 0.0169 | ϕ | ( b ) n n = 2.1340 + 0.0077 W m a x 0.4522 l n ( R M W ) 0.0038 | ϕ | ( c ) X X 1 = 287.6 1.942 W m a x + 7.799 l n ( R M W ) 1.819 | ϕ | ( d ) X X 2 = 25 ( e ) A A = 0.5913 + 0.0029 W m a x 0.1361 l n ( R M W ) 0.0042 | ϕ | ( f ) W r = W m a x | ( r R M W ) n n | i f r R M W ( g ) W r = W m a x ( ( 1 A A ) e | r R M W X X 1 | + A A e | r R M W X X 2 | ) i f r R M W
In Equation (2) RMW is the radius of maximum wind (i.e., the distance r from the center where wind speed reaches Wmax), Wr is the radial wind speed generated at distance r from the center of the TC.
The Willoughby model generates an exponential increase in wind speed from the center of the TC (the “eye”) to the RMW where winds reach their maximum speed (Wmax, Figure 2). Beyond RMW, wind speed decreases exponentially as a function of Wmax and Φ . According to this model, the most powerful TC over the studied area and study period (i.e., the category 5 TC Winston in 2016) generated winds ≥ 17 m/s up to 250 km off the TC center. Because TCs can move fast, we performed a linear interpolation of the original six–hour Φ and Wmax provided by the IBTrACS database to reconstruct the 2D surface wind speed structure of each TC every 15 min at a 250 m spatial resolution. Finally, we computed for each TC the maximum speed of winds that affected each pixel.

2.4. Analysis

We analysed the damages caused by TCs to forest vegetation and the recovery time from these damages. For each forest pixel exposed to wind generated by a category 1 or greater TC, we computed the damage caused by the cyclone passages as the relative changes in NDVI:
Δ N D V I t i = [ ( N D V I t i N D V I t 0 ) / N D V I t 0 ] × 100
where N D V I t 0 is the NDVI value measured just before the passage of the TC at t 0 , N D V I t i is the NDVI value measured at t i just after the passage of the TC with i starting at the first NDVI acquisition date after the passage of the TC and then every 16 days over the following year.
Recovery times from these damages were estimated as TR, the time t i needed to recover at least 95% of the pre–cyclone NDVI value ( N D V I t 0 ). Many Δ N D V I t i values were missing because of the lack of acquisition or because of the presence of clouds. We filled in missing values using the linear interpolation function na.approx from the zoo R package.
We then used two types of model to predict damages ( Δ N D V I t 1 ) and recovery time (TR) as a function of the maximum sustained wind speed ( W m a x ): (i) Segmented linear models with fixed W m a x breakpoints corresponding to the boundaries of the categories of the Saffir–Simpson hurricane wind scale (hereafter, SSHWS model), and (ii) segmented linear models with free number and location of W m a x breakpoints (hereafter, optimized model). For the optimized models, we tested different numbers of breakpoints ranging from 1 to 5 breakpoints and then kept the models that minimized the Bayesian information criterion (BIC), i.e., the models that exhibited the best compromise between the number of parameters and likelihood. Segmented linear models were adjusted using the segmented function of the segmented R package [24] and BIC values were computed using the BIC function available in the R base package. We tested the significance of the presence of breakpoints (i.e., the presence of a non-constant regression parameter in the linear predictor) using the davies.test function [24].
Reconstructed W m a x and observed Δ N D V I t 1 are available online (http://preditropic.ird.nc, accessed on 22 February 2022). Moreover, it let the user forecast the Δ N D V I t 1 following a simulated TC based on the optimized model.

3. Results

According to the 2D reconstruction of the wind speed structure of TCs, almost all forest pixels (95.6%) located in the studied area were exposed at least once to maximum sustained wind speed ≥ 33 m/s over the last 20 years (Table 2). A third of these forest pixels (33.1%) were exposed at least three times to such wind speeds (Table 2). Most intense TCs are relatively infrequent. Only 29 TCs reached categories 4 or 5 and less than a quarter (21.3%) of the forest pixels were exposed at least once to maximum sustained wind speed ≥ 58 m/s (category 4). This proportion fell down to 5% when we only considered category 5 cyclone winds (i.e., ≥70 m/s, Table 2).
For both damages and recovery time, optimized segmented linear models (for which the number and position of breakpoints were optimized) performed much better than SSHWS segmented linear models (for which the number and position of breakpoints were fixed following the SSHWS), with Δ BIC = −28.35 and −44.33, respectively (Table 3 and Table 4). In both cases the optimized models identified two significant breakpoints. The first breakpoints, located at 50.00 m/s for damages as swhown in Figure 3a and 50.48 m/s for recovery time as shown in Figure 3c, corresponded to the transition between category 2 and 3 TCs. Below 50.00 m/s observed damages were negligible (≲1% decrease in NDVI on average) and the corresponding recovery time was less than two weeks.
For Wmax greater than 50 m/s, observed damages to forest vegetation started to increase with an average at ∼1% of NDVI loss for each 1 m/s increase in Wmax (Figure 3a). This increase in damages resulted in a sharper increase in recovery time with an average rate of almost four days per 1 m/s increase in Wmax (Figure 3c). Another breakpoint was identified within the category 5 TC category at 75 m/s (75.70 m/s for damages and 76.64 m/s for recovery time). Above this breakpoint, damages and recovery times sharply increased. On average >40% decrease in NDVI and >150 days of recovery time were observed for the strongest winds (78 m/s).
We observed high deviations around these trends. Standard deviation for the observed damages was about 20% and tended to slightly decrease with increasing wind speed (Figure 3b). Standard deviation in recovery time was about 30–35 days below 50.00 m/s, but then sharply increased reaching on average ∼90 days for category 5 TCs (Figure 3d). Furthermore, over 20% of the studied pixels did not recover after one year.
One important outcome of our modelling is the production of spatial maps of damage and recovery time. An example is illustrated in Figure 4 which shows the observed and best-modelled (optimized model) damages and recovery caused by the category 5 TC Winston (2016) on Viti Levu (Fiji).

4. Discussion

Our results partly support the use of the Saffir–Simpson hurricane wind scale (SSHWS) to anticipate the damages caused by TCs to forest vegetation. Simpson [15] suggested that winds < 50 m/s mostly resulted in minor defoliation and we indeed found that such winds resulted in negligible damages to forest vegetation (≲1% decrease in NDVI). Our modelling showed that the most significant breakpoint was located at 50 m/s. This breakpoint corresponded to the transition between category 2 and 3 TCs identified by Simpson [15] above which trees start to experience major damages including extensive defoliation, branch breaking, tree uprooting, and bole snapping. This is in agreement with field observation in the south-west Pacific. For instance, forest plots located on Tutuila (American Samoa) and exposed to winds of 12–14 m/s generated by TC Heta (2003–2004) exhibited < 5% uprooting or bole snapping for trees larger than 10 cm [25]. Forest plots located on a neighboring island (Ta’u) exposed to reconstructed wind of 60–62 m/s from the TC Olaf (2005) exhibited from 20% to almost 100% uprooting or bole snapping for trees larger than 10 cm depending on the species [5]. Intermediate damages were observed on the island of Vava’u (Tonga) with about 20% uprooting or bole snapping for trees larger than 10 cm in forest plots affected by reconstructed wind of 51 m/s from TC Waka (2001) [26].
Model optimization highlighted another significant breakpoint located around 75 m.s, i.e., within the highest category of the SSHWS (that begins at 70 m/s for category 5). When this breakpoint was reached, sharp increases in both the damages caused by TCs and the recovery time were observed. These high intensity winds (>75 m/s) resulted on average in a reduction in NDVI greater than 40%. While this breakpoint relies only on a few points, it feeds the debate about updating TC intensity scales to better fit increasing TC intensity (e.g., [27,28]). Indeed, such extremely intense TCs occurred during the last decade and may reflect the possible intensification of these disturbances under human–induced global warming (e.g., [10,29]). For instance, after typhoon Haiyan (2013), one of the most intense TCs ever recorded worldwide, severely impacted the Philippines, Lin et al. [30] suggested creating a new category 6 for TCs generating winds ≥ 80 m/s. However, based on the most recent analyses [10], it is not clear that increased TC intensities have indeed occurred during the past 40 years (1979–2017) in the Western Pacific. On the same line, while Winston (2016) generated sustained wind speed > 80 m/s in the South Pacific, i.e, one of the strongest winds on record in the South Pacific, it remains to be explored whether such intensity records may increase in the future under global warming.
Reconstructed maximum wind speed was a good predictor of observed mean damages caused by TCs and mean recovery time. However, we observed large variations around mean trends. These large variations may be partly explained by the topography of the studied mountainous islands. Indeed, wind exposure varies greatly with topographical position, which result in very patchy damages in topographically complex areas [3,8,31]. The TC regime could also play a role in the effects of these disturbances on forests. Forests that have been historically exposed to frequent intense TCs are likely to be acclimated or adapted to these disturbances and thus could be more resistant to TCs than forests that have been historically rarely exposed to these disturbances [13]. Different levels of resistance of different forest types also probably explain the large variation in observed damages for a given maximum sustained wind speed. For instance, for a given wind speed, damages are expected to be lower in dry forests than in wet forests because dry forests are shorter [32] and composed of species that have on average harder wood than in wet forests [33]. Indeed, shorter tree height and higher wood density can provide higher mechanical resistance to wind and are often associated with less important cyclone–induced damages [5,18,34]. Finally, large variation in the observed damages for a given maximum sustained wind speed could be explained by different TC translation speeds with slower TCs (longer residence time) which should be more destructive than faster ones [35].
Variation in recovery time substantially increased with maximum sustained damage, especially after category 3–5 TCs. Below category 3 cyclones, damages mostly consisted in defoliation and recovery in production of new leaves. However, category 3 and more cyclones caused greater damages such as branch breaking, uprooting, and bole snapping. Several processes allowed recovery from these damages, including growth of surviving trees, growth of new trees from seed or sapling banks, and growth of new trees from new colonization events. Resprouting of surviving trees, i.e., the production of new vegetative growth from above or below ground dormant buds, is often observed after disturbances by TCs [36,37,38]. Resprouting capacity probably varies depending on habitat type and species composition. For instance, dry forest species might be better resprouters than wet forest species [39]. The rapidity of the establishment of new trees should be affected by the amount of forest and its spatial configuration. For the same level of damages, we expect that recovery time would be shorter in more forested and less fragmented landscapes compared to less forested and more fragmented ones. However, we cannot know whether the recovery in NDVI was due to the growth of trees or other growth forms. Likewise, we cannot know whether the recovery in NDVI was due to the growth of native species or to the establishment of non–native, potentially invasive, species. Invasion by non–native plant species following disturbance by TCs [40] which can slow down or block forest recovery is also more likely in more fragmented areas [41].

5. Conclusions

We found that damages caused to forest vegetation by TCs based on NDVI changes were negligible for winds <50 m/s, i.e., for category 1–2 TCs (SSHWS). This is consistent with recent conclusions reached by Peereman et al. [13] on global mangroves. Above this breakpoint, reduction in NDVI increased linearly with increasing wind speed which likely resulted from increasing major damages to vegetation, including branch breaking, tree uprooting, and bole snapping. A second breakpoint, with a sharp increase in damages for winds > 75 m/s suggested that extremely intense TCs can cause extreme damages to forest vegetation. While reconstructed maximum sustained wind speed was a good predictor of damages and recovery time, we observed large variations in the resistance and recovery of vegetation for a given wind speed. We hypothesize that these variations can be further explored by integrating other spatial factors such as topographical exposure, forest types, TC regime, and landscape structure as well as more detailed surface wind structures that are not represented in analytical models. Such enhanced wind structures may come from the recent advances on very intense wind retrievals from satellite imagery [42]. Whether the frequency of intense TCs will increase compared to weaker cyclones under climate change needs further investigations, especially in the South Pacific [10] and will require further advances in climate cyclone modelling in the future scenario [43]. Finally, we found that >20% of the studied forest pixels did not fully recover their pre–cyclone NDVI values after one year. Further studies are needed to assess whether or not these areas can recover to a forest state in a longer time period or whether they may shift toward non–forest states.

Author Contributions

Writing—original draft preparation, B.D.; writing—review and editing, T.I., C.M., M.D. and M.M.; supervision, C.M., M.M., M.D. and T.I.; project administration, M.D. and C.M.; funding acquisition, M.D.; Conceptualization, B.D., C.M., M.D. and M.M.; methodology, B.D., M.M., C.M., T.I. and M.D.; software, B.D.; validation, T.I. and C.M.; formal analysis, C.M., T.I. and M.M.; resources, T.I.; data curation, M.D. All authors have read and agreed to the published version of the manuscript.

Funding

That work was funded by the French Pacific Funds and T.I. was partly supported by Hermon Slade fundation (HSF 19105).

Conflicts of Interest

The authors declare no conflict of interest.

Abbreviations

The following abbreviations are used in this manuscript:
ESAEuropean Space Agency
IBTrACSInternational Best Track Archive for Climate Stewardship
NASANational Aeronautics and Space Administration
NDVINormalized Difference Vegetation Index
NIRNear Infrared Region
MOD13Q1MODIS vegetation index product (NDVI and EVI)
RMWRadius of Maximum Wind
SSHWSSaffir–Simpson Hurricane Wind Scale
TCTropical Cyclone

References

  1. Lugo, A.E.; Applefield, M.; Douglas, J.P.; Macdonald, R.B. The impact of Hurricane David on the forests of Dominica. Can. J. For. Res. Can. Rech. For. 1983, 13, 201–211. [Google Scholar] [CrossRef]
  2. Basnet, K.; Likens, G.E.; Scatena, F.N.; Lugo, A.E. Hurricane Hugo: Damage to a Tropical Rain Forest in Puerto Rico. J. Trop. Ecol. 1992, 8, 47–55. [Google Scholar] [CrossRef] [Green Version]
  3. Boose, E.R.; Foster, D.R.; Fluet, M. Hurricane Impacts to Tropical and Temperate Forest Landscapes. Ecol. Monogr. 1994, 64, 369–400. [Google Scholar] [CrossRef]
  4. Metcalfe, D.J.; Bradford, M.G.; Ford, A.J. Cyclone damage to tropical rain forests: Species- and community-level impacts. Austral Ecol. 2008, 33, 432–441. [Google Scholar] [CrossRef]
  5. Webb, E.L.; van de Bult, M.; Fa’aumu, S.; Webb, R.C.; Tualaulelei, A.; Carrasco, L.R. Factors Affecting Tropical Tree Damage and Survival after Catastrophic Wind Disturbance. Biotropica 2014, 46, 32–41. [Google Scholar] [CrossRef]
  6. Ni, Y.; Wang, T.; Cao, H.; Li, Y.; Bin, Y.; Zhang, R.; Wang, Y.; Lian, J.; Ye, W. An old-growth subtropical evergreen broadleaved forest suffered more damage from Typhoon Mangkhut than an adjacent secondary forest. For. Ecol. Manag. 2021, 496, 119433. [Google Scholar] [CrossRef]
  7. Peereman, J.; Hogan, J.A.; Lin, T.-C. Assessing typhoon-induced canopy damage using vegetation indices in the Fushan Experimental Forest, Taiwan. Remote Sens. 2020, 12, 1654. [Google Scholar] [CrossRef]
  8. Turton, S.M. Landscape-scale impacts of Cyclone Larry on the forests of northeast Australia, including comparisons with previous cyclones impacting the region between 1858 and 2006. Austral Ecol. 2008, 33, 409–416. [Google Scholar] [CrossRef]
  9. Rutledge, B.T.; Cannon, J.B.; McIntyre, R.K.; Holl, A.M.; Jack, S.B. Tree, stand, and landscape factors contributing to hurricane damage in a coastal plain forest: Post-hurricane assessment in a longleaf pine landscape. For. Ecol. Manag. 2021, 481, 118724. [Google Scholar] [CrossRef]
  10. Kossin, J.P.; Knapp, K.R.; Olander, T.L.; Velden, C.S. Global increase in major tropical cyclone exceedance probability over the past four decades. Proc. Natl. Acad. Sci. USA 2020, 117, 11975–11980. [Google Scholar] [CrossRef]
  11. Gang, C.; Pan, S.; Tian, H.; Wang, Z.; Xu, R.; Bian, Z.; Pan, N.; Yao, Y.; Shi, H. Satellite observations of forest resilience to hurricanes along the northern Gulf of Mexico. For. Ecol. Manag. 2020, 472, 118243. [Google Scholar] [CrossRef]
  12. De Beurs, K.M.; McThompson, N.S.; Owsley, B.C.; Henebrrefy, G.M. Hurricane damage detection on four major Caribbean islands. Remote Sens. Environ. 2019, 229, 1–13. [Google Scholar] [CrossRef]
  13. Peereman, J.; Hogan, J.A.; Lin, T.-C. Disturbance frequency, intensity and forest structure modulate cyclone-induced changes in mangrove forest canopy cover. Glob. Ecol. Biogeogr. 2021, 31, 37–50. [Google Scholar] [CrossRef]
  14. Boose, E.R.; Serrano, M.I.; Foster, D.R. Landscape and regional impacts of hurricanes in Puerto Rico. Ecol. Monogr. 2004, 74, 335–352. [Google Scholar] [CrossRef]
  15. Simpson, R.H. The hurricane disaster potential scale. Weatherwise 1974, 27, 169–186. [Google Scholar]
  16. Knapp, K.R.; Kruk, M.C.; Levinson, D.H.; Diamond, H.J.; Neumann, C.J. The International Best Track Archive for Climate Stewardship (IBTrACS). Bull. Am. Meteorol. Soc. 2010, 91, 363–376. [Google Scholar] [CrossRef]
  17. Willoughby, H.E.; Darling, R.W.R.; Rahn, M.E. Parametricrepresentation of the primary hurricane vortex. Part II: A new family of sectionally continuous profiles. Mon. Weather Rev. 2006, 134, 1102–1120. [Google Scholar] [CrossRef] [Green Version]
  18. Lin, T.-C.; Hogan, J.A.; Chang, C.-T. Tropical Cyclone Ecology: A Scale-Link Perspective. Trends Ecol. Evol. 2020, 35, P594–P604. [Google Scholar] [CrossRef] [Green Version]
  19. Menkes, C.E.; Lengaigne, M.; Marchesiello, P.; Jourdain, N.C.; Vincent, E.M.; Lefèvre, J.; Chauvin, F.; Royer, J.-F. Comparison of tropical cyclogenesis indices on seasonal to interannual timescales. Clim. Dyn. 2012, 38, 301–321. [Google Scholar] [CrossRef]
  20. Jourdain, N.C.; Marchesiello, P.; Menkes, C.E.; Lefevre, J.; Vincent, E.M.; Lengaigne, M.; Chauvin, F. Mesoscale Simulation of Tropical Cyclones in the South Pacific: Climatology and Interannual Variability. J. Clim. 2011, 24, 3–25. [Google Scholar] [CrossRef] [Green Version]
  21. Payri, C.E.; Allain, V.; Aucan, J.; David, C.; David, V.; Dutheil, C.; Loubersac, L.; Menkes, C.; Pelletier, B.; Pestana, G. Chapter 27—New Caledonia. In World Seas: An Environmental Evaluation, 2nd ed.; Sheppard, C., Ed.; Academic Press: New Caledonia, France, 2019; pp. 593–618. [Google Scholar] [CrossRef]
  22. Huang, S.; Tang, L.; Hupy, J.P.; Wang, Y.; Shao, G. A commentary review on the use of normalized difference vegetation index (NDVI) in the era of popular remote sensing. J. For. Res. 2021, 32, 1–6. [Google Scholar] [CrossRef]
  23. Vincent, E.M.; Lengaigne, M.; Menkes, C.E.; Jourdain, N.C.; Marchesiello, P.; Madec, G. Interannual variability of the South Pacific Convergence Zone and implications for tropical cyclone genesis. Clim. Dyn. 2012, 36, 1881–1896. [Google Scholar] [CrossRef] [Green Version]
  24. Muggeo, V.M.R. Segmented: An R Package to Fit Regression Models with Broken-Line Relationships. R News 2008, 8, 20–25. Available online: https://cran.r-project.org/doc/Rnews/ (accessed on 22 February 2022).
  25. Webb, E.L.; Seamon, J.O.; Fa’aumu, S. Frequent, low-amplitude disturbances drive high tree turnover rates on a remote, cyclone-prone Polynesian island. J. Biogeogr. 2011, 38, 1240–1252. [Google Scholar] [CrossRef]
  26. Franklin, J.; Drake, D.R.; McConkey, K.R.; Tonga, F.; Smith, L.B. The effects of Cyclone Waka on the structure of lowland tropical rain forest in Vava’u, Tonga. J. Trop. Ecol. 2004, 20, 409–420. [Google Scholar] [CrossRef]
  27. Kantha, L. Classification of hurricanes: Lessons from Katrina, Ike, Irene, Isaac and Sandy. Ocean Eng. 2013, 70, 124–128. [Google Scholar] [CrossRef]
  28. Bloemendaal, N.; de Moel, H.; Mol, J.M.; Bosma, P.R.M.; Polen, A.N.; Collins, J.M. Adequately reflecting the severity of tropical cyclones using the new Tropical Cyclone Severity Scale. Environ. Res. Lett. 2021, 16, 014048. [Google Scholar] [CrossRef]
  29. Walsh, K.J.E.; McBride, J.L.; Klotzbach, P.J.; Balachandran, S.; Camargo, S.J.; Holl, G.; Knutson, T.R.; Kossin, J.P.; Lee, T.; Sobel, A. Tropical cyclones and climate change. Wiley Interdiscip. Rev. Clim. Chang. 2016, 7, 65–89. [Google Scholar] [CrossRef]
  30. Lin, I.-I.; Pun, I.-F.; Lien, C.-C. “Category-6” supertyphoon Haiyan in global warming hiatus: Contribution from subsurface ocean warming. Geophys. Res. Lett. 2014, 41, 8547–8553. [Google Scholar] [CrossRef]
  31. Bellingham, P.J.; Kapos, V.; Varty, N.; Healey, J.R.; Tanner, E.V.J.; Kelly, D.L.; Dalling, J.W.; Burns, L.S.; Lee, D.; Sidrak, G. Hurricanes need not cause high mortality: The effects of Hurricane Gilbert on forests in Jamaica. J. Trop. Ecol. 1992, 8, 217–223. [Google Scholar] [CrossRef] [Green Version]
  32. Ibanez, T.; Keppel, G.; Menkes, C.; Gillespie, T.W.; Lengaigne, M.; Mangeas, M.; Rivas-Torres, G.; Birnbaum, P. Globally consistent impact of tropical cyclones on the structure of tropical and subtropical forests. J. Ecol. 2019, 107, 279–292. [Google Scholar] [CrossRef]
  33. Ibanez, T.; Chave, J.; Barrabé, L.; Elodie, B.; Boutreux, T.; Trueba, S.; Vandrot, H.; Birnbaum, P. Community variation in wood density along a bioclimatic gradient on a hyper-diverse tropical island. J. Veg. Sci. 2017, 28, 19–33. [Google Scholar] [CrossRef]
  34. Curran, T.J.; Gersbach, L.N.; Edwards, W.; Krockenberger, A.K. Wood density predicts plant damage and vegetative recovery rates caused by cyclone disturbance in tropical rainforest tree species of North Queensland, Australia. Austral Ecol. 2008, 33, 442–450. [Google Scholar] [CrossRef]
  35. Liu, L.; Wang, Y.; Zhan, R.; Xu, J.; Duan, Y. Increasing Destructive Potential of Landfalling Tropical Cyclones over China. J. Clim. 2020, 33, 3731–3743. [Google Scholar] [CrossRef]
  36. Walker, L. Tree Damage and Recovery from Hurricane Hugo in Luquillo Experimental Forest, Puerto-Rico. Biotropica 1991, 23, 379–385. [Google Scholar] [CrossRef]
  37. Bellingham, P.J.; Tanner, E.V.J.; Healey, J.R. Sprouting of Trees in Jamaican Montane Forests, after a Hurricane. J. Ecol. 1994, 8, 747–758. [Google Scholar] [CrossRef]
  38. Van Bloem, S.J.; Murphy, P.G.; Lugo, A.E. A link between hurricane-induced tree sprouting, high stem density and short canopy in tropical dry forest. Tree Physiol. 2007, 27, 475–480. [Google Scholar] [CrossRef] [PubMed]
  39. Poorter, L.; Kitajima, K.; Mercado, P.; Chubiña, J.; Melgar, I.; Prins, H.H.T. Resprouting as a persistence strategy of tropical forest trees: Relations with carbohydrate storage and shade tolerance. Ecology 2010, 91, 2613–2627. [Google Scholar] [CrossRef]
  40. Murphy, H.T.; Metcalfe, D.J. The perfect storm: Weed invasion and intense storms in tropical forests. Austral Ecol. 2016, 41, 864–874. [Google Scholar] [CrossRef]
  41. Catterall, C.P.; McKenna, S.; Kanowski, J.; Piper, S.D. Do cyclones and forest fragmentation have synergistic effects? A before-after study of rainforest vegetation structure at multiple sites. Austral Ecol. 2008, 33, 471–484. [Google Scholar] [CrossRef] [Green Version]
  42. Al-Khaldi, M.M.; Johnson, J.T.; Kang, Y.; Katzberg, S.J.; Bringer, A.; Kubatko, E.; Wood, D. Track-Based Cyclone Maximum Wind Retrievals Using the Cyclone Global Navigation Satellite System (CYGNSS) Mission Full DDMs. IEEE J. Sel. Top. Appl. Earth Obs. Remote Sens. 2020, 13, 21–29. [Google Scholar] [CrossRef]
  43. Dutheil, C.; Lengaigne, M.; Bador, M.; Vialard, J.; Lefèvre, J.; Jourdain, N.C.; Jullien, S.; Peltier, A.; Sultan, B.; Menkes, C. Impact of projected sea surface temperature biases on tropical cyclones projections in the South Pacific. Sci. Rep. 2020, 10, 12. [Google Scholar] [CrossRef] [Green Version]
Figure 1. Trajectories of all tropical cyclones reaching category 1 or higher (i.e., Wmax ≥ 33 m/s) at some point on their tracks between 2000 and 2020 in the South West Pacific Basin.
Remotesensing 14 01245 g001
Figure 2. Example of 2D surface wind speed structure reconstructed using the Willoughby model (Equation (2) (f and g)) for category 1 tropical cyclone Mick (3–5 December 2009), category 3 tropical cyclone Ivy (21–28 February 2004), and category 5 tropical cyclone Winston (7 February–3 March 2016). Vertical dotted lines represent RMW, the distance r from the center of the tropical cyclone where winds reach their maximum speed (Wmax.)
Remotesensing 14 01245 g002
Figure 3. Mean and standard deviation of relative change in NDVI ( Δ N D V I t 1 ) (a,b) and recovery time (TR) (c,d) as a function of maximum sustained wind speed ( W m a x ). Values in bold represent the average for each TC category (SSHWS). Blue lines correspond to piecewise linear regressions with breakpoints based on the SSHWS TC classification and yellow lines correspond to piecewise linear regressions with optimized breakpoints minimizing the Bayesian Information Criterion.
Remotesensing 14 01245 g003
Figure 4. Example of relative change in NDVI observed after tropical cyclone Winston on Viti Levu in Fiji (a), reconstructed maximum sustained wind speed (b), predicted changes in NDVI (c) using the optimized models, and predicted recovery time (d). Winston severely impacted Viti Levu with wind gusts up to 78 m/s between 19 and 20 February 2016.
Remotesensing 14 01245 g004
Table 1. Saffir–Simpson hurricane wind scale (SSHWS).
CategorySustained Wind Speed (m/s)
ine 5 (major)≥70
4 (major)58–70
3 (major)50–58
243–49
133–42
Tropical Storm (TS)18–32
Tropical Depression (TD)<17
Table 2. Coverage of forest pixels exposed to different intensity and frequency of TCs between 2000 and 2020. For instance, in the first row we can read that most forest pixels (95.6%) were exposed to at least one category 1 or higher TC and in the third row that a third of forest pixels (33.1%) were exposed to at least three category 1 or higher TCs.
Maximum Sustained Wind SpeedFrequencyCoverage (%)
≥33 m/s (Cat. 1 or higher)At least once95.6
At least twice71.0
At least 3 times33.1
At least 4 times9.9
At least 5 times1.0
At least 6 times0.0
≥43 m/s (Cat. 2 or higher)At least once73.4
At least twice22.3
At least 3 times2.0
At least 4 times0.0
≥50 m/s (Cat. 3 or higher)At least once43.1
At least twice3.9
At least 3 times0.0
≥58 m/s (Cat. 4 or higher)At least once21.3
At least twice0.3
At least 3 times0.0
≥70 m/s (Cat. 5)At least once5.4
At least twice0.0
Table 3. Summary and performances of the segmented linear models explaining the variation in the damages ( Δ NDVIt1) as a function of Wmax. In the SSHWS model the breakpoints were fixed using the Saffir–Simpson hurricane wind scale boundaries. In the optimized model the location and number of breakpoints were optimized.
ModelBICBeakpointsDavies TestsSlope
Best atp-Value
SSHWS252.0743.0034.00<0.0010.02
50.0049.78<0.001−0.24
58.0069.000.08−0.90
70.0075.00<0.001−1.13
−1.78
Optimized223.7250.0051.78<0.001−0.08
75.7074.22<0.001−1.05
−7.45
Table 4. Summary and performances of the segmented linear models explaining the variation recovery time (TR) as a function of Wmax. In the SSHWS model the breakpoints were fixed using the Saffir–Simpson hurricane wind scale boundaries. In the optimized model the location and number of breakpoints were optimized.
ModelBICBeakpointsDavies TestsSlope
Best atp-Value
SSHWS376.0343.0034.000.0080.49
50.0051.22<0.001−0.10
58.0069.00<0.0014.14
70.0077.00<0.0013.64
6.35
Optimized331.7350.4852.22<0.0010.42
76.6477.00<0.0013.80
51.56
Publisher’s Note: MDPI stays neutral with regard to jurisdictional claims in published maps and institutional affiliations.

