Article

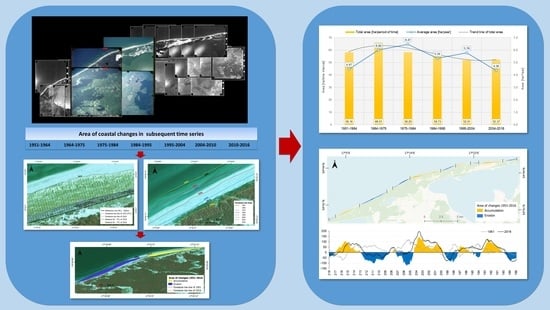
Multi-Temporal Analysis of Changes of the Southern Part of the Baltic Sea Coast Using Aerial Remote Sensing Data

by
Krystyna Michałowska
1,* and
Ewa Głowienka
2
1
Department of Geodesy, Faculty of Civil and Environmental Engineering, Gdańsk University of Technology, 80-233 Gdansk, Poland
2
Faculty of Mining Surveying and Environmental Engineering, Department of Photogrammetry Remote Sensing of Environment and Spatial Engineering, AGH University of Science and Technology, al. Mickiewicza 30, 30-059 Krakow, Poland
*
Author to whom correspondence should be addressed.
Remote Sens. 2022, 14(5), 1212; https://doi.org/10.3390/rs14051212
Submission received: 25 January 2022 / Revised: 19 February 2022 / Accepted: 26 February 2022 / Published: 1 March 2022
(This article belongs to the Special Issue Advances in Remote Sensing of the Inland and Coastal Water Zones)

Abstract

:
Understanding processes that affect changes in the coastal zone and the ability to predict these processes in the future depends on the period for which detailed monitoring is carried out and on the type of coast. This paper analyzes a southern fragment of the Baltic coast (30 km), where there has been no anthropogenic impact (Slowinski National Park). The study was carried out covering a time interval of 65 years. Historic and current aerial photographs (orthophotomaps) from the following years: 1951, 1964, 1975, 1984, 1995, 2004, and 2016 were used. Changes in the position of the foredune toe line (FTL) in each years’ images were used. For each time interval (1951–1964, 1964–1975, 1975–1984, 1984–1995, 1995–2004, 2004–2016), the coastal area over which morphodynamic processes (erosion and accumulation) took place was calculated. The calculated RL (reference line)—FTL positions allowed us to determine differences in the shoreline course in subsequent years and to determine the extent of shifts/changes of the coastline in each time period. The study results showed an equilibrium between the processes of accumulation and erosion, proving that the development of the studied natural coastline is balanced. There was only a change in the trend of the characteristics of changes from erosive into accumulative ones and vice versa. Moreover, along the studied coast section, a certain periodicity in the coastline changes can be observed. The intervals where predominant erosion occurs alternate with those when accumulation prevails, and then the cycle repeats. The analysis of historic/current aerial images and orthophotomaps from 1951–2016 indicated that strong storms have a significant impact on the magnitude of change (accumulation/erosion) and the formation of the studied coastline.

Graphical Abstract

1. Introduction

The coastal zone forms a specific system on the border between the terrestrial and marine environments, which is subjected to very dynamic natural and anthropogenic processes [1]. Studies on changes caused by those processes are extremely important for the maintenance of the sustainable functioning of coastal zones [2]. The problem of having proper management in the coastal zone occurs in many countries on various continents [3,4,5,6,7,8,9,10,11,12,13]. The literature shows numerous examples of coasts where the lack of care about the appropriate functioning of the coastal zone has resulted in serious social, economic, and financial consequences [14,15,16,17,18]. The methods applied in studies on changes in the shoreline are strictly connected with the characteristics of a given type of water body and the dynamics of phenomena and processes such as tides, storms, currents, and waves [11]. The monitoring of morphodynamic processes is carried out with statistical methods [12,19] based on direct measurement [20,21], RTK-GPS measurement [22], and methods based on optical images obtained from unmanned aerial vehicles (UAV) [23,24,25,26,27,28,29], airborne images [30,31,32,33,34], and satellite images [32,33,35,36,37,38,39,40,41,42]. In recent years, it has become popular to apply SAR data and laser scanning data (terrestrial—TLS and airborne—ALS) [5,43,44,45,46,47,48,49]. The use of remote sensing data makes it possible to monitor remotely with a good level of reliability of the obtained measurements for large coastal areas [50]. Pardo-Pascual [35] and his team presented a method for determining the shoreline with subpixel accuracy (<10 m) using multi-temporal satellite images from Landsat 7, Landsat 8, and Sentinel-2. In the case of multispectral, high-resolution WorldView-2 data, scientists can obtain an accuracy level of 1–5 m [36,37]. However, monitoring based on photogrammetric methods can obtain accuracy below 0.5 m [51]. The application of aerial image data raises the possibility of remote monitoring with the obtained measurements having good reliability for studying the dynamics of shoreline changes. The situations recorded in the aerial photos illustrate the total effect of the processes taking place on the shores of the non-tidal sea. The measurement carried out on this basis indirectly considers all factors influencing the changes in the position of the front dune base line in the analyzed period, e.g., changes in sea level, damage caused by storm surges, and others [52]. The foredune toe is one of the best indicators interpreted in aerial photographs to determine the state and long-term dynamics of the seashore [53]. The baseline of the foredune overlaps the vegetation line, an indicator of the limits of regular flooding by high water, and therefore, it represents an important indicator of shoreline movement [54]. The vegetation line is a natural line formed by the plants on the beach. It is easily identifiable, even in historical photographs [28,53,54,55].
The research was carried out for the southern shore of the Baltic Sea, which is a non-tidal sea with periodic sea level fluctuations. Climate change and the associated rising level of the Baltic Sea are causing an increase in the frequency of storm surges. This phenomenon may be the main natural threat to the southern coast in the coming decades. Monitoring these changes is extremely important. The changes of the Baltic sea coast (Figure 1) have been studied by many research teams [53,56,57] and included both long-term and short-term [58,59,60] changes mainly caused by meteorologically-enforced storm waves [21]. Understanding processes that affect changes in the coastal zone and the ability to predict those processes in the future depends on the period for which detailed monitoring is carried out. The fact whether the studies are carried out over short and medium periods (days, months, years, decades) [11,61] or long periods (several decades) is very important [6,62]. The research presented in the literature shows the results obtained for short sections of the Baltic coast using rare time-sampled measurements (up to 30–40 years) and measured points in small numbers (TLS, surveying every 500 or 1000 m).
A new aspect of the present study is that it explores, for the first time, changes of the natural shoreline of the southern Baltic from 1951–2016, long enough (65 years) to allow for capturing the trend of morphodynamic changes in the coastal zone. The analysis included the longest remote sensing data series obtainable.
Another novel aspect of the present work is using the short transects (every 10 m), which made it possible to obtain more precise measurement results (quasi-continuous) compared to measurements using 100–500 m profiles as applied in the state monitoring of the Baltic shore. The research presented herein focuses on a new quantitative approach using analysis of morphodynamic changes (erosion/accumulation) based on multi-temporal remote sensing data to determine trends in natural dune coast development (i.e., devoid of an anthropogenic influence). The work aimed to conduct a remote detection of changes in the coastal zone of the southern Baltic Sea at 6–13 year intervals. Detailed goals included the following:
  • to calculate the area of coastal zone changes (erosion/accumulation) in each decade.
  • to determine the spatial and temporal distribution of changes.
  • to attempt to identify the main factors causing those changes.

2. Materials and Methods
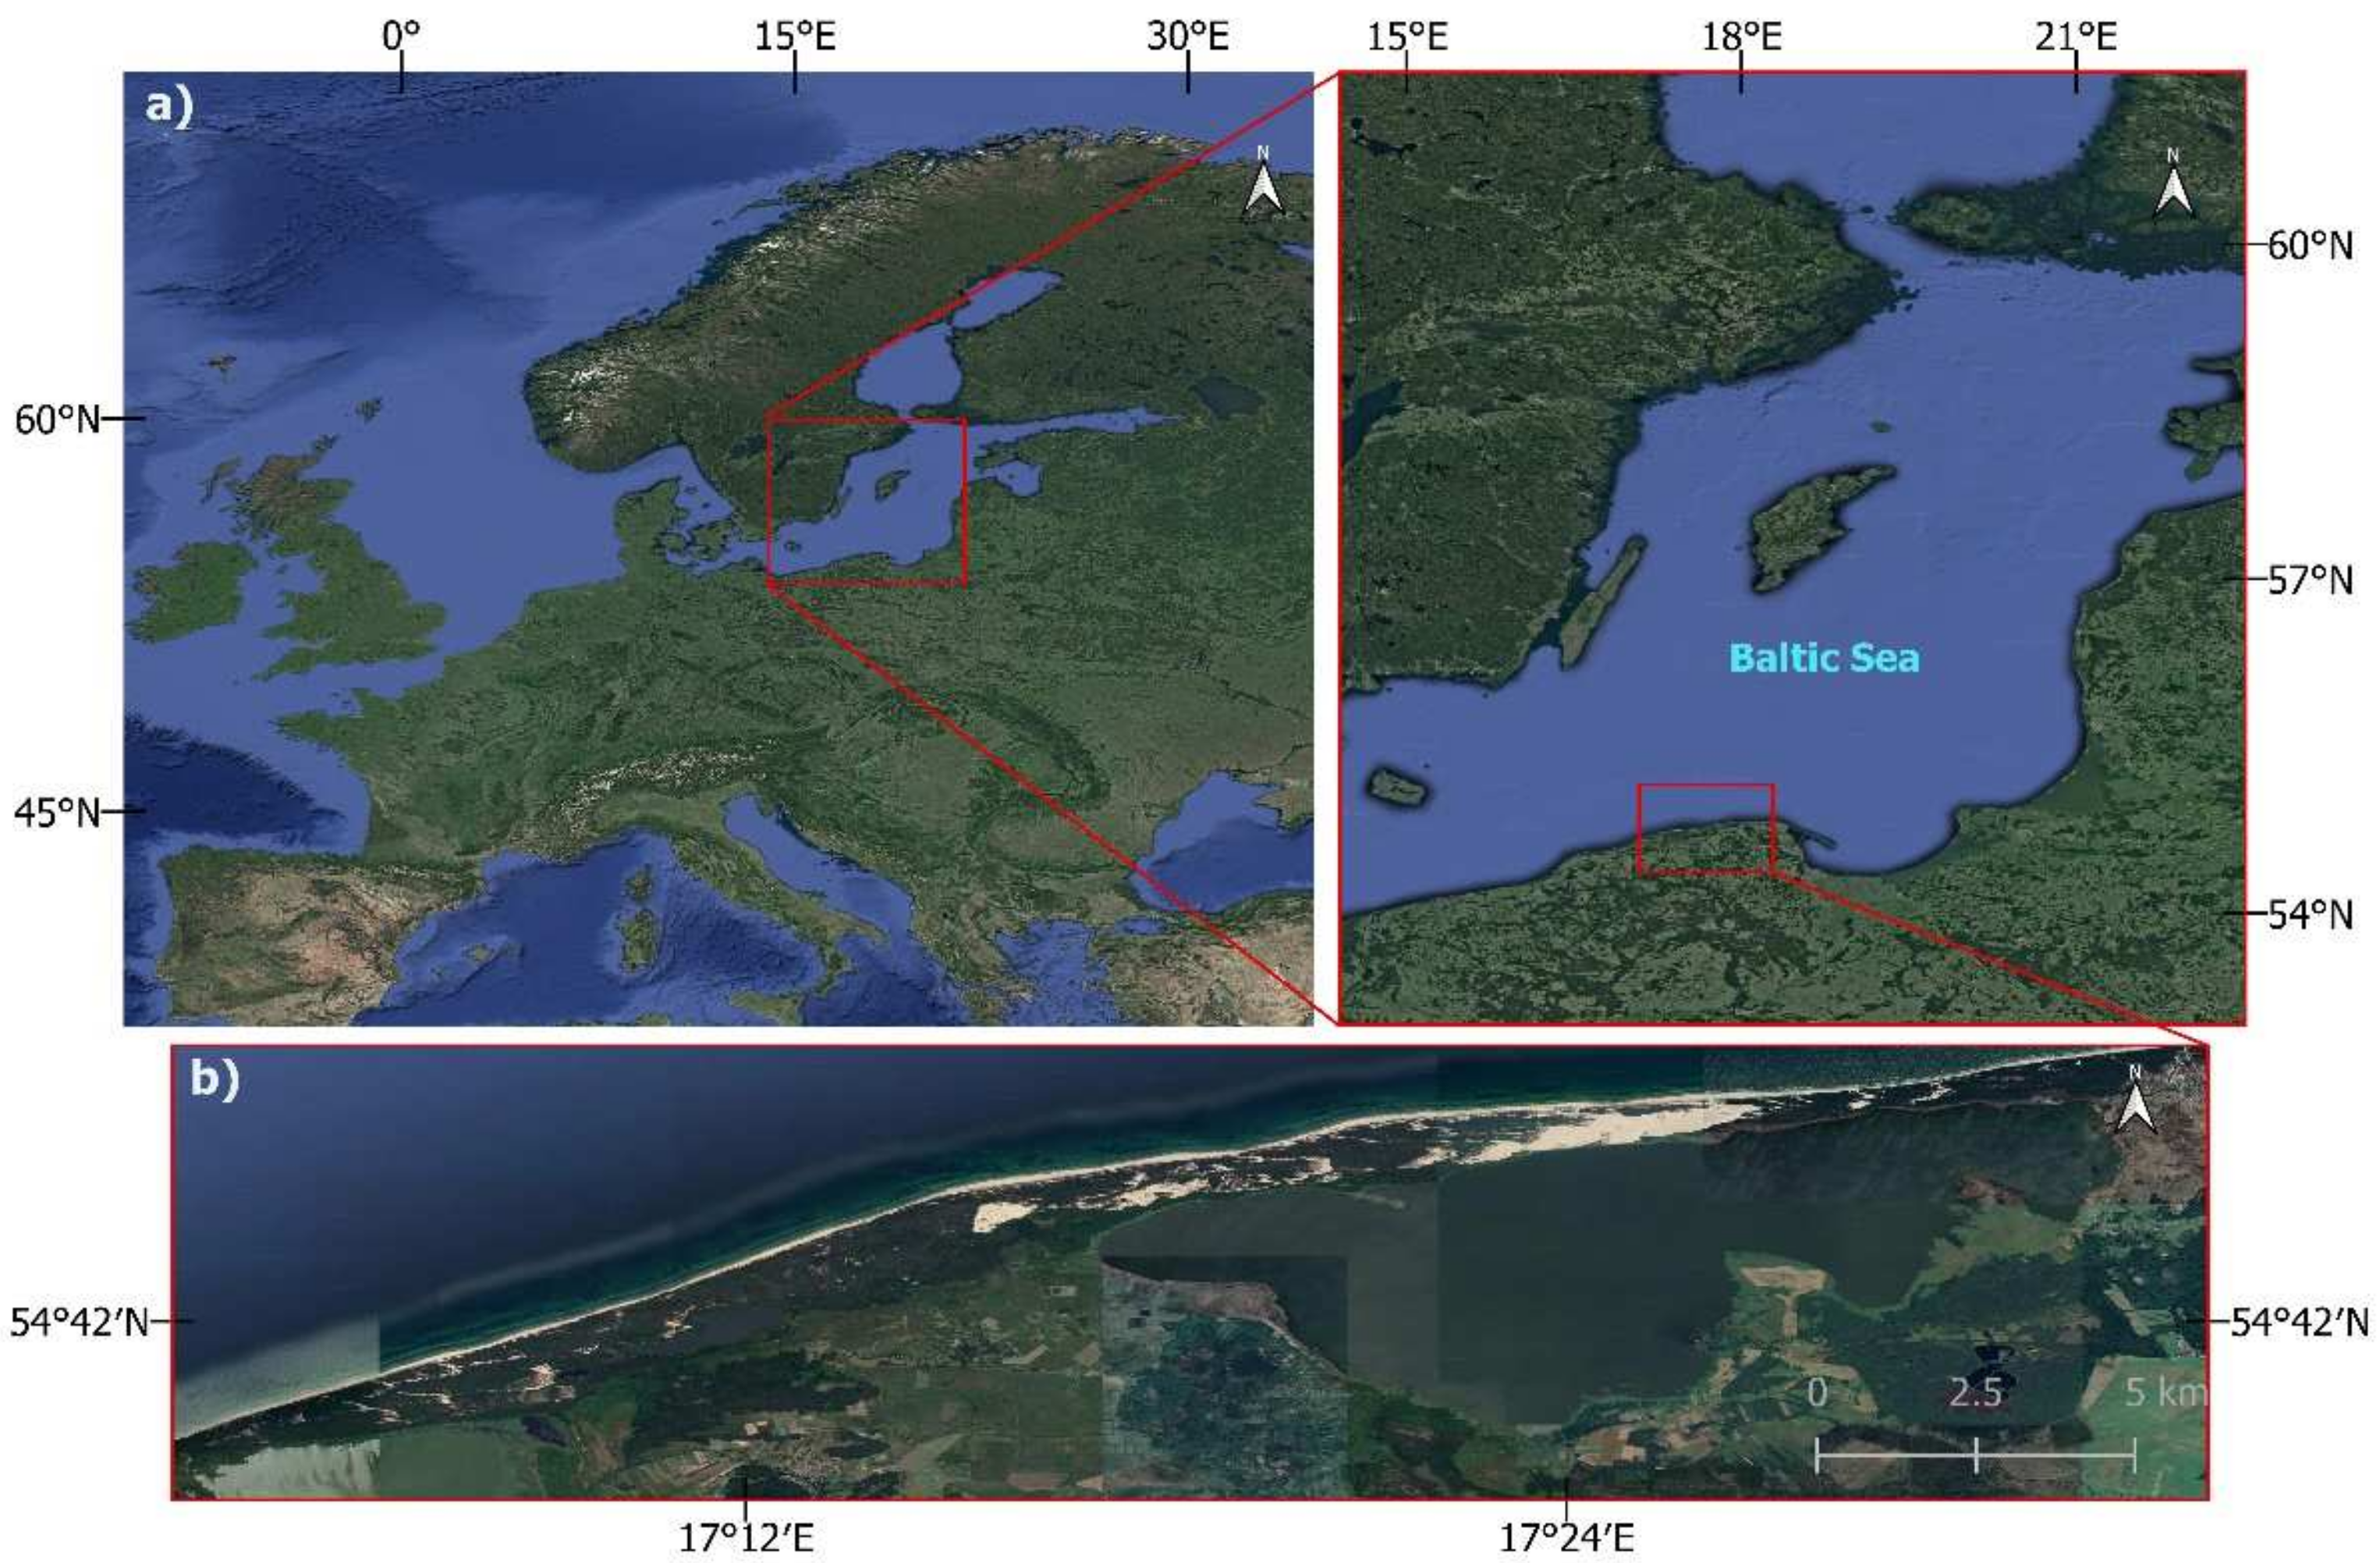
2.1. Study Area

The research was conducted taking into account the southern coast of the non-tidal Baltic Sea, located within the strict protection limits of the Slowinski National Park. The examined coast section, 30 km long, constitutes a sandy sea barrier called the Gardno-Lebsko Spit (Figure 1). The spit, 0.6 to 2 km wide, separates two nearshore lakes, Gardno and Lebsko, from the Baltic Sea. The lakes are linked to the sea by means of short estuary sections of two very small rivers, the Lupawa and Leba. These rivers have an insignificant impact on changes occurring in the coastal zone. In its western portion, the spit is overgrown with forest and has gray dune fields. In the central and eastern parts of the spit, concerning an area of over 500 ha, there are moving dunes. The dunes travel with a speed of 3–10 m/year from west to east, in accordance with the direction of prevailing winds [63], and range in height from several meters up to 56 m above sea level [63,64].
The geological composition of surface formations, which affect the development of morphological processes, is little diversified. Four types of sedimentary rock mainly exist, which differ both in terms of their age and origin. The most common materials are Pleistocene sands of marine accumulation. Under the layer of sands, there are, in places, post-glacial biogenic formations (turfs, gyttjas) [63].
Due to the high variability of wind directions and speed occurring at the Polish coast, the wind wave is the most dynamic factor conveying the largest amounts of energy towards the bottom, controlling the intensity of deposit movements [65]. Winds blowing from the west to the east transport sand, from which foredunes and white linear dunes are formed, thus contributing to land build-up [66]. When analyzed on a yearly basis, the area is marked by a high average wind speed (4.5 m/s) and a very small number of days with calm weather (4.9 days) [67]. Days extremely windy, including those with storms, occur mainly in the autumn and winter. During an average storm, waves of 4–5 m high and 60–80 m long develop. The direct reason for the development of storm surges along the Polish coast is low-pressure systems with accompanying thermal fronts, moving to the east or south-east, from the Norwegian Sea towards Scandinavia [68]. Significant causative factors for changes occurring within the coastal zone system are played by systems of coastal currents, which take part in, among other things, the transport of deposits [65].

2.2. Data

In this study, airborne photos taken in 1951, 1964, 1975, 1984, 1995, 2004, 2010, and 2016 were used. The detailed characteristics of the images and their sources are shown in Table 1. The images were taken at various scales. The images from 1951–1984 were taken in diapositives and scanned into digital format with a precision scanner (PHOTOSCAN TD Intergraph-Zeiss, resolution 14 µm). Digital images for 1995, 2004 and an orthophotomap for 2010 were obtained from the Polish Centre of Surveying and Cartographic Documentation. Data from 1995 were recorded under the EU program PHARE. Moreover, an orthophotomap of 2016, published as WMS (Web Map Service) by the Polish Main Office of Surveying and Cartography, was used.

2.3. Processing of Aerial Data

The data from 1951–2004 were subjected to geometric rectification. The aerial images were blocks of four strips (years: 1951, 1964, 1975, 1984) and eight strips (years: 1995, 2004). The photographs from 1951 and 1964 were characterized by slightly lower quality and a poorer photo interpretation potential due to scratches and damages of the emulsion on the diapositives. It was necessary to improve their quality by using, among others, smoothing and noise removal filters. In the aerotriangulation process, the number of used Ground Control Points (GCPs) depended on the photointerpretation potential of the images in the given year, related to land cover changes. The GCPs were obtained from GPS measurements and based on topographic maps. Totally 45–69 GCP points, depending on the image, were used. The number of GCPs and the results of the aerotriangulation are presented in the table (Table 2). The RMS error for individual coordinates did not exceed the value of 0.5 m.
The photogrammetric materials in the form of aligned blocks of aerial photographs with a stereoscopic coverage from six years: 1951, 1964, 1975, 1984, 1995, 2004 were used to create different Digital Elevation Model (DEM) for each period. For this purpose, measurement of points and vectors representing the terrain surface was performed using a Dephos digital photogrammetric station. For each stereo model, a grid of points with dimensions of 15 m × 15 m (points with a set of coordinates—x, y, z) was measured. Data were supplemented with characteristic details of the terrain (hills, slopes, watercourses, water bodies, depressions, areas excluded from development, and others).
As a result of the orthorectification process, orthophotomaps with a 0.5 m ground pixel resolution in the EPSG 2173 coordinate system were obtained. The orthophotomaps fulfilled the accuracy standards for cartographic materials.

2.4. Analysis of Changes in the Baltic Coastal Zone

Analyses of changes in the coastal zone of the Baltic Sea were carried out on the 188–218 km section of the coast related to seven time intervals (Table 2) covering the years from 1951–2016 (Figure 2).
The foredune toe line (FTL) overlaps with the natural line formed by vegetation on the beach is an important indicator of shoreline movement [46,47,48,49]. For each data set, vegetation lines were identified and mapped based on the visual interpretation of the orthophotomaps (Figure 2, Figure 3 and Figure 4). That allowed the course of the line along the base of the front dunes to be vectorized. Additionally, for the 1951–2004 years, stereoscopic observations of aerial photographs were used to enhance the accuracy of foredune toe line vectorization. This allowed for avoiding errors in cases where the vegetation line was difficult to interpret. In sections of coast lacking a foredune, the lines of the base of the main dune were vectorized.
A reference line (RL) was determined along the coast according to the Polish Maritime Office’s Kilometer line (MOK) (Figure 3). According to the methodology adopted in studies of shoreline changes in the Baltic Sea [43], the analysis of the magnitude of coastline changes was carried out based on transects set at short intervals—every 10 m. The transects were perpendicular to the reference line (Figure 4). It made it possible to obtain more precise measurement results (quasi-continuous) compared with measurements utilizing 100–500 m profiles as applied in the state monitoring of the Baltic shore [69]. The distance from the reference line to the coastline was calculated for each year. As examples, 1975 and 2010 are presented in Figure 4. The obtained RL-FTL distances made it possible to determine differences in the shoreline course in the following years and the extent of shifts/changes of the coastline in each period.
The vectors of intersecting lines create polygons, i.e., closed areas on which accumulation and erosion occur. Based on the geometry (coordinates) of the obtained polygons (Figure 5), their surface areas were calculated. The transformation of linear objects into 2D and calculation of the size of accumulated areas and eroded areas for respective time intervals were carried out with GIS software (GeoMedia, QGIS)).
It should be noted that the last two periods were shorter (6 years) than the previous ones (from 9–13 years). To carry out analysis, they should be combined into a 12 year period, i.e., 2004–2016. For each time interval, the coast area at which the morphodynamic processes took place was calculated. Then, we calculated the total area of changes in individual periods (1) and the average value of the change in area in a given period (2).
AT = Σai,
ATY = AT/n,
where:
-
ATY—average area for a period of time
-
AT—total area in the time period
-
a—partial area in the time period
-
T—period of time
-
n—number of years

3. Results

Based on the obtained results, an analysis and determination of changes in the coastal zone of the southern Baltic over 65 years (1951–2016) were carried out. Graphs and tables (Figure 6, Figure 7, Figure 8, Figure 9 and Figure 10, Table 3) provide an overview of the surface area of erosion/accumulation changes over the decades and their spatial-temporal distribution of those changes.
Graphs of the total area of change in subsequent intervals and the average value for each year were prepared for all periods (Figure 6). The results are also presented as a graph and map of the total change that took place over 65 years (Figure 10).

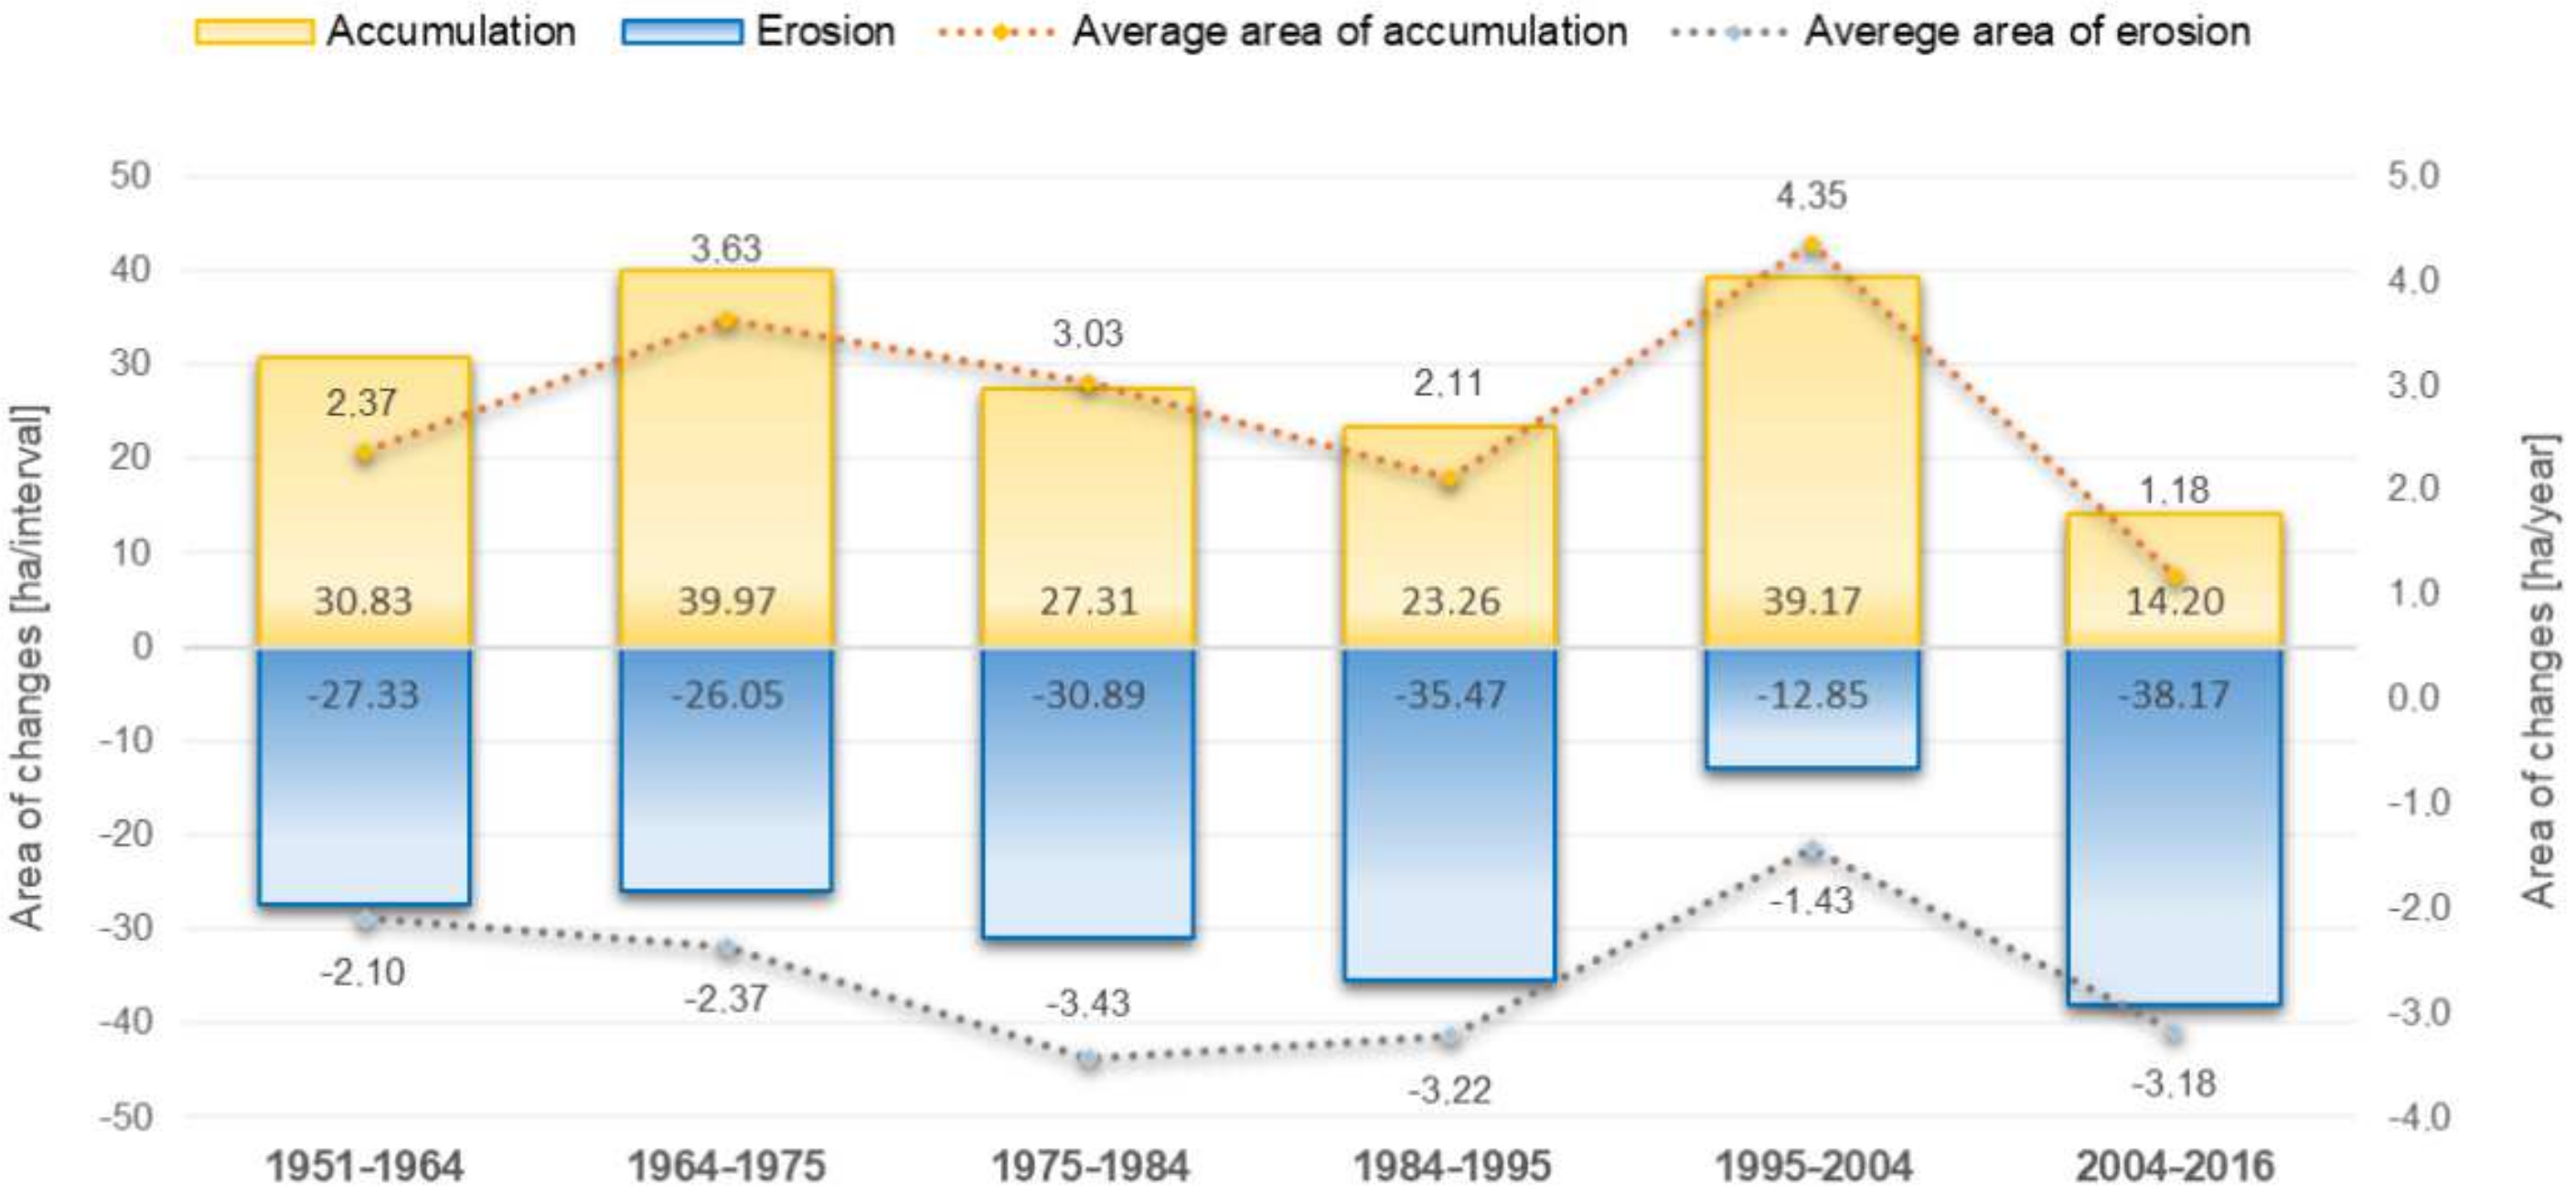
3.1. Analysis of the Areas Eroded and Accumulated in the Examined Period

The analysis of the changes in accumulated and eroded areas showed that in the examined section of the coast in 1951–1964, the accumulation process slightly dominated, covering 30.83 ha, which represented a change amounting to 53% of the total area. The time interval 1964–1975 was characterized by clear intensification of the accumulation processes (Figure 6 and Figure 7, Table 3). The accumulated area increased by more than 9 ha. That means 61% of the total surface changed, representing accretion, which prevailed during this interval. At the same time, there was a slight decrease in eroded areas from 27 to 26 ha (Figure 6 and Table 3), which, in the studied period, represented only 39% of the total area. A comparison with the previous period led to an observation that along the western part of the studied coast (i.e., 214.3 to 205.5 km, according to MOK), eroded sections were shortened, the trend of erosive fragments was reversed for accumulative areas (i.e., 215.2–214.3 km and 211.3–210.3 km MOK), and vice versa (Figure 7). Along the entire examined coast, an extension of the shoreline sections with accumulation characteristics was observed.
In the subsequent two intervals, 1975–1984 and 1984–1995, the accumulation area decreased accordingly from 40 to 27.3 ha, and down to 23.3 ha. The eroded area increased from 26 to 30.89 ha in the 1975–1984 interval, while during the next, the growth was up to 35.47 ha. It was the biggest area subjected to shore erosion during the studied period of 65 years. A visible elongation of eroded sections was also noticed (Figure 7).
The interval of 1995–2004 was characterized by the most extended accretionary processes, which determined the reduction of the coastlines/areas affected by erosion to only 25% of the total (Figure 6 and Table 3). The elongation of accumulation sections was observed. On the coast sections where shore reconstruction processes took place, significant shifts in the shoreline were observed in the range of 20–40 m, sometimes exceeding 50 m (Figure 7). The significant predominance of long sections of accumulation and shorter fragments of shore erosion indicate an essential intensification of accumulation trends and a decrease in erosion trends.
The analysis for 2004–2016 showed a clear increasing trend of coastal destruction processes. Compared to the previous period, the eroded area increased three times from 12.85 ha to 38.17 ha (Figure 7 and Figure 8, Table 3). The 2004–2016 period was the most erosive interval. These results align with those obtained by analyzing data from the shorter 6 year periods. It can be seen that the time interval of 2004–2010 was characterized by a significant lowering of the intensity of the accumulation processes from an area of 39.17 ha to 11.96 ha (24.97 ha). At the same time, there was an intensification of shore erosion processes. The eroded area increased by more than double; from 12.85 to 26.94 ha. In the most recent period (2010–2016), there was a permanent trend for the area of coastal fragments to decrease where beach build-up was taking place (from 11.96 to 7.66 ha). At the same time, there was a significant decrease in the size of the eroded area (from 26.94 to 17.41 ha).

Balance of the Impact of Morphodynamic Processes on the Studied Part of the Coast

The balance between the sums of accumulated and eroded areas in subsequent time intervals was analyzed (Figure 6, Figure 7 and Figure 8 and Table 3). Comparable amounts of accumulated and eroded areas were observed in the first time interval, and their participation was 53% and 47%, respectively (Table 3). In subsequent years (1964–1975), clear intensification of accumulation changes was observed, which manifested itself in a positive balance (+13.92 ha) of the area of accumulation; the proportion of the eroded area stayed on a similar level, i.e., 26.05 ha, as compared to the previous period. A negative balance occurred in two subsequent decades, equalling 3.59 ha in 1975–84 and 12.21 ha in the following decade (1984–1995). This demonstrates an intensification of erosion and dominance of the shore destruction processes. The following time interval (1995–2004) was characterized by a definite weakening of erosion compared to previous decades. The eroded area decreased by almost three times (35.47 to 12.85 ha). The retreat of the shore occurred on almost one-quarter of the length of the examined coast. The positive balance of +26.32 ha of accumulation area provides evidence of the reversal of the erosion trend and the decisive predominance of the shore accumulation processes over the interval.
In the period from 2004–2016, a negative balance of the area of change was observed (−23.97 ha) along with a significant dominance of erosion processes (Figure 6, Figure 7 and Figure 8 and Table 3). It should be noted that compared to the previous period, the area on which coastal destruction processes occurred increased by 48%. In contrast, the size of the area of the accumulative nature decreased three times. The detailed analysis of the shorter six-year intervals indicated a negative balance in both periods, i.e., 14.98 and 9.75 ha. The coast erosion occurred in 69% of the examined area.
Based on the analysis of changes in coastal areas over the whole examined period (1951–2016), a slight predominance of the accumulated area over the eroded area, +78.19 (51%) and 74.22 (49%), respectively, was identified (Figure 6, Table 3). Moreover, in a comparison of the areas subjected to changes, in subsequent periods, the area of shore accumulation was +174.74 ha (51%), while the area of shore subjected to erosion was 170.76 ha (49%). The obtained results of the study showed an equilibrium between the processes of accumulation and erosion, proving that the development of the studied coastline has been balanced. There were only changes in the trend from erosive to accumulative processes and vice versa.
The total area of shore change in subsequent years ranged from 52.01 to 66,01 ha (Figure 9 and Table 3). A detailed analysis of the total areas of accumulation and erosion in subsequent time intervals indicated the intensification of coastal processes in 1964–1975, and the increase in the area of changes in the coastal area by 7.85 ha was observed, as compared to the previous interval (Table 3). The years 1975–1984 were marked by a decrease in the area of change down to 58.2 ha, which corresponds to the change value in the 1951–1964 period. In the following time interval (1984–1995), the change area reached a comparable value, i.e., 58.73 ha. In 1995–2004 and 2004–2016, there was a noticeable decrease in the area subjected to changes, about 52 ha, thus indicating a weakening of dynamic coastal processes within the examined part of the coastline.

4. Discussion

Sea level fluctuations exert a great impact on the functioning of the coastal zone system and the course of processes occurring therein. Changes in water level occurring in the coastal zone may have the nature of periodic oscillations (tides) or non-periodic changes, such as storm surges [65]. Sandy beaches act naturally as shoreline buffers, absorbing the energy of waves and adjusting dynamically to the seasonal or long-term wave climate. During extreme wave phenomena, major changes in the coast morphology may occur, which may significantly affect the coast stability [70]. The frequency of storm surges on the Polish coast has intensified over the last fifty years. Also, the maximum levels and duration of surges have increased. The increase in the number of low-pressure fronts moving above the Baltic area resulted in the growth of the number of storm days [71]. The clear increasing tendency results from an increased number of extreme weather phenomena due to climate changes. That process also impacts distinct changes in sea levels over the last hundred years [72].
Following the increase in sea levels and frequency of high storm surges, the Polish coast is threatened with erosion [73,74,75]. Visible on the larger part of the dune coast is the shore withdrawal inland [73,76,77,78]. The rate of the Polish coast retraction in the 20th century has been estimated at 0.8–1.0 m per year [76,79]. However, after each storm surge, the dune toe or its top (ridge) is recorded to have moved as much as by 3–4 m per year [80,81]. This is confirmed by the analysis of eroded/accumulated areas for the examined Baltic coast section as presented herein (Figure 6, Figure 7 and Figure 8 and, Table 3) and previous research [82].
Analyses of the Baltic coast changes based on 1951–2016 aerial photos take into account the accumulative effect of the impact of processes occurring in the coastal zone, including, among other things, changes in sea levels, coastal jet systems, damages resulting from storm surges, etc., [52]. Due to the strict protection of the examined part of the coast, located within the National Park limits, one can exclude negative effects of anthropogenic activity, and the same about the insignificant impact of the Lupawa River estuary. Research [83] has analyzed the variability of wave motion parameters for 1950–2010. There was no significant diversity in wave parameters, which could justify the variability of the coastal zone.
Based on the analysis of accumulated and eroded areas, the fragment of the examined Baltic coast in 1951–1964 is marked by a balanced inventory of coastal areas, on which processes of shore building up/damaging take place (Table 3). The analysis of the frequency of storm surge occurrences [84] and research results [75,85] denote a moderate influence of extreme weather phenomena in the period from 1947–1970 on changes within the coastal zone. In the subsequent years of 1964–1975, intensification of coast building processes (aggregation of the coast) and an increase in surfaces of accumulated areas were noted (Figure 6 and Figure 7, Table 3). This is reflected in the results of the analysis of storm surge occurrence frequency at the southern Baltic Sea [75,84,85]. According to the analysis performed by [68], the period of 1960–1969 was marked by the smallest number of storms on the Polish part of the Baltic Sea coast. This is confirmed by studies undertaken by [86] and conducted in 1963–1964, which proved that 60% of the Lebsko Spit area was subject to the process of accumulation.
The prevalence of coast destruction activity, and larger eroded areas, was recorded in multiannual periods, during which severe and frequent storm surges occurred. The negative balance of the size of accumulated and of eroded areas was recorded in 1975–1984 and again in 1984–1995. Those periods overlap with dates of increased storm activity on the southern Baltic coast [84,87]. Research [88,89] conducted on other sections of the Polish coast confirms that. The strongest effects of the activity of the coast destruction processes were noticed in 1984–1995 (Figure 6 and Figure 7, Table 3). The increased surface area of erosion zones in the period under discussion may result from an increased storm activity on the southern Baltic (207 storms recorded) [71,84]. The length of the coast sections under destruction was extended (Figure 7) compared to the previous periods [82,88].
After 1995, the number of stormy days sharply decreased [71,84], reflected in results obtained for the multi-annual period of 1995–2004. The noticeable prevalence of areas that are accumulative in nature (75% of the surface area of the examined coast section) denotes a decrease in the impact of destructive factors) (Figure 6 and Figure 7, Table 3).
The years 2004–2016 were dominated by destructive shore processes regarding over 70% of the examined coast surface area (Figure 7 and Figure 8, Table 3). This confirms the occurrence of intensive morphodynamic processes resulting from heavy storm surges in 2004, 2009, and 2012 [21,77,80,90]. During the 6-year periods of 2004–2010 and 2010–2016, a demonstrable retraction of land towards the south was recorded. An intensification and domination of shore destruction processes was observed (Figure 7 and Figure 8, Table 3). Considerable land losses along the whole coast were recorded after heavy storms in 2004, 2006, and 2009 [77,80,90]. Following the heavy storm in November 2006, the dunes retracted 2 to 5 m [73]. The highest number of storm surges over all analyzed mareographic stations was recorded in the last period of 2010–2016 [68]. Two storm surges following each other in January 2012, with high seawater levels, caused massive losses along the entire Polish coast, even on the hitherto accumulative part of the coast. Regarding the examined section (the Lebsko Spit), the dune toe retracted up to 3 m [21].

5. Conclusions

The use of historic/current aerial images and orthophotomaps for the analysis of changes in the coastline of the southern coast of the Baltic Sea made it possible to determine the size and intensity of morphodynamic changes (erosion and accumulation) in the time interval of 1951–2016, i.e., over 65 years. The total area subjected to coastal morphodynamic processes in subsequent time intervals revealed an intensification of coastal processes in the 1960s and an increase in the area subjected to changes compared to the first studied period (1951–1964). In the time interval 1975–1984 there was a decrease in the area subjected to changes, slightly below the level of change observed in the first period. In the following decade, the area subjected to transformations corresponded with the size of the area of change from the 1950s. In 1995–2004, accumulation processes dominated. At the same time, there was a further decrease in the area subjected to deformation, which indicates a slight weakening of dynamic coastal processes in the studied area of the coast as studied by the paper authors. Compared to all previously studied periods, the last interval (2004–2016) was the most erosive. A threefold increase in the eroded surface area was due to the growth of the shore destruction processes in this period, mainly due to strong storms in 2004, 2006, 2009, and 2012. The results obtained for the 65-year period indicate a balance between the processes of accumulation and erosion, proving the development of the examined coastline was balanced.
In summary, results obtained from the analysis of orthophotos from 1951–2016 indicate that severe storms have a significant impact on the magnitude of changes (accumulation/erosion) and the formation of the studied coastline. Due to the strict protection of the examined part of the coast (it is located within the borders of the National Park), negative anthropogenic impact can be excluded.

Author Contributions

Conceptualization, K.M.; methodology, K.M. and E.G.; software, K.M. and E.G.; validation, K.M. and E.G.; formal analysis, K.M. and E.G.; investigation, K.M. and E.G.; resources, K.M. and E.G.; writing—original draft preparation, K.M. and E.G.; writing—review and editing, K.M. and E.G.; visualization, K.M. and E.G.; supervision, K.M.; funding acquisition, K.M. All authors have read and agreed to the published version of the manuscript.

Funding

This research was funded by the Gdansk University of Technology, Faculty of Civil and Environmental Engineering.

Institutional Review Board Statement

Not applicable.

Informed Consent Statement

Not applicable.

Data Availability Statement

Not applicable.

Conflicts of Interest

The authors declare no conflict of interest.

References

  1. Brown, A.G.; Tooth, S.; Bullard, J.E.; Thomas, D.S.G.; Chiverrell, R.C.; Plater, A.J.; Murton, J.; Thorndycraft, V.R.; Tarolli, P.; Rose, J.; et al. The geomorphology of the Anthropocene: Emergence, status and implications. Earth Surf. Process. Landf. 2017, 42, 71–90. [Google Scholar] [CrossRef] [Green Version]
  2. Stive, M.J.; Aarninkhof, S.G.; Hamm, L.; Hanson, H.; Larson, M.; Wijnberg, K.M.; Nicholls, R.J.; Capobianco, M. Variability of shore and shoreline evolution. Coast. Eng. 2002, 47, 211–235. [Google Scholar] [CrossRef]
  3. Suursaar, Ü.; Kullas, T.; Otsmann, M.; Kõuts, T. Extreme sea level events in the coastal waters of western Estonia. J. Sea Res. 2003, 49, 295–303. [Google Scholar] [CrossRef] [Green Version]
  4. Manca, E.; Pascucci, V.; Deluca, M.; Cossu, A.; Andreucci, S. Shoreline evolution related to coastal development of a managed beach in Alghero, Sardinia, Italy. Ocean Coast. Manag. 2013, 85, 65–76. [Google Scholar] [CrossRef]
  5. Pradhan, B.; Rizeei, H.M.; Abdulle, A. Quantitative assessment for detection and monitoring of coastline dynamics with temporal RADARSAT images. Remote Sens. 2018, 10, 1705. [Google Scholar] [CrossRef] [Green Version]
  6. Chaaban, F.; Darwishe, H.; Louche, B.; Battiau-Queney, Y.; Masson, E.; Khattabi, J.E.; Carlier, E. Geographical information system approach for environmental management in coastal area (Hardelot-Plage, France). Environ. Earth Sci. 2011, 65, 183–193. [Google Scholar] [CrossRef]
  7. Natesan, U.; Parthasarathy, A.; Vishnunath, R.; Kumar, G.E.J.; Ferrer, V.A. Monitoring Longterm Shoreline Changes along Tamil Nadu, India Using Geospatial Techniques. Aquat. Procedia 2015, 4, 325–332. [Google Scholar] [CrossRef]
  8. Mukhopadhyay, A.; Mukherjee, S.; Mukherjee, S.; Ghosh, S.; Hazra, S.; Mitra, D. Automatic shoreline detection and future prediction: A case study on Puri coast, Bay of Bengal, India. Eur. J. Remote Sens. 2012, 45, 201–213. [Google Scholar] [CrossRef]
  9. Al Fugura, A.; Billa, L.; Pradhan, B. Semi-automated procedures for shoreline extraction using single RADARSAT-1 SAR image. Estuar. Coast. Shelf Sci. 2011, 95, 395–400. [Google Scholar] [CrossRef]
  10. Liu, H.; Jezek, K.C. Automated extraction of coastline from satellite imagery by integrating Canny edge detection and locally adaptive thresholding methods. Int. J. Remote Sens. 2004, 25, 937–958. [Google Scholar] [CrossRef]
  11. Nassar, K.; Mahmod, W.E.; Fath, H.; Masria, A.; Nadaoka, K.; Negm, A. Shoreline change detection using DSAS technique: Case of North Sinai coast, Egypt. Mar. Georesour. Geotechnol. 2018, 37, 81–95. [Google Scholar] [CrossRef]
  12. Oyedotun, T.D.T.; Ruiz-Luna, A.; Navarro-Hernández, A.G. Contemporary shoreline changes and consequences at a tropical coastal domain. Geol. Ecol. Landsc. 2018, 2, 104–114. [Google Scholar] [CrossRef] [Green Version]
  13. Dunn, R.A.; Genz, A.S.; Fletcher, C.H.; Frazer, L.N.; Rooney, J.J. The Predictive Accuracy of Shoreline Change Rate Methods and Alongshore Beach Variation on Maui, Hawaii. J. Coast. Res. 2007, 231, 87–105. [Google Scholar] [CrossRef] [Green Version]
  14. Angnuureng, D.B.; Almar, R.; Senechal, N.; Castelle, B.; Addo, K.A.; Marieu, V.; Ranasinghe, R. Shoreline resilience to individual storms and storm clusters on a meso-macrotidal barred beach. Geomorphology 2017, 290, 265–276. [Google Scholar] [CrossRef]
  15. Jiménez, J.A.; Sancho-García, A.; Bosom, E.; Valdemoro, H.I.; Guillén, J. Storm-induced damages along the Catalan coast (NW Mediterranean) during the period 1958–2008. Geomorphology 2012, 143, 24–33. [Google Scholar] [CrossRef]
  16. Sallenger, A.H.; Stockdon, H.F.; Fauver, L.; Hansen, M.; Thompson, D.; Wright, C.W.; Lillycrop, J. Hurricanes 2004: An overview of their characteristics and coastal change. Estuaries Coasts 2006, 29, 880–888. [Google Scholar] [CrossRef]
  17. Sherman, D.J.; Hales, B.U.; Potts, M.K.; Ellis, J.T.; Liu, H.; Houser, C. Impacts of Hurricane Ike on the beaches of the Bolivar Peninsula, TX, USA. Geomorphology 2013, 199, 62–81. [Google Scholar] [CrossRef]
  18. Zhang, K.; Douglas, B.; Leatherman, S. Do Storms Cause Long-Term Beach Erosion along the U.S. East Barrier Coast? J. Geol. 2002, 110, 493–502. [Google Scholar] [CrossRef]
  19. Reeve, D.E.; Fleming, C.A. A statistical-dynamical method for predicting long term coastal evolution. Coast. Eng. 1997, 30, 259–280. [Google Scholar] [CrossRef]
  20. Langley, S.K.; Alexander, C.R.; Bush, D.M.; Jackson, C.W. Modernizing Shoreline Change Analysis in Georgia Using Topographic Survey Sheets in a GIS Environment. J. Coast. Res. 2003, 38, 168–177. [Google Scholar]
  21. Łabuz, T.A. Erosion and its rate on an accumulative Polish dune coast: The effects of the January 2012 storm surge. Oceanologia 2014, 56, 307–326. [Google Scholar] [CrossRef] [Green Version]
  22. Harley, M.D.; Turner, I.L.; Short, A.D.; Ranasinghe, R. Assessment and integration of conventional, RTK-GPS and image-derived beach survey methods for daily to decadal coastal monitoring. Coast. Eng. 2011, 58, 194–205. [Google Scholar] [CrossRef]
  23. Gonçalves, J.A.; Henriques, R. UAV photogrammetry for topographic monitoring of coastal areas. ISPRS J. Photogramm. Remote Sens. 2015, 104, 101–111. [Google Scholar] [CrossRef]
  24. Casella, E.; Rovere, A.; Pedroncini, A.; Stark, C.P.; Casella, M.; Ferrari, M.; Firpo, M. Drones as tools for monitoring beach topography changes in the Ligurian Sea (NW Mediterranean). Geo-Mar. Lett. 2016, 36, 151–163. [Google Scholar] [CrossRef]
  25. Barlow, J.; Gilham, J.; Ibarra Cofrã, I. Kinematic analysis of sea cliff stability using UAV photogrammetry. Int. J. Remote Sens. 2017, 38, 2464–2479. [Google Scholar] [CrossRef]
  26. Talavera, L.; Del Río, L.; Benavente, J.; Barbero, L.; López-Ramírez, J.A. UAS as tools for rapid detection of storm-induced morphodynamic changes at Camposoto beach, SW Spain. Int. J. Remote Sens. 2018, 39, 5550–5567. [Google Scholar] [CrossRef]
  27. Fabbri, S.; Grottoli, E.; Armaroli, C.; Ciavola, P. Using high-spatial resolution UAV-derived data to evaluate vegetation and geomorphological changes on a dune field involved in a restoration endeavour. Remote Sens. 2021, 13, 1987. [Google Scholar] [CrossRef]
  28. Priest, G.R. Coastal Shoreline Change Study Northern and Central Lincoln County, Oregon. J. Coast. Res. 1999, 28, 140–157. [Google Scholar]
  29. Duo, E.; Fabbri, S.; Grottoli, E.; Ciavola, P. Uncertainty of Drone-Derived DEMs and Significance of Detected Morphodynamics in Artificially Scraped Dunes. Remote Sens. 2021, 13, 1823. [Google Scholar] [CrossRef]
  30. Fisher, J.S.; Overton, M.F. Interpretation of Shoreline Position from Aerial Photographs. In Proceedings of the 24th International Conference on Coastal Engineering, Kobe, Japan, 23–28 October 1994. [Google Scholar]
  31. Fletcher, C.; Richmond, B.; Rooney, J.; Barbee, M.; Lim, S.C. Mapping Shoreline Change Using Digital Orthophotogrammetry on Maui, Hawaii. J. Coast. Res. 2003, 38, 106–124. [Google Scholar]
  32. Ford, M. Shoreline changes interpreted from multi-temporal aerial photographs and high resolution satellite images: Wotje Atoll, Marshall Islands. Remote Sens. Environ. 2013, 135, 130–140. [Google Scholar] [CrossRef]
  33. Novikova, A.; Belova, N.; Baranskaya, A.; Aleksyutina, D.; Maslakov, A.; Zelenin, E.; Shabanova, N.; Ogorodov, S. Dynamics of permafrost coasts of Baydaratskaya Bay (Kara Sea) based on multi-temporal remote sensing data. Remote Sens. 2018, 10, 1481. [Google Scholar] [CrossRef] [Green Version]
  34. Gairin, E.; Collin, A.; James, D.; Maueau, T.; Roncin, Y.; Lefort, L.; Dolique, F.; Jeanson, M.; Lecchini, D. Spatiotemporal Trends of Bora Bora’s Shoreline Classification and Movement Using High-Resolution Imagery from 1955 to 2019. Remote Sens. 2021, 13, 4692. [Google Scholar] [CrossRef]
  35. Pardo-Pascual, J.E.; Sánchez-García, E.; Almonacid-Caballer, J.; Palomar-Vázquez, J.M.; Priego de los Santos, E.; Fernández-Sarría, A.; Balaguer-Beser, Á. Assessing the accuracy of automatically extracted shorelines on microtidal beaches from landsat 7, landsat 8 and sentinel-2 imagery. Remote Sens. 2018, 10, 326. [Google Scholar] [CrossRef] [Green Version]
  36. Maglione, P.; Parente, C.; Vallario, A. Coastline extraction using high resolution WorldView-2 satellite imagery. Eur. J. Remote Sens. 2014, 47, 685–699. [Google Scholar] [CrossRef]
  37. Sekovski, I.; Stecchi, F.; Mancini, F.; Del Rio, L. Image classification methods applied to shoreline extraction on very high-resolution multispectral imagery. Int. J. Remote Sens. 2014, 35, 3556–3578. [Google Scholar] [CrossRef]
  38. García-Rubio, G.; Huntley, D.; Russell, P. Evaluating shoreline identification using optical satellite images. Mar. Geol. 2015, 359, 96–105. [Google Scholar] [CrossRef] [Green Version]
  39. Bini, M.; Casarosa, N.; Luppichini, M. Exploring the relationship between river discharge and coastal erosion: An integrated approach applied to the Pisa coastal plain (Italy). Remote Sens. 2021, 13, 226. [Google Scholar] [CrossRef]
  40. Turner, I.L.; Harley, M.D.; Almar, R.; Bergsma, E.W.J. Satellite optical imagery in Coastal Engineering. Coast. Eng. 2021, 167, 103919. [Google Scholar] [CrossRef]
  41. Bishop-Taylor, R.; Nanson, R.; Sagar, S.; Lymburner, L. Mapping Australia’s dynamic coastline at mean sea level using three decades of Landsat imagery. Remote Sens. Environ. 2021, 267, 112734. [Google Scholar] [CrossRef]
  42. Castelle, B.; Masselink, G.; Scott, T.; Stokes, C.; Konstantinou, A.; Marieu, V.; Bujan, S. Satellite-derived shoreline detection at a high-energy meso-macrotidal beach. Geomorphology 2021, 383, 107707. [Google Scholar] [CrossRef]
  43. White, S.A.; Wang, Y. Utilizing DEMs derived from LIDAR data to analyze morphologic change in the North Carolina coastline. Remote Sens. Environ. 2003, 85, 39–47. [Google Scholar] [CrossRef]
  44. Shrestha, R.L.; Carter, W.E.; Sartori, M.; Luzum, B.J.; Slatton, K.C. Airborne Laser Swath Mapping: Quantifying changes in sandy beaches over time scales of weeks to years. ISPRS J. Photogramm. Remote Sens. 2005, 59, 222–232. [Google Scholar] [CrossRef]
  45. Hobbs, P.; Gibson, A.; Jones, L.; Poulton, C.; Jenkins, G.; Pearson, S.; Freeborough, K. Monitoring coastal change using terrestrial LiDAR. Geol. Soc. Lond. Spec. Publ. 2010, 345, 117–127. [Google Scholar] [CrossRef] [Green Version]
  46. Kuhn, D.; Prüfer, S. Coastal cliff monitoring and analysis of mass wasting processes with the application of terrestrial laser scanning: A case study of Rügen, Germany. Geomorphology 2014, 213, 153–165. [Google Scholar] [CrossRef]
  47. Pye, K.; Blott, S.J. Assessment of beach and dune erosion and accretion using LiDAR: Impact of the stormy 2013-14 winter and longer term trends on the Sefton Coast, UK. Geomorphology 2016, 266, 146–167. [Google Scholar] [CrossRef]
  48. Fuse, T.; Ohkura, T. Development of shoreline extraction method based on spatial pattern analysis of satellite SAR images. Remote Sens. 2018, 10, 1361. [Google Scholar] [CrossRef] [Green Version]
  49. Loiotine, L.; Andriani, G.F.; Jaboyedoff, M.; Parise, M.; Derron, M.H. Comparison of remote sensing techniques for geostructural analysis and cliff monitoring in coastal areas of high tourist attraction: The case study of polignano a mare (southern Italy). Remote Sens. 2021, 13, 5045. [Google Scholar] [CrossRef]
  50. Toure, S.; Diop, O.; Kpalma, K.; Maiga, A. Shoreline Detection using Optical Remote Sensing: A Review. ISPRS Int. J. Geo-Inf. 2019, 8, 75. [Google Scholar] [CrossRef] [Green Version]
  51. De Sanjosé Blasco, J.J.; Gómez-Lende, M.; Sánchez-Fernández, M.; Serrano-Cañadas, E. Monitoring retreat of coastal sandy systems using geomatics techniques: Somo Beach (Cantabrian Coast, Spain, 1875–2017). Remote Sens. 2018, 10, 1500. [Google Scholar] [CrossRef] [Green Version]
  52. Furmańczyk, K.; Dudzinska-Nowak, J. Przewidywanie wielkości erozji brzegu w rejonie miejscowości Trzęsacz [The prediction of shoreline erosion in the area of Trzęsacz]. In Zintegrowane Zarzadzanie Obszarami Przybrzeznymi w Polsce—Stan Obecny i Perspektywy. Morze—Lad Wzajemne Relacje; Uniwersytet Szczeciński: Szczecin, Poland, 2006. [Google Scholar]
  53. Furmanczyk, K.; Musielak, S.; Prajs, J. Remote sensing characteristics of dynamics of Hel’s Penisula fragment of shore line. In Proceedings of the 11th EARSel Symposium, Graz, Austria, 1–5 July 1991; pp. 208–215. [Google Scholar]
  54. Leatherman, S.P. Shoreline Change Mapping and Management Along the U.S. East Coast. J. Coast. Res. 2003, 38, 5–13. [Google Scholar]
  55. Coyne, A.M.A.; Fletcher, C.H.; Richmond, B.M. Mapping Coastal Erosion Hazard Areas in Hawaii: Observations and Errors. J. Coast. Res. 1999, 28, 171–184. [Google Scholar] [CrossRef]
  56. Orviku, K.; Jaagus, J.; Kont, A.; Ratas, U.; Rivis, R. Increasing activity of coastal processes associated with climate change in Estonia. J. Coast. Res. 2003, 19, 364–375. [Google Scholar]
  57. Dailidiené, I.; Davuliené, L.; Tilickis, B.; Stankevičius, A.; Myrberg, K. Sea level variability at the Lithuanian coast of the Baltic Sea. Boreal Environ. Res. 2006, 11, 109–121. [Google Scholar]
  58. Reis, H.Ç.; Bozkurt, S.; Bayram, B.; Oğurlu, M.; Şeker, D.Z.; Janpaule, I. Shoreline Extraction and Change Detection using 1:5000 Scale Orthophoto Maps: A Case Study of Latvia-Riga. Int. J. Environ. Geoinformatics 2018, 2, 1–6. [Google Scholar] [CrossRef] [Green Version]
  59. Samuelsson, M.; Stigebrandt, A. Main characteristics of the long-term sea level variability in the Baltic sea. Tellus Ser. A Dyn. Meteorol. Oceanogr. 1996, 48, 672–683. [Google Scholar] [CrossRef] [Green Version]
  60. Ryabchuk, D.; Kolesov, A.; Chubarenko, B.; Spiridonov, M.; Kurennoy, D.; Soomere, T. Coastal erosion processes in the eastern Gulf of Finland and their links with geological and hydrometeorological factors. Boreal Environ. Res. 2011, 16, 117–137. [Google Scholar]
  61. Ato Armah, F. GIS-based Assessment of Short Term Shoreline Changes in the Coastal Erosion-Sensitive Zone of Accra, Ghana. Res. J. Environ. Sci. 2011, 5, 643–654. [Google Scholar] [CrossRef] [Green Version]
  62. Nicholls, R.J.; Townend, I.H.; Bradbury, A.P.; Ramsbottom, D.; Day, S.A. Planning for long-term coastal change: Experiences from England and Wales. Ocean Eng. 2013, 71, 3–16. [Google Scholar] [CrossRef]
  63. Miszalski, J. Współczesne Procesy Eoliczne na Pobrzeżu Słowińskim. Studium Fotointerpretacyjne [Present-Day Aeolian Processes on the Slovonian Coastline. A Photointerpretation Study]; IGiPZ PAN: Warszwa, Poland, 1973. [Google Scholar]
  64. Borówka, R.K. Present Day Dune Processes and Dune Morphology on the Łeba Barrier, Polish Coast of the Baltic. Geogr. Ann. Ser. A Phys. Geogr. 1980, 62, 75–82. [Google Scholar] [CrossRef]
  65. Musielak, S. Geneza i funkcjonowanie systemu przyrodniczego morskiej strefy brzegowej [Genesis and functioning of the natural system of the marine coastal zone]. In ZZOP w Polsce—Stan Obecny i Perspektywy, Brzeg Morski Zrównoważony, cz. 2; Uniwersytet Szczeciński: Szczecin, Poland, 2006. [Google Scholar]
  66. Borowka, M. Przebieg procesow deflacji I akumulacji na poweierzchni nadbrzeznych walow wydmowych [Deflation and accumulation processes on the surface of coastal dune ridges]. Badania Fizjogr. Pol. Zachodnia, Ser. A Geogr. Fiz. 1979, 32, 31–48. [Google Scholar]
  67. Rabski, K. Mezoklimatyczne tło obszaru Słowińskiego Parku Narodowego [The mesoclimatic background of the area of the Slovinski National Park]. Park. Nar. Rezerw. Przyr. 1992, 11, 37–54. [Google Scholar]
  68. Przygrodzki, P.; Letkiewicz, B. Charakterystyka wezbrań sztormowych wzdłuż polskiego wybrzeża Morza Bałtyckiego [Characteristics of storm surges along the Polish coast of the Baltic Sea]. Inżynieria Morska Geotech. 2015, 3, 158–165. [Google Scholar]
  69. Boniecka, H.; Gajda, A.; Gawlik, W.; Marcinkowsk, T.; Olszewski, T.; Szmytkiewicz, M.; Skaja, M.; Szmytkiewicz, P.; Chrząstkowska, N.; Piotrowska, D. Monitoring i Badania Dotyczące Aktualnego Stanu Brzegu Morskiego—Ocena Skuteczności Systemów Ochrony Brzegu Morskiego Zrealizowanych w Okresie Obowiązywania Wieloletniego, Programu Ochrony Brzegów MORSKICH” [Monitoring and research Concerning the Current State of the Sea Shore—Assessment of the Effectiveness of the Sea Shore Protection Systems Relized in the Period of Validity of the Long-Term “Programme of the Protection of Sea Shores”]; IBW PAN: Gdansk, Poland, 2013. [Google Scholar]
  70. Scott, T.; Masselink, G.; O’Hare, T.; Saulter, A.; Poate, T.; Russell, P.; Davidson, M.; Conley, D. The extreme 2013/2014 winter storms: Beach recovery along the southwest coast of England. Mar. Geol. 2016, 382, 224–241. [Google Scholar] [CrossRef] [Green Version]
  71. Formela, K.; Marsz, A.A. Zmienność liczby dni ze sztormem nad Bałtykiem (1971–2009) [Changeability in the number of days with gale over the Baltic Sea (1971–2009)]. Pr. Stud. Geogr. 2011, 47, 189–196. [Google Scholar]
  72. Miętus, M. Zagrożenia Wybrzeży i Pobrzeży Południowego Bałtyku WYNIKAJĄCE ze współczesnej Zmiany Klimatu [Threats to the coasts and shores of the southern Baltic Sea from contemporary climate change]—Uniwersytet Gdański. In Krajoznawstwo Pomorskie Wobec Wyzwań Współczesności; Wrzosek, R., Ed.; PTTK: Gdansk, Poland, 2020; ISBN 978-83-957233-0-8. [Google Scholar]
  73. Łabuz, T.A. Polish coastal dunes-affecting factors and morphology. Landf. Anal. 2013, 22, 33–59. [Google Scholar] [CrossRef]
  74. Uścinowicz, G.; Kramarska, R.; Kaulbarsz, D.; Jurys, L.; Frydel, J.; Przezdziecki, P.; Jegliński, W. Baltic Sea coastal erosion; a case study from the Jastrzębia Góra region. Geologos 2014, 20, 259–268. [Google Scholar] [CrossRef] [Green Version]
  75. Wolski, T.; Wiśniewski, B. Changes of maximum sea levels at selected gauge stations on the Polish and Swedish baltic coast. Stud. Pr. Wydz. Nauk Ekon. Zarządzania 2012, 29, 209–227. [Google Scholar]
  76. Zawadzka-Kahlau, E. Tendencje Rozwojowe Polskich Brzegów Bałtyku Południowego [Development Tendencies of the Polish Coasts of the Southern Baltic Sea]; Gdanskie Towarzystwo Naukowe: Gdansk, Poland, 1999. [Google Scholar]
  77. Zawadzka-Kahlau, E. Morphodynamics of the Southern Baltic Dune Coasts; Wydawnictwo Uniwersytetu Gdanskiego: Gdansk, Poland, 2012. [Google Scholar]
  78. Labuz, T.A. Brzegi wydmowe polskiego wybrzeza Baltyku. Czas. Geogr. 2005, 76, 19–47. [Google Scholar]
  79. Dubrawski, R.; Zawadzka-Kahlau, E. Przyszłość Ochrony Polskich Brzegów Morskich [The Future of Sea Shore Protection]; Zakład Wydawnictw Naukowych Instytutu Morskiego: Gdansk, Poland, 2006. [Google Scholar]
  80. Łabuz, T.A.; Kowalewska-Kalkowska, H. Coastal erosion caused by the heavy storm surge of November 2004 in the southern Baltic sea. Clim. Res. 2011, 48, 93–101. [Google Scholar] [CrossRef]
  81. Łabuz, T.A. Coastal Response to Climatic Changes: Discussion with Emphasis on Southern Baltic Sea. Landf. Anal. 2012, 21, 43–55. [Google Scholar]
  82. Michalowska, K.; Glowienka, E.; Pekala, A. Spatial-Temporal Detection of Changes on the Southern Coast of the Baltic Sea Based on Multitemporal Aerial Photographs. Int. Arch. Photogramm. Remote Sens. Spat. Inf. Sci. 2016, XLI-B2, 49–53. [Google Scholar] [CrossRef] [Green Version]
  83. Zhang, W.; Schneider, R.; Kolb, J.; Teichmann, T.; Dudzinska-Nowak, J.; Harff, J.; Hanebuth, T.J.J. Land-sea interaction and morphogenesis of coastal foredunes—A modeling case study from the southern Baltic Sea coast. Coast. Eng. 2015, 99, 148–166. [Google Scholar] [CrossRef]
  84. Wiśniewski, B.; Wolski, T. Katalogi Wezbrań i Obniżeń Sztormowych Poziomów Morza Oraz Ekstremalne Poziomy Wód na Polskim Wybrzeżu [Catalogues of SEA level Storm Surges and Falls and Extreme Water Levels on the Polish Coast]; Wyd. Nauk. Akad. Mors.; Maritime University of Szczecin: Szczecin, Poland, 2009. [Google Scholar]
  85. Rotnicki, K. Problem holoceńskiej transgresji Bałtyku Południowego na wybrzeżu środkowym Polski w świetle nowych danych z obszaru Niziny Gardzieńsko-Łebskiej [Problem of the Holocene transgressions along the Polish Baltic middle coast in the light of new data from Gardno–Łeba]. In Ewolucja Geosystemów Nadmorskich Południowego Bałtyku; Bogucki Wydawnictwo Naukowe: Poznan, Poland, 1999; pp. 121–140. [Google Scholar]
  86. Marsz, A. Charakterystyka geomorfologiczna Mierzei Lebskiej i Niziny Gardensko-Lebskiej [Geomorphological characteristics of the Łeba Barrier and the Gardens-Lebsk Lowland]. In Materiały Konferencji Terenowej: Gleby Słowińskiego Parku Narodowego; PTGleb.: Poznan, Poland, 1975; pp. 7–25. [Google Scholar]
  87. Sztobryn, M.; Stigge, H.J.; Wielbińska, D.; Weidig, B.; Stanisławczyk, I.; Kańska, A.; Krzysztofik, K.; Kowalska, B.; Letkiewicz, B.; Mykita, M. Storm surges in the southern Baltic (western and central parts). Bund. Seesch. Hydrogr. Rep. 2004, 39, 74. [Google Scholar]
  88. Furmanczyk, K.; Dudzinska-Nowak, J. Effects of extreme storms on coastline changes: A southern Baltic example. J. Coast. Res. 2009, 56, 1637–1640. [Google Scholar]
  89. Harff, J.; Deng, J.; Dudzińska-Nowak, J.; Fröhle, P.; Groh, A.; Hünicke, B.; Soomere, T.; Zhang, W. What determines the change of coastlines in the baltic sea? In Coastal Research Library; Springer: Cham, Switzerland, 2017; Volume 19, pp. 15–35. [Google Scholar]
  90. Łabuz, T.A.; Kowalewska-Kalkowska, H. Coastal abrasion of the Świna Gate Sandbar (Pomeranian Bay coast) caused by the heavy storm surge on 15 October 2009. In Proceedings of the Storm Surges Congress 2010, Hamburg, Germany, 13–17 September 2010. [Google Scholar]
Figure 1. Study area: (a) Baltic Sea; (b) Location of examined part of the Polish Baltic Sea coast. The base map—Google Satellite.
Remotesensing 14 01212 g001
Figure 2. Foredune toe lines in following years on the orthophotomap from 2010. The position of the foredune toe line reflects the course of the shoreline in the given years.
Remotesensing 14 01212 g002
Figure 3. The route of the reference line (RL)—Polish Maritime Office’s Kilometer line (MOK), (a) along the examined coast section of the Baltic Sea, the base map—OpenStreetMap, (b) The routes of the selected part of RL and FTL line in year 2010 (red color)—the base map—orthophotomap dated 2010.
Remotesensing 14 01212 g003
Figure 4. Transects perpendicular to the reference line (MOK) determined at intervals of 10 m. The distance was defined as the reference line—foredune toe lines in a given year: RL-FTL 2010; RL-FTL 1975. The base map—orthophotomap dated 2010.
Remotesensing 14 01212 g004
Figure 5. The vectors of intersecting foredune toe lines from 1951 and 2016 create polygons (closed areas), which were used to calculate the size of the accumulated and eroded areas. The base map/orthophotomap dated 2010.
Remotesensing 14 01212 g005
Figure 6. Graph of the changes in accumulated and eroded areas [ha] from 1951–2016 and the average area [ha] per year (188–218 km).
Remotesensing 14 01212 g006
Figure 7. Graphs of the changes in the accumulated and eroded areas in subsequent time intervals (periods close to a decade) on the studied part of the coast (188–218 km according to MOK).
Remotesensing 14 01212 g007
Figure 8. Graphs of the changes in the accumulated and eroded areas in two 6 year time intervals (2004–2010 and 2010–2016) on the studied part of the coast (188–218 km according to MOK).
Remotesensing 14 01212 g008
Figure 9. Total area of coastal change in subsequent time intervals.
Remotesensing 14 01212 g009
Figure 10. Map of total change in the shoreline from 1951 to 2016. The base map—OpenStreetMap.
Remotesensing 14 01212 g010
Table 1. The characteristics of source aerial images (1951–2004) and source orthophotomaps (2010, 2016).
Year19511964197519841995200420102016
Camera typeRC-5RC-8RC-5/8RC-10RC-20RC-20--
Format (cm)18 × 1823 × 2323 × 2323 × 2323 × 2323 × 23--
Scale1:25,0001:23,0001:29,5001:25,0001:26,0001:26,000--
Pixel size (μm)141414142114--
SourcediapositivediapositivediapositivediapositivedigitaldigitaldigitalWMS
Table 2. Results of the aerotriangulation process for images for subsequent years.
Year195119641975198419952004
Number of photos in block523624394636
Number of used GCPs455961696159
RMS X (m)0.360.450.360.410.110.37
RMS Y (m)0.460.440.310.420.100.37
RMS Z (m)0.460.450.430.360.220.28
Table 3. Area of coastal changes in subsequent time series: value of accumulated and eroded area, total area of changes, and the balance of the impact of morphodynamic processes on the studied part of the coast.
Nature of ChangesArea of Coastal Changes in Subsequent Time Series
1951–19641964–19751975–19841984–19951995–20042004–20162004–20102010–2016
Accumulation(ha)30.8339.9727.3123.2639.1714.2011.967.66
(%)5361474075273131
Erosion(ha)−27.33−26.05−30.89−35.47−12.85−38.17−26.94−17.41
(%)4739536025736969
Total area(ha)58.1666.0158.2058.7352.0152.3738.9025.07
Budget(m)3.513.92−3.59−12.2126.32−23.97−14.98−9.75
Publisher’s Note: MDPI stays neutral with regard to jurisdictional claims in published maps and institutional affiliations.

