
Study of Atmospheric Carbon Dioxide Retrieval Method Based on Normalized Sensitivity


Abstract
:
1. Introduction
2. Data and Methods
2.1. Data
2.1.1. GOSAT Data
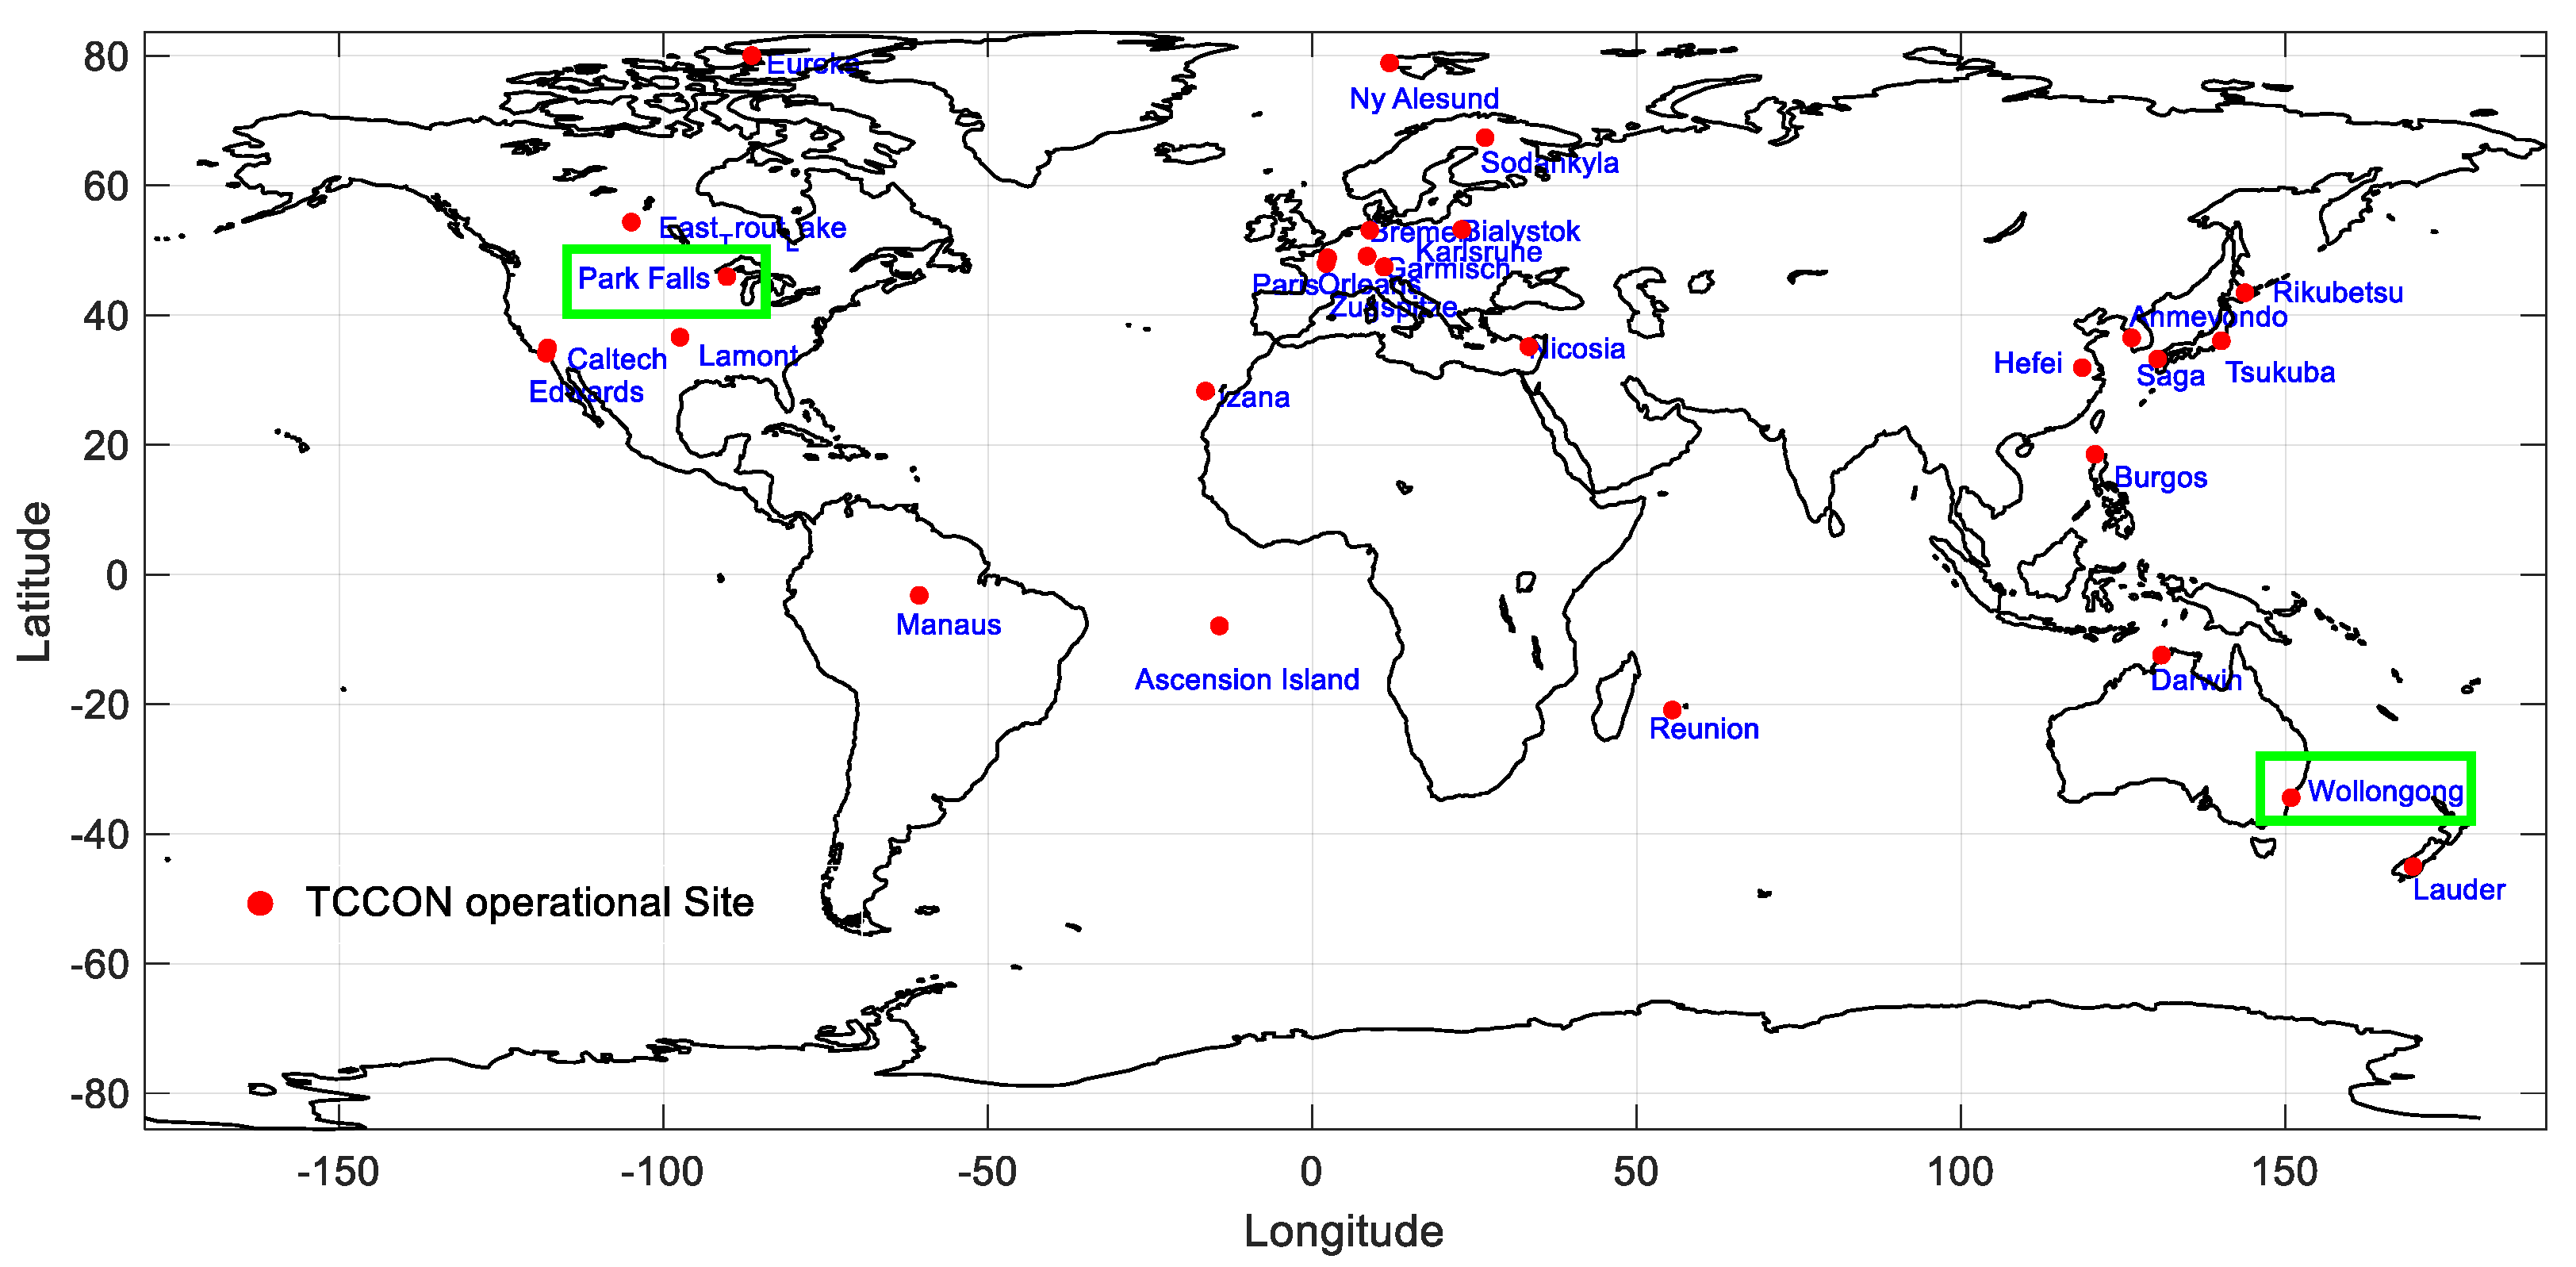
2.1.2. TCCON
2.2. Methods
2.2.1. SCIATRAN Model
2.2.2. Normalized Analysis Method
2.2.3. Band Ratio Method (BRM)
2.2.4. Validation Method
3. Results
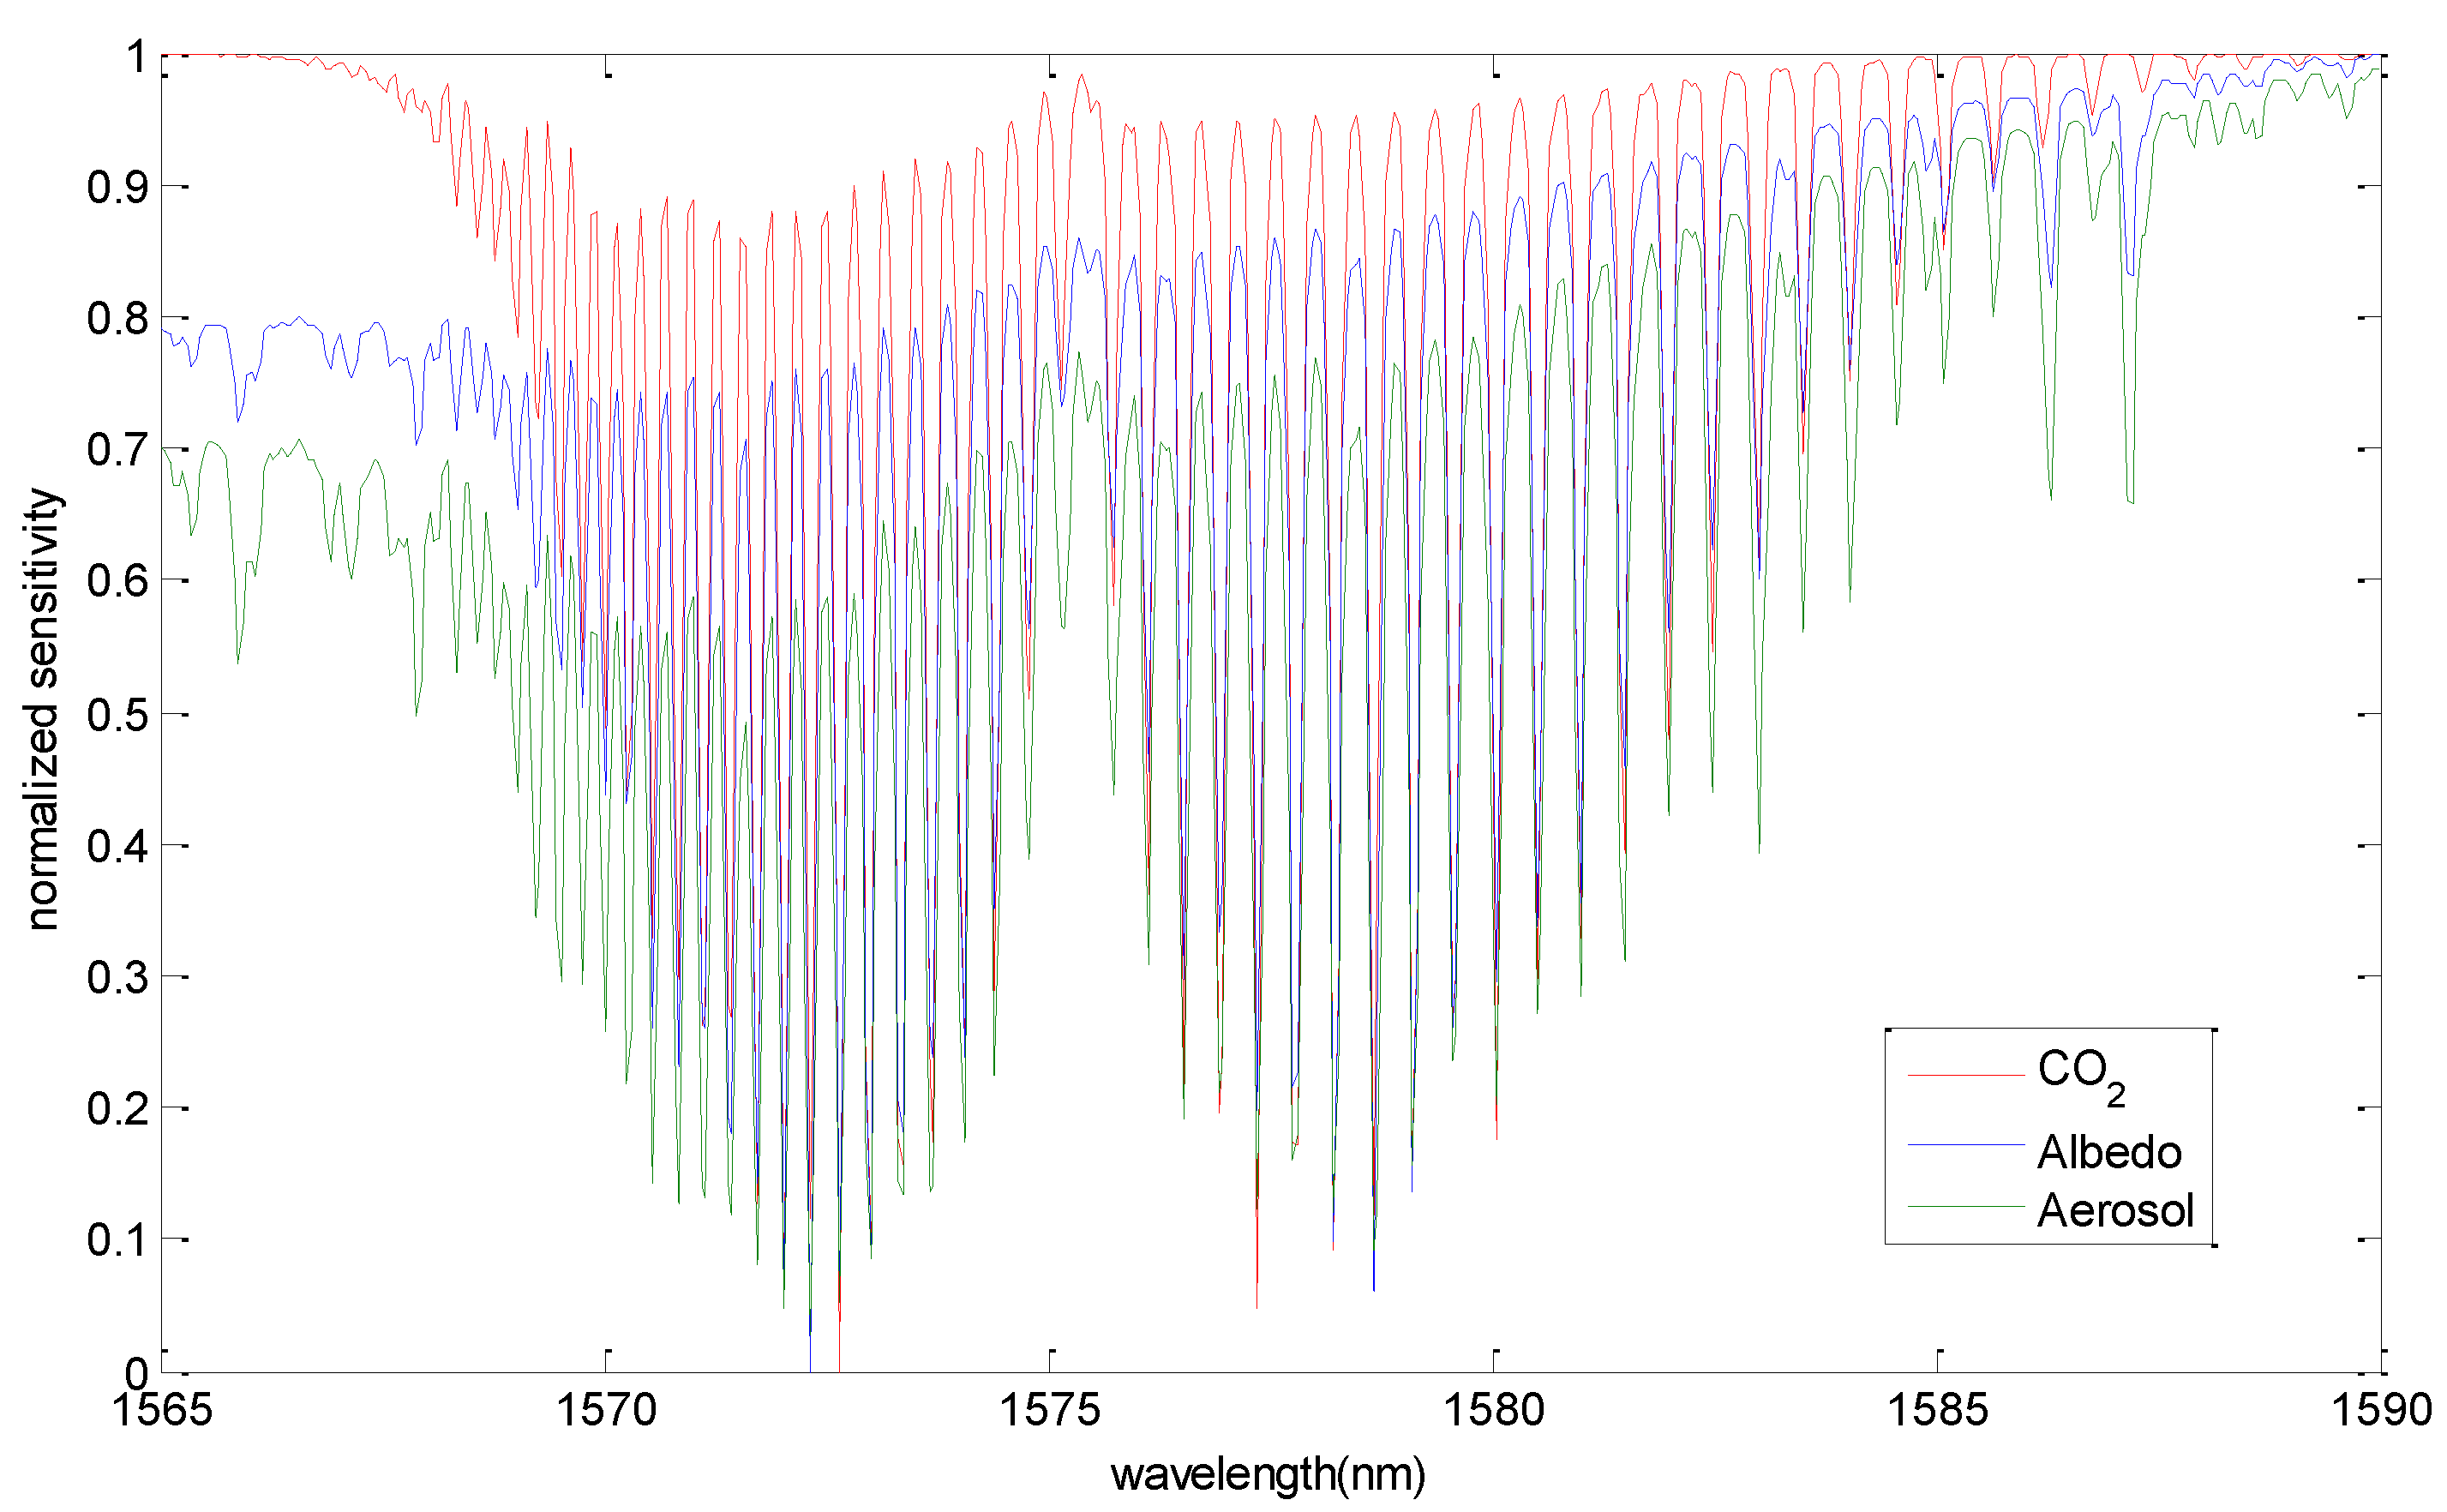
3.1. Sensitivity Analysis
3.1.1. CO2 Concentration Sensitivity Analysis
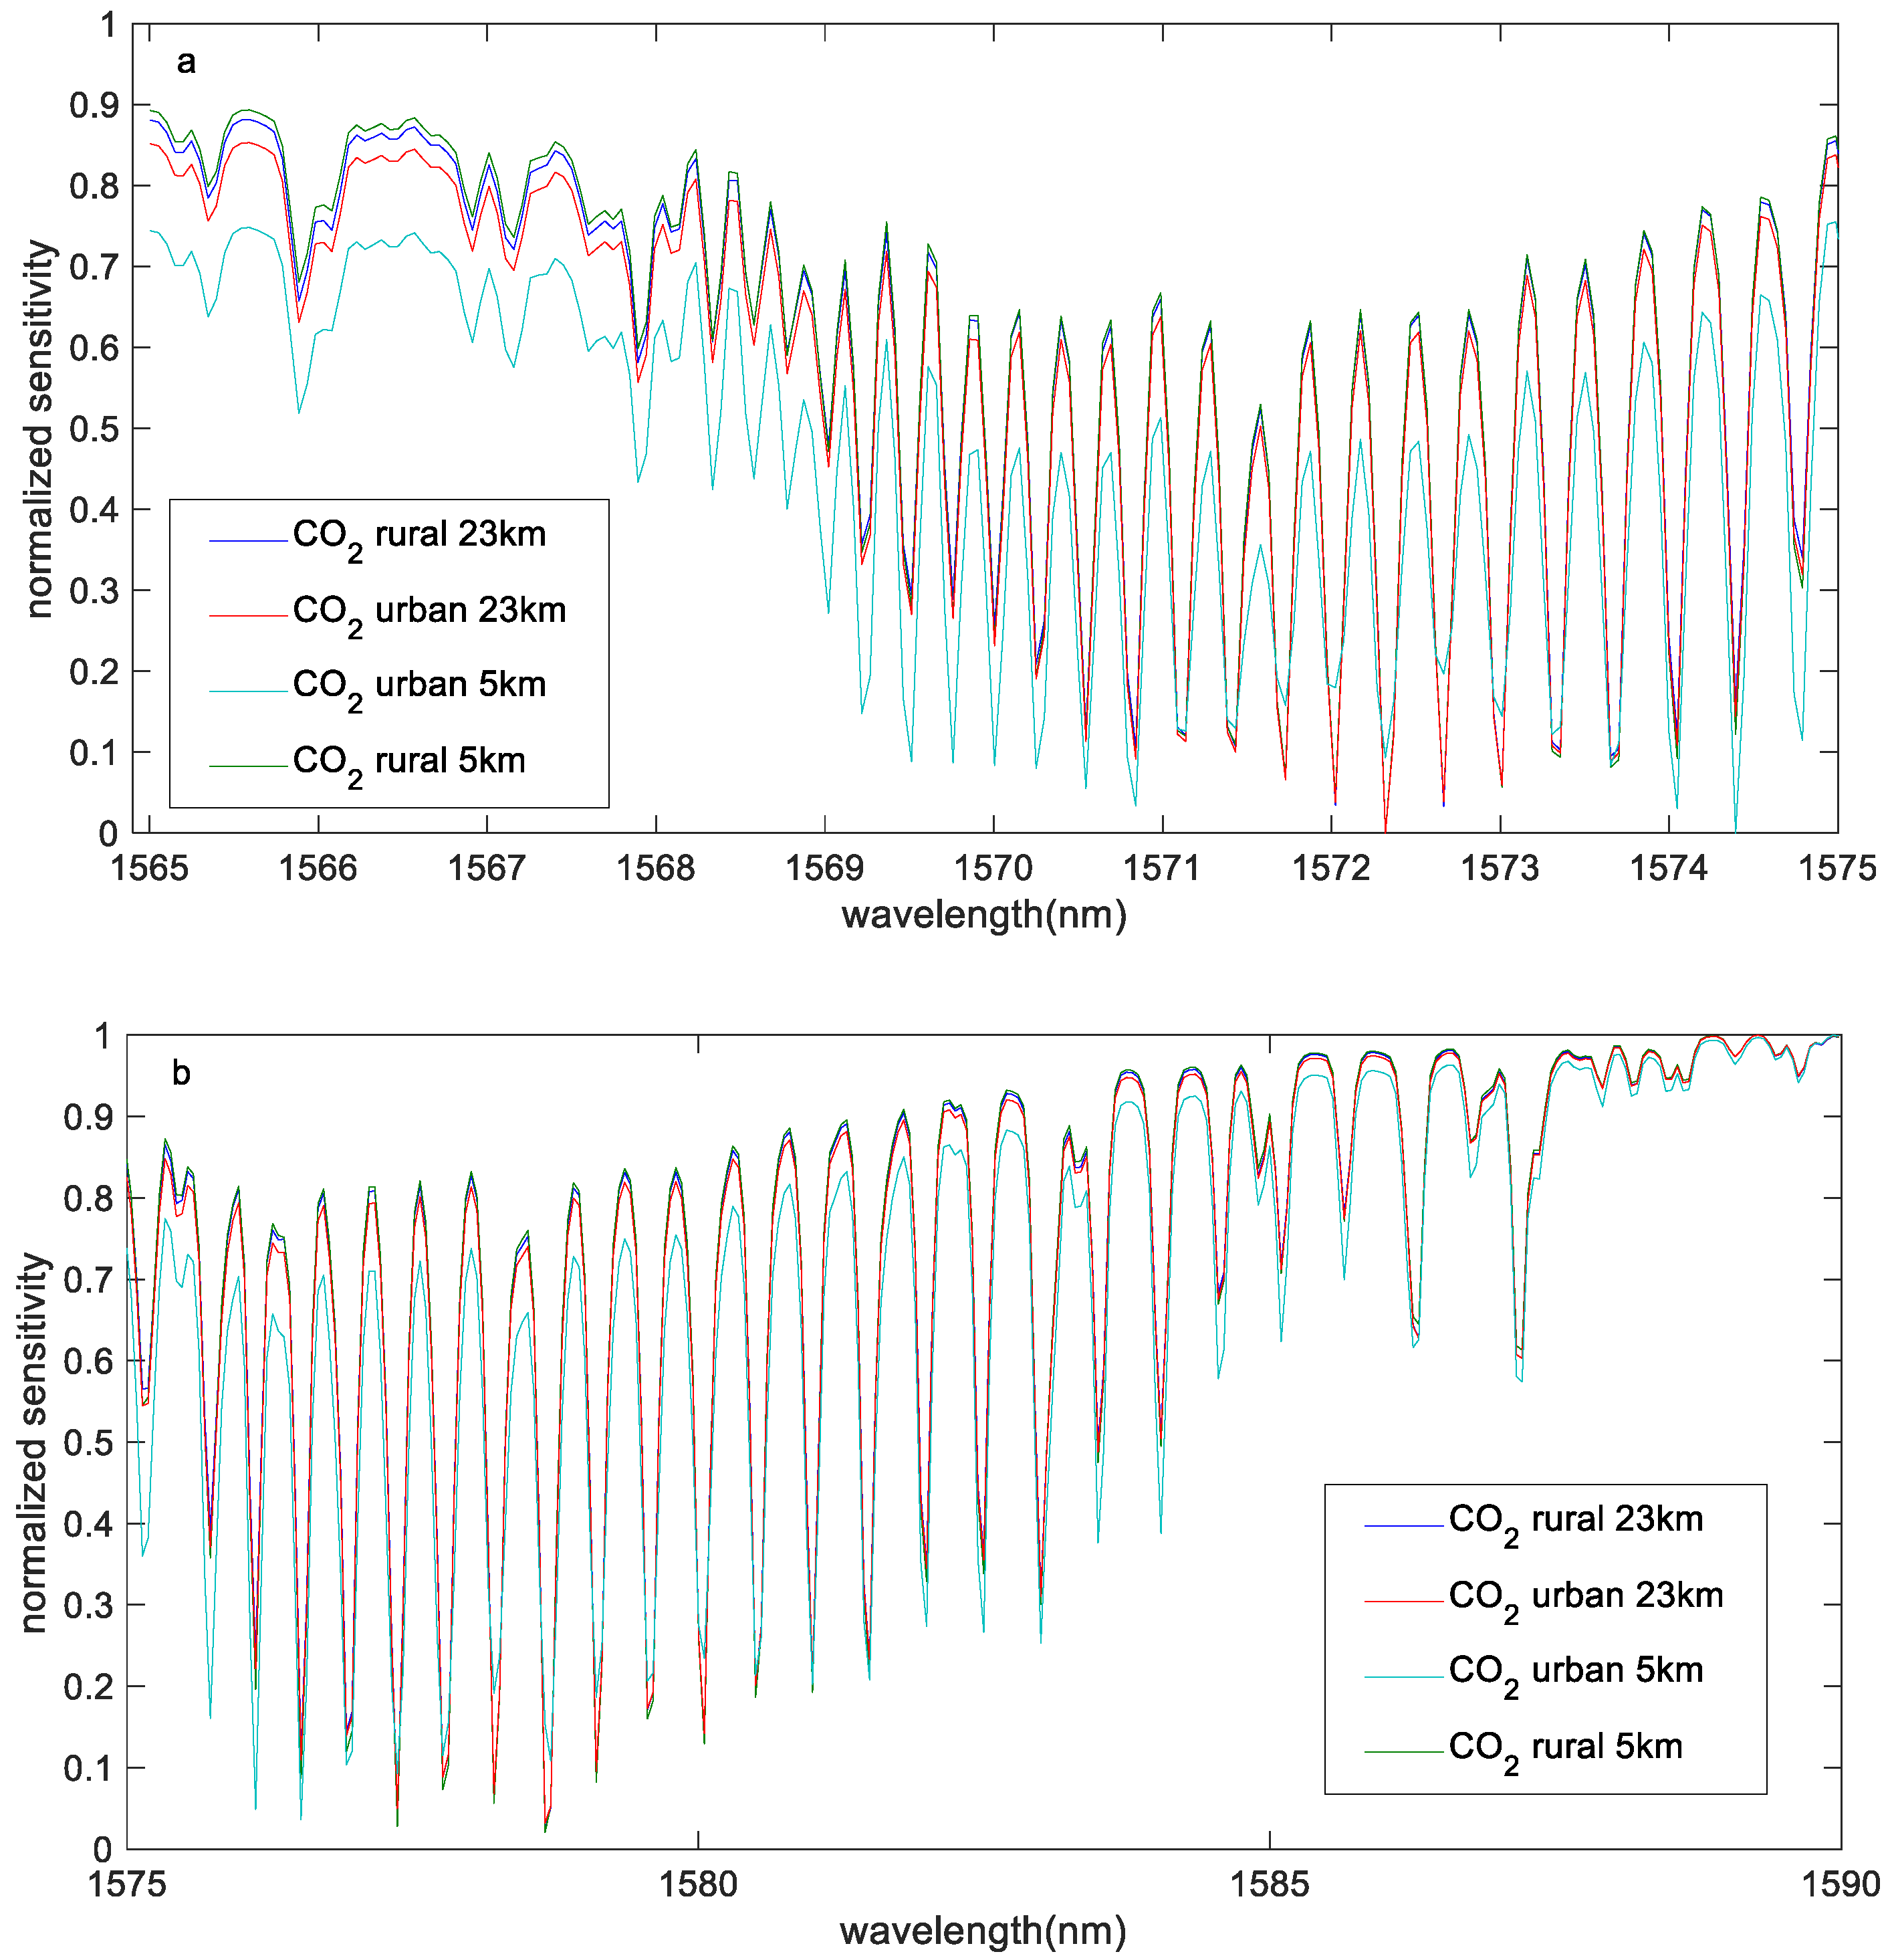
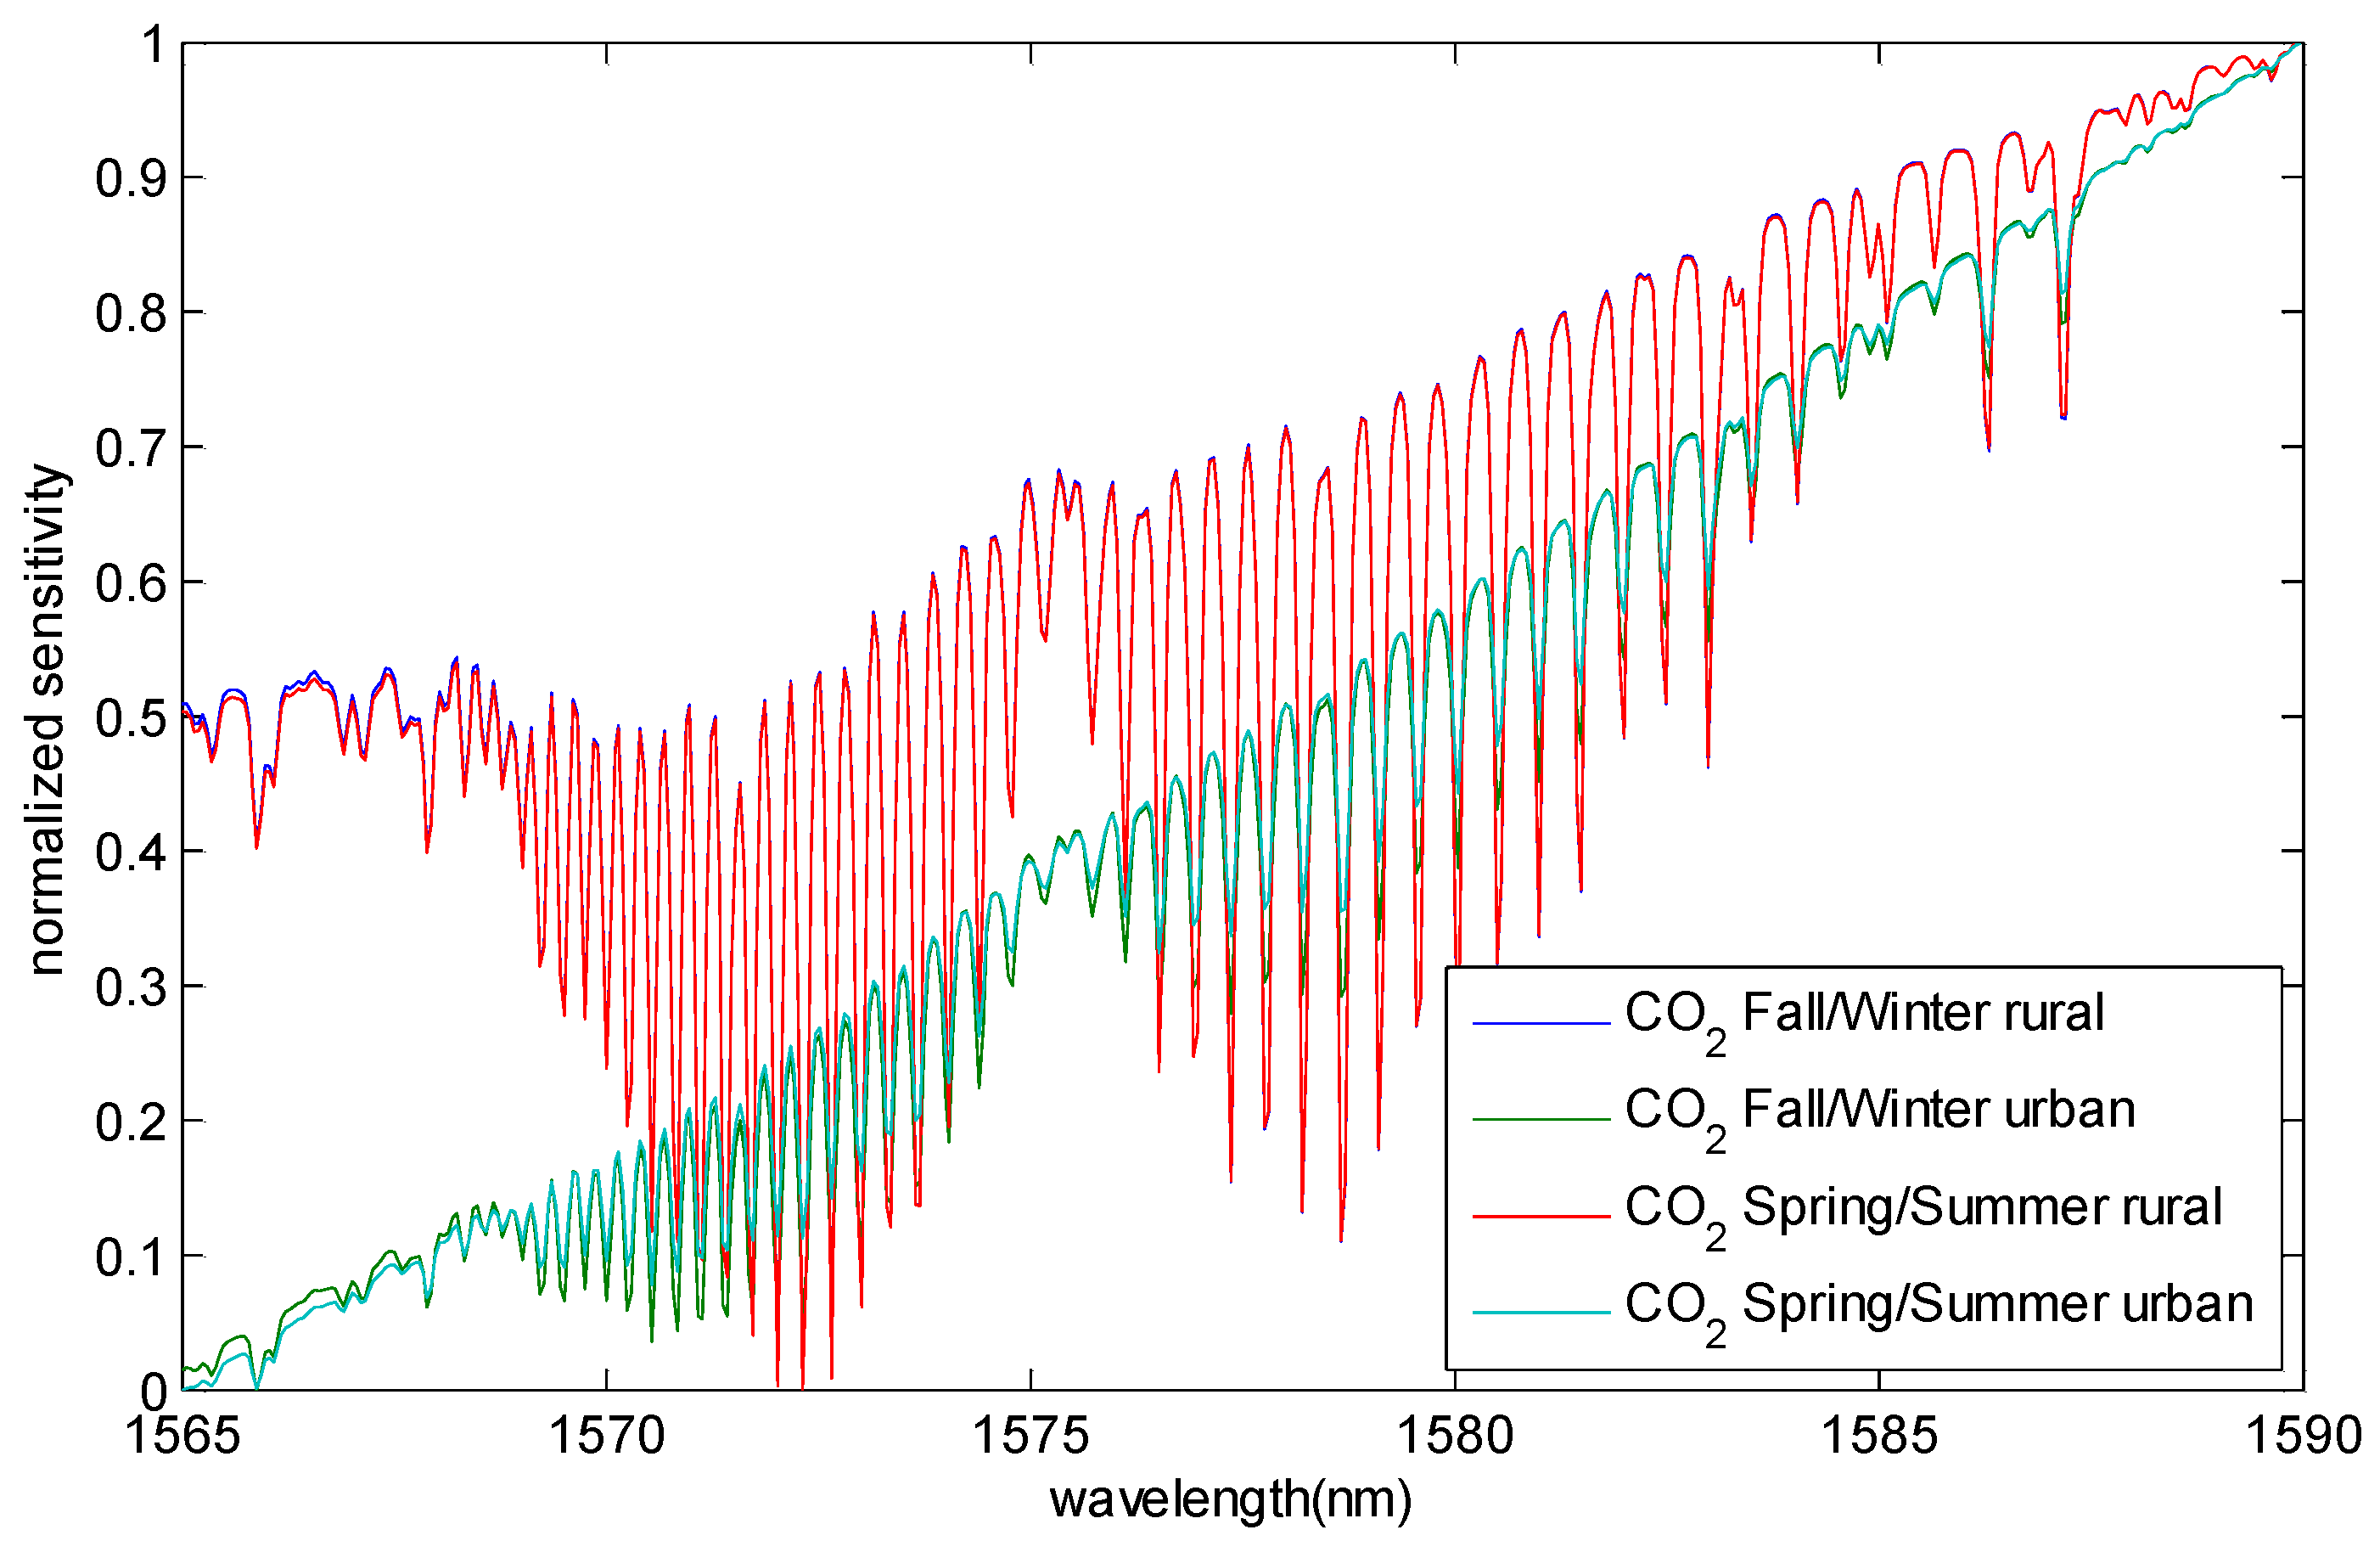
3.1.2. Aerosol Sensitivity Analysis
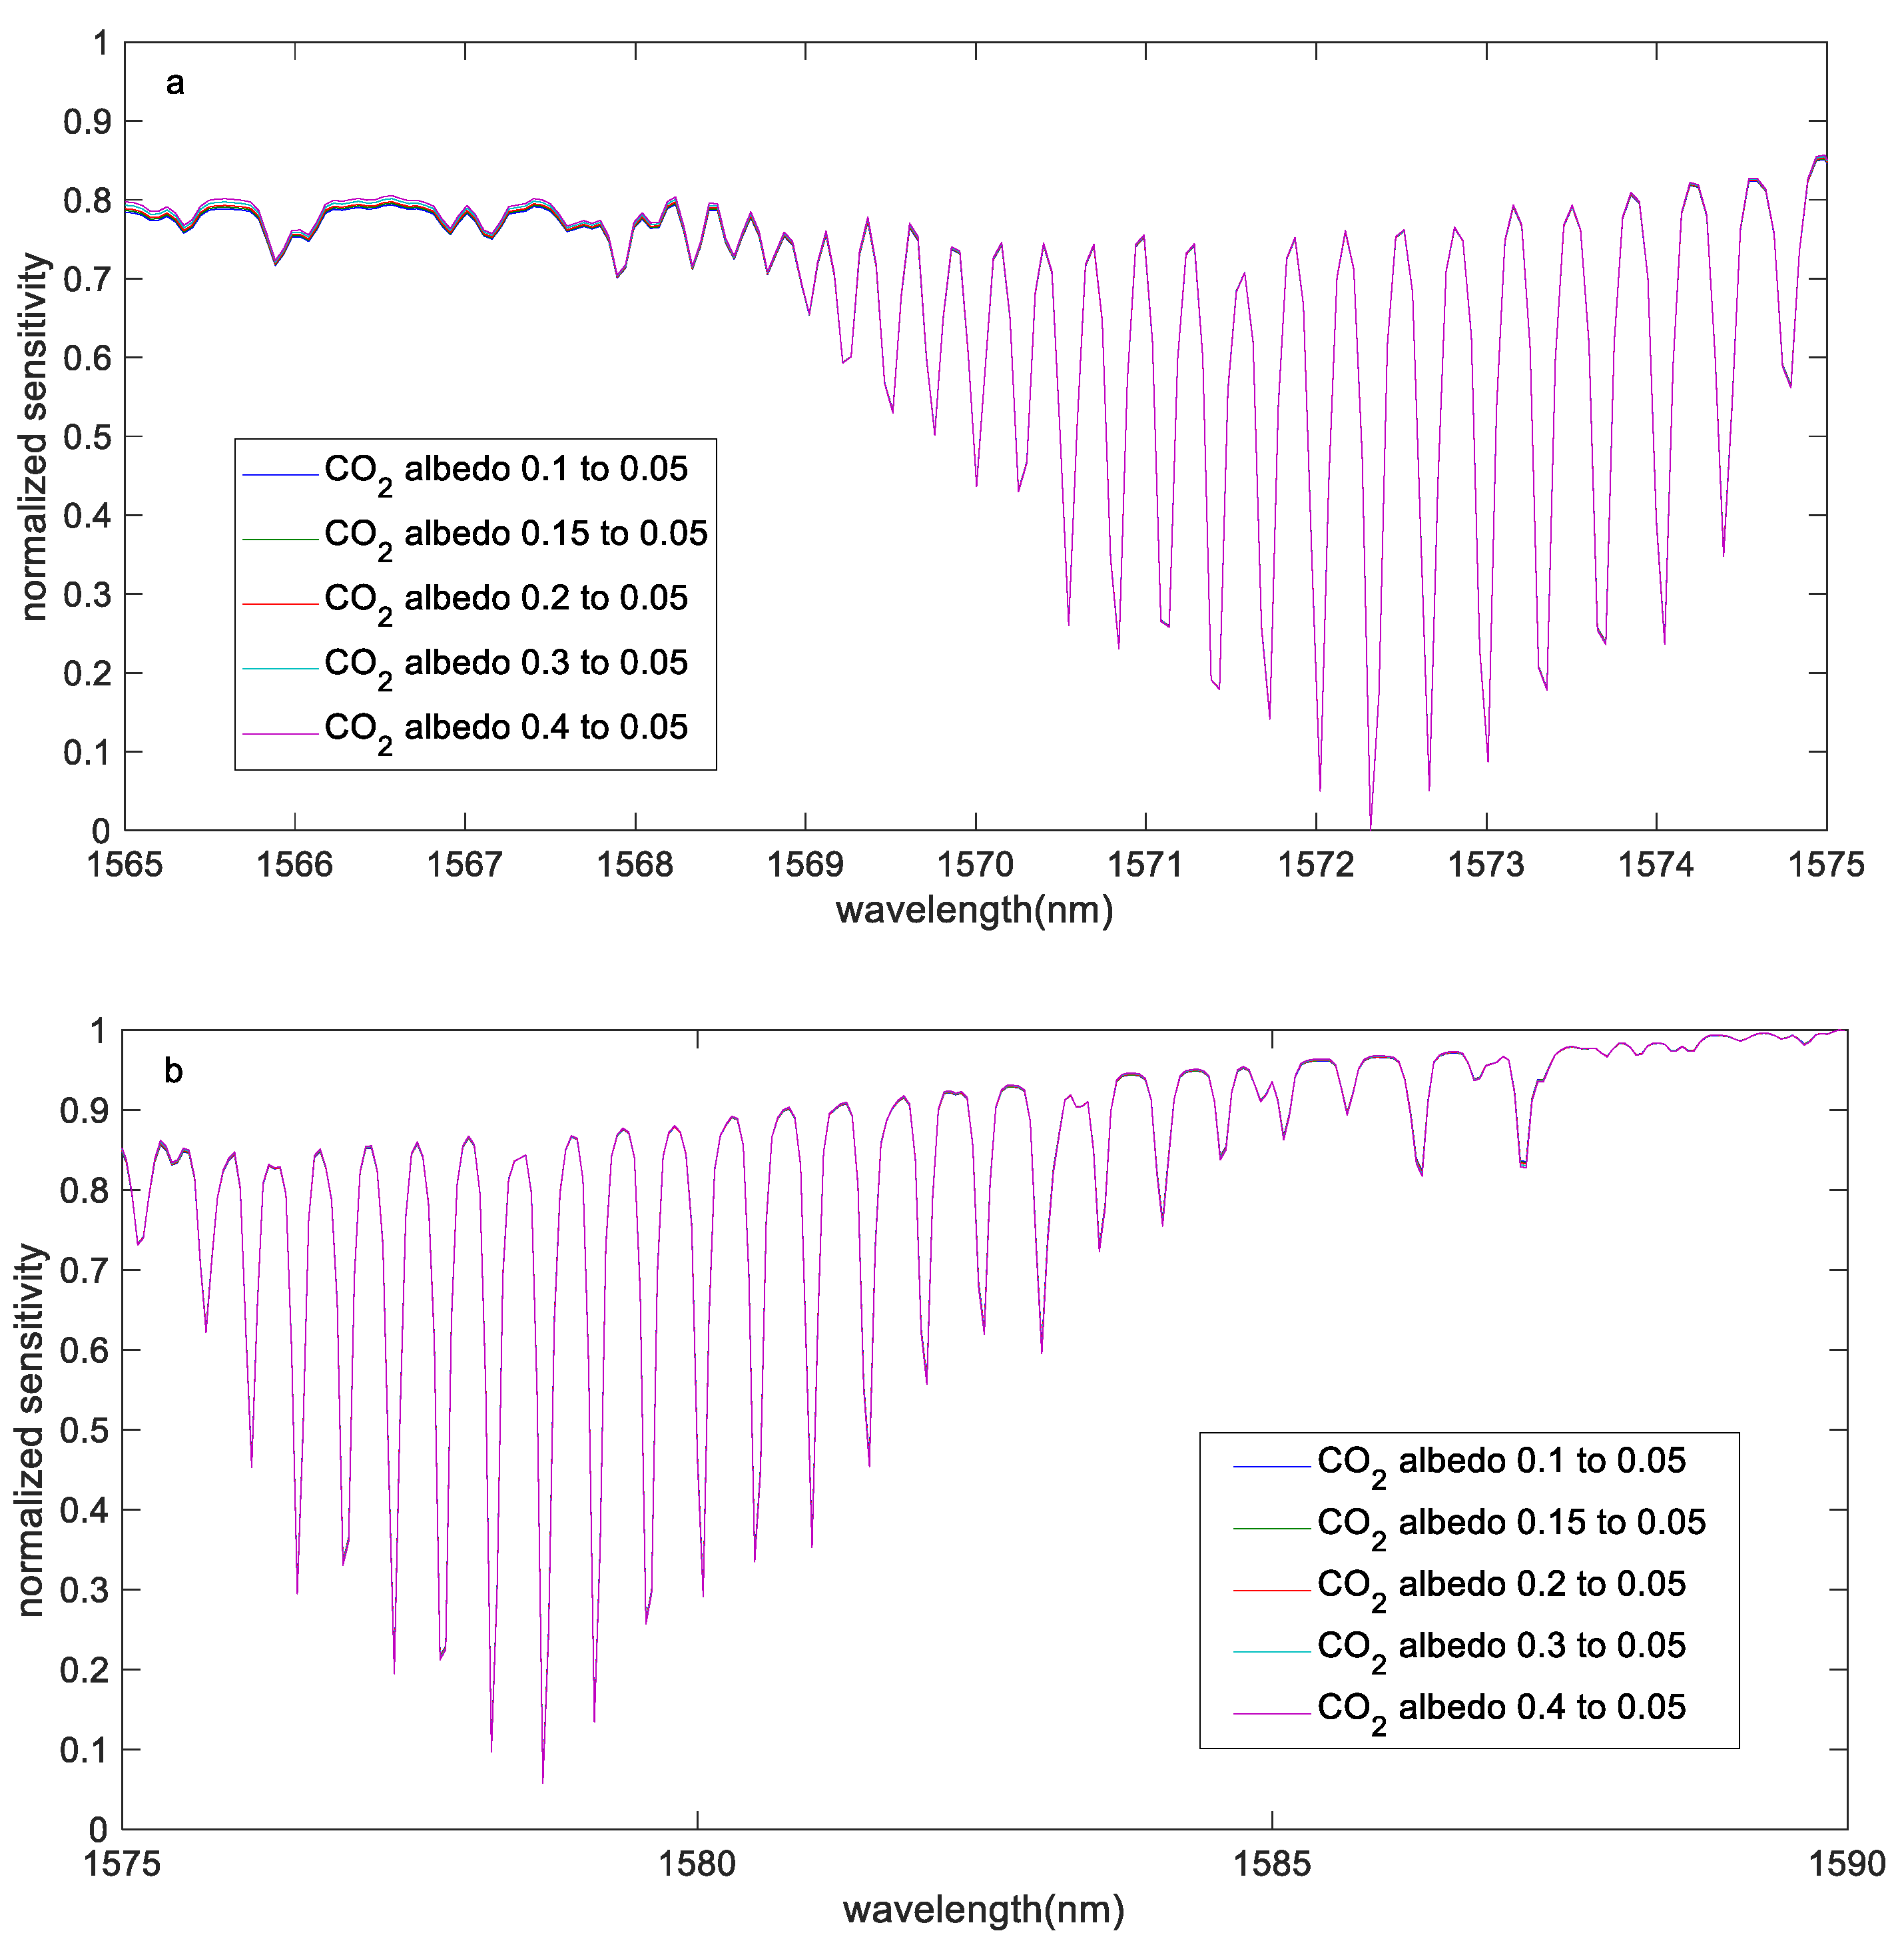
3.1.3. Albedo Sensitivity Analysis
3.1.4. Water Vapor Profile Sensitivity Analysis
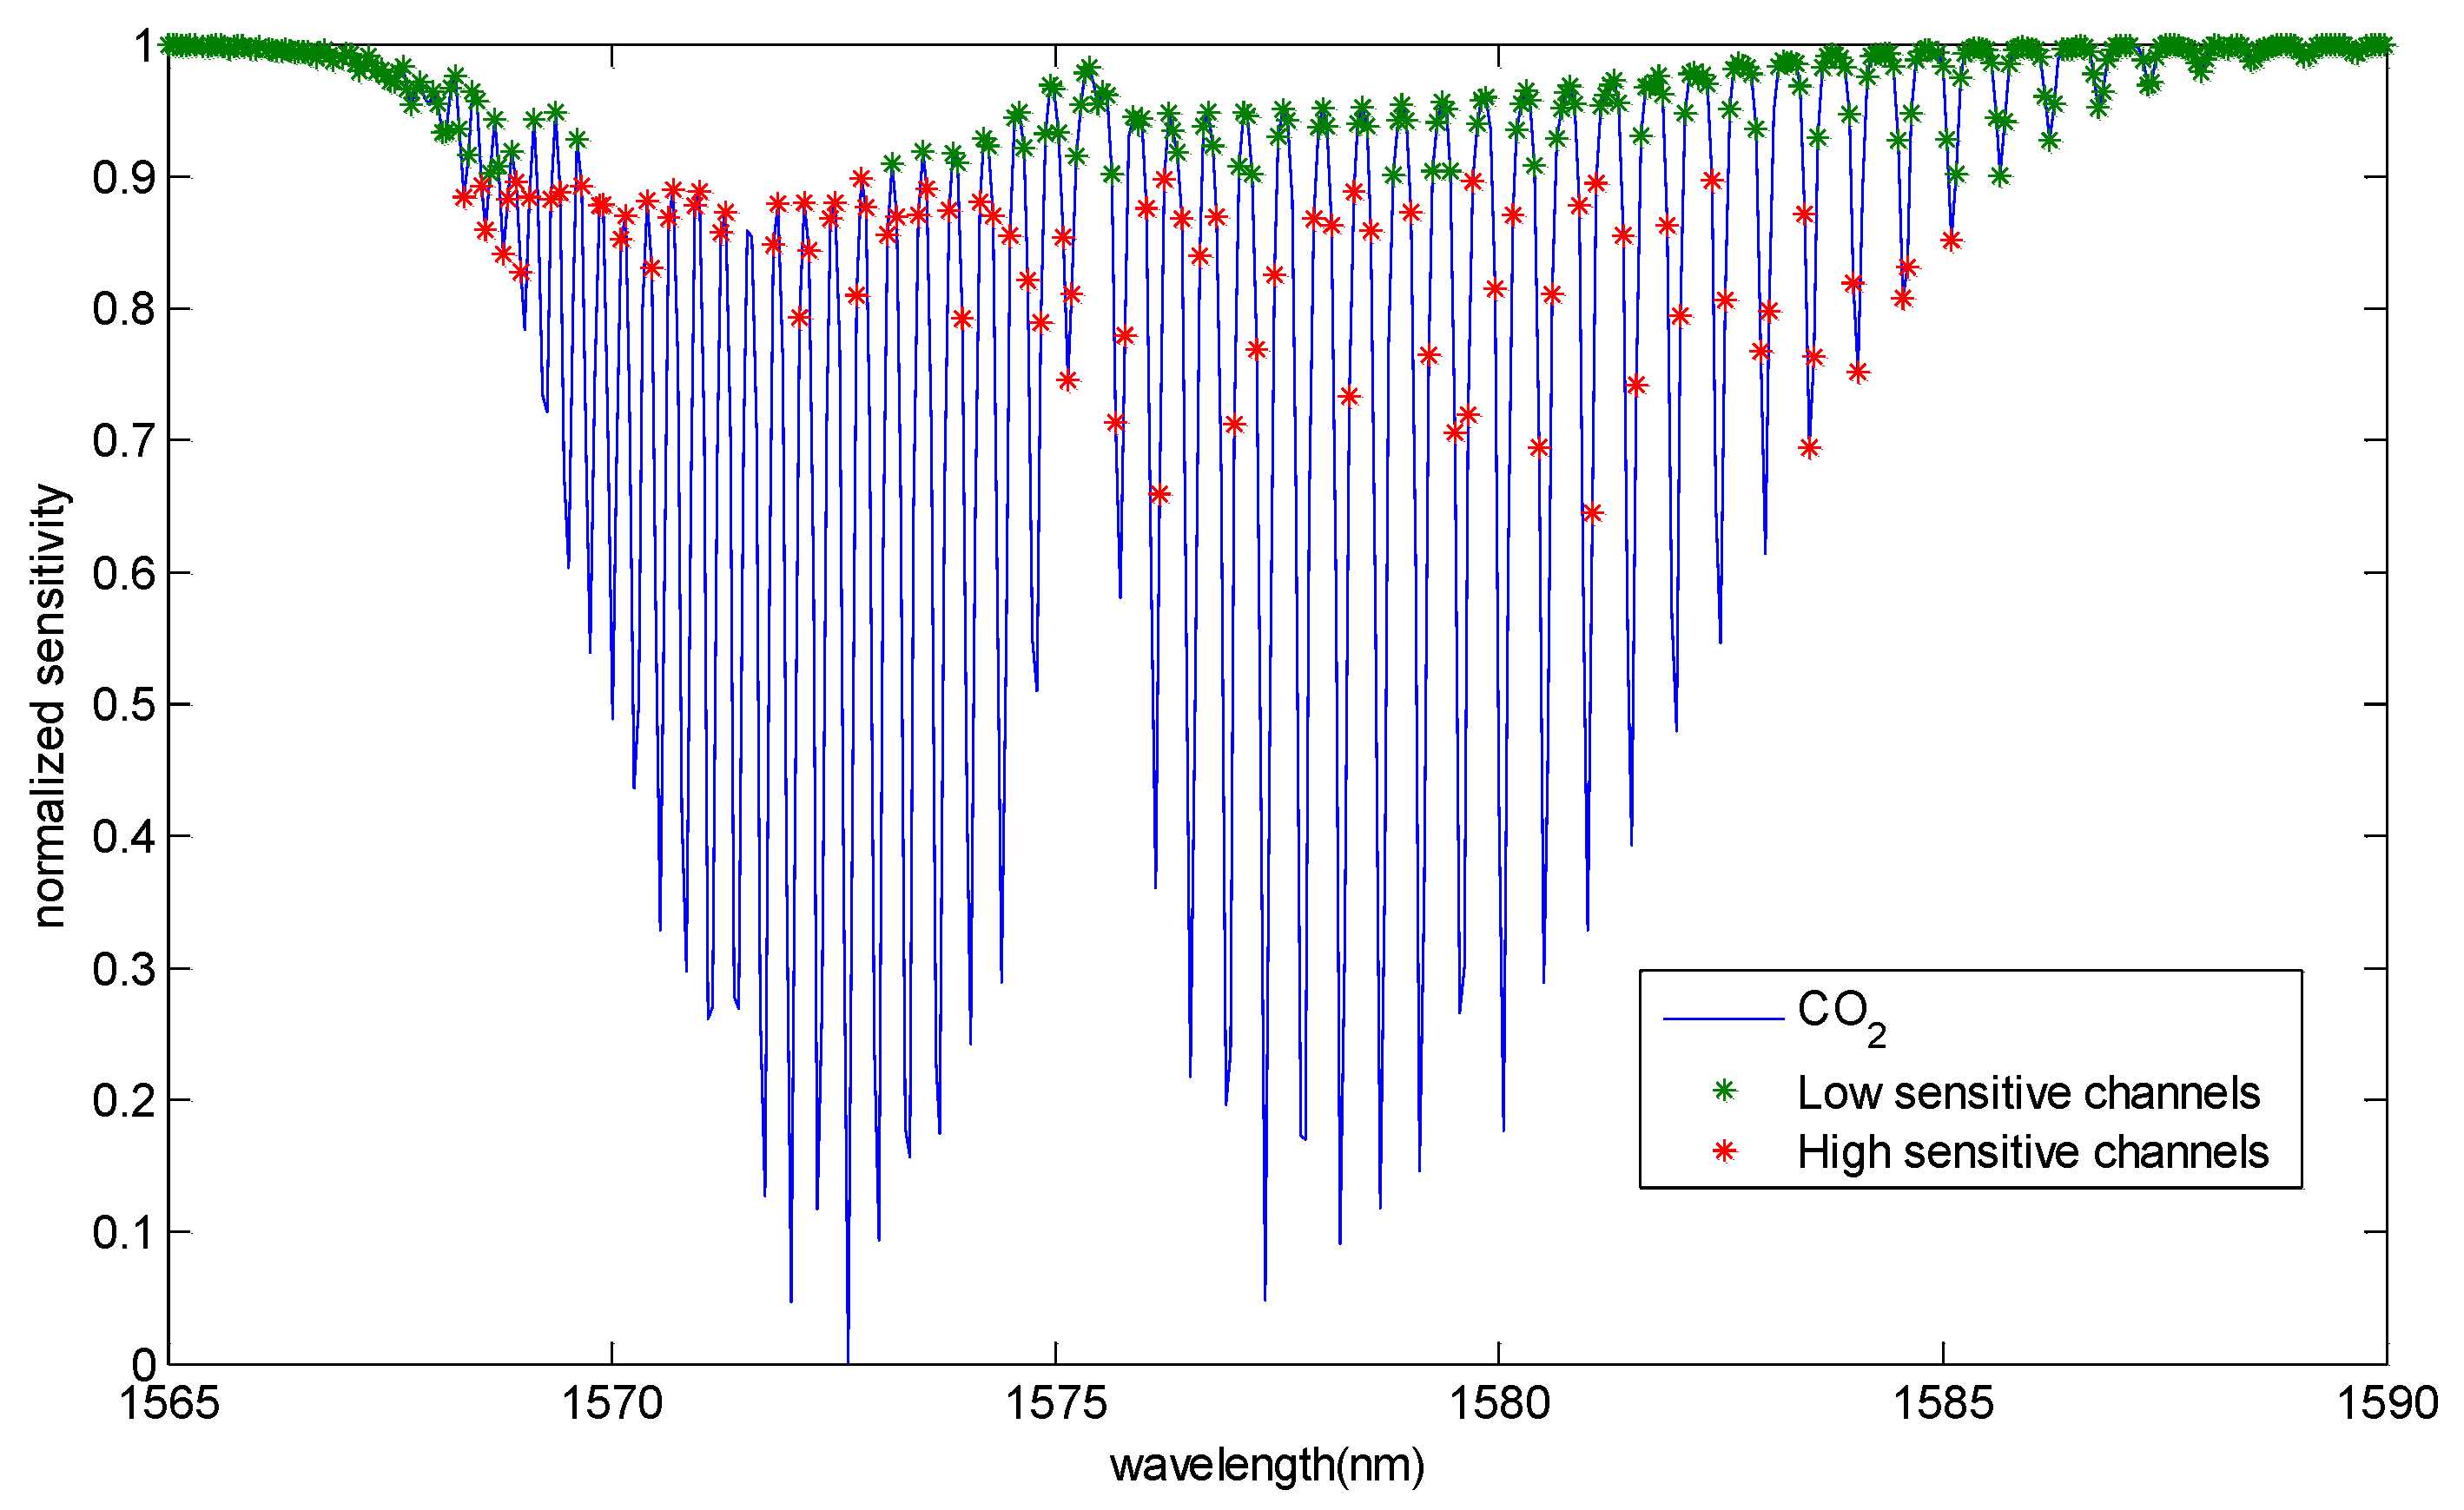
3.2. Retrieval Channel Selection
3.3. Retrieval Error Analysis
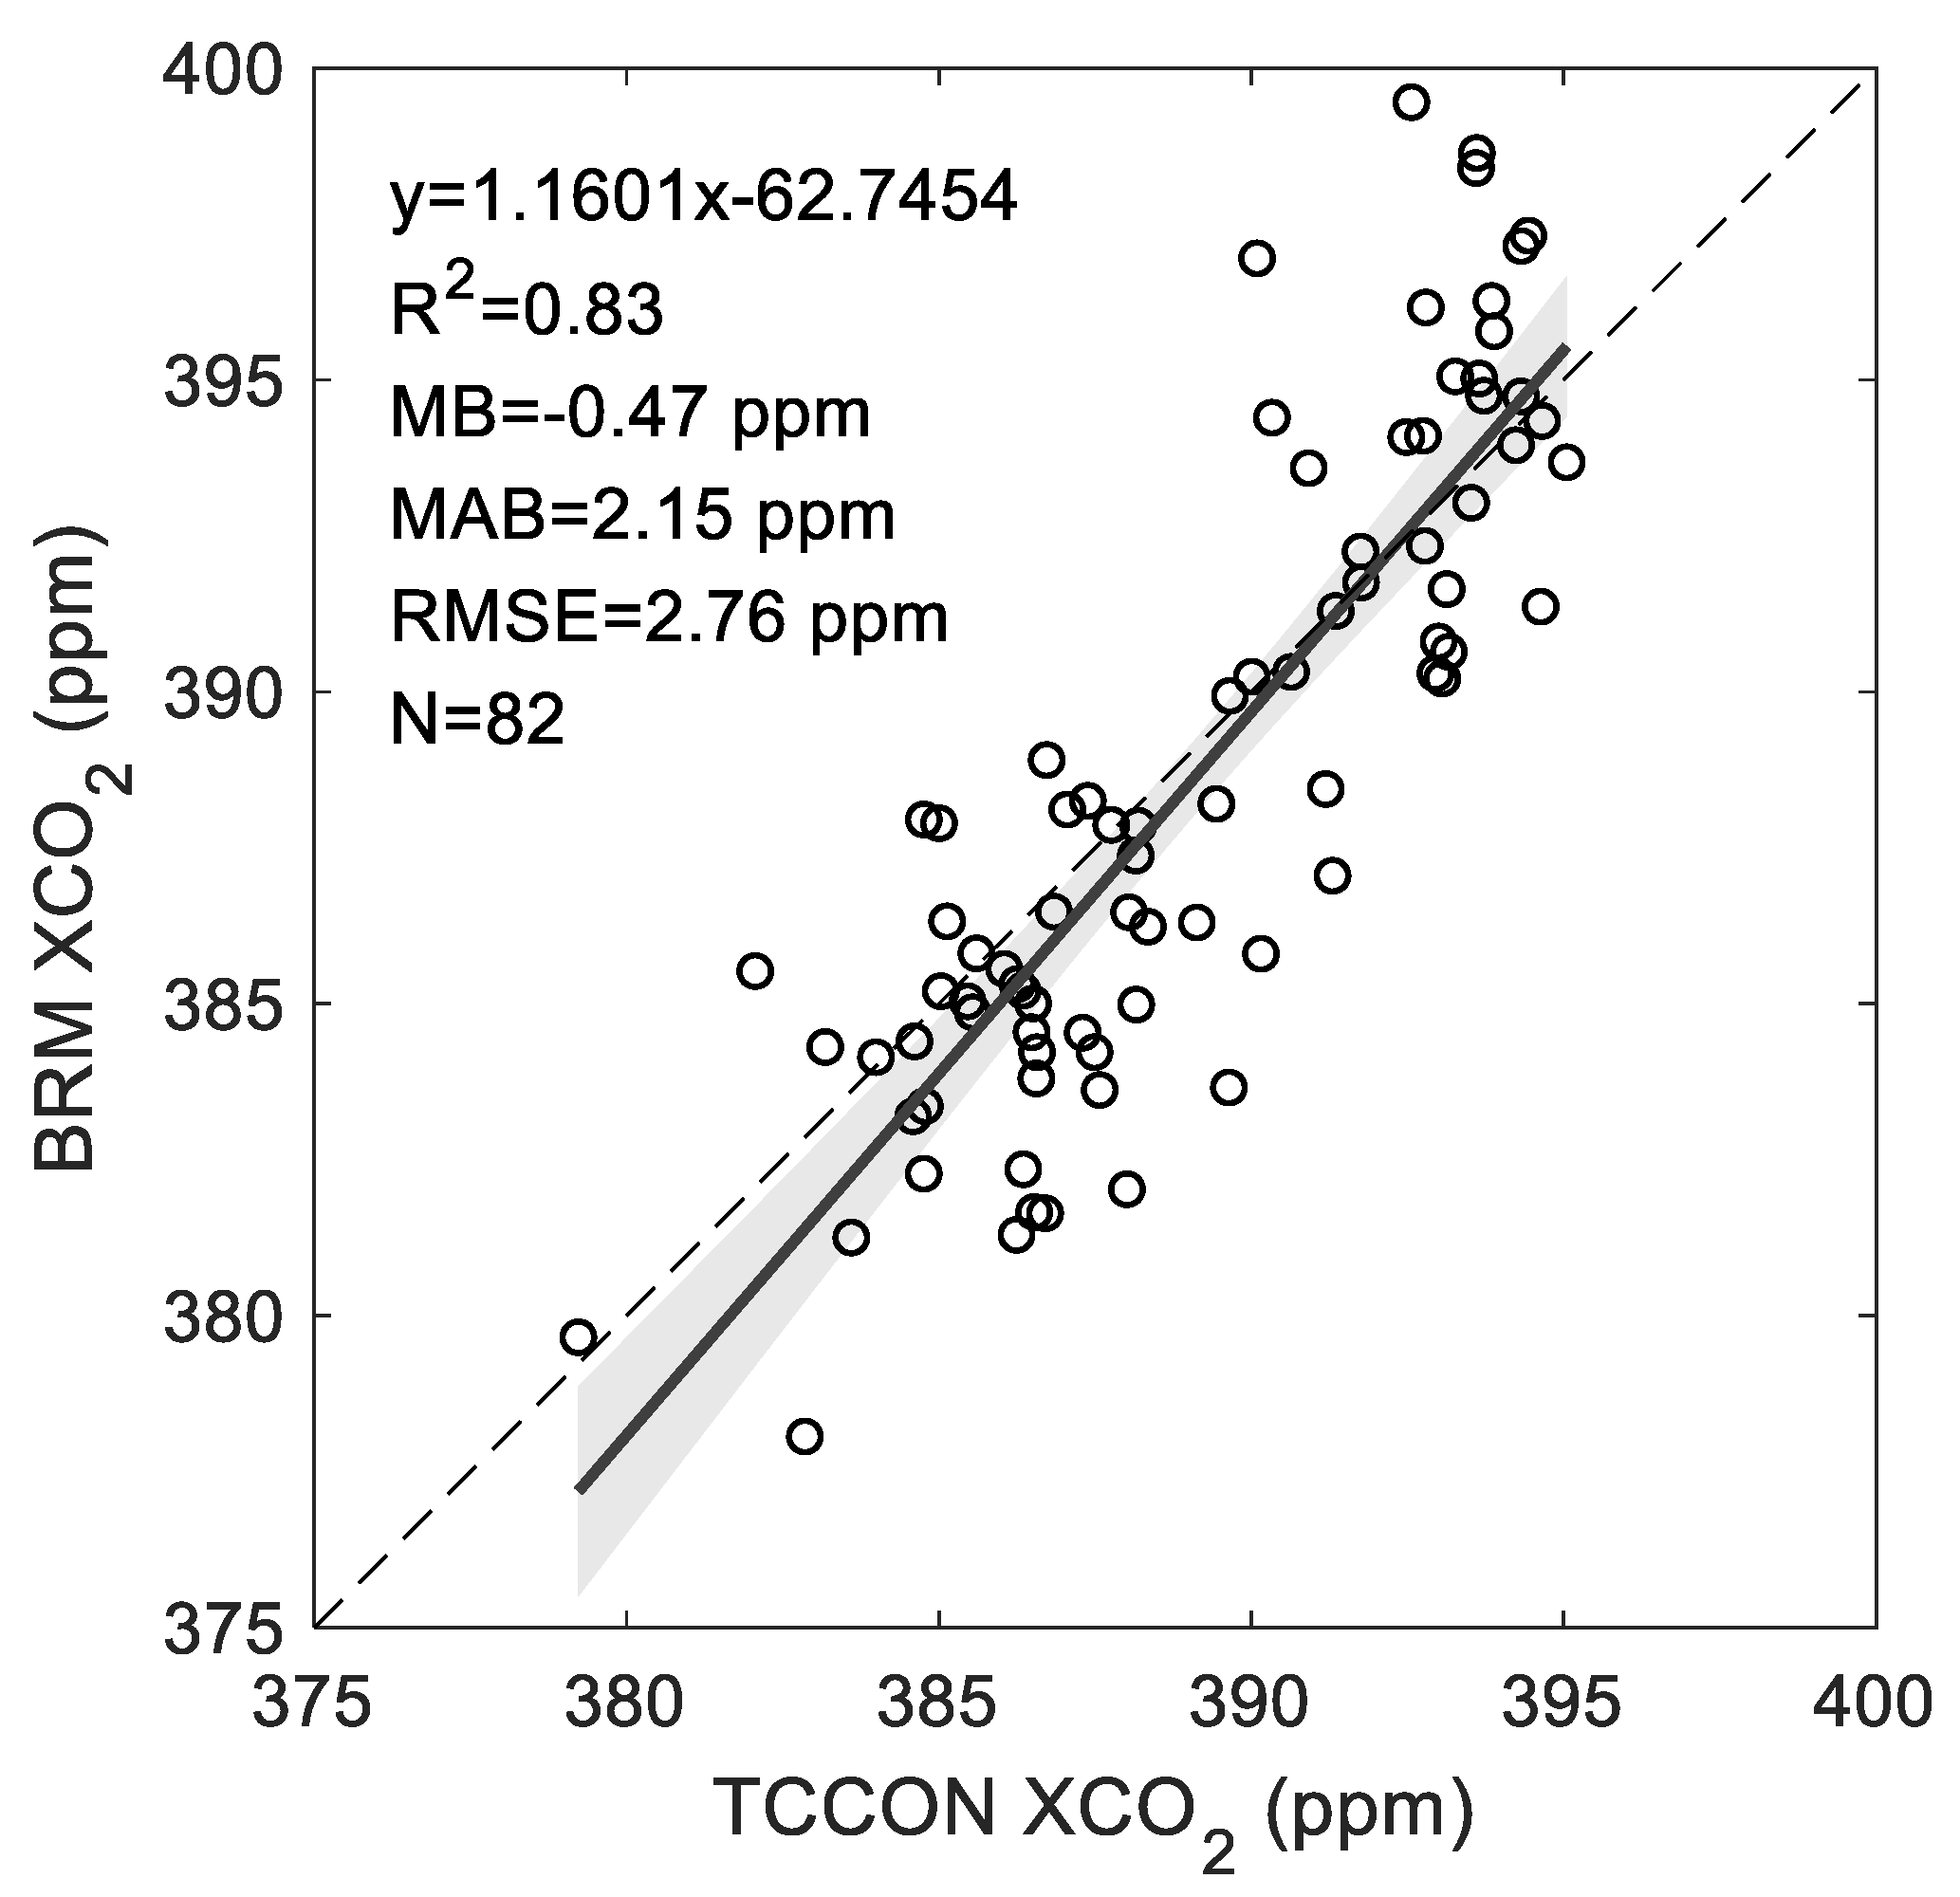
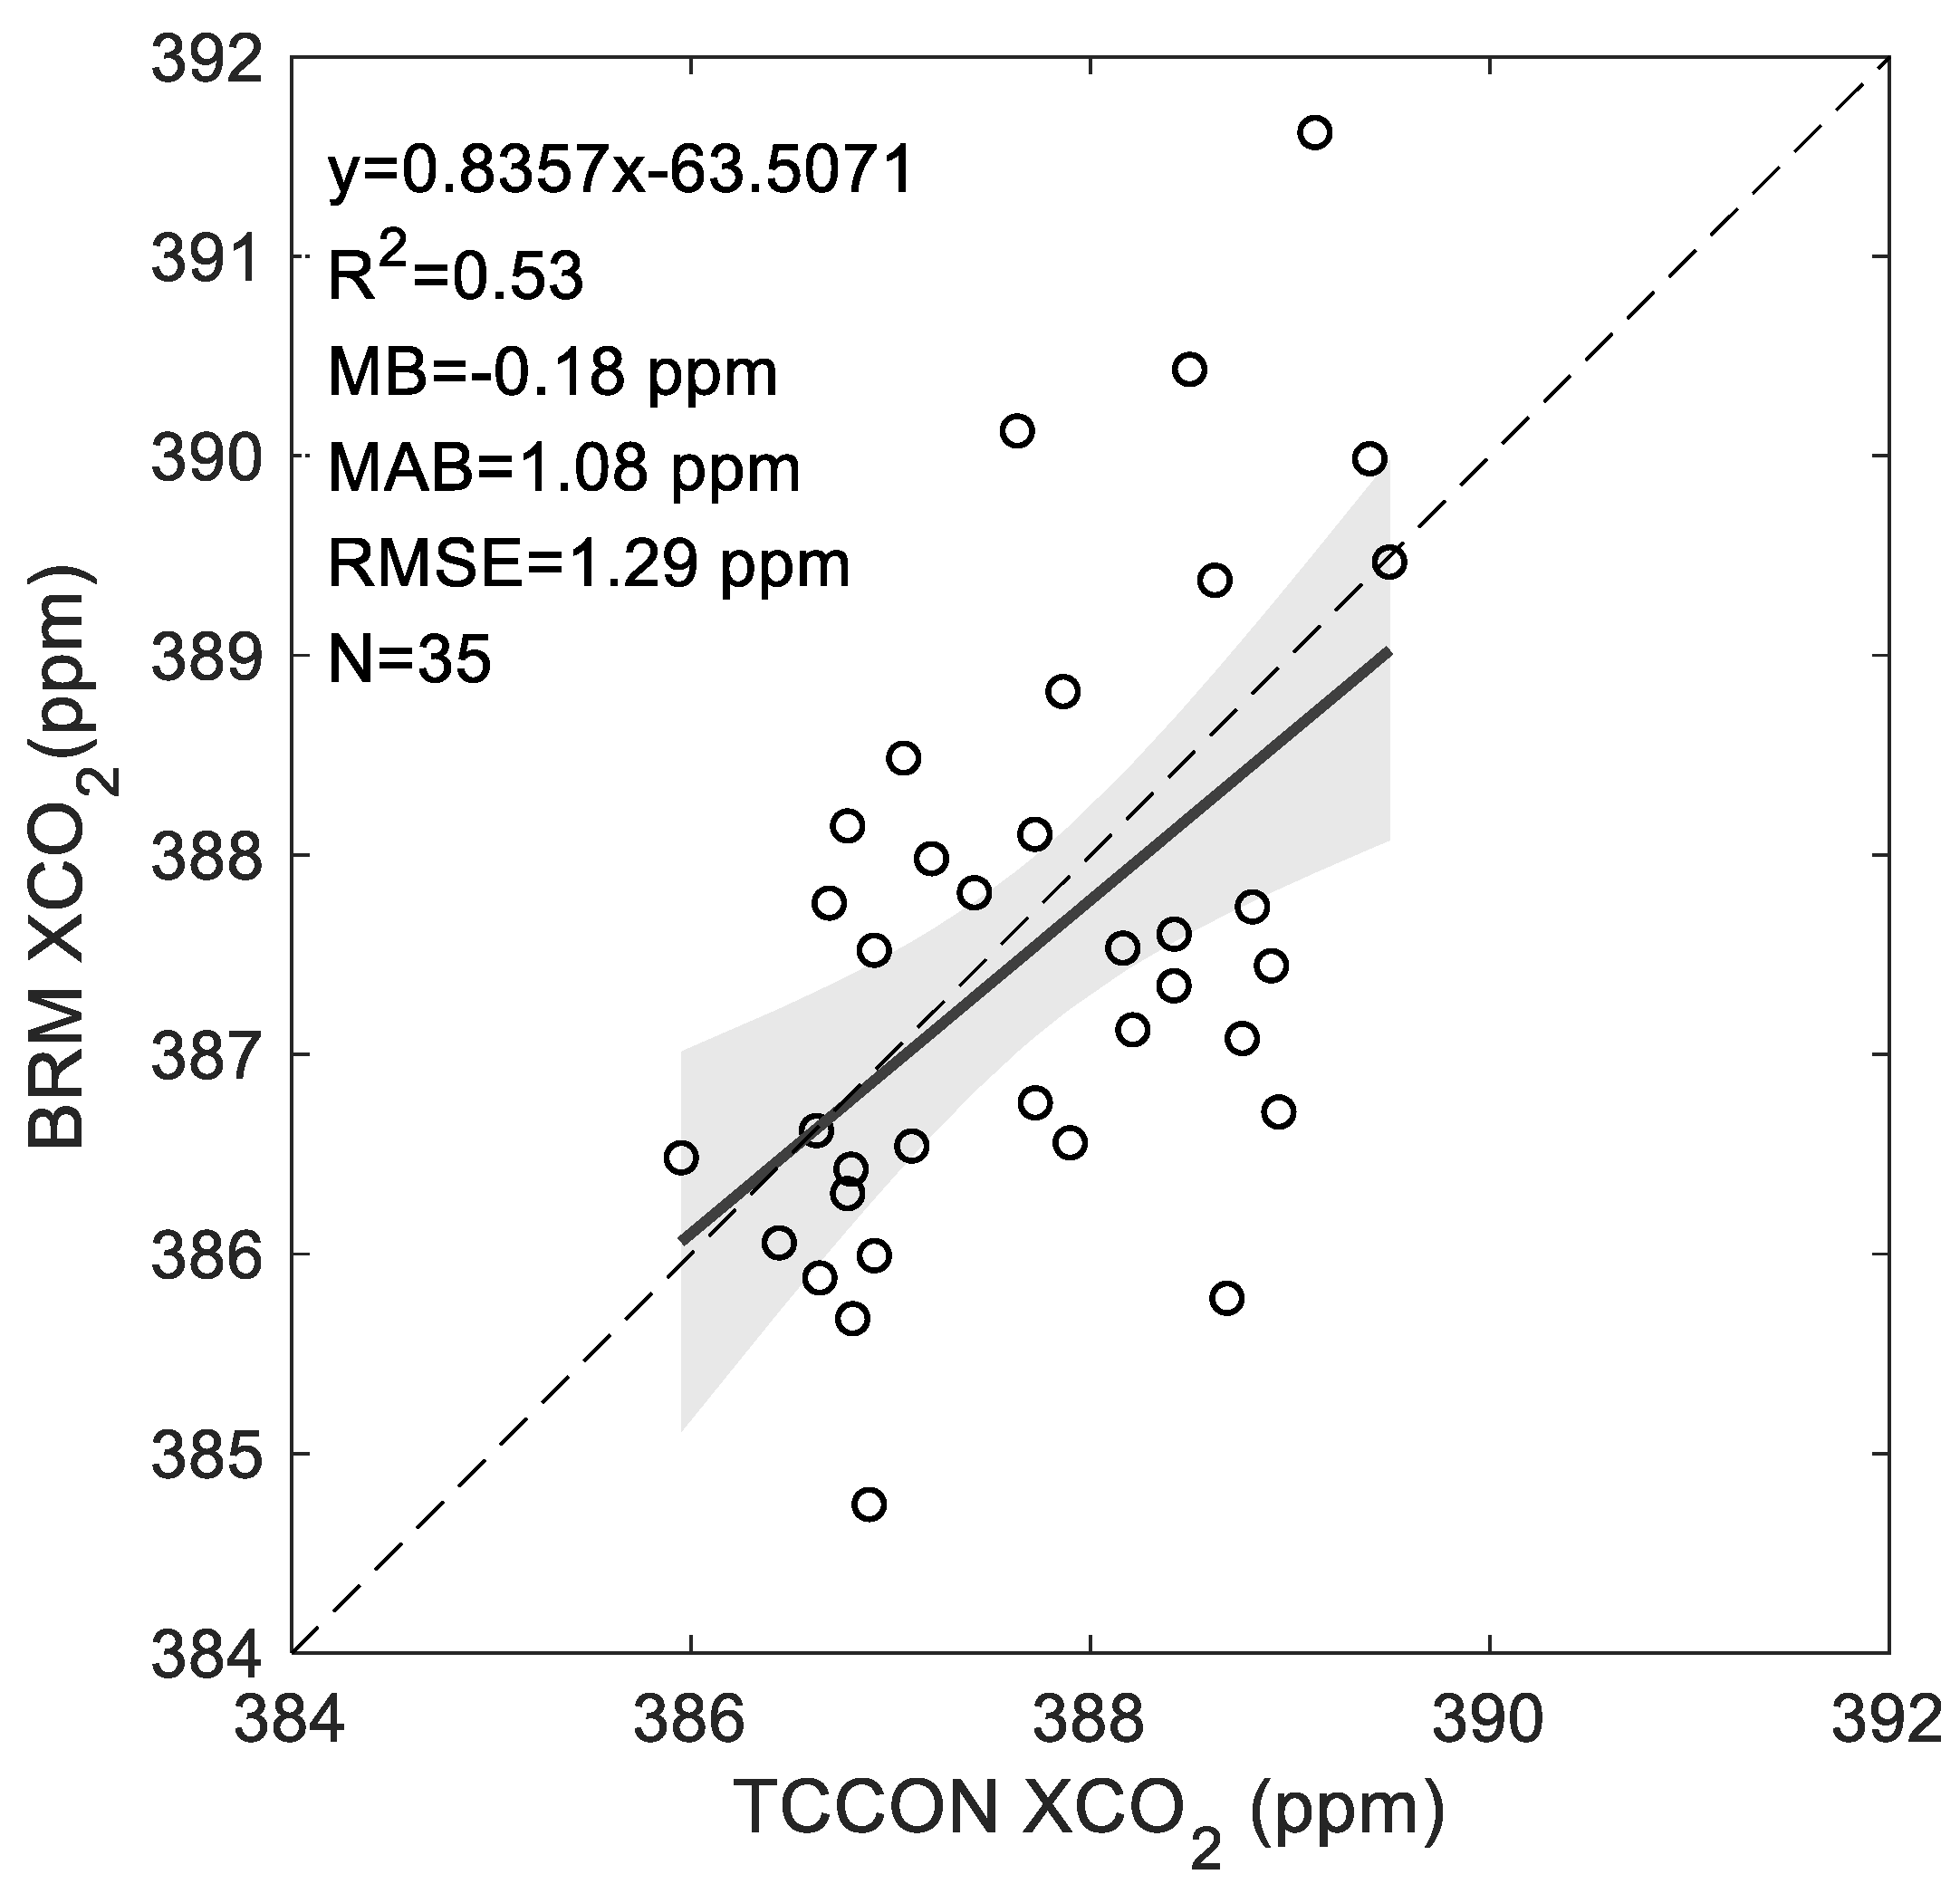
3.4. Validation Result
3.4.1. Park Falls
3.4.2. Wollongong
4. Discussion
5. Conclusions
Author Contributions
Funding
Acknowledgments
Conflicts of Interest
References
- Wu, L.; Hasekamp, O.; Hu, H.; Landgraf, J.; Butz, A.; aan de Brugh, J.; Aben, I.; Pollard, D.F.; Griffith DW, T.; Feist, D.G.; et al. Carbon dioxide retrieval from OCO-2 satellite observations using the RemoTeC algorithm and validation with TCCON measurements. Atmos. Meas. Tech. 2018, 11, 3111–3130. [Google Scholar] [CrossRef] [Green Version]
- Buchwitz, M.; de Beek, R.; Noël, S.; Burrows, J.P.; Bovensmann, H.; Bremer, H.; Bergamaschi, P.; Körner, S.; Heimann, M. Carbon monoxide, methane and carbon dioxide columns retrieved from SCIAMACHY by WFM-DOAS: Year 2003 initial data set. Atmos. Chem. Phys. 2005, 5, 3313–3329. [Google Scholar] [CrossRef] [Green Version]
- Yokota, T.; Yoshida, Y.; Eguchi, N.; Ota, Y.; Tanaka, T.; Watanabe, H.; Maksyutov, S. Global Concentrations of CO2 and CH4 Retrieved from GOSAT: First Preliminary Results. Sci. Online Lett. Atmos. 2009, 5, 160–163. [Google Scholar] [CrossRef] [Green Version]
- Wunch, D.; Wennberg, P.O.; Osterman, G.; Fisher, B.; Naylor, B.; Roehl, C.M.; O’Dell, C.; Mandrake, L.; Viatte, C.; Kiel, M.; et al. Comparisons of the Orbiting Carbon Observatory-2 (OCO-2) XCO2 measurements with TCCON. Atmos. Meas. Tech. 2017, 10, 2209–2238. [Google Scholar] [CrossRef] [Green Version]
- Liu, Y.; Cai, Z.; Yang, D.; Zheng, Y.; Duan, M.; Lü, D. Effects of spectral sampling rate and range of CO2 absorption bands on XCO2 retrieval from TanSat hyperspectral spectrometer. Chin. Sci. Bull. 2014, 59, 1485–1491. [Google Scholar] [CrossRef]
- Kuze, A.; Suto, H.; Nakajima, M.; Hamazaki, T. Thermal and near infrared sensor for carbon observation Fourier-transform spectrometer on the Greenhouse Gases Observing Satellite for greenhouse gases monitoring. Appl. Opt. 2009, 48, 6716–6733. [Google Scholar] [CrossRef]
- Eldering, A.; Boland, S.; Solish, B.; Crisp, D.; Kahn, P.; Gunson, M. High precision atmospheric CO2 measurements from space: The design and implementation of OCO-2. In Proceedings of the 2012 IEEE Aerospace Conference, Big Sky, MT, USA, 3–10 March 2012; pp. 1–10. [Google Scholar] [CrossRef]
- Oshchepkov, S.; Bril, A.; Yokota, T.; Wennberg, P.; Deutscher, N.; Wunch, D.; Toon, G.C.; Yoshida, Y.; O’Dell, C.W.; Crisp, D.; et al. Effects of atmospheric light scattering on spectroscopic observations of greenhouse gases from space. Part 2: Algorithm intercomparison in the GOSAT data processing for CO2 retrievals over TCCON sites. J. Geophys. Res. Atmos. 2013, 118, 1493–1512. [Google Scholar] [CrossRef] [Green Version]
- Thompson, D.R.; Benner, D.C.; Brown, L.R.; Crisp, D.; Devi, V.M.; Jiang, Y.; Natraj, V.; Oyafuso, F.; Sung, K.; Wunch, D.; et al. Atmospheric validation of high accuracy CO2 absorption coefficients for the OCO-2 mission. J. Quant. Spectrosc. Radiat. Transf. 2012, 113, 2265–2276. [Google Scholar] [CrossRef] [Green Version]
- Basu, S.; Guerlet, S.; Butz, A.; Houweling, S.; Hasekamp, O.; Aben, I.; Krummel, P.; Steele, P.; Langenfelds, R.; Torn, M.; et al. Global CO2 fluxes estimated from GOSAT retrievals of total column CO2. Atmos. Chem. Phys. 2013, 13, 8695–8717. [Google Scholar] [CrossRef] [Green Version]
- Chevallier, F.; Palmer, P.I.; Feng, L.; Boesch, H.; O’Dell, C.W.; Bousquet, P. Toward robust and consistent regional CO2 flux estimates from in situ and spaceborne measurements of atmospheric CO2. Geophys. Res. Lett. 2014, 41, 1065–1070. [Google Scholar] [CrossRef] [Green Version]
- Sayer, A.M.; Thomas, G.E.; Grainger, R.G.; Carboni, E.; Poulsen, C.; Siddans, R. Use of MODIS-derived surface reflectance data in the ORAC-AATSR aerosol retrieval algorithm: Impact of differences between sensor spectral responses functions. Remote Sens. Environ. 2012, 116, 177–188. [Google Scholar] [CrossRef]
- Buchwitz, M.; Rozanov, V.V.; Burrows, J.P. A correlated-k distribution scheme for overlapping gases suitable for retrieval of atmospheric constituents from moderate resolution radiance measurements in the visible/near-infrared spectral region. J. Geophys. Resphys. Res. 2000, 105, 15247–15309. [Google Scholar] [CrossRef]
- Rodgers, C.D. Inverse Methods for Atmospheric Sounding: Theory and Practice; World Scientific: Singapore, 2000. [Google Scholar]
- Frankenberg, C.; Platt, U.; Wagner, T. Iterative maximum a posteriori (IMAP)-DOAS for retrieval of strongly absorbing trace gases: Model studies for CH4 and CO2 retrieval from near infrared spectra of SCIAMACHY onboard ENVISAT. Atmos. Chem. Phys. 2005, 5, 9–22. [Google Scholar] [CrossRef] [Green Version]
- Barkley, M.P.; Monks, P.S.; Hewitt, A.J.; Machida, T.; Desai, A.; Vinnichenko, N.; Nakazawa, T.; Yu Arshinov, M.; Fedoseev, N.; Watai, T. Assessing the near surface sensitivity of SCIAMACHY atmospheric CO2 retrieved using (FSI) WFM-DOAS. Atmos. Chem. Phys. Discuss. 2007, 7, 2477–2530. [Google Scholar]
- O’Dell, C.W.; Eldering, A.; Wennberg, P.O.; Crisp, D.; Gunson, M.R.; Fisher, B.; Frankenberg, C.; Kiel, M.; Lindqvist, H.; Mandrake, L.; et al. Improved retrievals of carbon dioxide from Orbiting Carbon Observatory-2 with the version 8 ACOS algorithm. Atmos. Meas. Tech. 2018, 11, 6539–6576. [Google Scholar] [CrossRef] [Green Version]
- Reuter, M.; Buchwitz, M.; Schneising, O.; Noël, S.; Rozanov, V.; Bovensmann, H.; Burrows, J.P. A Fast Atmospheric Trace Gas Retrieval for Hyperspectral Instruments Approximating Multiple Scattering—Part 1: Radiative Transfer and a Potential OCO-2 XCO2 Retrieval Setup. Remote Sens. 2017, 9, 1159. [Google Scholar] [CrossRef] [Green Version]
- Wu, L.; Aben, I.; Haekamp, O.P. Product User Guide and Specification (PUGS)—ANNEX B for Products CO2_GOS_SRFP, CH4_GOS_SRFP (v2.3.8, 2009–2018). 2019. Available online: http://wdc.dlr.de/C3S_312b_Lot2/Documentation/GHG/PUGS/C3S_D312b_Lot2.3.2.3-v1.0_PUGS-GHG_ANNEX-B_v3.1.pdf (accessed on 17 August 2020).
- Iwasaki, C.; Imasu, R.; Bril, A.; Oshchepkov, S.; Rokotyan, N. Optimization of the Photon Path Length Probability Density Function-Simultaneous (PPDF-S) Method and Evaluation of CO2 Retrieval Performance Under Dense Aerosol Conditions. Sensors 2019, 19, 1262. [Google Scholar] [CrossRef] [PubMed] [Green Version]
- Inoue, M.; Morino, I.; Uchino, O.; Nakatsuru, T. Bias corrections of GOSAT SWIR XCO2 and XCH4 with TCCON data and their evaluation using aircraft measurement data. Atmos. Meas. Tech. 2016, 9, 3491–3512. [Google Scholar] [CrossRef] [Green Version]
- Yang, D.; Boesch, H.; Liu, Y.; Somkuti, P.; Cai, Z.; Chen, X.; Di Noia, A.; Lin, C.; Lu, N.; Lyu, D.; et al. Toward high precision XCO2 retrievals from TanSat observations: Retrieval improvement and validation against TCCON measurements. J. Geophys. Res. Atmos. 2020, 125, e2020JD032794. [Google Scholar] [CrossRef]
- Butz, A.; Guerlet, S.; Hasekamp, O.; Schepers, D.; Galli, A.; Aben, I.; Frankenberg, C.; Hartmann, J.-M.; Tran, H.; Kuze, A.; et al. Toward accurate CO2 and CH4 observations from GOSAT. Geophys. Res. Lett. 2011, 38, 130–137. [Google Scholar] [CrossRef] [Green Version]
- Zhou, M.Q.; Zhang, X.Y.; Wang, P.C.; Wang, S.P.; Guo, L.L.; Hu, L.Q. XCO2 satellite retrieval experiments in short-wave infrared spectrum and ground-based validation. Sci. China Earth Sci. 2015, 58, 1191–1197. [Google Scholar] [CrossRef]
- Wunch, D.; Toon, G.C.; Blavier, J.F.L.; Washenfelder, R.A.; Notholt, J.; Connor, B.J.; Griffith, D.W.T.; Sherlock, V.; Wennberg, P.O. The Total Carbon Column Observing Network (TCCON). Philos. Trans. R. Soc. A 2011, 369, 2087–2112. [Google Scholar] [CrossRef] [PubMed] [Green Version]
- Wennberg, P.O.; Roehl, C.; Wunch, D.; Toon, G.C.; Blavier, J.-F.; Washenfelder, R.; Keppel-Aleks, G.; Allen, N.; Ayers, J. TCCON data from Park Falls, Wisconsin, USA, Release GGG2014R1; TCCON data archive, hosted by CaltechDATA; California Institute of Technology: Pasadena, CA, USA, 2017. [Google Scholar]
- Griffith, D.W.T.; Velazco, V.A.; Deutscher, N.; Murphy, C.; Jones, N.; Wilson, S.; Macatangay, R.; Kettlewell, G.; Buchholz, R.R.; Riggenbach, M. TCCON data from Wollongong, Australia, Release GGG2014R0; TCCON data archive, hosted by CaltechDATA; California Institute of Technology: Pasadena, CA, USA, 2017. [Google Scholar] [CrossRef]
- Kuze, A.; Suto, H.; Shiomi, K.; Kawakami, S.; Tanaka, M.; Ueda, Y.; Deguchi, A.; Yoshida, J.; Yamamoto, Y.; Kataoka, F.; et al. Update on GOSAT TANSO-FTS performance, operations, and data products after more than 6 years in space. Atmos. Meas. Tech. 2016, 9, 2445–2461. [Google Scholar] [CrossRef] [Green Version]
- Rozanov, A.; Rozanov, V.; Buchwitz, M.; Kokhanovsky, A.; Burrows, J.P. SCIATRAN 2.0—A new radiative transfer model for geophysical applications in the 175–2400 nm spectral region. Adv. Space Res. 2005, 36, 1015–1019. [Google Scholar] [CrossRef]
- Rozanov, V.V.; Rozanov, A.V.; Kokhanovsky, A.A.; Burrows, J.P. Radiative transfer through terrestrial atmosphere and ocean: Software package SCIATRAN. J Quan. Spectrosc. Radiat. Transf. 2014, 133, 13–71. [Google Scholar] [CrossRef]
- Guerlet, S.; Butz, A.; Schepers, D.; Basu, S.; Hasekamp, O.P.; Kuze, A.; Yokota, T.; Blavier, J.-F.; Deutscher, N.M.; Griffith, D.W.; et al. Impact of aerosol and thin cirrus on retrieving and validating XCO2 from GOSAT shortwave infrared measurements. J. Geophys. Res. Atmos. 2013, 118, 4887–4905. [Google Scholar] [CrossRef] [Green Version]
- Oshchepkov, S.; Bril, A.; Yokota, T. PPDF-based method to account for atmospheric light scattering in observations of carbon dioxide from space. J. Geophys. Res. 2008, 113, D23210. [Google Scholar] [CrossRef]
- Sanghavi, S.; Nelson, R.; Frankenberg, C.; Gunson, M. Aerosols in oco-2/gosat retrievals of xCO2: An information content and error analysis. Remote Sens. Environ. 2020, 251, 112053. [Google Scholar] [CrossRef]
- Pougatchev, N.; August, T.; Calbet, X.; Hultberg, T.; Oduleye, O.; Schlüssel, P.; Stiller, B.; Germain, K.S.; Bingham, G. IASI temperature and water vapor retrievals error assessment and validation. Atmos. Chem. Phys. 2009, 9, 6453–6458. [Google Scholar] [CrossRef] [Green Version]
- Chen, X.; Liu, Y.; Yang, D.; Cai, Z.; Wang, M. A Theoretical Analysis for Improving Aerosol-Induced CO2 Retrieval Uncertainties Over Land Based on TanSat Nadir Observations Under Clear Sky Conditions. Remote Sens. 2019, 11, 1061. [Google Scholar] [CrossRef] [Green Version]
- Noël, S.; Reuter, M.; Buchwitz, M.; Borchardt, J.; Warneke, T. XCO2 retrieval for GOSAT and GOSAT-2 based on the FOCAL algorithm. Atmos. Meas. Tech. 2020, 14, 3837–3869. [Google Scholar] [CrossRef]
- Aben, I.; Hasekamp, O.; Hartmann, W. Uncertainties in the space-based measurements of CO2 columns due to scattering in the Earth’s atmosphere. J. Quant. Spectrosc. Radiat. Transf. 2007, 104, 450–459. [Google Scholar] [CrossRef]
- Butz, A.; Hasekamp, O.P.; Frankenberg, C.; Aben, I. Retrievals of atmospheric CO2 from simulated spaceborne measurements of backscattered near-infrared sunlight: Accounting for aerosol effects. Appl. Opt. 2009, 48, 3322. [Google Scholar] [CrossRef] [PubMed] [Green Version]
- Ye, H.H.; Wang, X.H.; Wu, J.; Fang, Y.H.; Ma, J.J.; Jiang, X.H.; Wei, Q.Y. Study of the effect of surface reflectance on atmospheric CO2 retrieval and ratio spectrometry. Spectrosc. Spect. Anal. 2013, 33, 2182–2187. [Google Scholar]
- Connor, B.; Bösch, H.; McDuffie, J.; Taylor, T.; Fu, D.; Frankenberg, C.; O’Dell, C.; Payne, V.H.; Gunson, M.; Pollock, R.; et al. Quantification of uncertainties in OCO-2 measurements of XCO2: Simulations and linear error analysis. Atmos. Meas. Tech. 2016, 9, 5227. [Google Scholar] [CrossRef] [Green Version]
- Kiel, M.; O’Dell, C.W.; Fisher, B.; Eldering, A.; Wennberg, P.O. How bias correction goes wrong: Measurement of XCO2 affected by erroneous surface pressure estimates. Atmos. Meas. Tech. 2019, 12, 2241–2259. [Google Scholar] [CrossRef] [Green Version]
- Rusli, S.P.; Hasekamp, O.; Brugh, J.; Fu, G.; Landgraf, J.C. Anthropogenic CO2 monitoring satellite mission: The need for multi-angle polarimetric observations. Atmos. Meas. Tech. 2021, 14, 1167–1190. [Google Scholar] [CrossRef]


| Parameters | Settings | Parameters | Settings | Parameters | Settings |
|---|---|---|---|---|---|
| Simulated Altitude | 120 km | Scattering Mode | Multiple Scattering | Aerosol type | No |
| Observation model | Nadir | Gas profile | US Standard Atmosphere | Cloud | No |
| Solar zenith angle | 60° | Observation nadir angle | 0° | Solar spectra | Unity |
| Spectral resolution | 0.2 cm−1 | Linear function | Gaussian | Surface albedo (Lambert) | 0.2 |
| Integral interval | 0.01 nm | Integral mode | Line-by-Line | Atmospheric model | Parallel |
| Season Parameters | Boundary Layer Aerosol Types | Boundary Layer Visibility (km) | BRM Error (%) | OEM Error (%) |
|---|---|---|---|---|
| Spring/summer | Urban | 23 km | −5.6 | −8.3 |
| 5 km | −12.4 | −13.9 | ||
| Rural | 23 km | −6.7 | −7.8 | |
| 5 km | −11.1 | −13.6 | ||
| Fall/winter | Urban | 23 km | −6.4 | −9.4 |
| 5 km | −12.4 | −14.1 | ||
| Rural | 23 km | −5.6 | −7.5 | |
| 5 km | −10.8 | −14.6 |
| Changes in Surface Albedo | BRM Error (%) | OEM Error (%) |
|---|---|---|
| 5% | 0.45 | 3.36 |
| 10% | 0.74 | 6.32 |
| 20% | 1.03 | 13.6 |
| 30% | 4.79 | 22.8 |
Publisher’s Note: MDPI stays neutral with regard to jurisdictional claims in published maps and institutional affiliations. |
© 2022 by the authors. Licensee MDPI, Basel, Switzerland. This article is an open access article distributed under the terms and conditions of the Creative Commons Attribution (CC BY) license (https://creativecommons.org/licenses/by/4.0/).
Share and Cite
Zhao, L.; Chen, S.; Xue, Y.; Cui, T. Study of Atmospheric Carbon Dioxide Retrieval Method Based on Normalized Sensitivity. Remote Sens. 2022, 14, 1106. https://doi.org/10.3390/rs14051106
Zhao L, Chen S, Xue Y, Cui T. Study of Atmospheric Carbon Dioxide Retrieval Method Based on Normalized Sensitivity. Remote Sensing. 2022; 14(5):1106. https://doi.org/10.3390/rs14051106
Chicago/Turabian StyleZhao, Liang, Shengbo Chen, Yong Xue, and Tengfei Cui. 2022. "Study of Atmospheric Carbon Dioxide Retrieval Method Based on Normalized Sensitivity" Remote Sensing 14, no. 5: 1106. https://doi.org/10.3390/rs14051106
APA StyleZhao, L., Chen, S., Xue, Y., & Cui, T. (2022). Study of Atmospheric Carbon Dioxide Retrieval Method Based on Normalized Sensitivity. Remote Sensing, 14(5), 1106. https://doi.org/10.3390/rs14051106