Abstract
High-resolution wide-swath (HRWS) synthetic aperture radar (SAR) plays an important role in remote sensing observation. However, the motion errors caused by the carrier platform’s instability severely degrade the performance of the HRWS SAR imaging. Conventional motion errors compensation methods have two drawbacks, i.e., (1) ignoring the spatial variation of the phase errors of pixels along the range direction of the scene, which leads to lower compensation accuracy, and (2) performing compensation after echo reconstruction, which fails to consider the difference in motion errors between channels, resulting in poor imaging performance in the azimuth direction. In this paper, to overcome these two drawbacks, a high-precision motion errors compensation method based on sub-image reconstruction (SI-MEC) for high-precision HRWS SAR imaging is proposed. The proposed method consists of three steps. Firstly, the motion errors of the platform are estimated by maximizing the intensity of strong points in multiple regions. Secondly, combined with the multichannel geometry, the equivalent phase centers (EPCs) used for sub-images imaging are corrected and the sub-images imaging is performed before reconstruction. Thirdly, the reconstruction is performed by using the sub-images. The proposed method has two advantages, i.e., (1) compensating for the spatially varying phase errors in the range direction, by correcting EPCs, to improve the imaging quality, and (2) compensating for the motion errors of each channel in sub-image imaging before reconstruction, to enhance the imaging quality in the azimuth direction. Moreover, the experimental results are provided to demonstrate that the proposed method outperforms PGA and BP-FMSA.
1. Introduction
High-resolution wide swath (HRWS) synthetic aperture radar (SAR) can not only perform day-and-night and weather-independent earth observations but also obtain high-resolution and wide-swath microwave images [1,2,3,4]. High resolution allows for more richly detailed information of the image, which is more conducive to tasks such as polarimetric SAR environmental monitoring [5,6,7] and target detection [8]. It is widely used in the military and civilian fields. The traditional SAS system contains a single channel, which cannot be used to achieve HRWS imaging, because the low pulse repetition frequency (PRF) of the SAR system is required to obtain a wide swath image, which conflicts with the high RPF that is required to avoid the azimuth Doppler ambiguity. The azimuth multichannel SAR system design is considered to be a promising technique to solve this problem [9,10,11], and many reconstruction algorithms have been proposed to reconstruct the multichannel SAR echo for unambiguous imaging [12,13,14,15]. In recent years, various airborne and hypersonic vehicle-borne multichannel SARs [16,17] have been extensively studied. However, due to the effect of the SAR platform vibration and the atmospheric turbulence [18,19], the motion trajectory of the platform deviates from the desired values, resulting in motion errors. Because SAR forms a large aperture in the azimuth direction through motion and achieves azimuth compression by coherent summation of echoes at each pulse repetition time [20], high-precision imaging is related to the motion trajectory. These motion errors severely degrade the image quality, and the motion errors compensation (MEC) must be considered in the imaging process.
A common MEC method is to use the antenna attitude information obtained by the inertial measurement unit (IMU) for motion compensation [21]. However, the measurement accuracy of the IMU is still unable to meet the demand for high-precision motion compensation [22]. Another extensively studied MEC method is autofocus algorithms [22,23,24,25,26] that use the echo data for motion error estimation. Phase gradient autofocus (PGA) is a widely used nonparametric autofocus algorithm that can perform phase correction for SAR images [27]. In addition, various autofocus methods based on different optimization criteria have also been developed [22,24,25,26]. In [24], an autofocus method based on image sharpness metric was presented, which is compatible with the backprojection algorithm supporting the flexible collection and imaging geometries. However, as this algorithm needs to compute and store the per-pulse backprojected values for all pixels, it suffers from a heavy computation burden. To improve imaging efficiency and quality, some improved autofocus algorithms [26,28] have been proposed. However, these autofocus methods have two drawbacks. They mainly rely on phase errors estimation, while assuming the same phase errors for all pixels of the SAR image. This ignores the spatial variation of the phase errors of pixels along the range direction of the scene, reducing compensation accuracy and image quality. Since HRWS SAR images have a large width in the range direction, this phenomenon is particularly obvious. Moreover, as these autofocus methods are designed for single-channel SAR, they perform compensation after echo reconstruction treating the multichannel reconstructed echo as a single-channel echo [16]. This ignores the difference in motion errors between channels, resulting in poor imaging performance in the azimuth direction.
To overcome the abovementioned two drawbacks of the existing SAR motion errors compensation methods, a high-precision motion errors compensation method based on sub-image reconstruction (SI-MEC) for HRWS SAR imaging is proposed. The proposed method consists of three steps. Firstly, coarse imaging with motion errors is performed and strong points in partial regions of the coarse imaging result are selected. The motion errors of the platform are estimated by maximizing the intensity of the strong points. Secondly, according to the estimated platform motion errors and the multichannel geometry, the EPCs used for sub-image imaging are corrected and the sub-images imaging is performed before reconstruction. Thirdly, the reconstruction is performed by using the sub-images.
The main contributions of this paper are as follows:
- The proposed method can compensate for the spatially varying phase errors in the range direction by estimating and correcting EPCs. It increases the accuracy of compensating for phase errors for each pixel and improves imaging quality.
- The proposed algorithm compensates for the motion errors of each channel before reconstruction, improving the imaging quality in the azimuth direction. Moreover, this compensation is implemented when calculating the distance history during sub-images imaging without additional calculation of the compensation phase for each pixel, which simplifies the processing.
The remainder of this paper is organized as follows. Section 2 presents the signal model of HRWS SAR with motion errors and analyzes the problem of the conventional motion errors compensation method. In Section 3, a high-precision motion compensation method based on sub-image reconstruction for HRWS SAR is proposed. Experimental results are given in Section 4. Section 5 concludes this paper.
2. Signal Model and Problem Analysis
In this section, we first introduce the signal model of HRWS SAR with motion errors. Then, we analyze the problems of conventional motion errors compensation methods applied to HRWS SAR.
2.1. Signal Model of HRWS SAR with Motion Errors
The geometric relation of multichannel HRWS SAR system with motion errors is illustrated in Figure 1. The y-axis denotes the platform movement direction, and its velocity is v. and represent targets at different positions in the observation scene. The system shown in Figure 1 has four channels, in which Tx is used as a transmitter, and Rx1, Rx2, Rx3, and Rx4 are used as receivers to simultaneously receive echoes in each pulse repetition period. According to the principle of the equivalent phase center [9], the EPCs are located in the middle of the transmitter and receivers, which are shown as dots in Figure 1. The dashed line indicates the platform trajectory without motion errors, and the EPCs are represented as . The solid line indicates the platform trajectory with motion errors, and the EPCs are represented as .
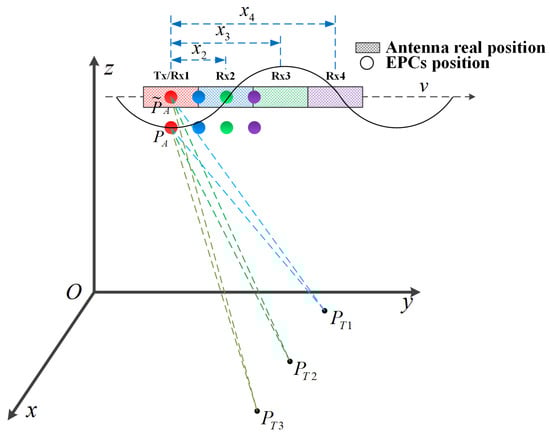
Figure 1.
The geometry of the HRWS SAR system with motion errors.
Assuming that the system transmits chirp signals, the echo is represented by . For the HRWS SAR, denotes the azimuth non-uniformly sampling time of the EPC corresponding to the n-th channel in the k-th pulse repetition period, and denotes the non-uniformly sampled echo. If the non-uniformly sampled echo is used for imaging, it will result in azimuth ambiguity, significantly degrading the image quality. To solve this problem, the reconstruction algorithms are usually adopted to restore uniformly sampled signals before imaging. According to the generalized sampling theorem [29], the uniformly sampled echo signal can be restored by
where denotes the azimuth uniformly sampling time, and is the reconstruction coefficient.
Assuming that the imaging scene can be approximated by discrete pixels, the position of each pixel can be expressed as . Let denote the position of the measured EPCs of channel n at slow time . The backprojection (BP) algorithm is employed to process the uniformly sampled echo signal, whose principle has been presented in the literature [30]. According to the BP algorithm, the filtered BP component of the m-th pixel at slow time can be expressed as
where is the dual echo delay from the position of the measured EPC of channel n to the m-th pixel at slow time . It can be expressed as
The filtered BP value of the m-th pixel accumulated over all slow time can be expressed as
This is the imaging result without motion errors. Unfortunately, due to the presence of motion errors in practical applications, the non-uniformly sampled echo suffers from phase errors, which cause the SAR image to be defocused. Assuming that the compensation phase is denoted as , instead of Equation (4), the procedure of BP imaging with phase errors compensation is written as
This is the conventional motion errors compensation method.
2.2. Problem Analysis
There are two problems with the conventional motion errors compensation method for HRWS SAR imaging.
The first problem is ignoring the spatial variation of the phase errors of pixels along the range direction of the scene. The phase errors for the pixel caused by the platform motion errors have the characteristic of spatial variation; that is, the phase errors for different pixels in the observation scene are different. However, Equation (5) shows that the conventional phase compensation method ignores the spatial variation of phase errors in the range direction and assumes that the same compensation phase is used for all pixels in the observation scene. Only the pixels with a small phase error change can be compensated for. However, in the motion error compensation of HRWS SARs, the phase error of the pixels in the observation scene vary greatly in the range direction due to the wide swath. Hence, most of the pixels in the range direction cannot be accurately compensated for, which results in the deterioration of the image quality.
The second problem is ignoring the difference in motion errors between channels. From Equations (2) and (5), we can see that the conventional compensation method is used to perform motion errors compensation on the echo after reconstruction treating the multichannel reconstructed echo as a single-channel echo. It ignores the difference in motion errors between channels, and the motion errors of each channel cannot be completely compensated for. The image quality is deteriorated in the azimuth direction.
3. HRWS SAR High-Precision Motion Compensation Method
In order to solve the two problems of the conventional algorithms, we propose a high-precision motion compensation method based on sub-image reconstruction (SI-MEC) for HRWS SAR. The flow of the proposed method is shown in Figure 2.
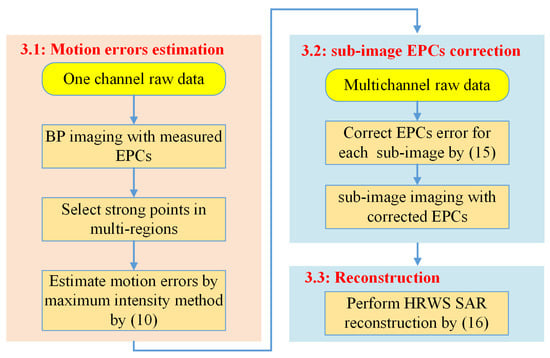
Figure 2.
The flow of the HRWS SAR high-precision motion compensation method based on sub-image reconstruction.
3.1. Motion Errors Estimation Based on the Maximum Intensity of Strong Points in Multi-Region
Since the antennas of the multichannel SAR system are fixed on the flight platform, their relative positions are known. According to the antennas relative positional relationship and imaging geometry of the multi-channel SAR system, the motion errors of one of the multiple channels can be used to calculate the motion errors of the other channels. Therefore, we can obtain the multichannel motion errors by estimating the motion errors of one channel. This has the advantage of using data from one channel for estimation to improve efficiency.
In fact, any one of the channels can be selected to estimate the motion error. Because the relative position relationship of the four channels is known, the motion error of the other channels can be calculated from the motion errors of any of the selected channels. In this paper, since channel 1 can transmit and receive signals, the equivalent phase centers and channel positions are coincident. For convenience, we choose channel 1 to estimate the motion error and treat it as the motion errors of the platform. The BP value of the m-th pixel by using channel 1 echo can be expressed as
where is the echo data of channel 1.
The influence of motion errors on the amplitude of the BP value can be ignored, but its influence on the compensation phase calculated by the dual echo delay needs to be considered. When there are motion errors, the accurate BP imaging result can be expressed as
where is the dual echo delay from the EPC with motion errors of channel 1 to the m-th pixel at slow time . It can be expressed as
where is the estimate of the EPC error of channel 1 and also the motion error of the platform.
In order to accurately estimate the motion errors, multiple strong points in two regions were selected for the estimation. These two regions are far apart in the range direction, which makes the difference of the phase errors corresponding to the two regions large, i.e., the spatial variation phenomenon is obvious. In practical applications, the regions close to the nearest and furthest boundary of the HRWS image in the range direction were selected, which are shown in Figure 3. If all pixels in these two regions were selected for estimation, it would suffer from a heavy computation burden. Therefore, we selected the strong point targets in these two regions for estimation. Let and denote the BP value of the strong targets in region 1 and region 2, respectively.
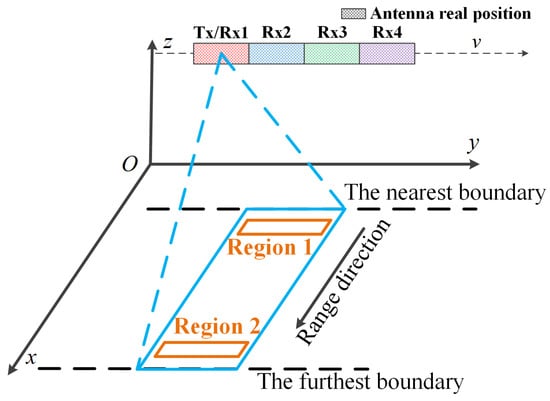
Figure 3.
The location of the selected regions for estimation.
Since the motion errors affect the image quality, we can produce an estimate of the motion errors to maximize the image quality. Choosing an appropriate criterion to reflect the image quality needs to be considered. Image intensity, image sharpness, and image entropy, can be employed as evaluation criteria for SAR image quality. Because employing image intensity as the criterion simplifies the derivation of the objective function, it is used in this paper. The image intensity of the strong points in the two regions can be expressed as
Inspired by the maximum sharpness autofocus algorithm [28], we design the motion errors estimation model based on maximizing the image intensity of multiple strong points as
where is the optimal estimate of the motion errors , and the unconstrained optimization approach can be used to solve it. is the weighting coefficient. When , this means that only region 1 is used for estimation. When , this means that only region 2 is used for estimation. To effectively use the strong points in multiple regions for estimation, the weighting coefficient needs to be adjusted so that the image intensities of the strong points in different regions are at the same order of magnitude.
3.2. Sub-Image EPCs Correction
For the HRWS SAR imaging, the reconstruction methods are usually necessary to reconstruct the multichannel SAR echo to obtain uniformly sampled echoes. Thus, the selection of the reconstruction methods is very important. The sub-image reconstruction method [12] is an excellent reconstruction method, in which the distance history of each pixel of the sub-image can be calculated, and the sub-image imaging is performed before the reconstruction. Due to these characteristics, this reconstruction method is used in this paper. According to the sub-image reconstruction method, the reconstruction image can be obtaind by weighted summation of sub-images. So we first perform sub-image imaging. The sub-image can be expressed as
Due to the influence of motion errors, the echo used in sub-image imaging contains phase errors, which will degrade the imaging quality. According to the principle of BP, let denote the correction phase of the echo containing the motion errors at the azimuth time for the m-th pixel imaging. The sub-image imaging with phase compensation can be expressed as
where
From Equation (12), it can be seen that the phase compensation is performed on the echo of each azimuth time for each pixel. However, it will greatly increase the additional computational burden. In order to solve this problem, the phase errors correction of the echo is integrated into the compensation phase term in Equation (12).
Due to the long distance between the observation scene and the motion platform, can be approximated as
The sub-image imaging with EPCs Correction can be re-expressed as
This means that the phase errors of each pixel of the sub-image can be accurately compensated for by correcting the EPCs at the time when calculating the distance history. The compensation phase does not need to be calculated separately as in Equation (13). This simplifies the processing.
3.3. Reconstruction
The reconstruction imaging can be expressed in the form of the weighted summation of sub-images with EPCs correction [12], which can be written as
where represents a sub-image, and is the reconstruction coefficient.
Based on the previous analysis, the main steps of the proposed method are summarized in Algorithm 1.
| Algorithm 1. High-precision Motion Errors Compensation Method Based on Sub-image Reconstruction for HRWS SAR Imaging |
| Inputs: The non-uniformly sampled echo and measured EPCs |
| Step 1: Obtain the SAR image with meaured EPCs by Equation (6). |
| Step 2: Select strong points and in multi-regions of SAR image, and calculate . |
| Step 3: Estimate motion errors based on maximizing image intensity by Equation (10). |
| Step 4: Correct EPCs error for each sub-image, and obtain the sub-image by Equation (15). |
| Step 5: Reconstruct the sub-image by Equation (16), and obtain the well-focused SAR imaging result . |
| Outputs: High-precision image with motion errors compensation. |
4. Experimental Results
In this section, the simulated multichannel SAR data processing is performed to verify the effectiveness of the proposed method.
4.1. Point Target Simulation
We simulated a four-channel SAR system, the parameters of which are shown in Table 1. As the errors in height direction have a greater impact on imaging quality, random uniform noises between and were added to the height of the platform’s motion trajectory to simulate the motion errors. We set three point targets , , and in the observation scene, and their coordinates are m, m, and m, respectively.

Table 1.
Multichannel SAR simulation parameters.
To demonstrate the effectiveness of the proposed method, PGA [27] and BP-FMSA [28] were used to process the reconstructed multichannel data as a comparison. Figure 4 shows the imaging results of point targets at 50 Km, 60 Km, and 70 Km in the range direction by using different compensation methods. The three point targets were seriously defocused in the azimuth as shown in Figure 4a. Figure 4b–d show the imaging results by PGA [27], BP-FMSA [28], and SI-MEC, respectively. These three methods selected local areas for estimation. In Figure 4b,c, PGA and BP-FMSA utilized the area around the point target at 50 Km to estimate the compensation phase and perform compensation after reconstruction. In Figure 4d, the 1 m × 1 m area around the point targets at 50 Km and the 1 m × 1 m area around the point targets at 60 Km were selected to estimate the EPCs. From Figure 4b, it can be seen that the imaging quality of the point target at 50 Km was better, but the imaging quality of the point target at 60 km and 70 km was worse. It could not compensate for the areas, which were not selected for phase estimation, in the range direction. Compared with Figure 4a,b, the imaging quality of the three point targets in Figure 4c was improved, but the side lobe level could not be suppressed well. Figure 4d shows the imaging result by using SI-MEC. It can be seen that not only at 50 Km and at 60 km focused well, but at 70 km also focused well. This means that SI-MEC can compensate for other areas in the range direction, which were not selected for EPCs estimation. It improved the imaging quality.
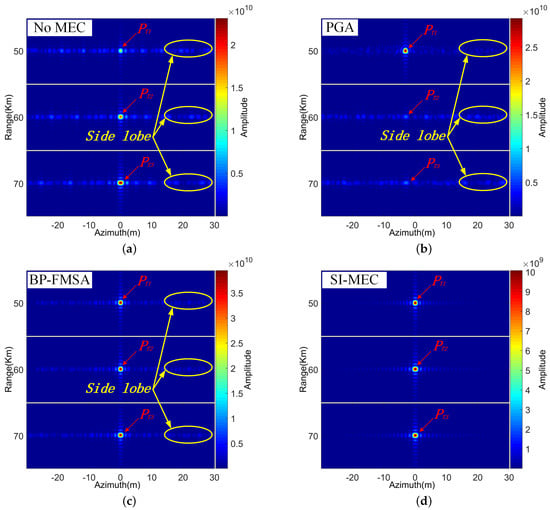
Figure 4.
Imaging results of point targets at 50 Km, 60 Km, and 70 km by using different compensation methods. (a) Imaging result without MEC. (b) Imaging result by PGA [27]. (c) Imaging result by BP-FMSA [28]. (d) Imaging result by SI-MEC (Ours).
We compared the image quality of the targets at the same range, shown in Figure 4a–d, and we found that the proposed method had better performance in the azimuth direction. Moreover, Figure 5 shows the azimuth profile of the point target at 50 Km by different methods in Figure 4. It indicates that compared with the other two methods, SI-MEC could effectively suppress the side lobe level. The proposed method improved the imaging quality in the azimuth direction.
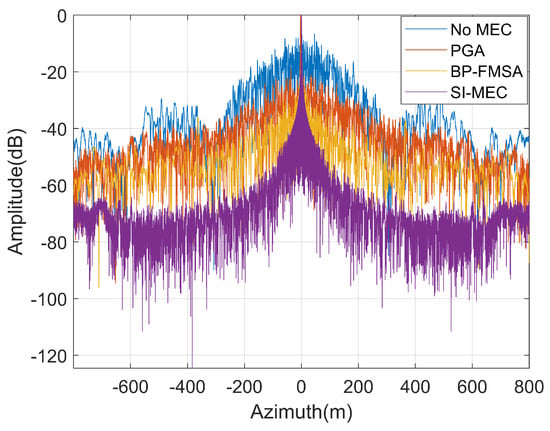
Figure 5.
The azimuth profile of the point target at 50 Km by the different methods shown in Figure 4.
In Table 2, the azimuth peak sidelobe ratio (PSLR) and azimuth integrated sidelobe ratio (ISLR) are listed. First, we compared the performance of the same method at different ranges. The PSLR and ISLR of PGA were the smallest at 50 Km. It can be seen that PGA could only improve the image quality at 50 Km. The PSLR of BP-FMSA was almost the same at 50 Km, 60 Km, and 70 Km. However, the ISLR of BP-FMSA at 70 Km was higher than other places. This shows that BP-FMSA improved the image quality at 50 Km, 60 Km, and 70 Km, but its performance dropped at 70 Km. The PSLR and ISLR of SI-MEC were almost the same at 50 Km, 60 Km, and 70 Km. This shows that SI-MEC improved the image quality of all pixels in range direction.
Table 2.
Imaging quality indicators of the point targets in Figure 4.
Then, we compared the performance of different methods at the same range. At 50 Km, the ISLR of SI-MEC was lower than that of PGA, and the PSLR of SI-MEC was higher than that of PGA. The ISLR and PSLR of SI-MEC were better than that of BP-FMSA. Combined with Figure 4, this shows that although PGA could concentrate the energy of the main lobe, the side lobe level could not be suppressed well. SI-MEC improved these two indicators to obtain a better image quality. At 60 Km and 70 Km, the PSLR and ISLR of SI-MEC were best. This shows that SI-MEC improved the image quality in the azimuth direction.
4.2. Complex Scene Simulation
To further verify the effectiveness of the proposed algorithm, we performed HRWS SAR imaging of a complex scene. The HRWS SAR system has four channels, which are arranged at equal spacing along the azimuth, as shown in Figure 6. The channel spacing between two adjacent channels is d = 1 m. Channel 1 can transmit and receive signals, channels 2, 3, and 4 only receive signals. Figure 6 shows the azimuth sampling pattern of this four-channel SAR system. The system parameters and the motion errors were the same as those of the point target simulation experiment shown in Table 1. The amplitude of a real SAR image was used as the scattering coefficient to generate the echo. The size of the whole imaging scene was 20 Km × 2 Km, and the center of the scene was at 60 Km in the range direction. Figure 7 shows the complex scene imaging results with different compensation methods. In order to display the image features more clearly, a normalization strategy was used to normalize the amplitude of the imaging results. A threshold was set to 0.3 times the maximum value of the image pixel values. The pixel values of the image smaller than the threshold were normalized, and the pixel values larger than the threshold were set to 1. Figure 7a shows the imaging result without MEC. The imaging result after being compensated for by PGA is shown in Figure 7b. We can see that the motion errors are not completely compensated, and the image is still defocused. Figure 7c shows the imaging result using BP-FMSA. It shows that the image quality was improved, but the sidelobe was obvious. The imaging result using SI-MEC is shown in Figure 7d. This shows that all pixels could be compensated for, obtaining a high-precision image.
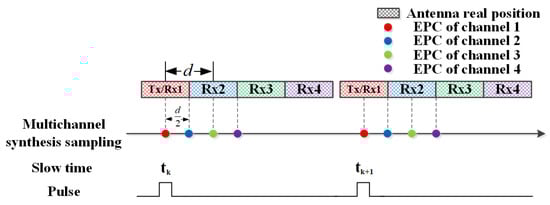
Figure 6.
The azimuth sampling pattern of the four-channel SAR system.
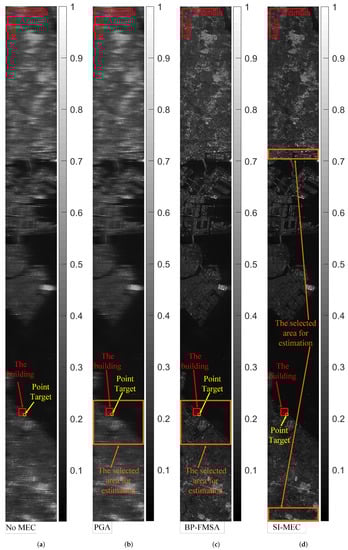
Figure 7.
Complex scene imaging results by using different compensation methods. (a) Imaging result without MEC. (b) Imaging result by PGA [27]. (c) Imaging result by BP-FMSA [28]. (d) Imaging result by SI-MEC (Ours).
PGA and BP-FMSA utilized a local area, which is marked by orange boxes in Figure 7b,c, to estimate the compensation phase. This compensation phase mainly improved the imaging quality of the selected area. Imaging results in other areas of the scene had higher sidelobe levels. For BP-FMSA, because the selection of the dominant scatter region affects the performance of the imaging [28], we presented the optimal results under the current experimental conditions. For the proposed method, strong points in two local areas were selected as the input of the estimation. The areas are marked by orange boxes in Figure 7d. We can see that not only the selected area was focused, but the imaging quality of the whole scene was improved. This demonstrates that the proposed method improved the image quality of the whole scene.
In Table 3, the image entropy [31] of Figure 7 is listed. We can see that the image entropy of the proposed method was the best compared with the other methods. This demonstrates that the proposed algorithm is better than other methods to improve the image quality.
Table 3.
Imaging quality indicator of Figure 7.
Figure 8 shows the enlarged imaging results of the building and the point target in Figure 7, which are marked by red boxes and an orange circle, respectively. We can see that it was difficult for PGA to compensate for the severely defocused multichannel SAR image, and BP-FMSA could not suppress the sidelobe level well. The sidelobe level of the imaging results by SI-MEC was significantly suppressed. This shows that the proposed method was better in terms of imaging quality in the azimuth direction. Figure 9 shows the azimuth profile of the point target in Figure 8 by different methods. It shows that the proposed method has a lower sidelobe level compared to other algorithms.
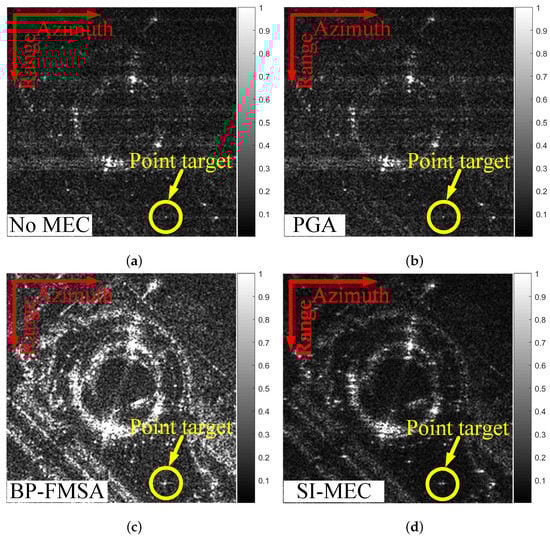
Figure 8.
The imaging result of the building in Figure 7. (a) Imaging result without MEC. (b) Imaging result by PGA [27]. (c) Imaging result by BP-FMSA [28]. (d) Imaging result by SI-MEC (Ours).
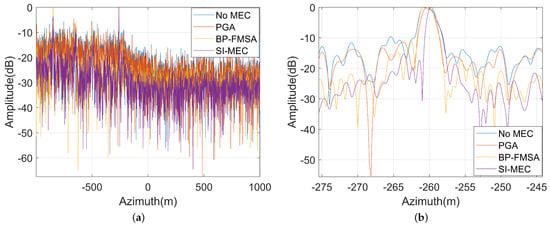
Figure 9.
The azimuth profile of the point target in Figure 8 using different methods. (a) Full azimuth data and (b) partial azimuth data.
5. Conclusions
In this paper, we proposed a high-precision motion errors compensation method based on sub-image reconstruction for HRWS SAR. The proposed method achieved high-precision compensation for the phase errors of each pixel in the observation scene by estimating and correcting the EPCs, improving the compensation accuracy. It can improve the image quality not only of the area selected for estimation but also of other areas in the observation scene. Moreover, the motion errors of each channel were compensated for in the sub-images imaging before reconstruction, which improved the imaging quality in the azimuth direction.
Author Contributions
All the authors contributed extensively to the preparation of this manuscript. L.Z. and X.Z. conceived the methods and performed the experiments; L.P. provided support for the experiment and offered suggestions on revision; T.Z. provided suggestions for modification; J.S. and S.W. supervised the research and commented on the manuscript; and L.Z. wrote the paper. All authors have read and agreed to the published version of the manuscript.
Funding
This work was supported by the National Natural Science Foundation of China under Grant No. 61571099, 61671113, and 61501098.
Institutional Review Board Statement
Not applicable.
Informed Consent Statement
Not applicable.
Data Availability Statement
Not applicable.
Acknowledgments
We thank the anonymous reviewers for their comments towards improving this manuscript.
Conflicts of Interest
The authors declare no conflict of interest.
References
- Zhang, S.X.; Xing, M.D.; Xia, X.G.; Liu, Y.Y.; Guo, R.; Bao, Z. A Robust Channel-Calibration Algorithm for Multi-Channel in Azimuth HRWS SAR Imaging Based on Local Maximum-Likelihood Weighted Minimum Entropy. IEEE Trans. Image Process. 2013, 22, 5294–5305. [Google Scholar] [CrossRef] [PubMed]
- Yang, J.; Qiu, X.; Zhong, L.; Shang, M.; Ding, C. A Simultaneous Imaging Scheme of Stationary Clutter and Moving Targets for Maritime Scenarios with the First Chinese Dual-Channel Spaceborne SAR Sensor. Remote Sens. 2019, 11, 2275. [Google Scholar] [CrossRef] [Green Version]
- Xu, W.; Yu, Q.; Fang, C.; Huang, P.; Tan, W.; Qi, Y. Onboard Digital Beamformer with Multi-Frequency and Multi-Group Time Delays for High-Resolution Wide-Swath SAR. Remote Sens. 2021, 13, 4354. [Google Scholar] [CrossRef]
- Mittermayer, J.; Krieger, G.; Bojarski, A.; Zonno, M.; Villano, M.; Pinheiro, M.; Bachmann, M.; Buckreuss, S.; Moreira, A. MirrorSAR: An HRWS Add-On for Single-Pass Multi-Baseline SAR Interferometry. IEEE Trans. Geosci. Remote Sens. 2021. [Google Scholar] [CrossRef]
- Muhuri, A.; Manickam, S.; Bhattacharya, A.; Snehmani. Snow Cover Mapping Using Polarization Fraction Variation With Temporal RADARSAT-2 C-Band Full-Polarimetric SAR Data Over the Indian Himalayas. IEEE J. Sel. Top. Appl. Earth Obs. Remote Sens. 2018, 11, 2192–2209. [Google Scholar] [CrossRef]
- Touzi, R. Target Scattering Decomposition in Terms of Roll-Invariant Target Parameters. IEEE Trans. Geosci. Remote Sens. 2007, 45, 73–84. [Google Scholar] [CrossRef]
- Van Zyl, J.J.; Zebker, H.A.; Elachi, C. Imaging radar polarization signatures: Theory and observation. Radio Sci. 1987, 22, 529–543. [Google Scholar] [CrossRef]
- Zhang, T.; Zhang, X.; Shi, J.; Wei, S. Depthwise Separable Convolution Neural Network for High-Speed SAR Ship Detection. Remote Sens. 2019, 11, 2483. [Google Scholar] [CrossRef] [Green Version]
- Krieger, G.; Gebert, N.; Moreira, A. Unambiguous SAR signal reconstruction from nonuniform displaced phase center sampling. IEEE Geosci. Remote Sens. Lett. 2004, 1, 260–264. [Google Scholar] [CrossRef] [Green Version]
- Yang, T.; Li, Z.; Suo, Z.; Liu, Y.; Bao, Z. Performance analysis for multichannel HRWS SAR systems based on STAP approach. IEEE Geosci. Remote Sens. Lett. 2013, 10, 1409–1413. [Google Scholar] [CrossRef]
- Nicolas, G.; Gerhard, K.; Alberto, M. Digital Beamforming on Receive: Techniques and Optimization Strategies for High-Resolution Wide-Swath SAR Imaging. IEEE Trans. Aerosp. Electron. Syst. 2009, 45, 564–592. [Google Scholar]
- Zhou, L.; Zhang, X.; Zhan, X.; Pu, L.; Zhang, T.; Shi, J.; Wei, S. A Novel Sub-Image Local Area Minimum Entropy Reconstruction Method for HRWS SAR Adaptive Unambiguous Imaging. Remote Sens. 2021, 13, 3115. [Google Scholar] [CrossRef]
- Guo, J.; Chen, J.; Liu, W.; Li, C.; Yang, W. An Improved Airborne Multichannel SAR Imaging Method With Motion Compensation and Range-Variant Channel Mismatch Correction. IEEE J. Sel. Top. Appl. Earth Obs. Remote Sens. 2020, 13, 5414–5423. [Google Scholar] [CrossRef]
- Zhao, S.; Wang, R.; Deng, Y.; Zhang, Z.; Li, N.; Guo, L.; Wang, W. Modifications on Multichannel Reconstruction Algorithm for SAR Processing Based on Periodic Nonuniform Sampling Theory and Nonuniform Fast Fourier Transform. IEEE J. Sel. Top. Appl. Earth Obs. Remote Sens. 2015, 8, 4998–5006. [Google Scholar] [CrossRef]
- Li, N.; Zhang, H.; Zhao, J.; Wu, L.; Guo, Z. An Azimuth Signal-Reconstruction Method Based on Two-Step Projection Technology for Spaceborne Azimuth Multi-Channel High-Resolution and Wide-Swath SAR. Remote Sens. 2021, 13, 4988. [Google Scholar] [CrossRef]
- Huang, H.; Huang, P.; Liu, X.; Xia, X.G.; Deng, Y.; Fan, H.; Liao, G. A Novel Channel Errors Calibration Algorithm for Multichannel High-Resolution and Wide-Swath SAR Imaging. IEEE Trans. Geosci. Remote Sens. 2021, 60, 5201619. [Google Scholar] [CrossRef]
- Rui, Z.; Sun, J.; Hu, Y.; Qi, Y. Multichannel High Resolution Wide Swath SAR Imaging for Hypersonic Air Vehicle with Curved Trajectory. Sensors 2018, 18, 411. [Google Scholar]
- Chen, Z.; Zhang, Z.; Qiu, J.; Zhou, Y.; Wang, R. A Novel Motion Compensation Scheme for 2-D Multichannel SAR Systems With Quaternion Posture Calculation. IEEE Trans. Geosci. Remote Sens. 2020, 59, 9350–9360. [Google Scholar] [CrossRef]
- Ding, Z.; Liu, L.; Zeng, T.; Yang, W.; Long, T. Improved Motion Compensation Approach for Squint Airborne SAR. IEEE Trans. Geosci. Remote Sens. 2013, 51, 4378–4387. [Google Scholar] [CrossRef]
- Bhattacharya, A.; Muhuri, A.; De, S.; Manickam, S.; Frery, A.C. Modifying the Yamaguchi Four-Component Decomposition Scattering Powers Using a Stochastic Distance. IEEE J. Sel. Top. Appl. Earth Obs. Remote Sens. 2015, 8, 3497–3506. [Google Scholar] [CrossRef] [Green Version]
- Kennedy, T. Strapdown inertial measurement units for motion compensation for synthetic aperture radars. IEEE Aerosp. Electron. Syst. Mag. 1988, 3, 32–35. [Google Scholar] [CrossRef]
- Hu, K.; Zhang, X.; He, S.; Zhao, H.; Shi, J. A Less-Memory and High-Efficiency Autofocus Back Projection Algorithm for SAR Imaging. IEEE Geosci. Remote Sens. Lett. 2015, 12, 890–894. [Google Scholar]
- Eichel, P.H.; Jakowatz, C.V. Phase-gradient algorithm as an optimal estimator of the phase derivative. Opt. Lett. 1989, 14, 1101–1103. [Google Scholar] [CrossRef] [PubMed]
- Ash, J.N. An Autofocus Method for Backprojection Imagery in Synthetic Aperture Radar. IEEE Geosci. Remote Sens. Lett. 2012, 9, 104–108. [Google Scholar] [CrossRef]
- Fletcher, I.; Watts, C.; Miller, E.; Rabinkin, D. Minimum entropy autofocus for 3D SAR images from a UAV platform. In Proceedings of the 2016 IEEE Radar Conference (RadarConf), Philadelphia, PA, USA, 2–6 May 2016; pp. 1–5. [Google Scholar] [CrossRef]
- Zhou, L.; Zhang, X.; Wang, Y.; Wang, C.; Wei, S. Precise Autofocus for SAR Imaging Based on Joint Multi-Region Optimization. In Proceedings of the IGARSS 2019—2019 IEEE International Geoscience and Remote Sensing Symposium, Yokohama, Japan, 28 July–2 August 2019. [Google Scholar]
- Wahl, D.; Eichel, P.; Ghiglia, D.; Jakowatz, C. Phase gradient autofocus-a robust tool for high resolution SAR phase correction. IEEE Trans. Aerosp. Electron. Syst. 1994, 30, 827–835. [Google Scholar] [CrossRef] [Green Version]
- Wei, S.; Zhou, L.; Zhang, X.; Shi, J. Fast back-projection autofocus for linear array SAR 3-D imaging via maximum sharpness. In Proceedings of the 2018 IEEE Radar Conference (RadarConf18), Oklahoma City, OK, USA, 23–27 April 2018; pp. 525–530. [Google Scholar] [CrossRef]
- Yen, J. On nonuniform sampling of bandwidth-limited signals. IRE Trans. Circuit Theory 1956, 3, 251–257. [Google Scholar] [CrossRef]
- Shi, J.; Zhang, X.; Yang, J.; Wen, C. APC Trajectory Design for One-Active Linear-Array Three-Dimensional Imaging SAR. IEEE Trans. Geosci. Remote Sens. 2010, 48, 1470–1486. [Google Scholar] [CrossRef]
- Pu, W. SAE-Net: A Deep Neural Network for SAR Autofocus. IEEE Trans. Geosci. Remote Sens. 2022. [Google Scholar] [CrossRef]
Publisher’s Note: MDPI stays neutral with regard to jurisdictional claims in published maps and institutional affiliations. |
© 2022 by the authors. Licensee MDPI, Basel, Switzerland. This article is an open access article distributed under the terms and conditions of the Creative Commons Attribution (CC BY) license (https://creativecommons.org/licenses/by/4.0/).