Article

China’s Greening Modulated the Reallocation of the Evapotranspiration Components during 2001–2020

1
Chongqing Institute of Green and Intelligent Technology, Chinese Academy of Sciences, Chongqing 401122, China
2
Institute of Agricultural Resources and Environment, Tibet Academy of Agricultural and Animal Husbandry Science, Lhasa 850000, China
3
Department of Earth and Planetary Sciences, Harvard University, Cambridge, MA 02138, USA
*
Author to whom correspondence should be addressed.
These authors contributed equally to this work.
Remote Sens. 2022, 14(24), 6327; https://doi.org/10.3390/rs14246327
Submission received: 25 October 2022 / Revised: 10 December 2022 / Accepted: 11 December 2022 / Published: 14 December 2022

Abstract

:
Increasing numbers of observations and research studies have detected widespread vegetation greening across China since the 1980s. The dynamics of vegetation can influence the process of terrestrial evapotranspiration (ET) and its components (vegetation transpiration (Ec), soil evaporation (Es), and intercepted precipitation evaporation (Ei)). However, it is still not clear how the ET components responded to China’s greening. This work investigated the characteristics and dynamics of ET components for different climate zones and moisture regions and the dominant ecosystems over China using PML ET products during 2001–2020. The results showed that ET increased by 9%, Ec and Ec/ET increased by 18.7% and 4.4%, respectively, contributing to more than 90% of the ET increment across China. The increment in Ec generally increased from north to south with the most obvious change of Ec/ET having occurred in the temperate zone and semi-humid regions. Es increased in arid, semi-arid and plateau climate regions but decreased in the remaining climate zones. As a result, Es only decreased by 2.7% on average, while Es/ET decreased by 5.7%. Ei increased by 26.6% across China, while Ei/ET changed slightly due to the little contribution of Ei to ET. The agricultural ecosystem presented the most obvious change of Ec and Es among the dominant ecosystems, and the most obvious change of Ei occurred in the forest ecosystem. Vegetation greening altered biophysical factors that govern heat and vapor exchange in the soil-plant-atmosphere continuum, thus modulating the reallocation of ET components.

1. Introduction

Increasing research on greening has revealed a widespread increase in leaf area index (LAI) (earth greening) on a global scale since the 1980s [1,2,3]. The greening area is clustered mainly in two largest developing countries, China and India, which dominated the earth greening by ecological protection, land use and management, and LAI changes in China alone accounted for more than one quarter of the world LAI increment [2].
Many previous studies found an increase of forest LAI in northeastern, northern, northwestern and central China [4] and increased LAI, vegetation coverage (VC) and carbon sequestration in karst regions in southern China [5,6]. A greening trend was also observed for the Loess Plateau where LAI, VC and net primary productivity all experienced an increasing trend over the past decades [7,8]. Long-term series of the Normalized Difference Vegetation Index (NDVI) also suggested an increasing greenness over China since 1the 1980s, especially in the growing season [9,10]. LAI, VC and NDVI are among the most important vegetation indices modelling the canopy density, coverage, and productivity, which together determine greenness [11]. The above and numerous other studies and observations consistently proved a greening China over the past decades [12,13], which would affect the energy and water exchange and carbon cycle in soil-plant-atmosphere continuum [14].
Vegetation plays a critical role in water and carbon cycles, as well as the land surface energy balance through evapotranspiration (ET) [15,16], which would be inevitably affected by vegetation greening. Previous studies based on modelling results showed that earth greening enhanced the ET globally [17]. Combining remote sensing images, meteorological datasets, field observations and the Penman–Monteith–Leuning (PML) model, Bai et al. [18] found that ET increased over nearly three quarters of China due to vegetation greening, with the most pronounced change occurring in southern China and the Qinghai-Tibet Plateau. The results agreed well with those reported for the Yellow River basin [19], Loess Plateau [20,21] and Qilian Mountain [19] where ET increased with the vegetation greening. Yuan et al. [22] explored the potential mechanism underlying the effect of vegetation dynamics on ET using a physical model, and the results revealed that vegetation greening reduced surface albedo, aerodynamic conductance and canopy stomatal conductance, resulting in the increase of ET.
Evapotranspiration consists of three major components, that is, vegetation transpiration (Ec), soil evaporation (Es), and intercepted precipitation evaporation (Ei). While previous studies investigated the relation between vegetation greening and the overall ET dynamics in China, it is still not clear how and why the three ET components have each responded to vegetation greening over China. A recent study from Zhang et al. [23] derived time series of ET components combining remote sensing data and the PML model, and the results revealed an increasing Ec and Ei, yet a decreasing Es during 2004–2017 at a global scale. Some works investigated the effect of vegetation change on ET components, and found that Ec and Ei were positively correlated with LAI and NDVI [24,25,26], while Es was negatively correlated with LAI [27,28]. However, the mechanism by which vegetation greening regulated the reallocation of ET components was still not fully revealed.
Therefore, this work was carried out with two main objectives: (1) to investigate the characteristics and dynamics of the ET components over the past two decades across different regions of China; and (2) to discuss the biophysical mechanisms driving the response of ET components to vegetation greening. The work is expected to deepen our understanding of the processes of the water and carbon cycles and energy balance in the soil-plant-atmosphere continuum under the notable vegetation greening in China.

2. Materials and Methods

2.1. Data Collection

A long term time series of ET components was employed to analyze the dynamics of ET components across China during 2001–2020. This dataset was derived with PML-V2 algorithm which was revised by Gan et al. [29] and Zhang et al. [16,30] from the PML algorithm developed by Leuning et al. [31]. The accuracy of the ET product was validated at 95 flux towers around the world, with the RMSE of 0.69 mm/day for the total ET [30]. In this work, the ET components product, with 8-day temporal and 500 m spatial resolution, from 2001–2020 over China was obtained with the Google Earth Engine (https://developers.google.com/earth-engine/datasets/catalog/CAS_IGSNRR_PML_V2_v017?hl=en (accessed on 1 May 2022)).
The climate zones and moisture regions data of China were obtained from the Data Center for Resources and Environmental Sciences, Chinese Academy of Sciences (https://www.resdc.cn (accessed on 2 May 2022)). China’s complex and varied climate results in a great variety of temperature and moisture zones. In terms of temperature variation, continental China can be sectioned from south to north into tropical, subtropical, and temperate zones and a plateau climate zone. In terms of moisture, it can be sectioned from east to west into humid, semi-humid, semi-arid and arid regions (Figure 1).
Data for the dominant terrestrial ecosystems including agriculture, forest and grassland ecosystems (Figure 1) was extracted form land cover/land use data of China which was obtained from the Data Center for Resources and Environmental Sciences, Chinese Academy of Sciences (https://www.resdc.cn (accessed on 3 May 2022)). This data was derived from the Landsat images with supervised classification and visual interpretation, and has been widely used to monitor the land use change at regional scale [32].
The eddy covariance data of ET fluxes at 9 flux net sites including 5 sites for grassland ecosystems, 3 sites for forest ecosystems and one site for a wetland ecosystem over China were obtained from FLUXNET2015 (http://fluxnet.fluxdata.org/data/fluxnet2015-dataset/ (accessed on 5 May 2022)).

2.2. Validation of PML ET Product over China

The PML ET product was evaluated using the eddy flux data at 95 flux towers around the world, but the accuracy of the PML model was not evaluated over China. Therefore, the accuracy of the PML ET product was validated using the eddy flux data set at 9 flux net sites across China. The root mean square error (RMSE) and coefficient of determination (R2) were used to assess the performance of the PML model over China. RMSE provides information on the short term performance of the correlations by allowing a term by term comparison of the actual deviation between the estimation and measurements; a lower value of RMSE indicates a better performance. The R2 varying between 0 and 1 was adopted to measure the fit of model, with a higher value suggesting a better performance.

2.3. Analysis Method

The interannual trend of ET components was analyzed using the simple linear regression model:
k = n × i = 1 n i × E i i = 1 n i i = 1 n E i n × i = 1 n i 2 i = 1 n i 2
where k is the regression slope, k > 0 suggests an increasing trend, and k < 0 suggests a decreasing trend. E i is the ET component for the ith year, and n is the number of years.
The significance of the linear regression model was measured using F-test:
F = U Q / n 2 F 1 ,   n 2
U = i = 1 n ( y i ^ y ¯ ) 2
Q = i = 1 n ( y i y i ^ ) 2
where U is the sum of squares measuring the dispersion of data points, Q is the residual sum of squares determining the variance that is not explained by the regression model, n is the number of years, y i is value of the ET component for the ith year, y i ^ is the estimated value of ET components by the regression model, and y ¯ is the average value of y i .
Analysis of the interannual trends of ET components for each pixel across China was conducted using the batch processing script complied by Python. Subsequently, combing the changing rate and the significance of the interannual trends, continental China was reclassified into 6 classes including highly significantly increased (k > 0, p < 0.01), significantly increased (k > 0, 0.01 ≤ p < 0.05), insignificantly increased (k > 0, p ≥ 0.05), highly significantly decreased (k < 0, p < 0.01), significantly decreased (k < 0, 0.01 ≤ p < 0.05), and insignificantly decreased (k < 0, p ≥ 0.05).

3. Results

3.1. Performances of the PML Product over China

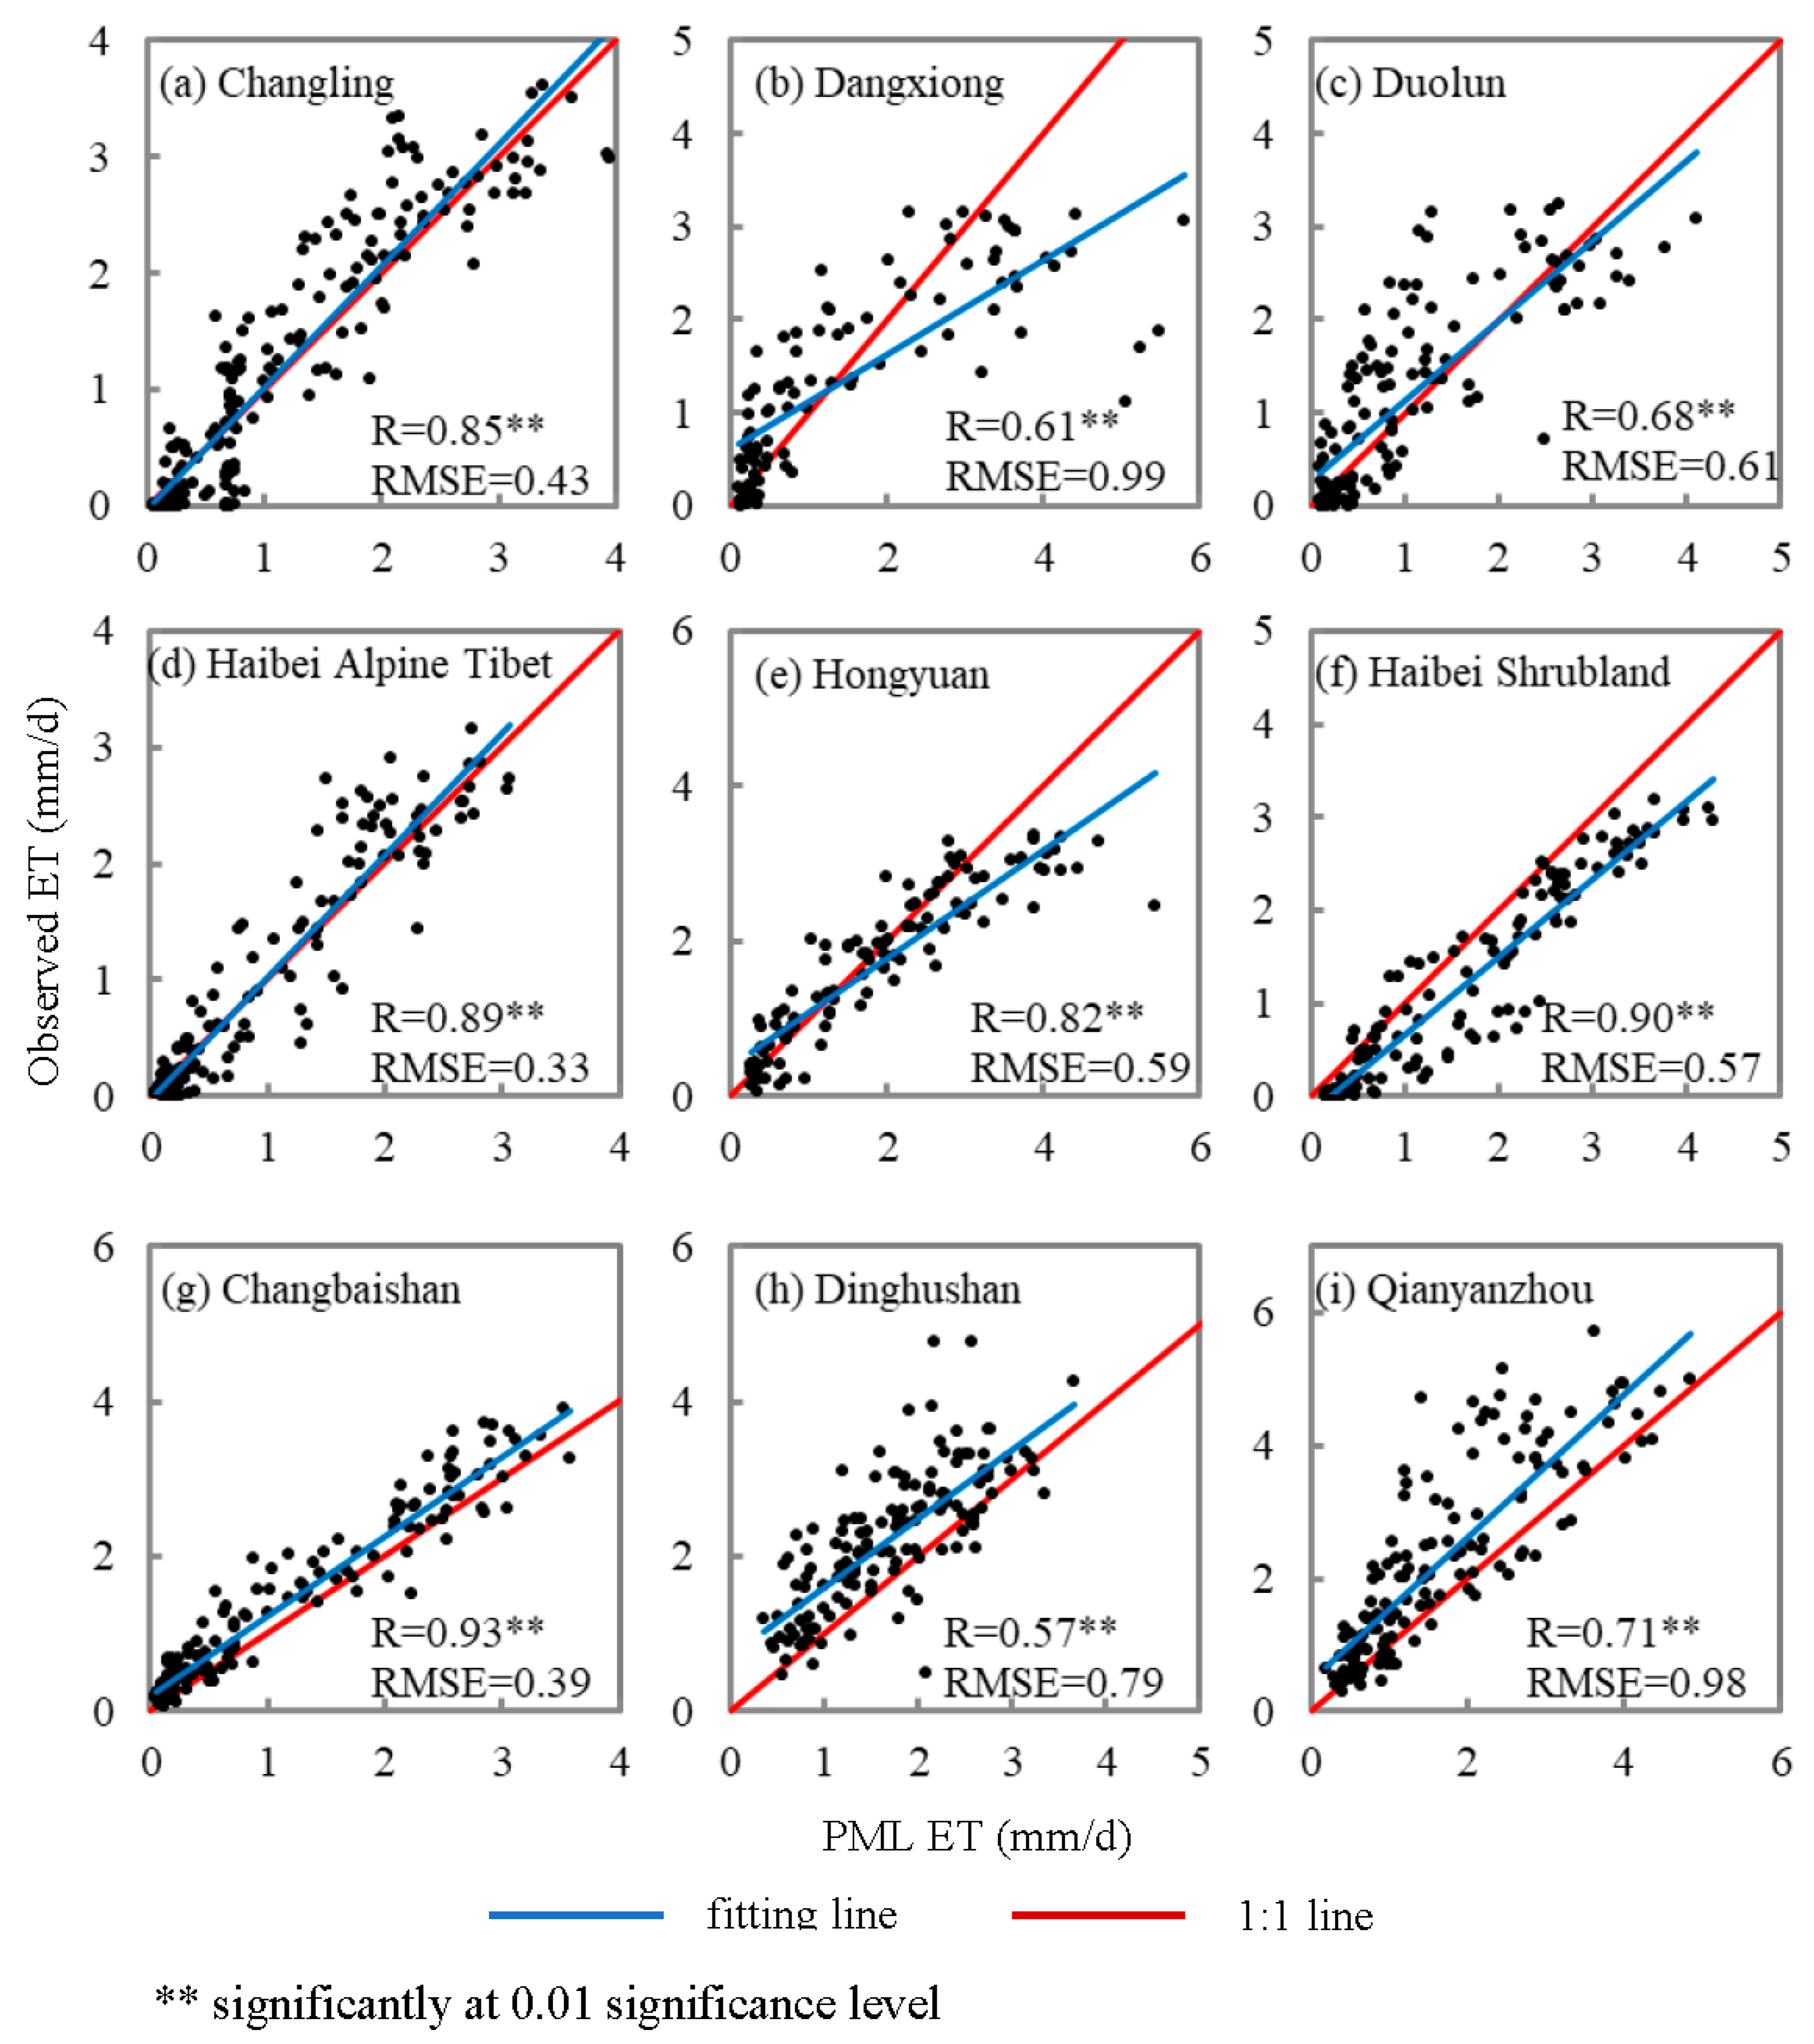
The performance of the PML model for the total ET at 9 flux net sites (Figure 2) showed good agreement between the model estimation and measurements. The R2 varied between 0.57 and 0.93 with the average of 0.77, and the RMSE ranged from 0.33 to 0.99 mm/d with the average of 0.63 mm/d. This suggests a reasonable accuracy of the PML product over China, which is slightly superior to (has a smaller RMSE than) the performance at the global scale (RMSE of 0.69 mm/day [30]). The PML model performed best at the Haibei alpine meadow ecosystem (Figure 2d) with the lowest RMSE of 0.33 mm/day, followed by that at Changbaishan forestry ecosystem (Figure 2g) and Changling grassland ecosystem (Figure 2a), while higher RMSE was observed at Qianyanzhou forestry ecosystem (Figure 2i) and Dangxiong wetland ecosystem (Figure 2b).

3.2. General Variation of ET Components across China over the Past Two Decades

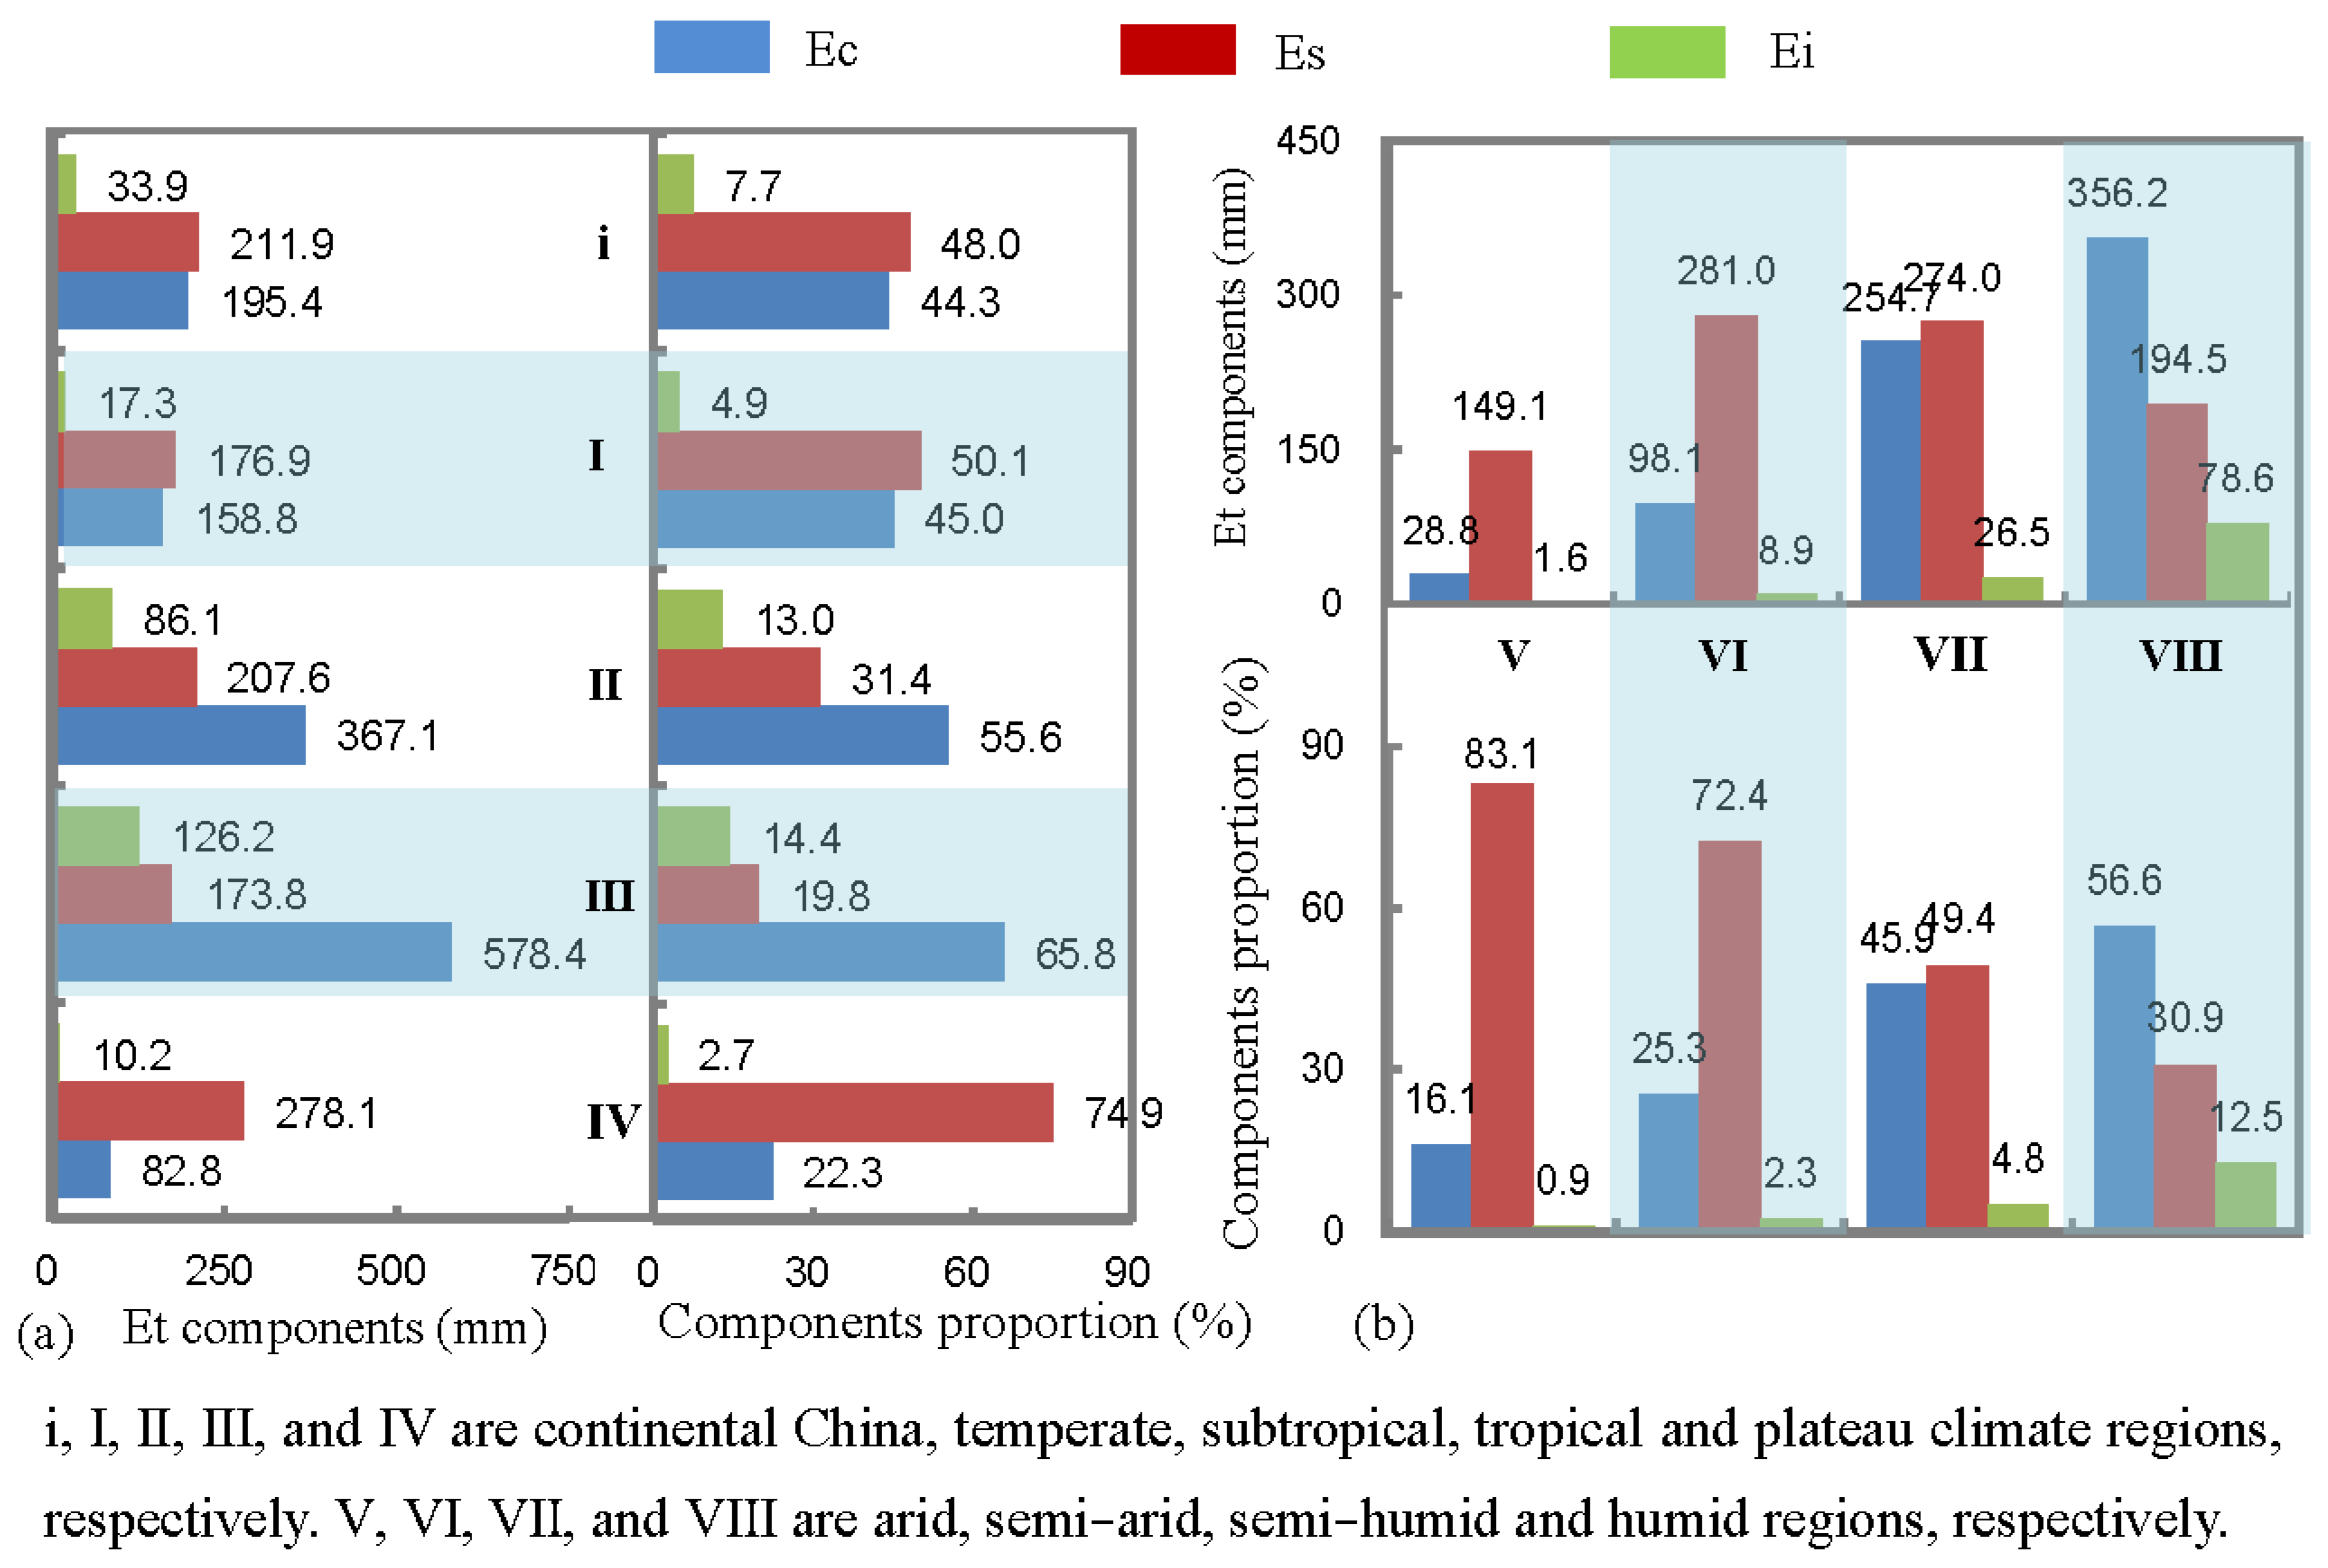
The annual mean ET varied between 392.8 mm and 469.7 mm across China during 2001~2020, with the average ET of 441.3 mm, and the ET components varied between 168.4 mm and 216.7 mm (mean 195.4 mm) for Ec, 194 mm and 225.4 mm (211.9 mm) for Es, and 30.4 mm and 40.5 mm (mean 33.9 mm) for Ei, which accounted for 44.2%, 48.1% and 7.7% of ET, respectively.
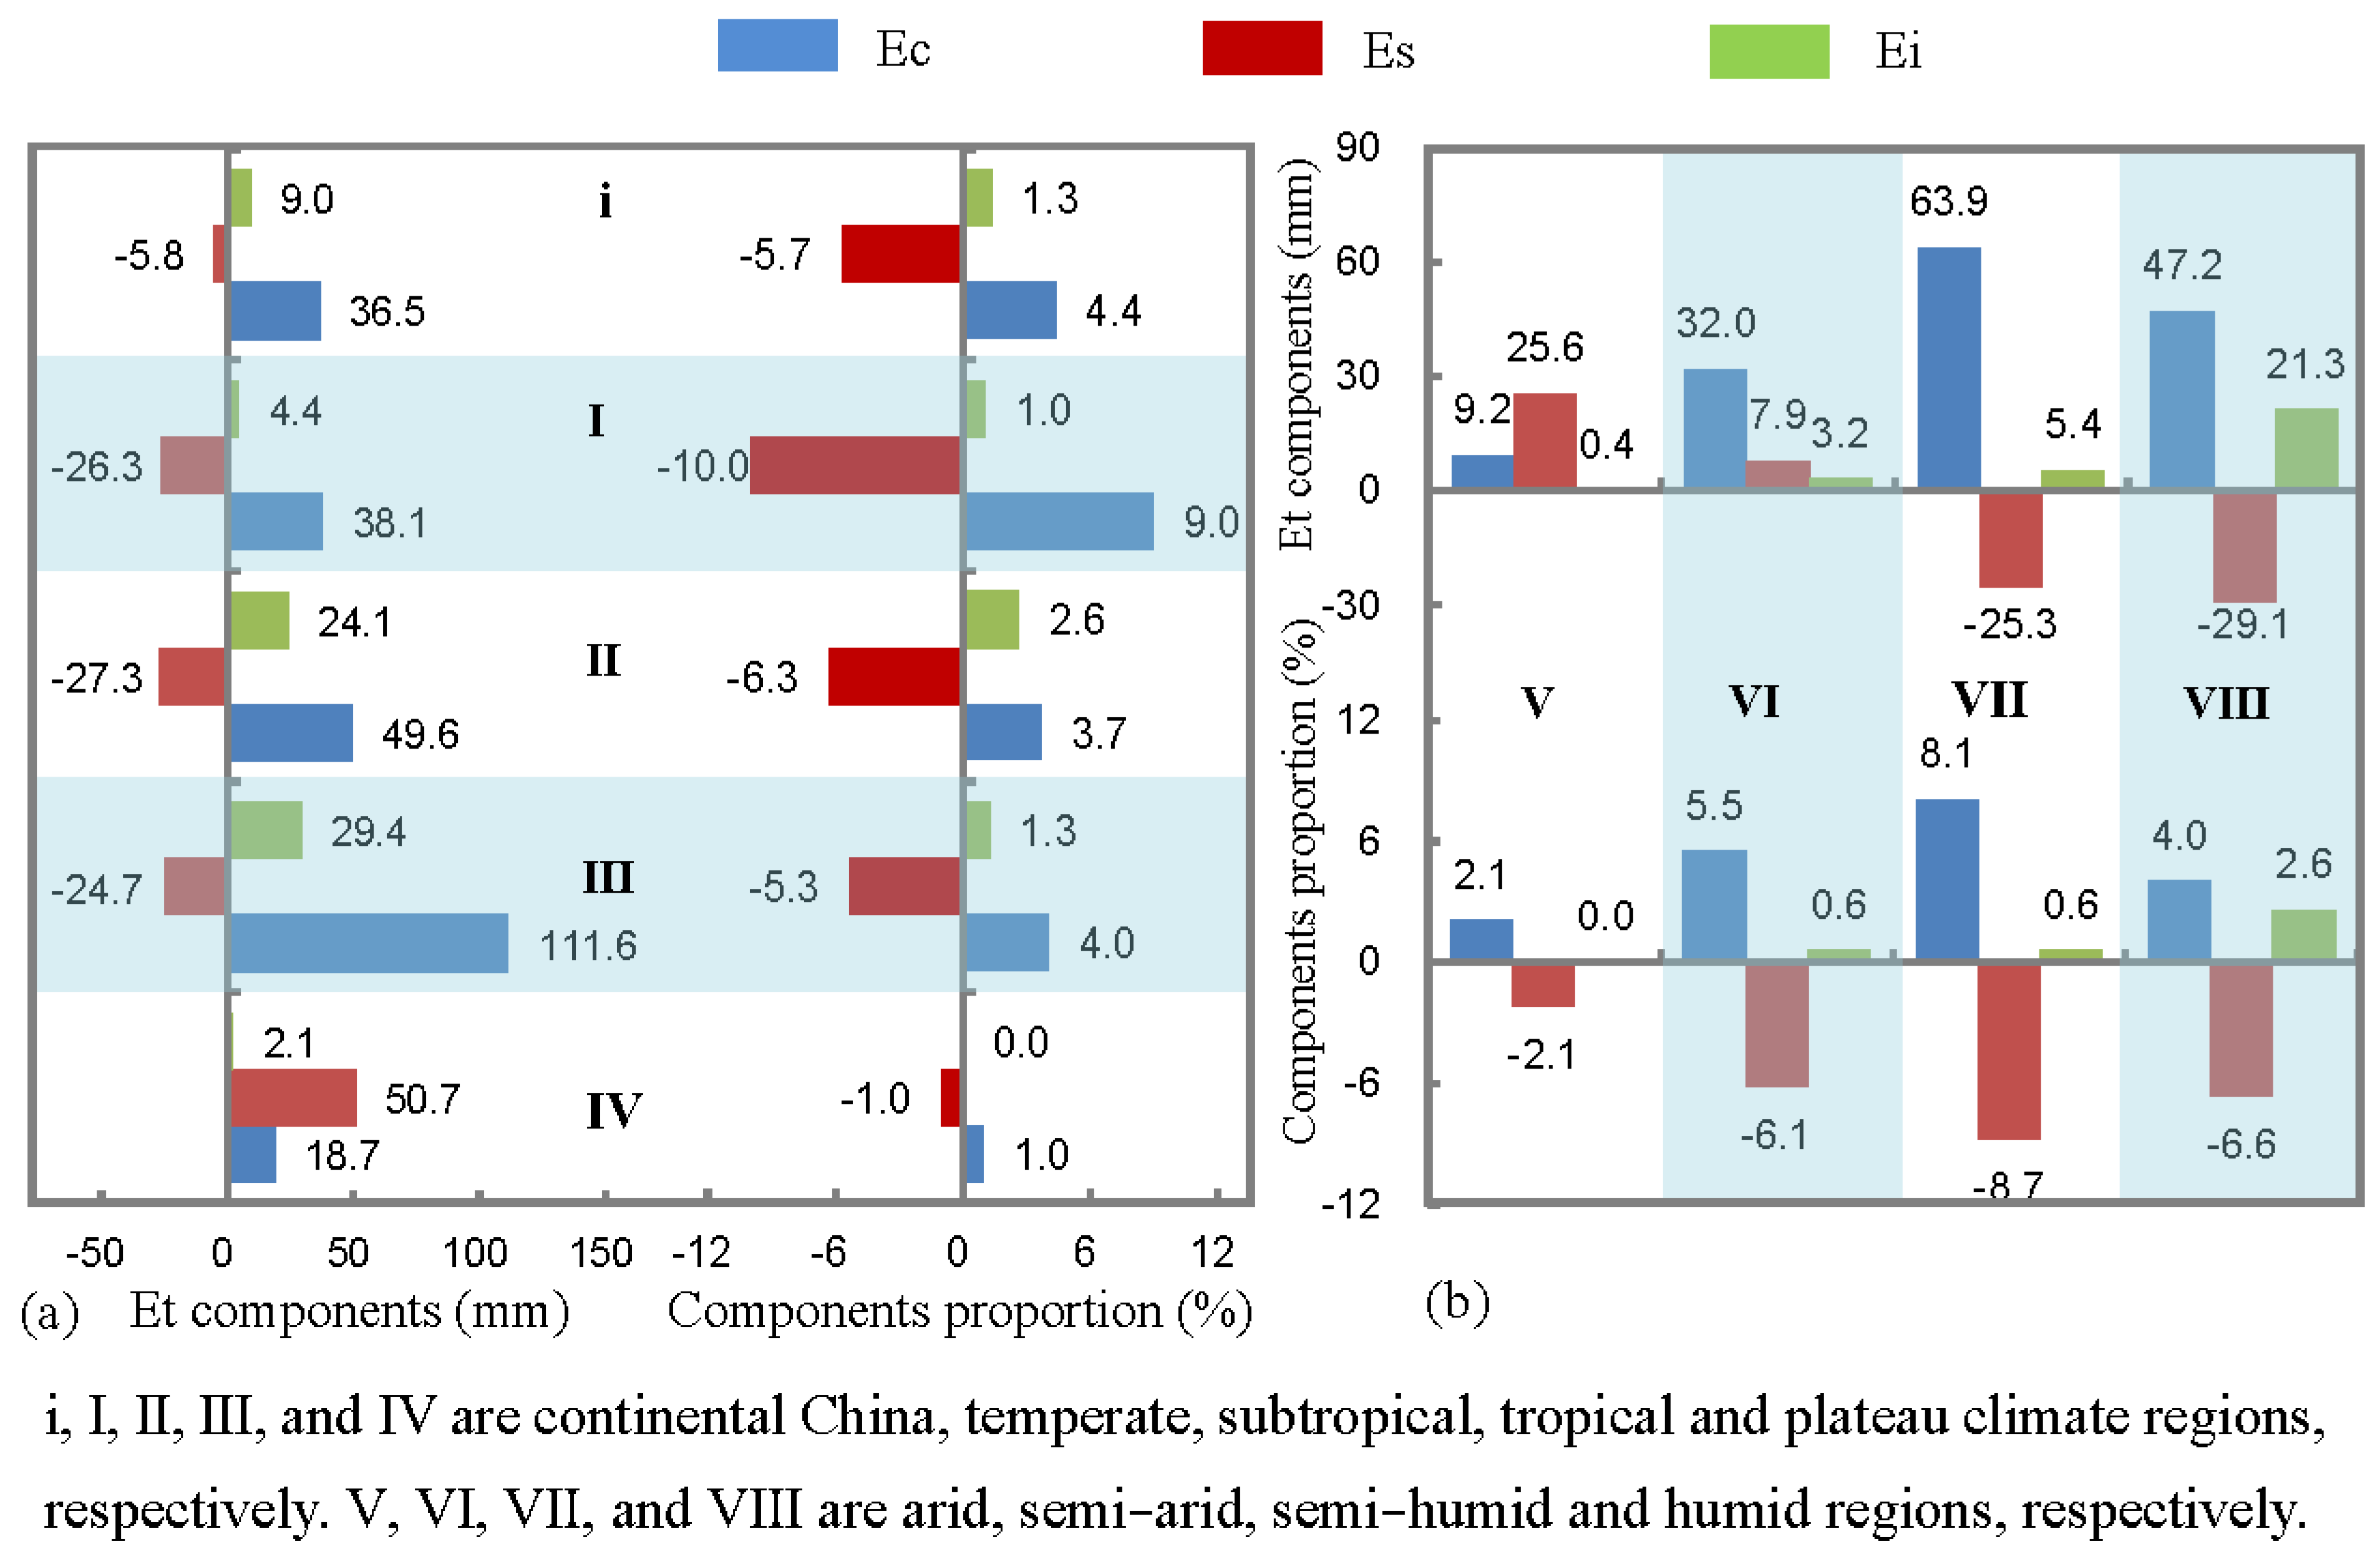
Overall, increasing trends were observed in ET (36.5 mm or 18.7%), Ec (36.5 mm or 18.7%) and Ei (9 mm or 26.6%), whereas Es decreased by 5.8 mm or 2.7% in the context of China greening over the past two decades. Increase in Ec contributed to 91.8% of the ET increment, suggesting the dominant role of vegetation transpiration in governing the ET change over China. The above changes can also be expressed in terms of the ratio of each ET component to the total ET, that is, an increase of Ec/ET by 4.4%, Ei/ET by 1.3%, and a decrease of Es/ET by 5.7%.
The interannual variation of ET components showed obviously spatial heterogeneity as shown in Figure 3. A large portion (87.5%) of continental China experienced an increasing Ec, with the regions classified “significantly increased” and “highly significantly increased” accounting for more than one third of the area of China; these areas were mainly distributed in the northern China plain and northeastern China plain. Es decreased over about 64% of the area of China, with the “significantly decreased” and “highly significantly decreased” regions accounting for more than 30% of the total area of China; these areas were also mainly distributed in the northern China plain and northeastern China plain. Es significantly increased in 17% of the area of China including the Qinghai-Tibet plateau and the northern Trim basin. Increasing Ei was observed over about 60% of the area of China, and the “significantly increased” and “highly significantly increased” regions accounted for nearly one third of China; these areas were mainly distributed in eastern and northern areas of northeastern China.

3.3. ET Components’ Variation over Different Climate Zones and Moisture Regions

The annual mean and the interannual variation of ET components for different climate zones and moisture regions are presented in Figure 4 and Figure 5, respectively. Overall, the spatial variations of ET, Ec and Ei are similar to those of air temperature and precipitation [26]. In terms of climate variations, Ec, Ei and their proportions to ET (Ec/ET, Ei/ET) generally increased as the temperature increased from north to south, presenting obvious latitudinal zonality, except for the plateau climate region (Figure 4). Ec was the dominant component (>55%) of ET for subtropical and tropical regions, given their relatively high vegetation LAI and transpiration rates. The annual mean Es was 278.1 mm for the plateau climate region, contributing to approximately three quarters of ET, and the Es accounted for about half of ET for the temperate zone. The proportion of Es to ET (Es/ET) generally decreased from north to south and from temperate to tropical zones, presenting opposite latitudinal zonality to Ec/ET and Ei/ET.
In terms of moisture variations, Ec, Ei and their proportions generally decreased as the moisture availability decreased from east to west, presenting obvious longitudinal zonality. The humid region had the highest Ec (Ec/ET) and Ei (Ei/ET) due to the abundant precipitation favorable to the growth of vegetation and the probability of canopy interception; on the contrary, lower Ec (Ec/ET) and Ei (Ei/ET) occurred in semi-arid and arid regions due to lower precipitation and sparser vegetation in these regions. Es in the semi-arid region was similar to that in the semi-humid region. Contrary to the patterns of Ec (Ec/ET) and Ei (Ei/ET) in relation to the moisture variation, Es (Es/ET) generally increased as the moisture decreased from east to west. Es became the most import ET component in semi-arid (>70% of ET) and arid (>80% of ET) regions.
China’s greening had significant effects on the dynamics of ET components and their proportions with obvious regional variation across different climate zones and moisture regions (Figure 5). The increment of Ec along with vegetation greening generally increased as the temperature increased from north to south except for the plateau climate region. The most pronounced change occurred in the tropical region where Ec increased by more than 110 mm, whereas Ec/ET increased most obviously (9%) in the temperate zone but increased insignificantly in the plateau climate region. Along the moisture gradient, the increment of Ec and Ec/ET under China’s greening generally increased as the moisture availability increased from west to east except for the humid region; the most obvious change occurred in the semi-humid region where Ec and Ec/Et increased by 63.9 mm and 8.1%, respectively.
Compared to Ec, Es showed different change trend in most regions (Figure 5). Among the climate zones, Es increased by 50.7 mm in the plateau climate region but decreased in other climate zones by about 25 mm. In terms of moisture availability, the arid region and, to a lesser degree, the semi-arid region experienced increasing Es, while the humid and semi-humid regions experienced decreases in Es. However, Es/ET universally declined in all climate and moisture regions, with the most obvious decreases in the temperate zone (−10%) and the semi-humid region (−8.7%) but the least decreases in the plateau climate region (−1%) and the arid region (−2.1%).
The Ei increased in subtropical and tropical zones and humid regions by more than 20 mm (Figure 5), while its proportion to ET (Ei/ET) increased by only 2.6% in the subtropical zone and humid region and changed little in other climate zones and moisture regions.

3.4. ET Components Variation over Dominant Ecosystem Types

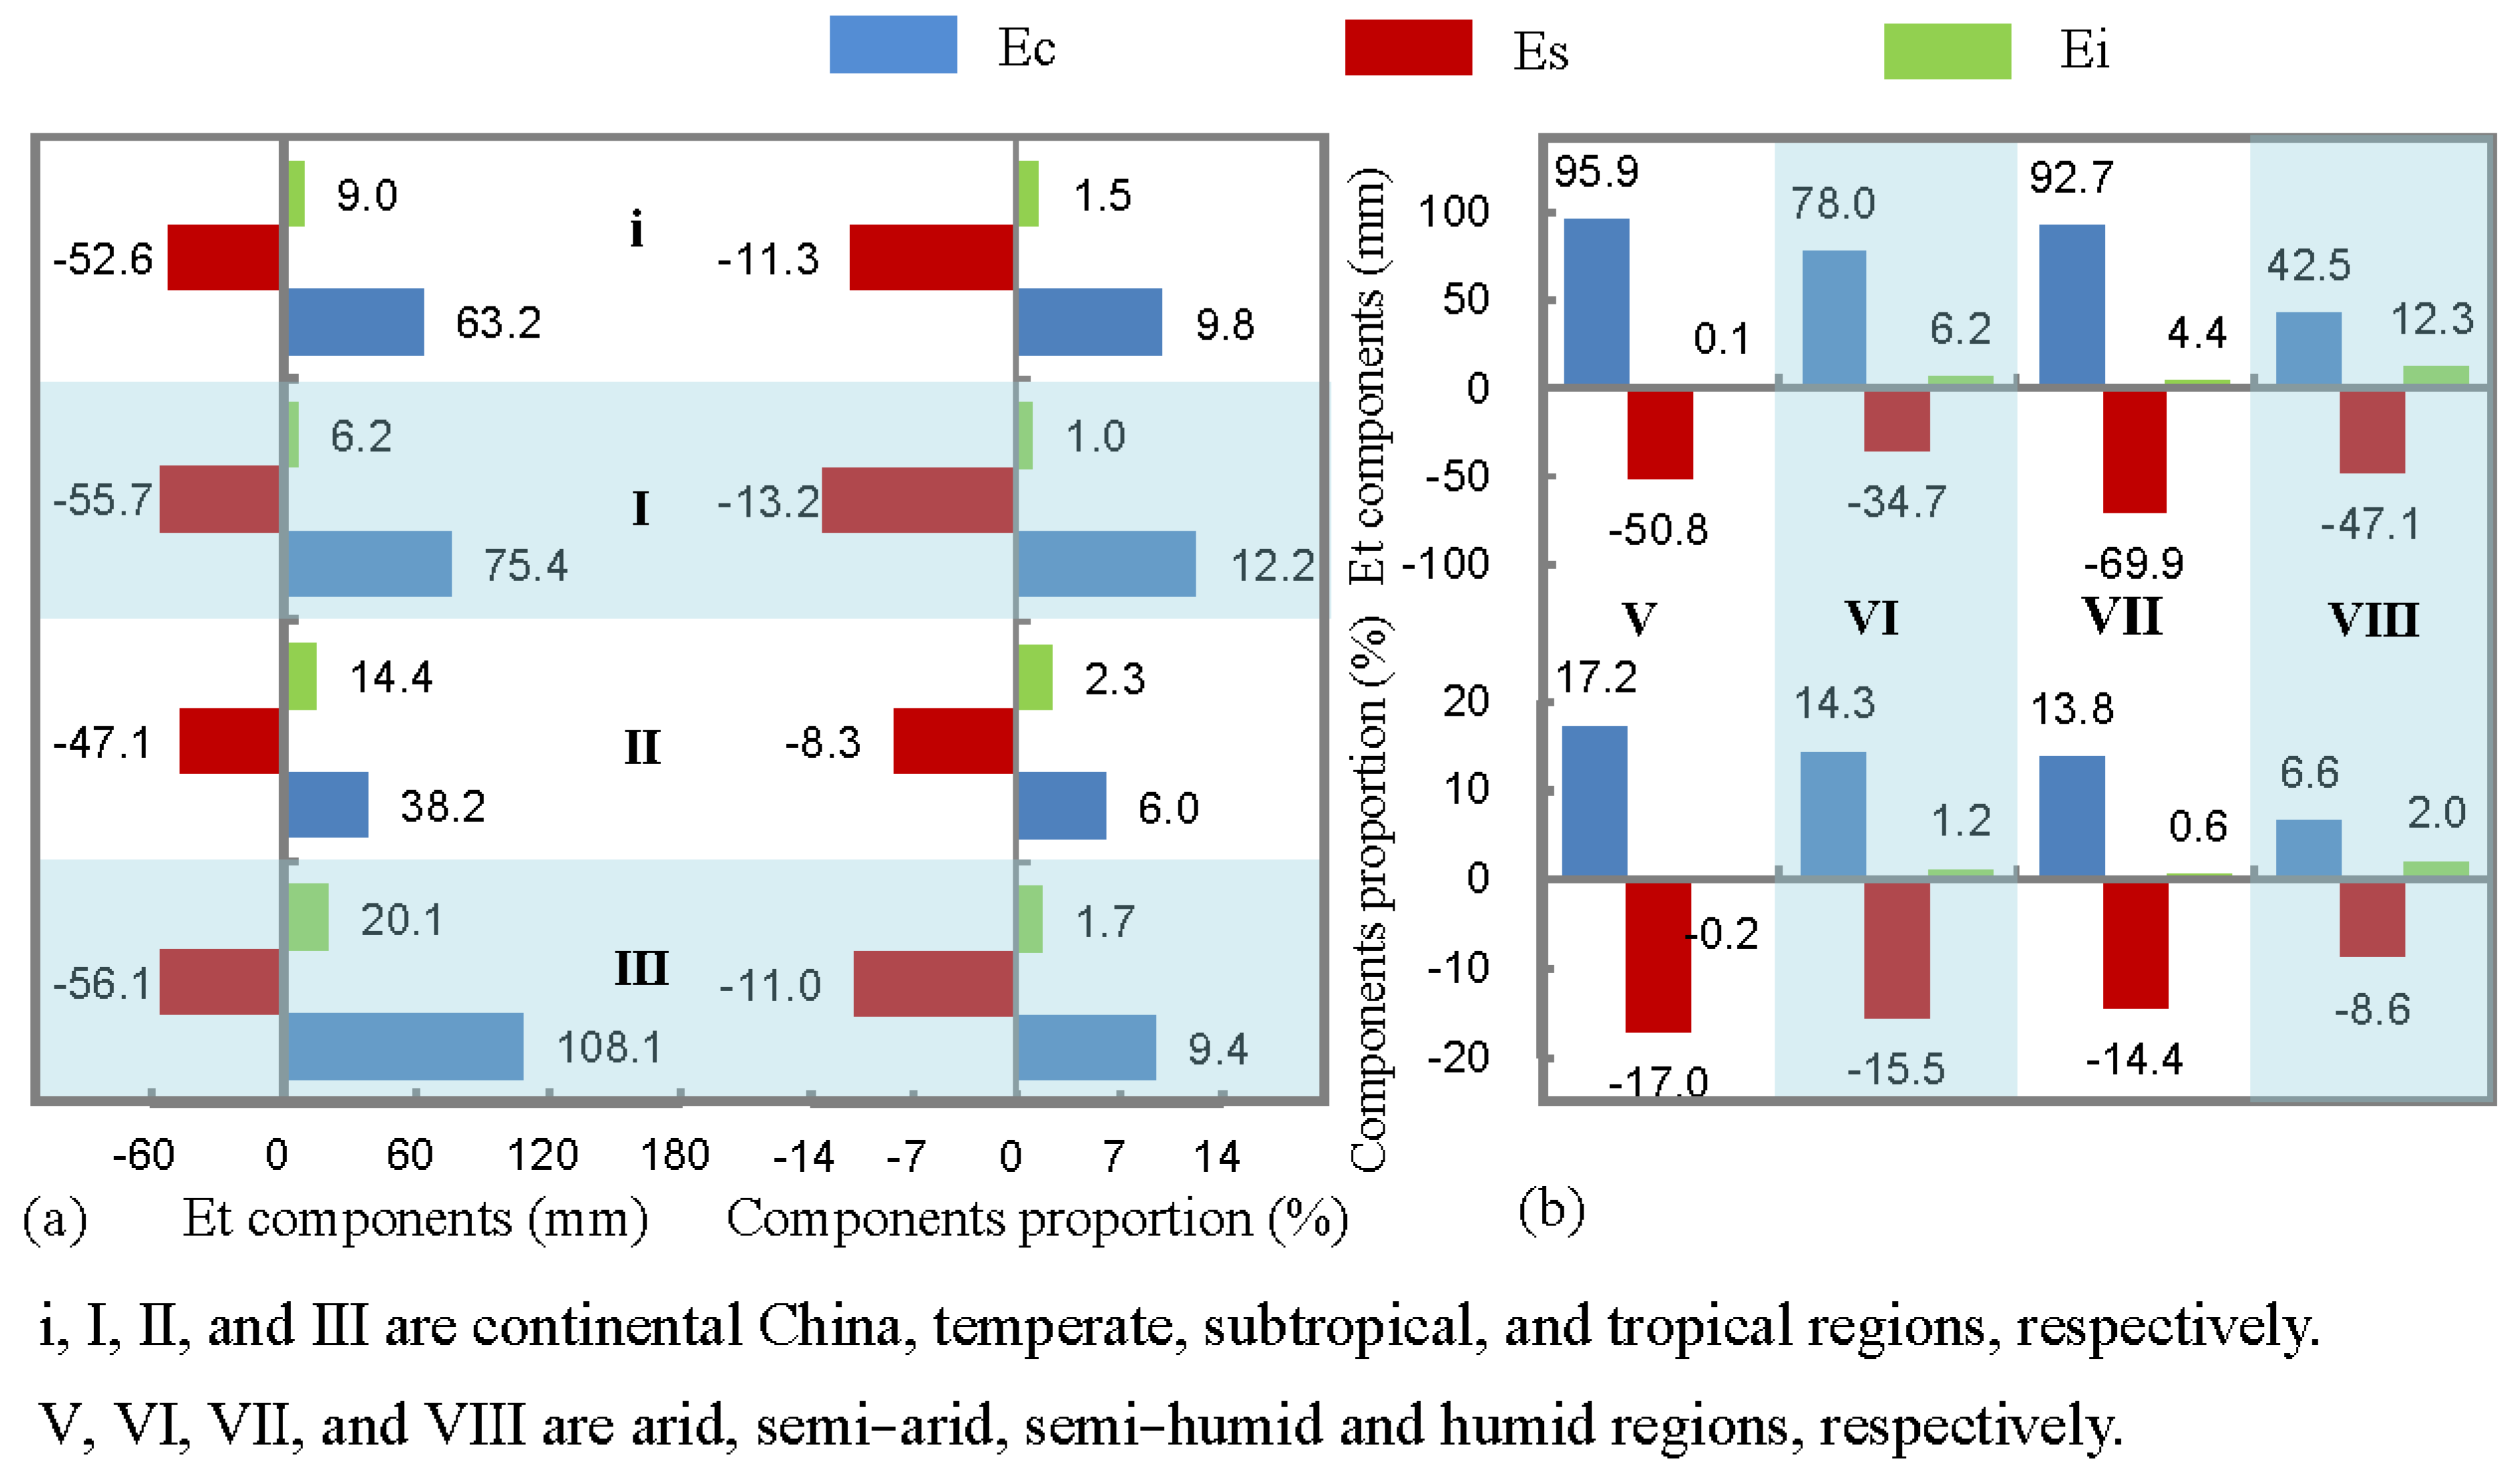
The ET components of the agriculture ecosystem changed greatly over the past two decades (Figure 6). Ec and Ec/ET increased by 63.2 mm and 9.8% over China, respectively, with the most pronounced change occurring in the tropical zone and arid region, respectively. The increment of Ec/ET generally decreased from west to east along the moisture gradient (Figure 6b). Es and Es/ET universally decreased by about 50 mm and 10%, respectively, in different climate zones and moisture regions (Figure 6). No significant difference in Es change was found among different climate zones (Figure 6a), whereas a slightly higher change of Es/ET occurred in the temperate zone. In terms of moisture regions, the maximum change of Es occurred in the semi-humid region. Ei increased by 9 mm on national average, with a higher increment towards the south, particularly the tropical zone and humid regions but with smaller changes in other moisture regions. Ei/ET slightly changed in different climate zones and moisture regions, with an average increment of 1.5%.
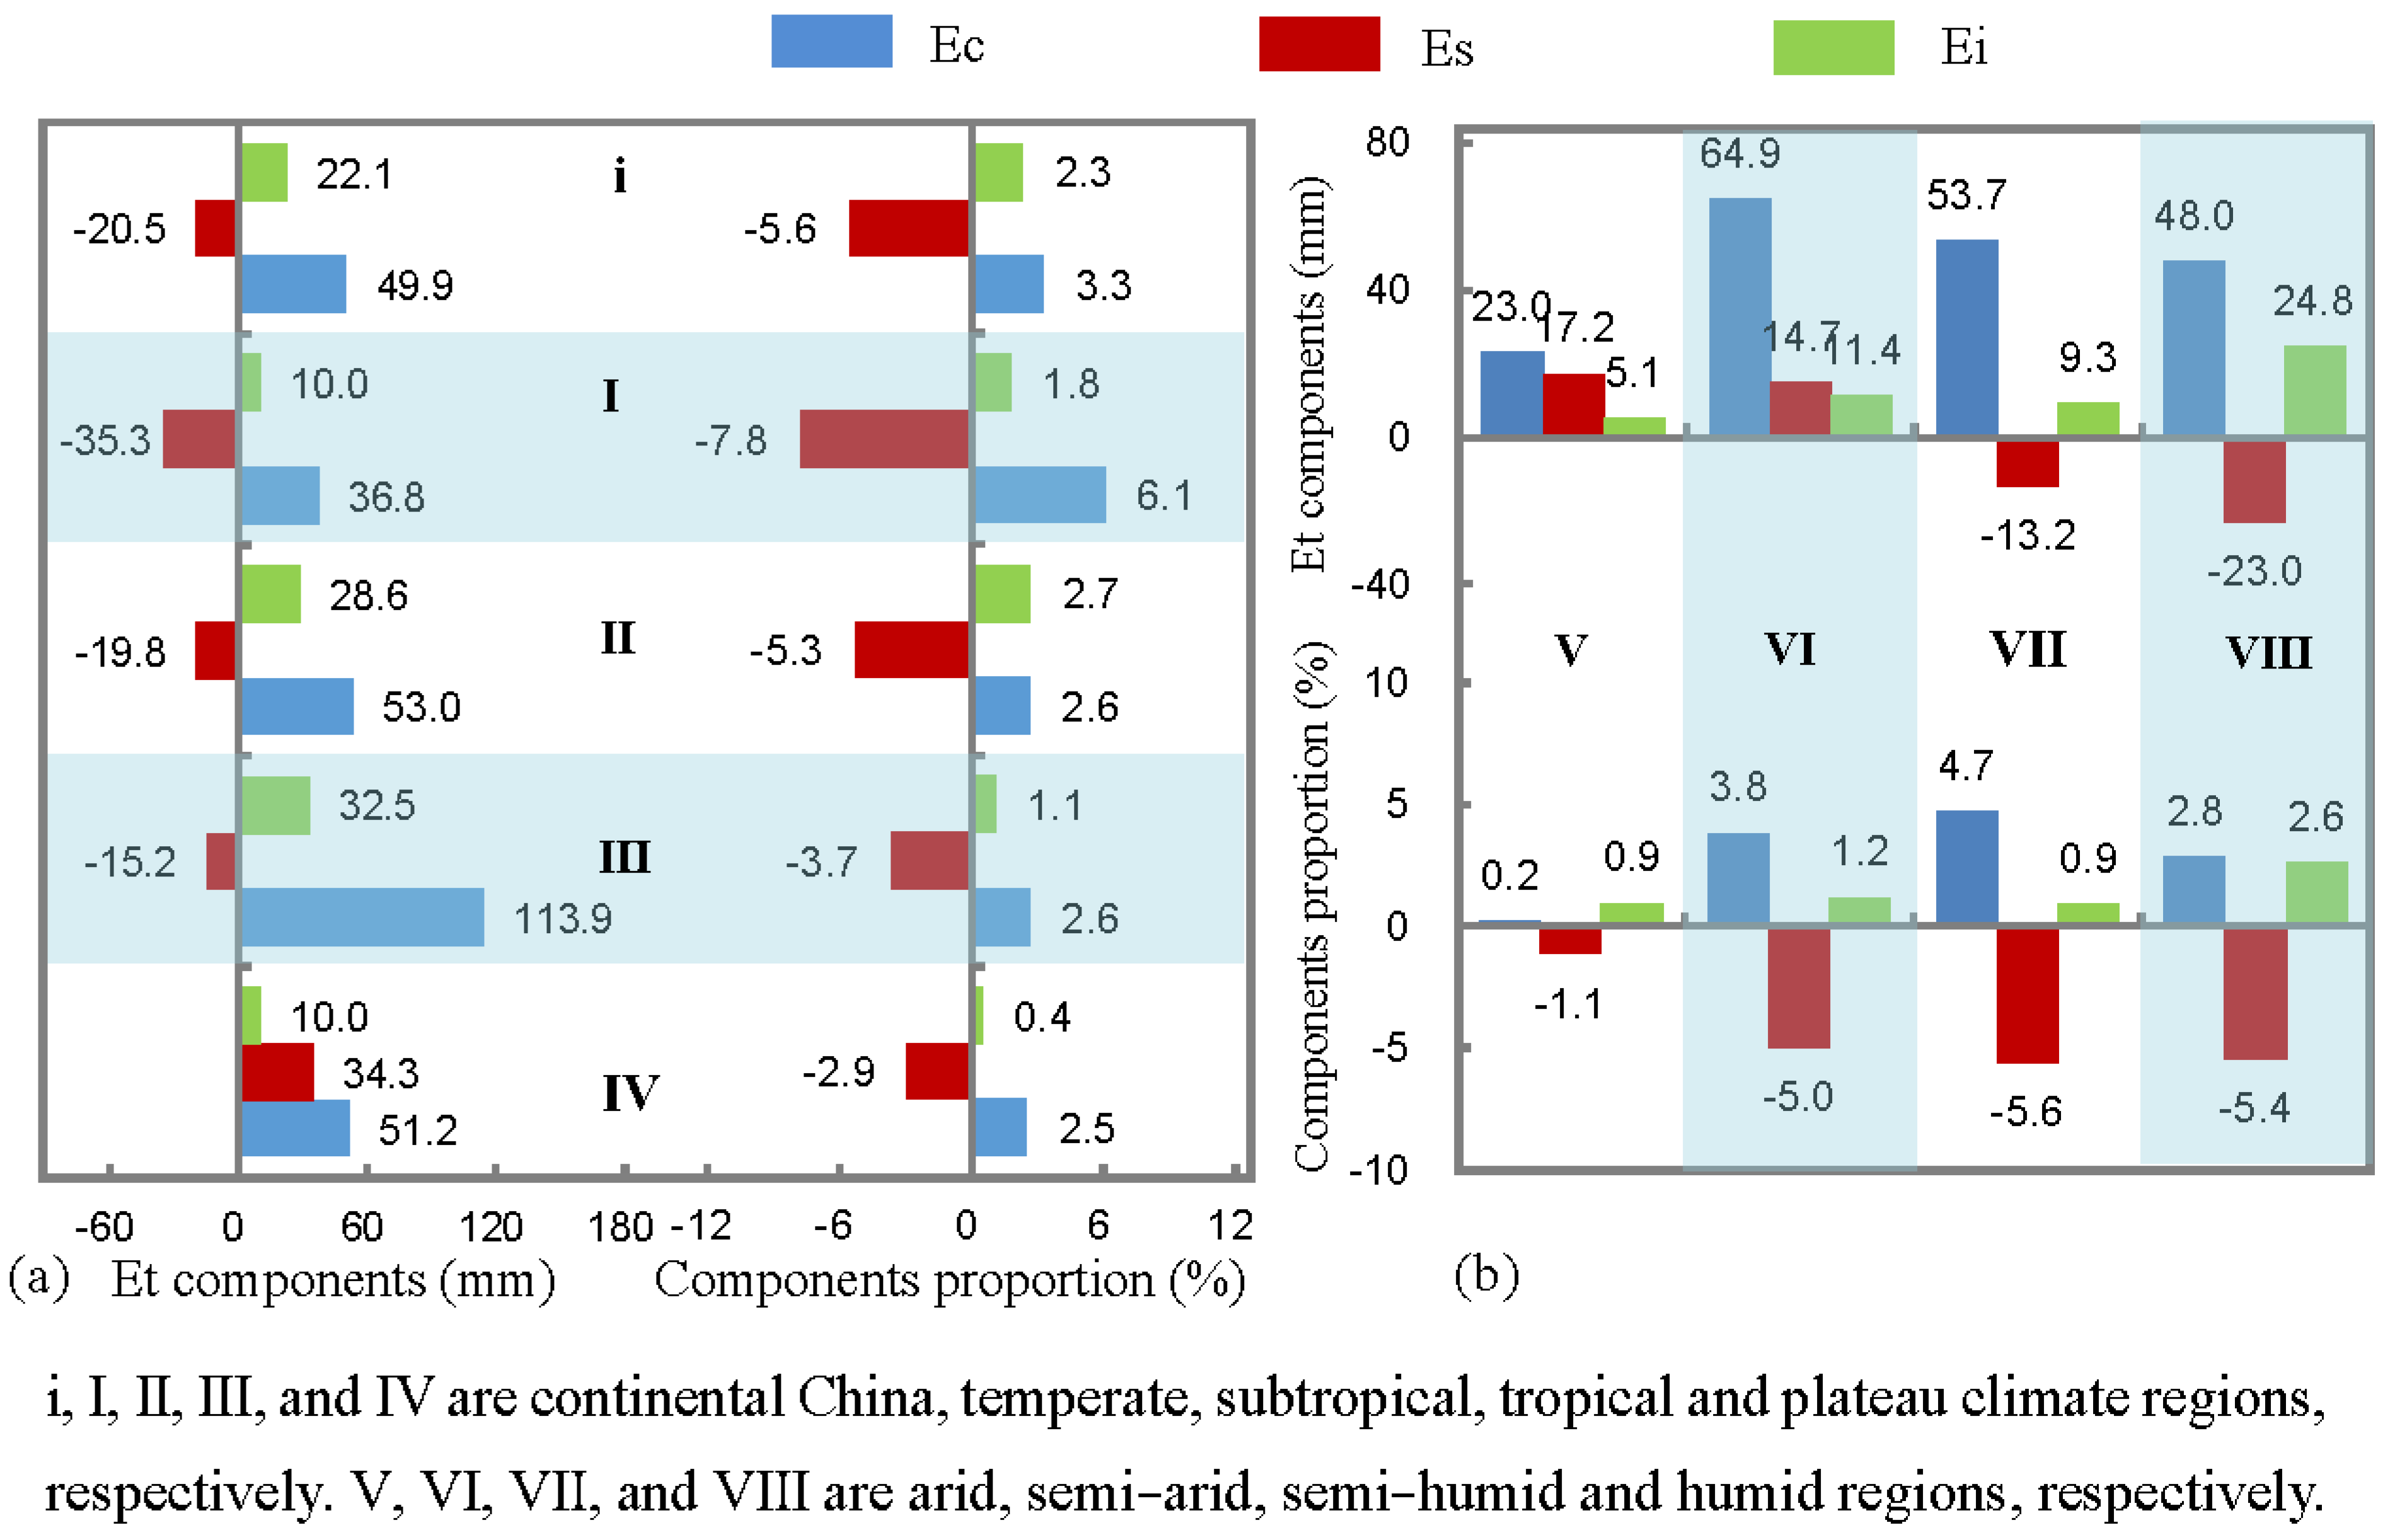
The Ec and Ec/ET of the total forestry ecosystem over continental China increased by 49.9 mm and 3.3% (Figure 7a), respectively. The change of Ec generally increased along the temperature gradient. The maximum increment (>110 mm) of Ec occurred in the tropical region, whereas the change of Ec/ET was higher in the temperate zone but similar in the remaining climate zones. The changes of Ec and Ec/ET in the plateau climate region were similar to those in the subtropical zone. In terms of moisture regions (Figure 7b), the maximum change of Ec and Ec/ET occurred in semi-arid and semi-humid regions, respectively, followed by the humid region. Es and Es/ET decreased by 20.5 mm and 5.6% (Figure 7a), respectively. More decrement of Es and Es/ET was generally observed towards the north, particularly for the temperate zone, whereas the plateau climate region showed an increasing Es. Semi-arid and arid regions experienced increasing Es, which were opposite to humid and semi-humid regions, while the Es/ET universally declined across different moisture regions (about −5% for humid, semi-humid and semi-arid regions). Ei increased by 22.1 mm national wide, with the most obvious change (>30 mm increment) in the tropical zone, while Ei/ET only increased by 2.3% on average. The pattern of the Ei change in the forest ecosystem along the temperature gradient was similar to that of the agriculture ecosystem. In terms of moisture regions, the maximum increment of Ei (24.8 mm) and Ei/ET (2.6%) occurred in the humid region, and increments of Ei/ET in remaining moisture regions were around 1%.
The Ec and Ec/ET of the grassland ecosystem increased by 26 mm and 3.2% (Figure 8), respectively. The increment of Ec generally increased as the moisture availability increased from west to east, with the maximum increment of Ec (68.1 mm) occurring in the humid region. The Ec/ET slightly decreased in the arid region but increased in other moisture regions by 4.2% to 5.5%. The subtropical zone had a much higher Ec increment than the temperate zone, although a similar increment of Ec/ET was observed in both zones. Es increased by 21.5 mm, while the Es/ET decreased by 3.6% on average (Figure 8). Es decreased in both the subtropical zone and humid region by about 24 mm, while it increased in other climate zones and moisture regions, with the most pronounced increment in the arid region by more than 60 mm. Except for the slight increase of Es/ET in the arid region, Es/ET universally decreased in other climate zones and moisture regions, with the maximum decrease of Es/ET in the humid region followed by that in the subtropical zone. Ei in the subtropical zone and humid region increased by more than 20 mm on average, while Ei/ET only increased by about 2.4% in these two regions. In general, Ei and Ei/ET changed slightly in semi-arid and arid regions which accounted for more three quarters of the area for grassland, resulting in a slight change in Ei and Ei/ET of grassland over China.

4. Discussion

4.1. Effect of the Vegetation Greening on ET

Our results based on the PML model data showed the overall ET increased by 9% along with vegetation greening across China during 2001–2020, which is consistent with earlier studies using remote sensing, meteorological datasets, ground observations and models that revealed a positive relationship between vegetation greening and ET over a large portion of China since the 1980s [17,18,19,20,21,33] and is also consistent with the general positive effect of vegetation greening on ET globally [17,18,19,33,34].
The CLM5 model was used to explore the potential mechanism underlying the effect of vegetation greening on ET. Results revealed that vegetation greening affected ET through biophysical factors such as surface albedo, canopy roughness (aerodynamic conductance), and canopy stomatal conductance, which regulated the heat and vapor exchange in the soil-plant-atmosphere continuum [22]. Satellite observation showed that vegetation greening reduced surface albedo, resulting in the increase of radiation absorption and net radiation [8,22,24,35].
Li et al. [25] used a coupled climate model to simulate the relation between vegetation greening and climate, which suggested that most of the increased net radiation due to vegetation greening was used to enhance latent heat flux, that is, ET. A number of studies used ground measurements, remote sensing and modelling to prove that increase of LAI favored the dissipation of net energy through evaporation, resulting in a cooling effect on the surface [8,27,36]. Cooling of the surface can stabilize the air near the surface, which can weaken the turbulent heat exchange between land and atmosphere, leading to a reduction of sensible heat flux and increase of latent heat flux [28]. Moreover, variation of LAI and canopy structure can alter the aerodynamic resistance, which was also expected to affect the turbulent heat exchange in the soil-plant-atmosphere continuum. Zeng et al. [37] and Li et al. [25] and Chen et al. [2] observed that increased LAI was associated with surface roughness and reduced aerodynamic resistance, leading to increased latent heat flux and ET.

4.2. Mechanism of Vegetation Greening Modulating the ET Component

Our results suggested that ET components significantly changed in the context of vegetation greening across China. Specifically, Ec, Ec/ET and Ei significantly increased and Ei/ET slightly increased. Reduced surface albedo due to the increasing LAI led to the increase of the absorbed radiation by vegetation [8,22,24,35], which favored the dissipation of latent heat flux through transpiration (Ec) [25]. Meanwhile, increasing LAI with vegetation greening also meant more abundant leaf stomatal openings that directly contribute to higher canopy conductance and transpiration (Ec) [24,37], a major component of ET. These mechanisms explain why Ec and Ec/ET were nearly universally elevated with vegetation greening across different climate zones and moisture regions and ecosystem types across China.
Our results found that increase of Ec contributed to more than 90% of the ET increment in the context of China’s greening. A recent study combining remote sensing datasets and a PT-JPL model also showed that Ec and Ec/ET increased with China’s greening since the 1980s, and vegetation greening contributed to 57.9% of the Ec increment [38]. Modelling results from Institute Pierre Simon Laplace climate model showed that 62.6% of increased latent heat flux due to increasing LAI was dissipated through vegetation transpiration [25]. These results suggested the major contribution of vegetation greening to the increase of Ec, and the dominant role of the enhanced Ec to the increase of ET. Previous studies and our results both revealed that vegetation greening enhances vegetation transpiration to enhance the overall ET and reallocate the ET components [21,28,39], which govern the heat and vapor exchange in the soil-plant-atmosphere continuum.
Previous observations and research found that Ei was significantly influenced by LAI and precipitation. Increasing LAI can intercept more precipitation, providing more water for evaporation on the leaf surface [40,41], which was more pronounced in tropical and subtropical zones that have abundant precipitation and high LAI; in contrast, Ei changed only slightly in arid and semi-arid regions with scarce precipitation and relatively low LAI. Decreasing aerodynamic resistance due to the increasing LAI [2] also favored the evaporation of the intercepted precipitation on leaf surfaces. Therefore, vegetation greening can promote Ei, which was proved by observation in northern China [8]. Nevertheless, Ei/ET changed only slightly due to the small contribution of Ei to ET.
Zeng et al. [17] investigated the impact of vegetation dynamics on the water cycle with a coupled climate model and reported that enhanced plant transpiration induced by vegetation greening consumed more water and energy, which resulted in the decrease of Es, particularly in densely vegetated regions. In our study, Es did not decrease significantly over the past two decades across China, partly due to the increase of Es in arid and semi-arid regions (sparsely vegetated) offsetting the decrease of Es in humid and semi-humid regions (densely vegetated).
It has been reported that Es was greatly affected by both soil temperature and soil moisture [16]. Observations and modelling results showed a positive correlation between Es and soil temperature and soil moisture [42,43]. When soil moisture was high, Es was substantially close to free water surface evaporation and the evaporation rate was relatively stable. As the soil moisture decreased, the unsaturated infiltration coefficient decreased, and the water supplied to Es decreased accordingly. In areas of vegetation greening, increasing LAI was associated with increasing vegetation coverage and canopy closure, which can directly reduce the shortwave radiation incident to the soil surface and result in a cooling effect on the soil surface [8,27,28,36]. Changes of vegetation coverage and canopy closure can also alter the aerodynamic resistance between soil surface and atmosphere, which would affect the latent heat exchange [2,24,25]. Enhanced vegetation transpiration induced by vegetation greening can consume more soil moisture and inhibit soil evaporation [17,21], which explains the opposite trends of Ec and Es changes in most climate zones and ecosystem types (Figure 2, Figure 3 and Figure 4, [44]). Increased Ei with higher LAI also reduced the input of precipitation to soil [45,46] and resulted in the decrease of the soil moisture [7,17,37]. The above studies revealed the joint negative effect of decreasing soil surface temperature, reduction of soil moisture and aerodynamic resistance induced by vegetation greening on the Es, which is consistent with our finding of the general decreasing trend of Es across most climate zones and ecosystem types, particularly for humid and semi-humid regions in China. Meanwhile, the relative contributions of Ec and Ei to ET significantly increased, which resulted in the decrease of Es/ET in most regions.
When vegetation greening occurred in sparsely vegetated areas, the increased radiant energy cannot be sufficiently dissipated through vegetation transpiration with lower LAI, leading to larger increase in sensible heat flux than latent heat flux [22,39]. Consequently, the stronger warming effect induced by reduced surface albedo associated with vegetation greening than the cooling effect induced by the increasing ET resulted in a net warming of the soil surface [22,47], which enhances soil evaporation (Es). Thus, increasing Es in arid and semi-arid regions across China was probably due to the combined effect of lower LAI and certain degree of vegetation browning in these regions. Nevertheless, Es/ET universally decreased due to the higher increasing rate of Ec and Ei than that of Es.

4.3. Implication of the Vegetation Greening Modulating ET Components

If China’s vegetation greening continues, the enhanced ET would possibly lead to more water vapor input into the atmosphere but less water available to the soil and land surface, affecting the water cycle [2]. The feedback of vegetation greening to the atmospheric water cycle is an important aspect of regional climate. Modeling studies indicated that enhanced ET with increased LAI can accelerate the atmospheric moisture recycle and therefore affect regional precipitation [48], with the most evident changes occurring in Amazonia, Congo basin and Southeast Asia [17], followed by a 50% increase in precipitation due to enhanced ET and latent heat flux in northern high latitudes [49]. Global climate model simulations also indicated that China’s greening contributed to a significant increase of precipitation during 1982 to 2011 [28].
On the other hand, vegetation greening may lead to a decrease in surface runoff [32,50,51], reduction in soil moisture in temperate zones [52], or simultaneous decline of runoff and soil moisture in Loess Plateau in relation to large-scale ecological restoration [7,53,54,55]. Seasonal correlation between LAI and soil moisture also revealed detrimental effects of spring vegetation greening on summer soil drought [37]. Therefore, despite the moistening effect of enhanced ET on the atmosphere, large scale vegetation greening may increase the risk of water scarcity and exacerbate drought in regions where the enhanced water loss through ET cannot be compensated by precipitation and water resources [18,28,37,39,56].
Exceptions apply when global warming or the feedback effect of vegetation greening to the atmosphere creates more favorable conditions for water input (precipitation), which can compensate for the decreasing runoff and soil moisture due to the enhanced ET [37]. This was found to be particularly true in Amazonia, Congo basin and Southeast Asia, where the increase in precipitation was even larger than the increase in ET, resulting in increased soil water storage [17]. A similar result was also observed in humid regions of China where the vegetation greening increased water yields [55]. However, the significant increase in ET cannot be compensated by scarce precipitation as found in water limited regions over China [56] and in other dry regions such as Sahara and western Asia [17].
Furthermore, variation of precipitation due to ET change also affected vegetation dynamics [57]; such feedback between vegetation and precipitation not only occurred at local scale but may also operate globally through teleconnections [25,37]. Therefore, the feedback mechanisms in the response of soil moisture and atmosphere water cycle to vegetation greening must take into account the heat and vapor exchange in the whole soil-vegetation-atmosphere continuum for better quantifying the hydrological effect of vegetation change [37]. Finally, we note that the dynamics of ET and its components are also affected by changes in air temperature, precipitation, relative humidity and CO2 concentration associated with climate change and changes in vegetation composition, soil quality and nitrogen deposition associated with human activities, some of which are reflected in the observed vegetation greening in China. Further studies are needed to disentangle the coupled effects of vegetation dynamics and climate change or land use change that may have contributed to the increase of ET in China.

4.4. Uncertainty

The accuracy of the PML ET product was validated using the eddy flux data set at 9 flux net sites across China. The results showed a good agreement between the model estimation and measurements of the total ET. However, ET components was measured at a very limited number of sites in China, and the data was not widely accessible, which is also a common situation across the world. Thus, most of the ET component models were not validated with the measurements of the ET component, which could lead to substantial uncertainty in ET components’ dynamics and associated investigation. A recent study compared the Ei estimated by the PML model with field observation; the results showed that the PML model significantly underestimated Ei in evergreen broadleaf forests, especially for large events [58]. Therefore, it is necessary to calibrate the ET components of the PML ET product with more field observations of ET components to enhance the reliability of the results in future studies.

5. Conclusions

This work investigated the dynamics of ET components for different climate zones and moisture regions and dominant terrestrial ecosystems in the context of China’s greening over the past two decades and discussed how vegetation greening modulated the reallocation of ET components. ET was enhanced by 9% across China. Ec and Ec/ET increased by 36.5 mm and 4.4%, respectively, which contributed to more than 90% of the ET increment, suggesting the dominant role of vegetation transpiration in governing ET change in the context of vegetation greening. Ei increased by 9 mm, while Ei/ET only increased by 1.3%. Es decreased by 5.8 mm, resulted in a 5.7% decrease of Es/ET.
Changes of ET components and their proportions varied greatly across climate zones and moisture regions and ecosystem types in China. The increment of Ec occurred in all dominant ecosystems of agriculture, forestry and grassland and increased from north to south as temperature increased, with the most pronounced increase of Ec/ET in the temperate zone and in the agriculture ecosystem (10%). Ei significantly increased in tropical and sub-tropical zones and th humid region, particularly in the forestry ecosystem, while Ei/ET did not change significantly across regions and ecosystem types. Es increased in plateau climate region, arid and semi-arid regions, while it decreased across the agriculture, forestry and grassland ecosystems in the remaining climate zones and moisture regions. However, Es/ET universally decreased across China, most intensely in the temperate zone and in the agriculture ecosystem (−11.3%). Ec/ET of forestry and grassland ecosystems increased by 3.2% on average, while Es/ET decreased by 5.6% and 3.6%, respectively.
Comparisons with previous studies revealed that vegetation greening affected the heat and vapor exchange between the land surface and the atmosphere through altered biophysical factors (such as surface albedo, canopy roughness, canopy stomatal conductance), thereby modulating the reallocation of ET components. Further research on the hydrological and ecological effects of vegetation greening needs to fully consider the feedback effects among vegetation dynamics, soil moisture and the atmospheric water cycle for the whole soil-vegetation-atmosphere continuum.

Author Contributions

Conceptualization, J.C. and Y.F.; Data curation, Y.J. and Y.L.; Formal analysis, Y.J. and L.Y.; Funding acquisition, D.T.; Y.F. and J.C.; Methodology, J.C.; X.G. and Y.J.; Software, Y.J. and Y.L.; Supervision, Y.L. and D.T.; Visualization, L.Y. and X.G.; Writing—original draft, J.C. and X.G.; Writing—review and editing, J.C.; X.G. and Y.F. All authors have read and agreed to the published version of the manuscript.

Funding

This research was funded by the Central Guidance on Local Science and Technology Development Fund of Chongqing Municipacity (No.2021000069), Chongqing Science and Technology project (No.cstc2021jscx-gksbX0036), the National Natural Science Foundation of China (No. 41901130, 42005130 and 42061015), Chongqing Municipal Bureau of Water Resources (No. 5000002021BF40001), and Institute of Agricultural Resources and Environment, Tibet Academy of Agricultural and Animal Husbandry Science (No. 2020ZZKT-01).

Data Availability Statement

The PML ET dataset was obtained from Google Earth Engine. The data on climate zones and moisture regions and the dominant terrestrial ecosystems of China was obtained from the Chinese Academy of Sciences (https://www.resdc.cn (accessed on 3 May 2022)). The eddy covariance data of ET fluxes was obtained from FLUXNET2015 (http://fluxnet.fluxdata.org/data/fluxnet2015-dataset/ (accessed on 5 May 2022)).

Conflicts of Interest

The authors declare no conflict of interest.

References

  1. Zhu, Z.; Piao, S.; Myneni, R.; Huang, M.; Zeng, Z.; Canadell, J.; Ciais, P.; Sitch, S.; Friedlingstein, P.; Arneth, A.; et al. Greening of the Earth and its drivers. Nat. Clim. Chang. 2016, 6, 791–795. [Google Scholar] [CrossRef]
  2. Chen, C.; Li, D.; Li, Y.; Piao, S.; Wang, X.; Huang, M.; Gentine, P.; Nemani, R.; Myneni, R. Biophysical impacts of Earth greening largely controlled by aerodynamic resistance. Sci. Adv. 2020, 6, eabb1981. [Google Scholar] [CrossRef] [PubMed]
  3. Chen, C.; Park, T.; Wang, X.; Piao, S.; Xu, B.; Chaturvedi, R.; Fuchs, R.; Brovkin, V.; Ciais, P.; Fensholt, R.; et al. China and India lead in greening of the world through land-use management. Nat. Sustain. 2019, 2, 122–129. [Google Scholar] [CrossRef] [PubMed]
  4. Liu, Y.; Ju, W.; Chen, J.; Zhu, G.; Xing, B.; Zhu, J.; He, M. The spatiotemporal changes of China’s forest leaf area index from 2000 to 2010. Chin. Sci. Bull. 2012, 57, 1435–1445. [Google Scholar]
  5. Tong, X.; Brandt, M.; Yue, Y.; Horion, S.; Wang, K.; Keersmaecker, W.; Tian, F.; Schurgers, G.; Xiao, X.; Luo, Y.; et al. Increased vegetation growth and carbon stock in China karst via ecological engineering. Nat. Sustain. 2018, 1, 44–50. [Google Scholar] [CrossRef]
  6. Tang, X.; Xiao, J.; Ma, M.; Yang, H.; Li, X.; Ding, Z.; Yu, P.; Zhang, Y.; Wu, C.; Huang, J.; et al. Satellite evidence for China’s leading role in restoring vegetation productivity over global karst ecosystems. For. Ecol. Manag. 2022, 507, 120000. [Google Scholar] [CrossRef]
  7. Feng, X.; Fu, B.; Piao, S.; Wang, S.; Ciais, P.; Zeng, Z.; Lü, Y.; Zeng, Y.; Li, Y.; Jiang, X.; et al. Revegetation in China’s Loess Plateau is approaching sustainable water resource limits. Nat. Clim. Chang. 2016, 6, 1019–1022. [Google Scholar] [CrossRef]
  8. Yu, L.; Xue, Y.; Diallo, I. Vegetation greening in China and its effect on summer regional climate. Sci. Bull. 2021, 66, 13–17. [Google Scholar] [CrossRef]
  9. Liu, S.; Gong, P. Changes in greenness of surface vegetation in China from 2000 to 2010. Chin. Sci. Bull. 2012, 57, 1423–1434. [Google Scholar]
  10. Jin, K.; Wang, F.; Han, J.; Shi, S.; Din, W. Contribution of climate change and human activities to vegetation NDVI change over China during 1982–2015. Acta Geogr. Sin. 2020, 75, 961–974. [Google Scholar]
  11. Gao, Q.; Yu, M.; Xu, H. Directional climate trend, intensified intra-annual variability, and changes in land cover drive the dynamics of vegetation greenness in peri-urban China during 2001–2015. J. Geophys. Res. Biogeosciences 2020, 125, e2019JG005336. [Google Scholar]
  12. Liu, H. It is difficult for China’s greening through large-scale afforestation to cross the Hu line. Sci. China Earth Sci. 2019, 49, 1831–1832. [Google Scholar] [CrossRef]
  13. Piao, S.; Yin, G.; Tan, J.; Cheng, L.; Huang, M.; Li, Y.; Liu, R.; Mao, J.; Myneni, R.; Peng, S.; et al. Detection and attribution of vegetation greening trend in China over the last 30 years. Glob. Change Biol. 2015, 21, 1601–1609. [Google Scholar] [CrossRef] [PubMed]
  14. Zhang, M.; Liu, N.; Harper, R.; Li, Q.; Liu, K.; Wei, X.; Ning, D.; Hou, Y.; Liu, S. A global review on hydrological responses to forest change across multiple spatial scales: Importance of scale, climate, forest type and hydrological regime. J. Hydrol. 2017, 546, 44–59. [Google Scholar] [CrossRef]
  15. Zhang, K.; Kimball, J.; Nemani, R.; Running, S.; Hong, Y.; Gourley, J.; Yu, Z. Vegetation greening and climate change promote multidecadal rises of global land evapotranspiration. Sci. Rep. 2015, 5, 15956. [Google Scholar] [CrossRef] [Green Version]
  16. Wang, M.; Ding, Z.; WU, C.; Song, L.; Ma, M.; Yu, P.; Lu, B.; Tang, X. Divergent responses of ecosystem water-use efficiency to extreme seasonal droughts in Southwest China. Sci. Total Environ. 2021, 760, 143427. [Google Scholar] [CrossRef]
  17. Zeng, Z.; Piao, S.; Li, L.; Wang, T.; Ciais, P.; Lian, X.; Yang, Y.; Mao, J.; Shi, X.; Myneni, R. Impact of Earth greening on the terrestrial water cycle. J. Clim. 2018, 31, 2633–2650. [Google Scholar] [CrossRef]
  18. Bai, P.; Liu, X.; Zhang, Y.; Liu, C. Assessing the impacts of vegetation greenness change on evapotranspiration and water yield in China. Water Resour. Res. 2020, 56, e2019WR027019. [Google Scholar] [CrossRef]
  19. Yang, L.; Feng, Q.; Adamowski, J.; Alizadeh, M.; Yin, Z.; Wen, X.; Zhu, M. The role of climate change and vegetation greening on the variation of terrestrial evapotranspiration in northwest China’s Qilian Mountains. Sci. Total Environ. 2021, 759, 143532. [Google Scholar] [CrossRef]
  20. Jin, Z.; Liang, W.; Yang, Y.; Zhang, W.; Yan, J.; Chen, X.; Li, S.; Mo, X. Separating vegetation greening and climate change controls on evapotranspiration trend over the Loess Plateau. Sci. Rep. 2017, 7, 1–15. [Google Scholar] [CrossRef]
  21. Bai, P.; Liu, X.; Zhang, Y.; Liu, C. Incorporating vegetation dynamics noticeably improved performance of hydrological model under vegetation greening. Sci. Total Environ. 2018, 643, 610–622. [Google Scholar] [CrossRef] [PubMed]
  22. Yuan, X.; Hamdi, R.; Ochege, F.; Kurban, A.; De Maeyer, P. The sensitivity of global surface air temperature to vegetation greenness. Int. J. Climatol. 2021, 41, 483–496. [Google Scholar] [CrossRef]
  23. Zhang, Y.; Kong, D.; Zhang, Z.; Tian, J.; Li, C. The impact of vegetation changes on global land evapotranspiration from 2003 to 2017. Acta Geogr. Sin. 2021, 76, 584–594. [Google Scholar]
  24. Zeng, Z.; Piao, S.; Li, L.; Zhou, L.; Ciais, P.; Wang, T.; Li, Y.; Lian, X.; Wood, E.; Friedlingstein, P.; et al. Climate mitigation from vegetation biophysical feedbacks during the past three decades. Nat. Clim. Chang. 2017, 7, 432–436. [Google Scholar]
  25. Li, Y.; Piao, S.; Chen, A.; Ciais, P.; Li, L. Local and teleconnected temperature effects of afforestation and vegetation greening in China. Natl. Sci. Rev. 2020, 7, 897–912. [Google Scholar]
  26. Yan, L.; Chen, J.; He, L.; Ji, Y.; Tang, Q.; Fan, Y.; Tan, D. Dynamics of the Evaporation of Intercepted Precipitation during the Last Two Decades over China. Remote Sens. 2022, 14, 2474. [Google Scholar] [CrossRef]
  27. Peng, S.; Piao, S.; Zeng, Z.; Ciais, P.; Zhou, L.; Li, L.; Myneni, R.; Yin, Y.; Zeng, H. Afforestation in China cools local land surface temperature. Proc. Natl. Acad. Sci. USA 2014, 111, 2915–2919. [Google Scholar] [CrossRef]
  28. Yu, L.; Liu, Y.; Liu, T.; Yan, F. Impact of recent vegetation greening on temperature and precipitation over China. Agric. For. Meteorol. 2020, 295, 108197. [Google Scholar] [CrossRef]
  29. Gan, R.; Zhang, Y.; Shi, H.; Yang, Y.; Eamus, D.; Cheng, L.; Chiew, F.; Yu, Q. Use of satellite leaf area index estimating evapotranspiration and gross assimilation for Australian ecosystems. Ecohydrology 2018, 11, e1974. [Google Scholar] [CrossRef]
  30. Zhang, Y.; Peña-Arancibia, J.; McVicar, T.; Chiew, F.; Vaze, J.; Liu, C.; Lu, X.; Zheng, H.; Wang, Y.; Liu, Y.; et al. Multi-decadal trends in global terrestrial evapotranspiration and its components. Sci. Rep. 2016, 6, 19124. [Google Scholar] [CrossRef] [Green Version]
  31. Leuning, R.; Zhang, Y.; Rajaud, A.; Cleugh, H.; Tu, K. A simple surface conductance model to estimate regional evaporation using MODIS leaf area index and the Penman-Monteith equation. Water Resour. Res. 2008, 44. [Google Scholar] [CrossRef]
  32. Wei, X.; Li, Q.; Zhang, M.; Giles-Hansen, K.; Liu, W.; Fan, H.; Wang, Y.; Zhou, G.; Piao, S.; Liu, S. Vegetation cover—Another dominant factor in determining global water resources in forested regions. Glob. Change Biol. 2018, 24, 786–795. [Google Scholar] [CrossRef] [PubMed]
  33. Xu, S.; Yu, Z.; Yang, C.; Ji, X.; Zhang, K. Trends in evapotranspiration and their responses to climate change and vegetation greening over the upper reaches of the Yellow River Basin. Agric. For. Meteorol. 2018, 263, 118–129. [Google Scholar] [CrossRef]
  34. Shen, M.; Piao, S.; Jeong, S.; Zhou, L.; Zeng, Z.; Ciais, P.; Chen, D.; Huang, M.; Jin, C.; Li, L.; et al. Evaporative cooling over the Tibetan Plateau induced by vegetation growth. Proc. Natl. Acad. Sci. USA 2015, 112, 9299–9304. [Google Scholar] [CrossRef] [PubMed] [Green Version]
  35. Feng, H.; Zou, B. A greening world enhances the surface-air temperature difference. Sci. Total Environ. 2019, 658, 385–394. [Google Scholar] [CrossRef]
  36. Forzieri, G.; Alkama, R.; Miralles, D.; Cescatti, A. Satellites reveal contrasting responses of regional climate to the widespread greening of Earth. Science 2017, 356, 1180–1184. [Google Scholar] [CrossRef] [PubMed] [Green Version]
  37. Lian, X.; Piao, S.; Li, L.; Li, Y.; Huntingford, C.; Ciais, P.; Cescatti, A.; Janssens, I.; Peñuelas, J.; Buermann, W.; et al. Summer soil drying exacerbated by earlier spring greening of northern vegetation. Sci. Adv. 2020, 6, eaax0255. [Google Scholar] [CrossRef] [PubMed]
  38. Niu, Z.; He, H.; Zhu, G.; Ren, X.; Zhang, L.; Zhang, K.; Yu, G.; Ge, R.; Li, P.; Zeng, N.; et al. An increasing trend in the ratio of transpiration to total terrestrial evapotranspiration in china from 1982 to 2015 caused by greening and warming. Agric. For. Meteorol. 2019, 279, 107701. [Google Scholar] [CrossRef]
  39. Zhang, D.; Liu, X.; Bai, P. Different influences of vegetation greening on regional water-energy balance under different climatic conditions. Forests 2018, 9, 412. [Google Scholar] [CrossRef] [Green Version]
  40. Li, Q.; Lee, Y.; Im, S. Characterizing the Interception Capacity of Floor Litter with Rainfall Simulation Experiments. Water 2020, 12, 3145. [Google Scholar] [CrossRef]
  41. Grunicke, S.; Queck, R.; Bernhofer, C. Long-term investigation of forest canopy rainfall interception for a spruce stand. Agric. For. Meteorol. 2020, 292, 108125. [Google Scholar] [CrossRef]
  42. Purdy, A.; Fisher, J.; Goulden, M.; Colliander, A.; Halverson, G.; Tu, K.; Famiglietti, J. SMAP soil moisture improves global evapotranspiration. Remote Sens. Environ. 2018, 219, 1–14. [Google Scholar] [CrossRef]
  43. Li, M.; Wu, P.; Ma, Z. A comprehensive evaluation of soil moisture and soil temperature from third-generation atmospheric and land reanalysis data sets. Int. J. Climatol. 2020, 40, 5744–5766. [Google Scholar] [CrossRef]
  44. Zeng, N.; Zhao, F.; Collatz, G.; Kalnay, E.; Salawitch, R.; West, T.; Guanter, L. Agricultural Green Revolution as a driver of increasing atmospheric CO2 seasonal amplitude. Nature 2014, 515, 394–397. [Google Scholar] [CrossRef] [PubMed]
  45. Holder, C.; Gibbes, C. Influence of leaf and canopy characteristics on rainfall interception and urban hydrology. Hydrol. Sci. J. 2017, 62, 182–190. [Google Scholar] [CrossRef]
  46. Zheng, J.; Fan, J.; Zhang, F.; Yan, S.; Xiang, Y. Rainfall partitioning into throughfall, stemflow and interception loss by maize canopy on the semi-arid Loess Plateau of China. Agric. Water Manag. 2018, 195, 25–36. [Google Scholar] [CrossRef]
  47. Zhang, W.; Miller, P.; Jansson, C.; Samuelsson, P.; Mao, J.; Smith, B. Self-amplifying feedbacks accelerate greening and warming of the Arctic. Geophys. Res. Lett. 2018, 45, 7102–7111. [Google Scholar] [CrossRef]
  48. Spracklen, D.; Arnold, S.; Taylor, C. Observations of increased tropical rainfall preceded by air passage over forests. Nature 2012, 489, 282–285. [Google Scholar] [CrossRef]
  49. Bintanja, R.; Selten, F. Future increases in Arctic precipitation linked to local evaporation and sea-ice retreat. Nature 2014, 509, 479–482. [Google Scholar] [CrossRef]
  50. Li, D.; Pan, M.; Cong, Z.; Zhang, L.; Wood, E. Vegetation control on water and energy balance within the Budyko framework. Water Resour. Res. 2013, 49, 969–976. [Google Scholar] [CrossRef]
  51. Zhang, S.; Yang, H.; Yang, D.; Jayawardena, A. Quantifying the effect of vegetation change on the regional water balance within the Budyko framework. Geophys. Res. Lett. 2016, 43, 1140–1148. [Google Scholar] [CrossRef]
  52. Brown, A.; Zhang, L.; McMahon, T.; Westernc, A.; Vertessy, R. A review of paired catchment studies for determining changes in water yield resulting from alterations in vegetation. J. Hydrol. 2005, 310, 28–61. [Google Scholar] [CrossRef]
  53. He, X.; Zhan, B.; Hao, M.; Tang, K.; Zheng, F. Down-scale analysis for water scarcity in response to soil–water conservation on Loess Plateau of China. Agric. Ecosyst. Environ. 2003, 94, 355–361. [Google Scholar]
  54. Liu, Y.; Xiao, J.; Ju, W.; Xu, K.; Zhou, Y.; Zhao, Y. Recent trends in vegetation greenness in China significantly altered annual evapotranspiration and water yield. Environ. Res. Lett. 2016, 11, 094010. [Google Scholar] [CrossRef]
  55. Xie, X.; He, B.; Guo, L.; Miao, C.; Zhang, Y. Detecting hotspots of interactions between vegetation greenness and terrestrial water storage using satellite observations. Remote Sens. Environ. 2019, 231, 111259. [Google Scholar] [CrossRef]
  56. Ge, J.; Pitman, A.; Guo, W.; Zan, B.; Fu, C. Impact of revegetation of the Loess Plateau of China on the regional growing season water balance. Hydrol. Earth Syst. Sci. 2020, 24, 515–533. [Google Scholar] [CrossRef] [Green Version]
  57. Berg, A.; Findell, K.; Lintner, B.; Giannini, A.; Seneviratne, S.; Van Den Hurk, B.; Lorenz, R.; Pitman, A.; Hagemann, S.; Meier, A.; et al. Land–atmosphere feedbacks amplify aridity increase over land under global warming. Nat. Clim. Chang. 2016, 6, 869–874. [Google Scholar] [CrossRef]
  58. Zhong, F.; Jiang, S.; van Dijk, A.; Ren, L.; Schellekens, J.; Miralles, D. Revisiting large-scale interception patterns constrained by a synthesis of global experimental data. Hydrol. Earth Syst. Sci. Discuss. 2022, 26, 1–27. [Google Scholar] [CrossRef]
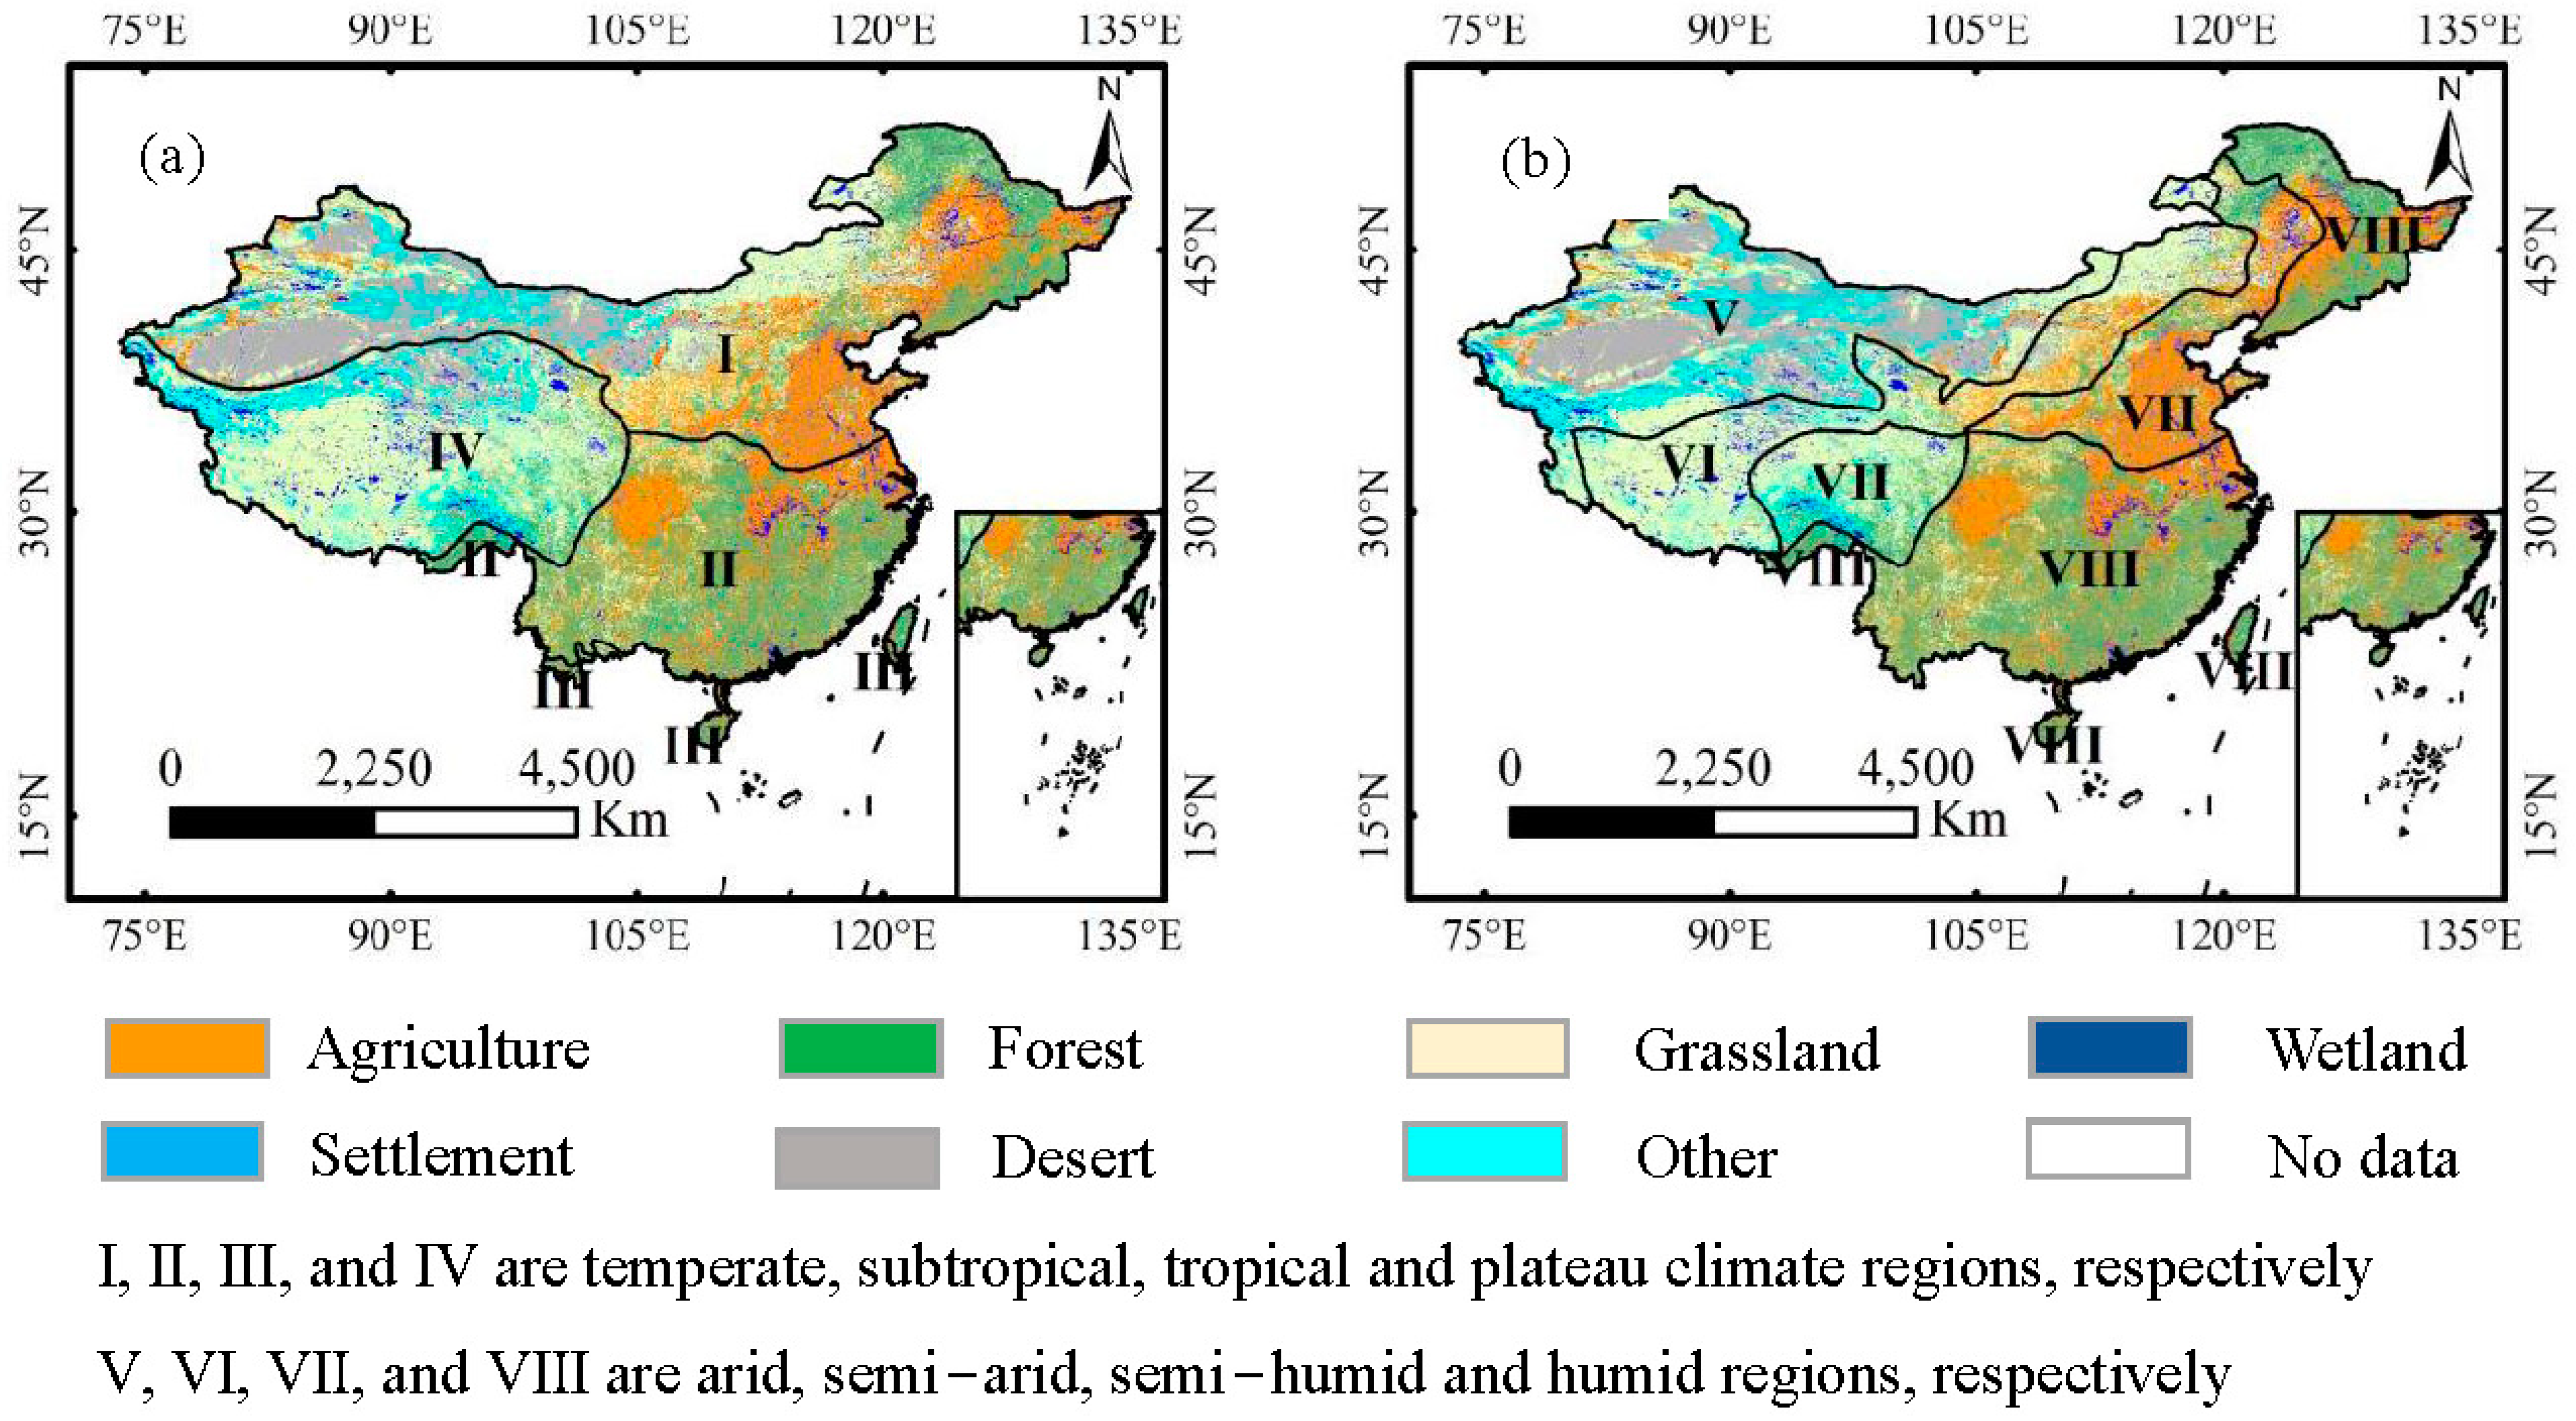
Figure 1. The climate zones (a) and moisture regions (b) of China.
Remotesensing 14 06327 g001
Figure 2. The scatter plots of the estimated ET by PML model vs. the eddy flux data in China.
Remotesensing 14 06327 g002
Figure 3. The interannual variation of ET components across China during 2001–2020. (a),(b),(c) and (d) are ET, Ec, Es and Ei, respectively.
Remotesensing 14 06327 g003
Figure 4. The annual mean ET components for different climate zones and moisture regions.
Remotesensing 14 06327 g004
Figure 5. The changes of ET components for different climate zones and moisture regions during 2001–2020.
Remotesensing 14 06327 g005
Figure 6. The changes of ET components for agriculture ecosystems.
Remotesensing 14 06327 g006
Figure 7. The changes of ET components for forestry ecosystems.
Remotesensing 14 06327 g007
Figure 8. The changes of ET components for grassland ecosystems.
Remotesensing 14 06327 g008
Publisher’s Note: MDPI stays neutral with regard to jurisdictional claims in published maps and institutional affiliations.