Article

Mapping Soil Erosion Dynamics (1990–2020) in the Pearl River Basin

1
School of Geography and Remote Sensing, Guangzhou University, Guangzhou 510006, China
2
Department of Land, Environment, Agriculture and Forestry, University of Padova, Agripolis, Viale dell’Università 16, 35020 Legnaro, Italy
3
Rural Non-Point Source Pollution Comprehensive Management Technology Center of Guangdong Province, Guangzhou University, Guangzhou 510006, China
*
Author to whom correspondence should be addressed.
Remote Sens. 2022, 14(23), 5949; https://doi.org/10.3390/rs14235949
Submission received: 28 October 2022 / Revised: 21 November 2022 / Accepted: 23 November 2022 / Published: 24 November 2022
(This article belongs to the Special Issue Climate Change Impact on Water and Soil Using Remote Sensing)

Abstract

:
Healthy soil is the key foundation of the world’s agriculture and an essential resource to ensure the world’s food security. Soil erosion is one of the serious forms of soil degradation and a major threat to sustainable terrestrial ecosystems. In this study, we utilized a continuous Landsat satellite image dataset to map soil erosion changes (1990–2020) based on the RUSLE model across the Pearl River Basin. The study results indicated that: (1) The multi-year area-specific soil erosion average in the Pearl River Basin is approximately 538.95 t/(km2·a) with an annual soil loss of approximately 353 million tons; (2) The overall soil erosion displayed a decreasing trend over the past 30 years with an annual decreasing rate of −13.44(±1.53) t/(km2·a); (3) Soil erosion, dominated by low- and moderate-level erosion, primarily occurred in the tributary basin of Xijiang River, especially in the areas with slopes > 15°, low vegetation coverage, or poorly managed forests; (4) the NDVI and land cover were the dominant factors regulating soil erosion dynamics versus the insignificant role of precipitation played in the erosion procedure. The study results are valuable for soil erosion management and water conservation in the Pearl River Basin.

1. Introduction

Healthy soil is the key foundation of the world’s agriculture and an essential resource to ensure food security in the 21st century [1]. It is also a crucial part of ecosystems that uphold the delivery of primary terrestrial ecosystem services. For a very long time, soil erosion caused by winds and water has been the main threat to the soil. In the Anthropocene, this threat was intensified by agricultural-dominated human activities [2]. The latest official report of the United Nations about the status of the world’s soil resources emphasized most of the global soil resources are in merely fair, poor, or very poor condition [3]. Soil erosion is one of the serious forms of soil degradation; therefore, it is also a major threat to sustainable land ecosystems [4], leading to a series of inevitable consequences such as reduced soil productivity [5], deteriorated water quality [6,7], low food yield [8,9], lost reservoir capacity [10,11,12], and even flood hazards [13], which are impairing the health of terrestrial ecosystems and the safety of human life and property [14]. Therefore, controlling soil erosion has been one of the most important tasks of ecosystem management [15].
Soil erosion includes four categories: wind erosion, hydraulic erosion, gravity erosion, and freeze–thaw erosion. The agents of soil erosion are quite similar to the agents of all kinds of erosion: water, ice, gravity, or wind, among which water is globally the major agent. It is estimated that, at a global scale, water erosion accounts for about 50% of the total soil erosion [16].
The assessments of water erosion were initialized by the studies of Bennett et al. [17] in the 1930s and 1940s. With a further understanding of soil erosion processes, a series of models were proposed for soil erosion predictions, including the physical models of ANSWERS (Areal Nonpoint Source Watershed Environment Response Simulation) [18], WEPP (Watershed Erosion Prediction Project) [19], GUEST (Griffith University Erosion System Template) [20], EUROSEM (European Soil Erosion Model) [21] and the empirical models of USLE (Universal Soil Loss Equation) [22], RUSLE (Revised Universal Soil Loss Equation) [23], CSLE (Chinese Soil Loss Equation) [24]. The physical models often require more parameters and are more complex, which hinder the models’ large-scale applications [25,26]. However, empirical models, which are relatively simple and require fewer parameters, are a great alternative for large-scale soil erosion assessments [5,27,28]. Among them, the empirical models of USLE and RUSLE proposed by the United States Department of Agriculture (USDA) have been widely used at global and regional scales [29,30,31]. The models require five major factors to estimate soil loss for a specific site, namely the rainfall factor (R), soil erodibility factor (K), slope length-steepness factor (LS), crop/vegetation and management factor (C), and the support practice factor (P). Each factor is the numerical measurement of a specific condition that regulates the severity of soil erosion at a specific location.
Previous studies have revealed that anthropogenic activities and related land cover change are the major causes of accelerated soil erosion. Asia probably likely experienced more anthropogenic-activity-induced soil erosion than any other continent. The greatest increases in mapped soil erosion are predicted to occur in Southeast Asia, Sub-Saharan Africa, and South America [25]. China’s Pearl River basin, as the representative of anthropogenic-activities-affected basins [32], is a typical watershed to demonstrate soil erosion dynamics in Asia. The Pearl River Basin, located in the subtropical region along the Northern Tropic of Cancer, is characterized by high precipitation, thin topsoil layer, rugged terrain, and resultant serious soil erosion in the upper reaches [33]. Its severity in soil erosion has been reported by studies since the 1990s [28,33,34,35]. However, most of these studies are small-scale case investigations about soil erosion on slopes; the soil erosion across the entire Pearl River Basin has not been well-studied. Despite some predictions of soil erosion in some tributaries [36,37,38], these studies merely derived the soil erosion changes based on several data sets of yearly results. These data are not enough to obtain a continuous trend due to the discontinuity in the data series. The obtained trends based on these data are not reliable if the size of the yearly products is too small. Few studies mapped continuous soil erosion dynamics across the entire Pearl River Basin. In the context of increasing both rainfall intensity and rainfall uncertainty and the increasingly intensified human activities in recent decades [39], it necessitates understanding the status and dynamics of soil erosion to support sustainable basin development and environmental protection in the Pearl River Basin.
In this study, we employed a continuous Landsat satellite image dataset to map soil erosion changes (1990–2020) based on the RUSLE model across the Pearl River Basin. Based on the results, we also analyzed the spatiotemporal dynamics in soil erosion in the Pearl River Basin from 1990 to 2020. We derived the causes of the changes to provide a reliable result for soil erosion management and water and soil conservation in the Pearl River Basin. In addition, the subtropical climate in the Pearl River Basin can result in high cloud coverage in optical satellite images. The elimination of cloud influence for accurately mapping soil erosion dynamics in the Pearl River Basin is another aim of this study.

2. Materials and Methods

2.1. Study Area

The Pearl River is a large river system in southern China [40]. The Pearl River Basin (PRB) is also used as a catch-all for the tributary basins of the Xijiang River (XRB), Dongjiang River (DRB), and Beijiang River (BRB). The three tributaries share a common delta, the Pearl River Delta [41] (Figure 1). In China, to facilitate river management, the government also combined the ambient small coastal rivers and the rivers on Hainan Island into the Pearl River Basin, named the Grand Pearl River Basin (GPRB). Therefore, the Grand Pearl River Basin includes the original PRB, the Hanjiang River basin (HRB), the small coastal rivers in southern Guizhou and western Guangdong (CRSG&WG), and the rivers on Hainan Island (HI) (Figure 1). It covers eight provinces (Yunnan, Guizhou, Guangxi, Guangdong, Hunan, Jiangxi, Hainan, and Fujian), and two special administrative regions (Hong Kong and Macau) with a total area of 655,000 km2. The GPRB is a varied land-of forest, mountains, hills, plateaus, and small plains. Approximately 94.4% of the study areas are mountains and hills with slopes > 15°; the plains are mostly located in the Leizhou Peninsula, the Pearl River Delta, and the coastal area on Hainan Island.
The GPRB is characterized by a subtropical and tropical climate in South Asia, with an annual average temperature of 14 to 22 °C [42], an annual average precipitation of 1200 to 2000 mm, and an annual average surface runoff of 338.1 billion m3. The precipitation decreases from east to west of the basin. Most precipitation happens in the monsoon season from April to September, accounting for approximately 70% to 85% of the total precipitation.
The natural soils in the PRB primarily consist of limestone soil, red soil, latosol soil, and yellow soil distributed in uncultivated mountains, hills, and wastelands following a law of vertical climate-related zonality. Cultivated soils are dominated by dryland soil and rice soil. Subtropical evergreen broad-leaved forests and tropical rain forests are the major vegetation in the GPRB, and rice, wheat, and sweet potato prevail among major crops.
The GPRB is one of the regions in China that experienced rapid development. Since the 1980s, the GPRB has experienced rapid but uneven economic development: the upper reaches (Yunnan, Guizhou, and Guangxi provinces) are in the remote part of China, with wild environments and slow economic development; while the lower reaches (Pearl River Delta) close to Hong Kong and Macau, are the earliest regions benefited from China’s “open door and reform” policy and thus are one of the economic powerhouses in China.

2.2. Dataset

Six datasets were required to evaluate soil erosion in the GPRB based on the RUSLE model (Table 1). The SRTM 30 m digital elevation data was obtained from the USGS (https://earthexplorer.usgs.gov, accessed on 22 November 2022). The National Tibetan Plateau Data Center provided the 1 km monthly precipitation dataset (TPDC, https://data.tpdc.ac.cn, accessed on 22 November 2022). It was reanalyzed from the global 0.5° climate dataset of CRU and the global high-resolution climate dataset of WorldClim using a Delta spatial downscaling scheme. The dataset was evaluated using the observations collected from 496 meteorological stations across China; the dataset is more reliable than other datasets [43]. The soil texture dataset was acquired from the Resource and Environment Science Data Center (RESDC, https://www.resdc.cn, accessed on 22 November 2022). The soil organic dataset [44] was obtained from TPDC, which was a combined result of the digitized soil type map (1:1,000,000) and soil profile data collected in China’s second soil survey. The land-cover dataset (CLCD) was provided by Yang et al. [45], and was generated from Landsat images using a random forest classifier on the GEE platform. The classification samples were collected by a visually interpreted dataset and validated by a third-party dataset. The accuracy of CLCD was assessed using 30 m thematic products such as impervious surface, surface water, and forest thematic products.

2.3. RUSLE Model

The RUSLE model was used to evaluate water and soil erosion in this study. The RUSLE is a revised empirical model based on the USLE model, which is easier to evaluate water soil erosion at large scales. Several studies have shown that the RUSLE model could apply in the GPRB [28,34,38]. The formula is as follows:
A = R × K × L × S × C × P
where A is the annual average soil loss (t·hm−2·a−1); R is the rainfall erosivity factor (MJ·mm·hm−2·h−1·a−1); K is the soil erodibility factor (t·h·MJ−1·mm−1); L is the slope length factor (dimensionless); S is the slope factor (dimensionless); C is the cover-management factor (dimensionless, 0 < C < 1); P is the conservation practices factor (dimensionless, 0 < P < 1).

2.3.1. Rainfall Erosivity ( R ) Factor

The R factor is an indicator describing soil erosion through rainfall and runoff, which is influenced by the mixed effect of the amount and intensity of rainfall [47]. Zhang et al. [48] constructed a simplified rainfall erosivity assessment model to estimate R based on rainfall datasets at different temporal scales in China. The model was also used in the first national water conservancy census in 2013 with satisfactory results. In this study, we used Zhang’s monthly-data-based P i 2 P   model to compute R factor, which is expressed as:
R = 0.1833 F 1.9957    ( r 2 = 0.861 )
F = 1 n i = 1 n [ j = 1 12 P i , j 2 / j = 1 12 P i , j ]
where R is the average annual rainfall erosivity factor (MJ·mm·hm−2·h−1·a−1), F is the modified Fournier index (mm), n is the number of years of rainfall records, and P i , j is the jth monthly rainfall amount in the ith year (mm).

2.3.2. Soil Erodibility ( K ) Factor

The K factor is an evaluation of the susceptibility of soil particles to detachment and moved by rainfall as well as runoff. Many soil erodibility estimation approaches have been proposed, such as the soil erodibility nomogram [49], the erosion-productivity impact calculator (EPIC) model [50], and the soil mean particle estimation model [51]. Different models require different observation data. Among them, the EPIC model has been widely used because fewer inputs are required, and it yields better model-fitting outputs. The formula is expressed as follows:
K = { 0.2 + 0.3 e [ 0.0256 · s a n ( 1 s i l 100 ) ] } · { s i l ( c l a + s i l } } 0.3 · { 1.0 0.25 c ( c + exp ( 3.72 2.95 c ) } } · { 1.0 0.75 s n ( s n + exp ( 5.51 + 22.9 s n ) } }
where s a n , s i l , c l a and c represent the percentages of sand content (size 0.1–2 mm), silt content (size 0.002–0.1 mm), clay content (size < 0.002 mm), and soil organic carbon content, s n = 1 s a n / 100 .
Based on the field-measured data, Zhang et al. [52] found that the EPIC model needed to be calibrated by correcting the conversion formula to meet applications in China. The formula is as follows:
K = 0.01383 + 0.51575 K E P I C
where K is the final soil erodibility and the K E P I C value is estimated from the EPIC model.

2.3.3. Slope Length and Steepness ( L S ) Factor

Topography can influence the soil erosion processes by affecting the formation and development of soil and vegetation, which determines the state and movement of surface runoff. L and S represent the influence of topography on soil erosion in RSULE and are generally calculated by DEM data.
The formula for calculating S [53] is as follows:
S = { 10.8 sin θ + 0.03 θ < 5 ° 16.8 sin θ 0.05 5 ° θ < 14 ° 21.91 sin θ 0.96 θ 14 °
where θ (°) is the slope calculated from the DEM.
The formula for L [22,54,55] is as follows:
L = ( λ 22.13 ) α
α = β β + 1
β = sin θ 0.0896 3.0 ( sin θ ) 0.8 + 0.56
where λ is the slope length (m), α is a dimensionless proxy parameter, and β (°) is derived from the slope value (θ).

2.3.4. Cover-Management ( C ) Factor

The C factor, the cover-management factor, represents the effect of cropping and management practices on erosion rates. Due to the good correlation between the NDVI data and C factor data, we used the Landsat surface reflectance dataset to calculate NDVI on the GEE platform, and further derive the C factor. The fractional vegetation coverage (fvc in %) was obtained by mosaic-pixel developed by Gutman et al. [56]. The C factor was finally calculated based on fvc using Cai et al.’s method [57]. The formulae are as follows:
f v c = N D V I N s o i l N v e g N s o i l
C = 1 f v c 0.1 % 0.6508 0.3436 lg ( f v c ) 0.1 % < f v c 78.3 % 0 f v c > 78.3 %
where f v c (%) represents the fractional vegetation coverage,   N s o i l   is the NDVI value of the pixels with bare soil, and   N v e g is the NDVI value of the pixels completely covered with vegetation. Pixels with values below 5% or above 95% of the NDVI values were defined as abnormal values [58].

2.3.5. Conservation Practices (P) Factor

The P factor indicates the impact of support practices on the average annual erosion rate. When P = 0, no soil erosion occurs after soil conservation practices are applied; when P = 1, no soil conservation practices are applied. Because it is difficult to estimate quantitatively, the P factor was rarely considered in soil erosion evaluation on large scales [23]. Previous studies have assigned P values based on the land-cover data. According to Li et al.’s study [59], we reclassified the slope values into 0–10, 10–25, 25–40, and 40–90 degrees and assigned the P factor of the corresponding croplands to 0.5, 0.6, 0.8 and 1, respectively. The P factors for grassland, forest, and shrub were set to 1, and the impervious surface was set to 0. The conservation practices factor for 30 years was obtained by combining the data.
The estimated values of various factors were obtained through the aforementioned methods, and a 30 m resample operation was performed. The factors were multiplied to obtain the soil erosion of the GPRB from 1990 to 2020.

3. Results

3.1. Spatial Distribution Pattern of Subfactors

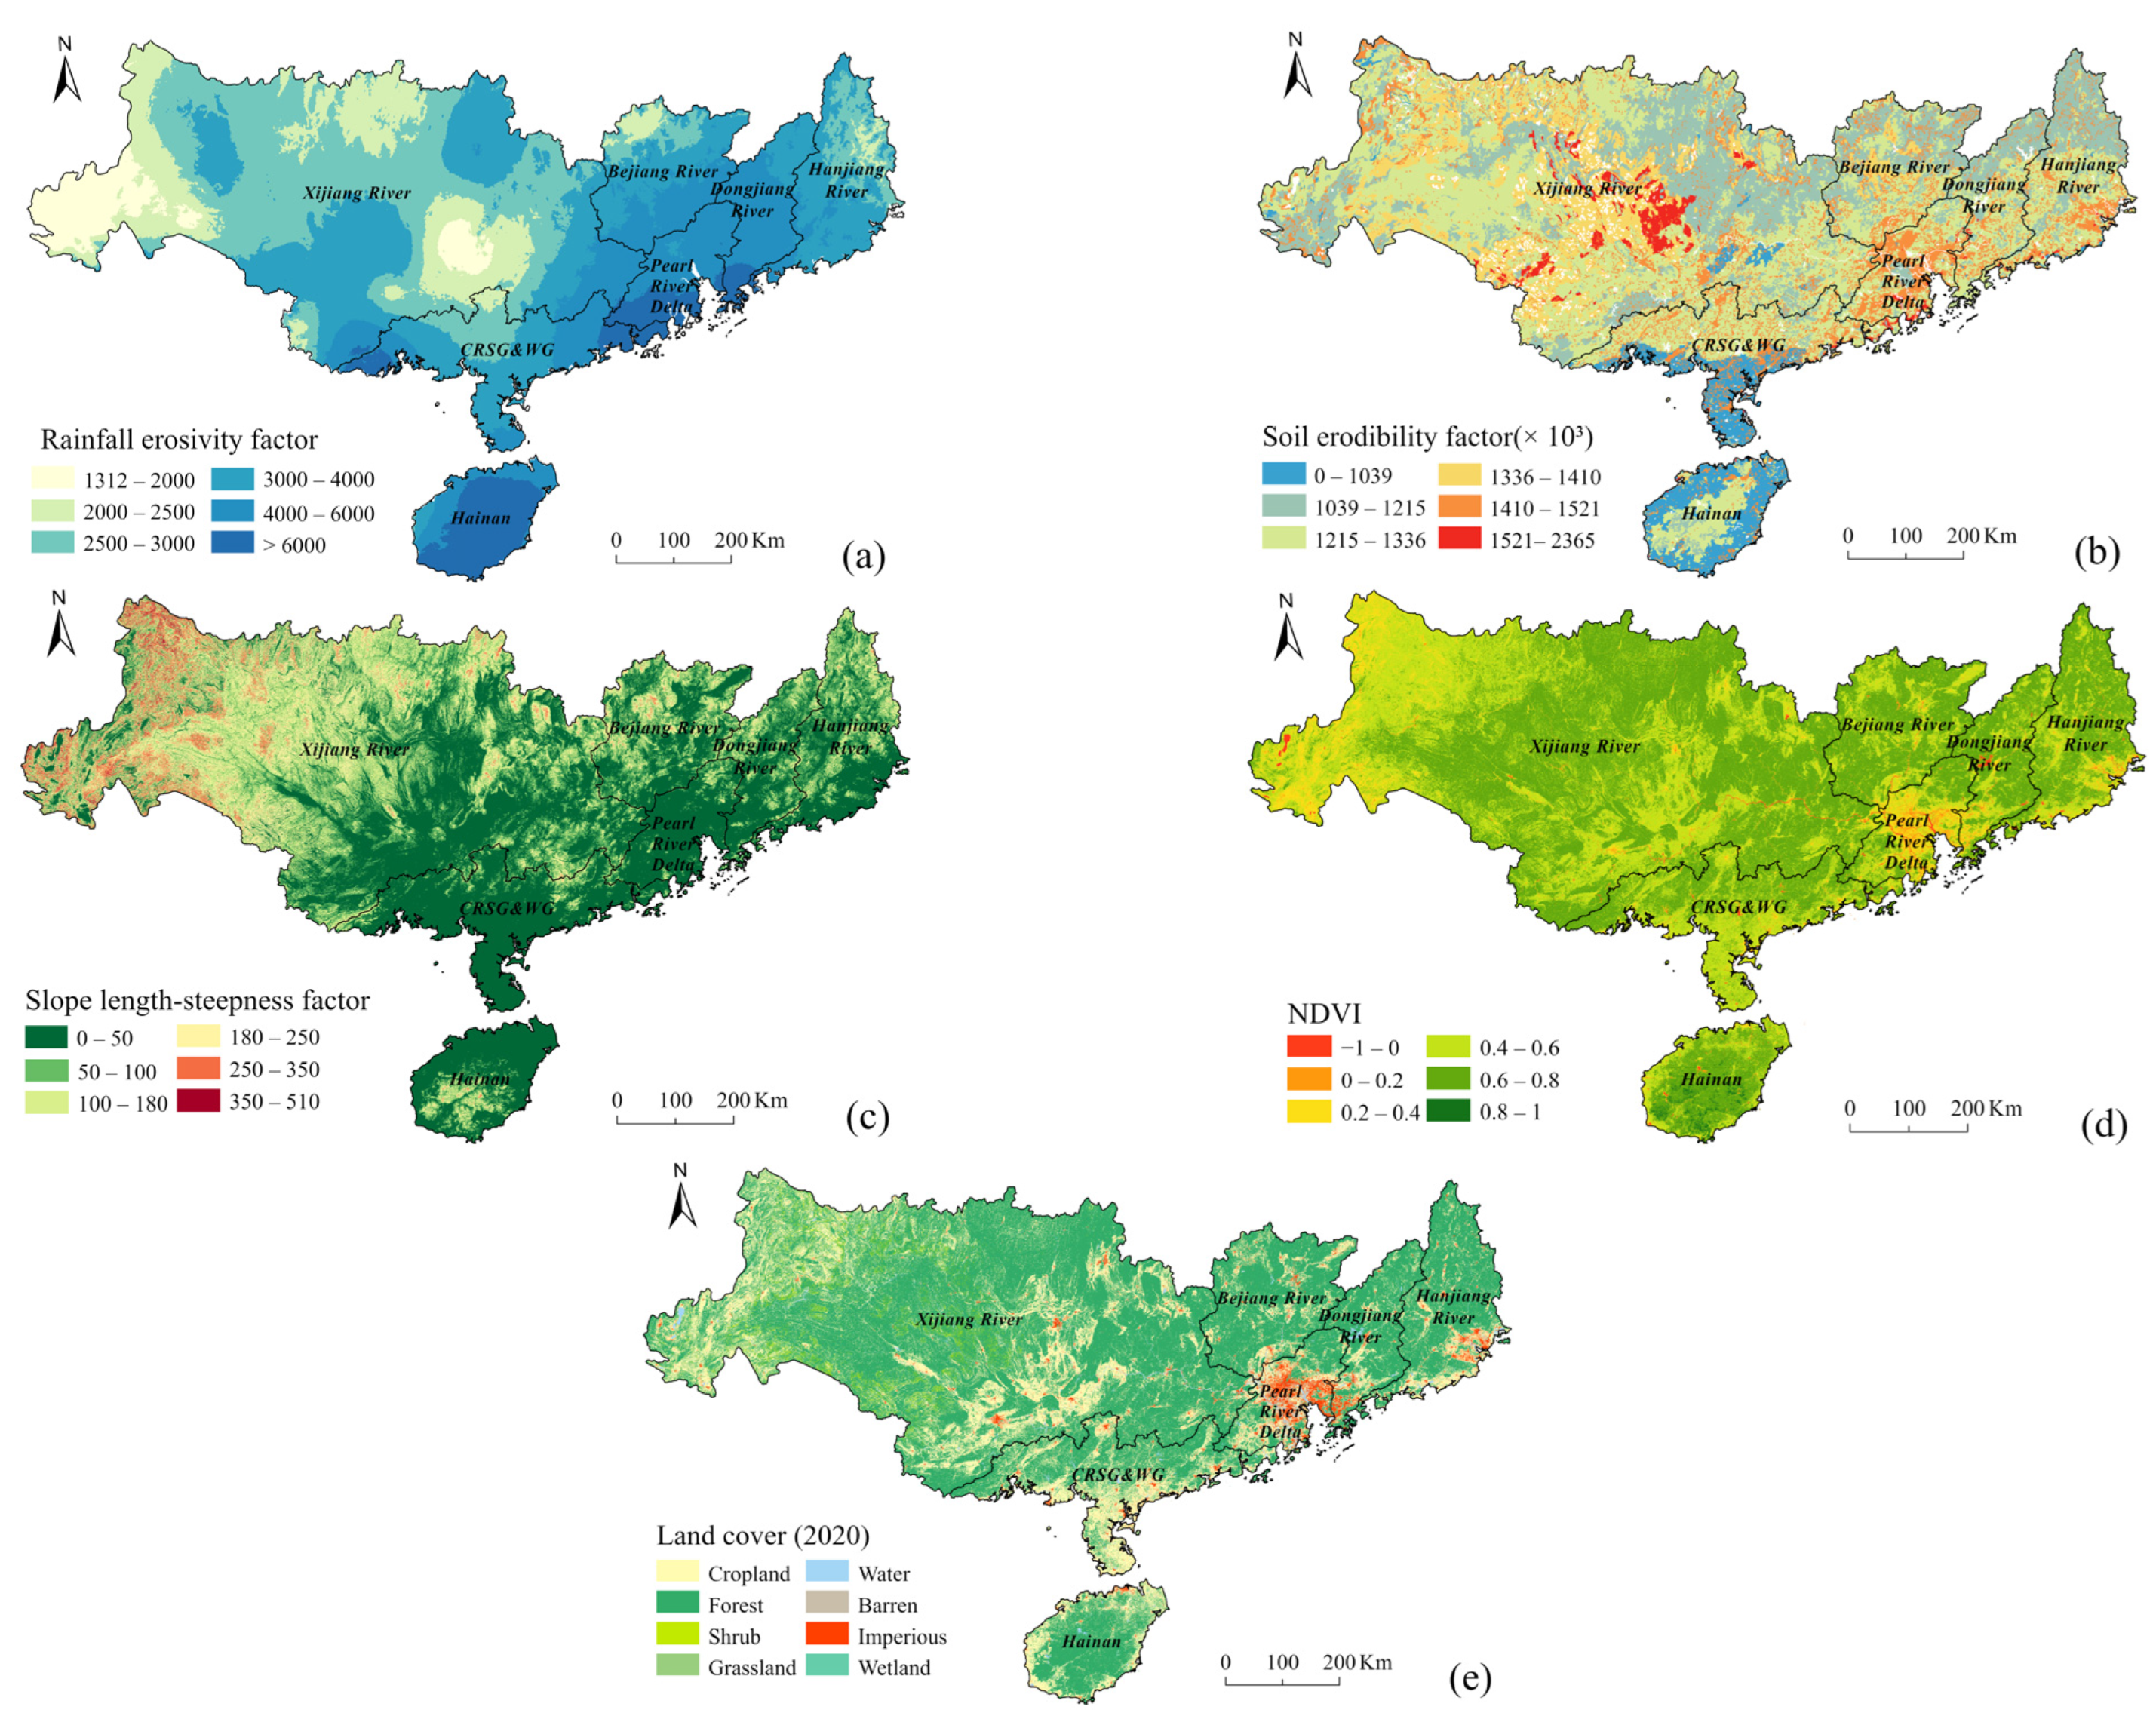
The value of the R factor decreases from southeast to northwest from 1312.48 to 12679.47 MJ·mm/(hm2·h·a) (Figure 2a), which is close to the values reported by Lai et al. (1858.0~14656.6 MJ·mm/(hm2·h·a)) [60] and Lai et al. (3156.75~18870.8 MJ·mm/(hm2·h·a)) [61]. The K factor ranges from 0 to 0.02365 t·hm2·h/(MJ·mm·hm2), with the highest value distributing in south CRSG&WG and most of Hainan Island, and the lowest value mainly distributing in the central part of XRB (Figure 2b). Increasing from southeast to northwest, the LS factor ranges from 0 to 510.93 (Figure 2c), with the highest value in the GPRB headwater region, where the topography is mainly Karst, with steep slopes and short slope lengths. The annual average NDVI in GPRB is 0.583 (Figure 2d), and the land cover in GPRB is dominated by forests (Figure 2d). High-NDVI regions are consistent with the distribution of forests, while low-NDVI regions are consistent with the distribution of impervious areas in the delta region and bare lands in the upper reaches.

3.2. Spatiotemporal Patterns of Soil Erosion in PRB

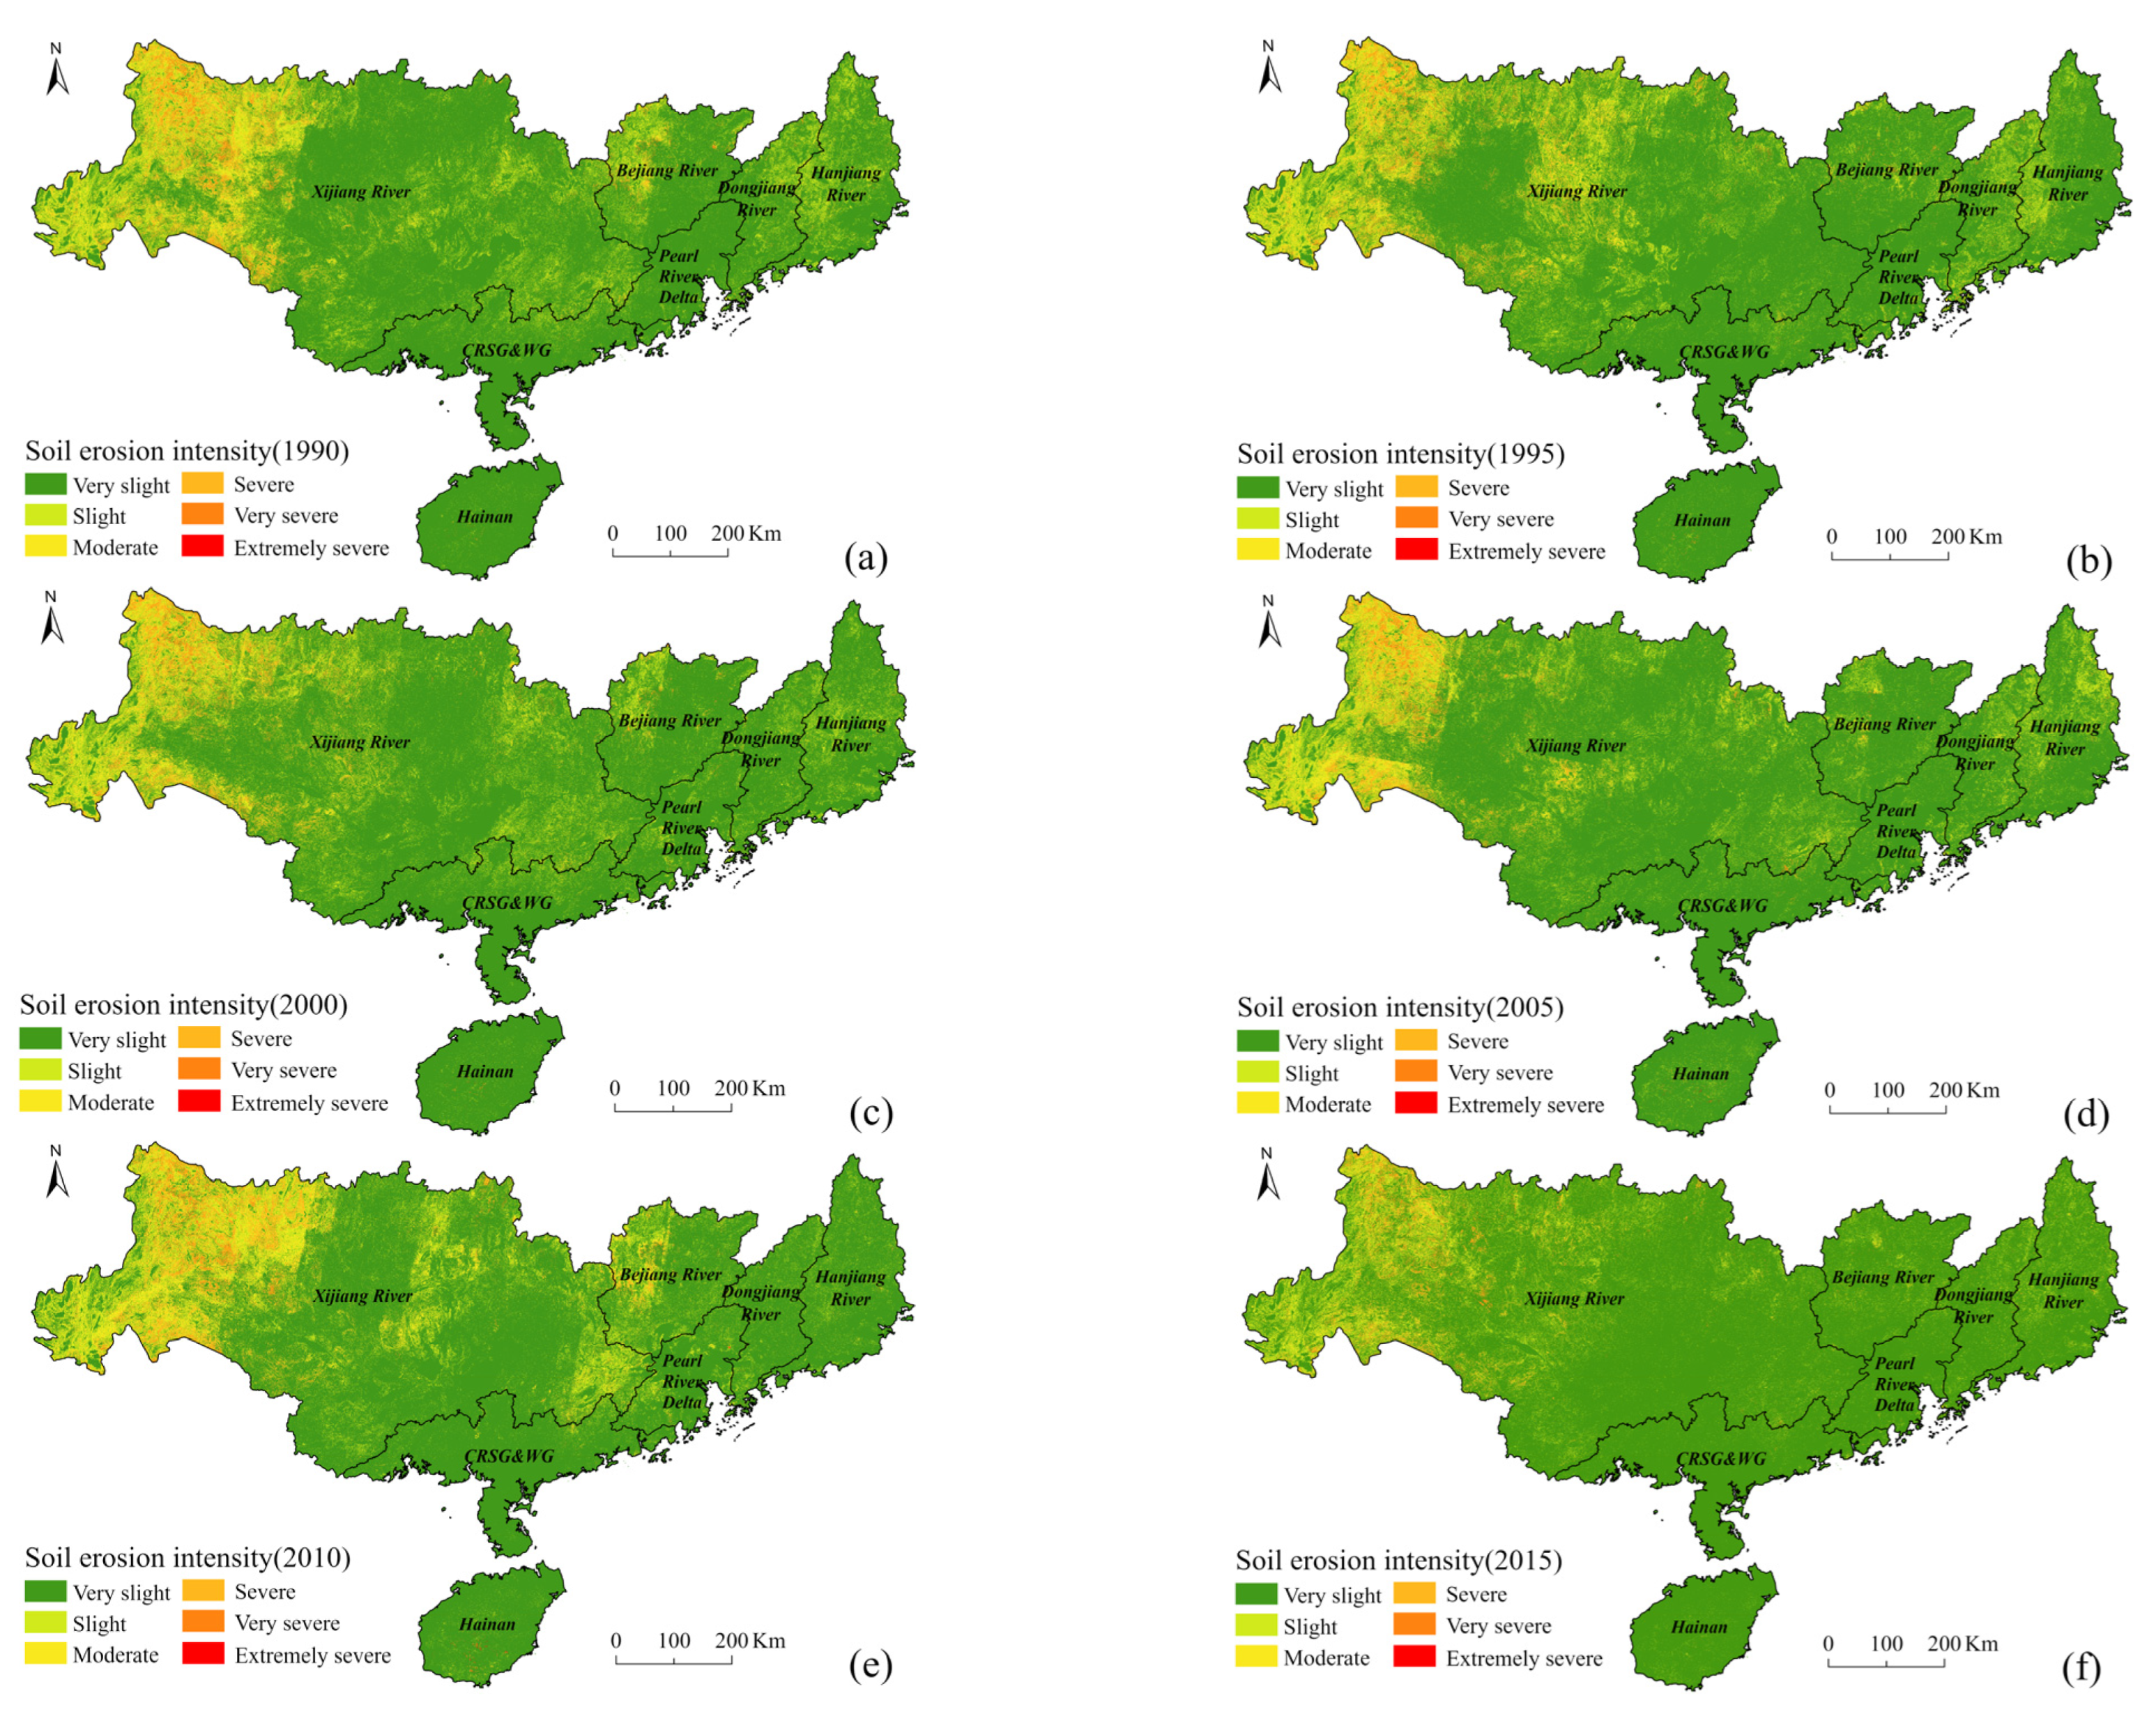
Benefiting from high vegetation coverage, the soil erosion intensity in GPRB was dominated by very slight levels (Figure 3). Slight- and moderate-level erosion occupied the second and third proportions of erosion areas, and areas with high-level erosion were relatively rare. Regarding land cover in the GPRB, slight erosion mainly occurred in croplands with slopes less than 15°, shrubs, and grasslands; moderate erosion mainly distributed in the croplands with slopes from 15° to 25°, grasslands, and sparse forests; severe erosion, very severe erosion and extremely severe erosion mainly occurred in the barre karst lands (with slopes > 25°) of the western part of XRB. On the sub-basin scale, slight erosion accounted for the largest proportion in XRB (67.78% in 1990), followed by HRB and DRB, and the least in HI (0.58% in 1990); moderate erosion accounted for the largest proportion in XRB (85.51% in 1990), followed by HRB and BRB, and the least in HI (0.13% in 1990).
From 1990 to 2020, significant mitigation of soil erosion occurred across GPRB. The proportion of very slight erosion increased from 78.2% in 1990 to 82.35% in 2005 and 89.02% in 2020. From 1990 to 2020, the proportion of slight erosion decreased from 7.50% to 4.26%. The proportion of moderate erosion decreased from 6.50% to 2.81%, and its area decreased by 56.83%. The proportion of very severe erosion decreased from 0.63% to 0.17%.

3.3. Temporal Fluctuation in Soil Erosion in the GPRB

From 1990 to 2020, soil erosion in the GPRB experienced a significant decline (R2 = 0.734) (Figure 4). The R2 could be adjusted to 0.827 after removing the result of 2010 (red point in Figure 4). From 1990 to 2020, the soil erosion rate declined from 666.48 t/(km2·a) to 290.1 t/(km2·a), with a relative reduction of 56.47% and a net annual decreasing rate of 13.44 (±1.53) t/(km2·a). The maximum, minimum and mean soil erosion rates were 797.76 t/(km2·a) in 1993, 272.6 t/(km2·a) in 2019, and 538.95 t/(km2·a), respectively. There were 13 years with soil erosion rates lower than the mean rate. After 2011, the soil erosion rates were all lower than the average.
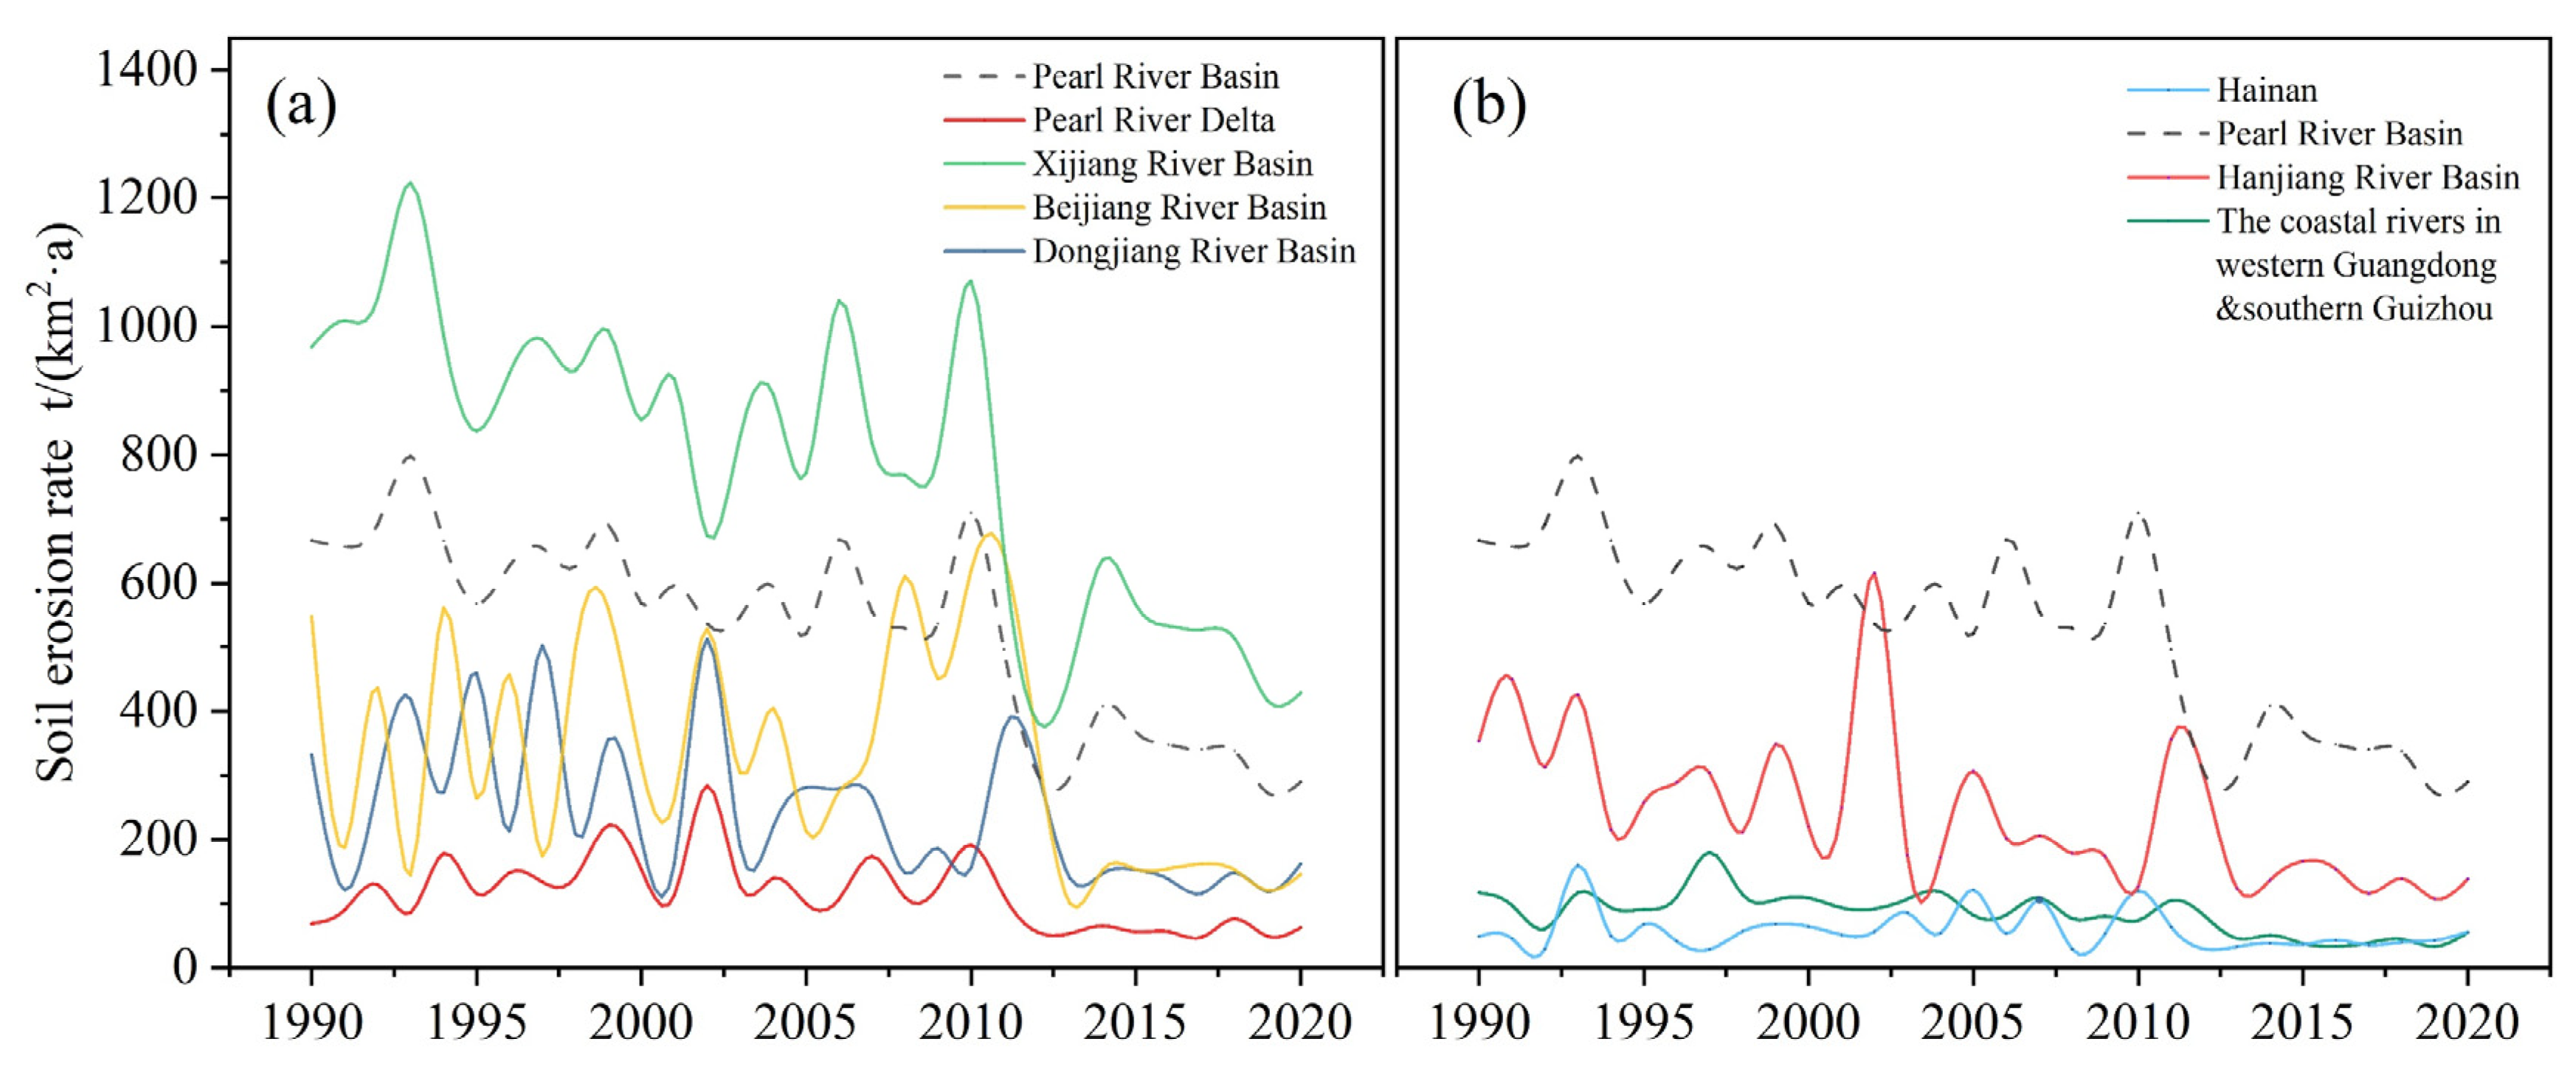
The XRB was the tributary basin with the highest soil erosion (Figure 5a). Over the past 30 years, soil erosion in the XRB significantly decreased with an annual rate of −17.96 t/(km2·a). The BRB and DRB were also the sub-basins with relatively high soil erosion, where the fluctuation directions of soil erosion rate were similar to the overall trend after 2011. HRB was another basin with relatively high soil erosion (Figure 5b). From 1990 to 2020, the soil erosion rate in HRB declined from 353.74 t/(km2·a) to 138.71 t/(km2·a), with a relative reduction of 60.79% and an annual decreasing rate of 8.3 (±1.84) t/(km2·a). Li et al. [63] reported that vegetation coverage in HRB increased from 2002 to 2009 due to China’s Returning Farmland to Forest Program, which effectively alleviated soil erosion in HRB. In this study, soil erosion rates in 2002 and 2009 were 615.24 t/(km2·a) and 173.48 t/(km2·a), respectively, which was consistent with the study of Li et al. [63].
The PRD, HI, and CRSG&WG were the sub-basins with relatively low soil erosion. In PRD, although the R factor was high with 5125.0 MJ·mm/(hm2·h·a), the soil erosion rates were all at a very slight level of lower than 200 t/(km2·a) due to its flat terrain and large impervious area. In HI and CRSG&WG, the R factor was also high, with 6377.3 MJ·mm/(hm2·h·a) and 4037.6 MJ·mm/(hm2·h·a), respectively; however, the soil erosion rates were at a very slight level of less than 120 t/(km2·a) due to its high vegetation cover and relatively flat terrain.

3.4. Analysis of Influencing Factors

3.4.1. Precipitation

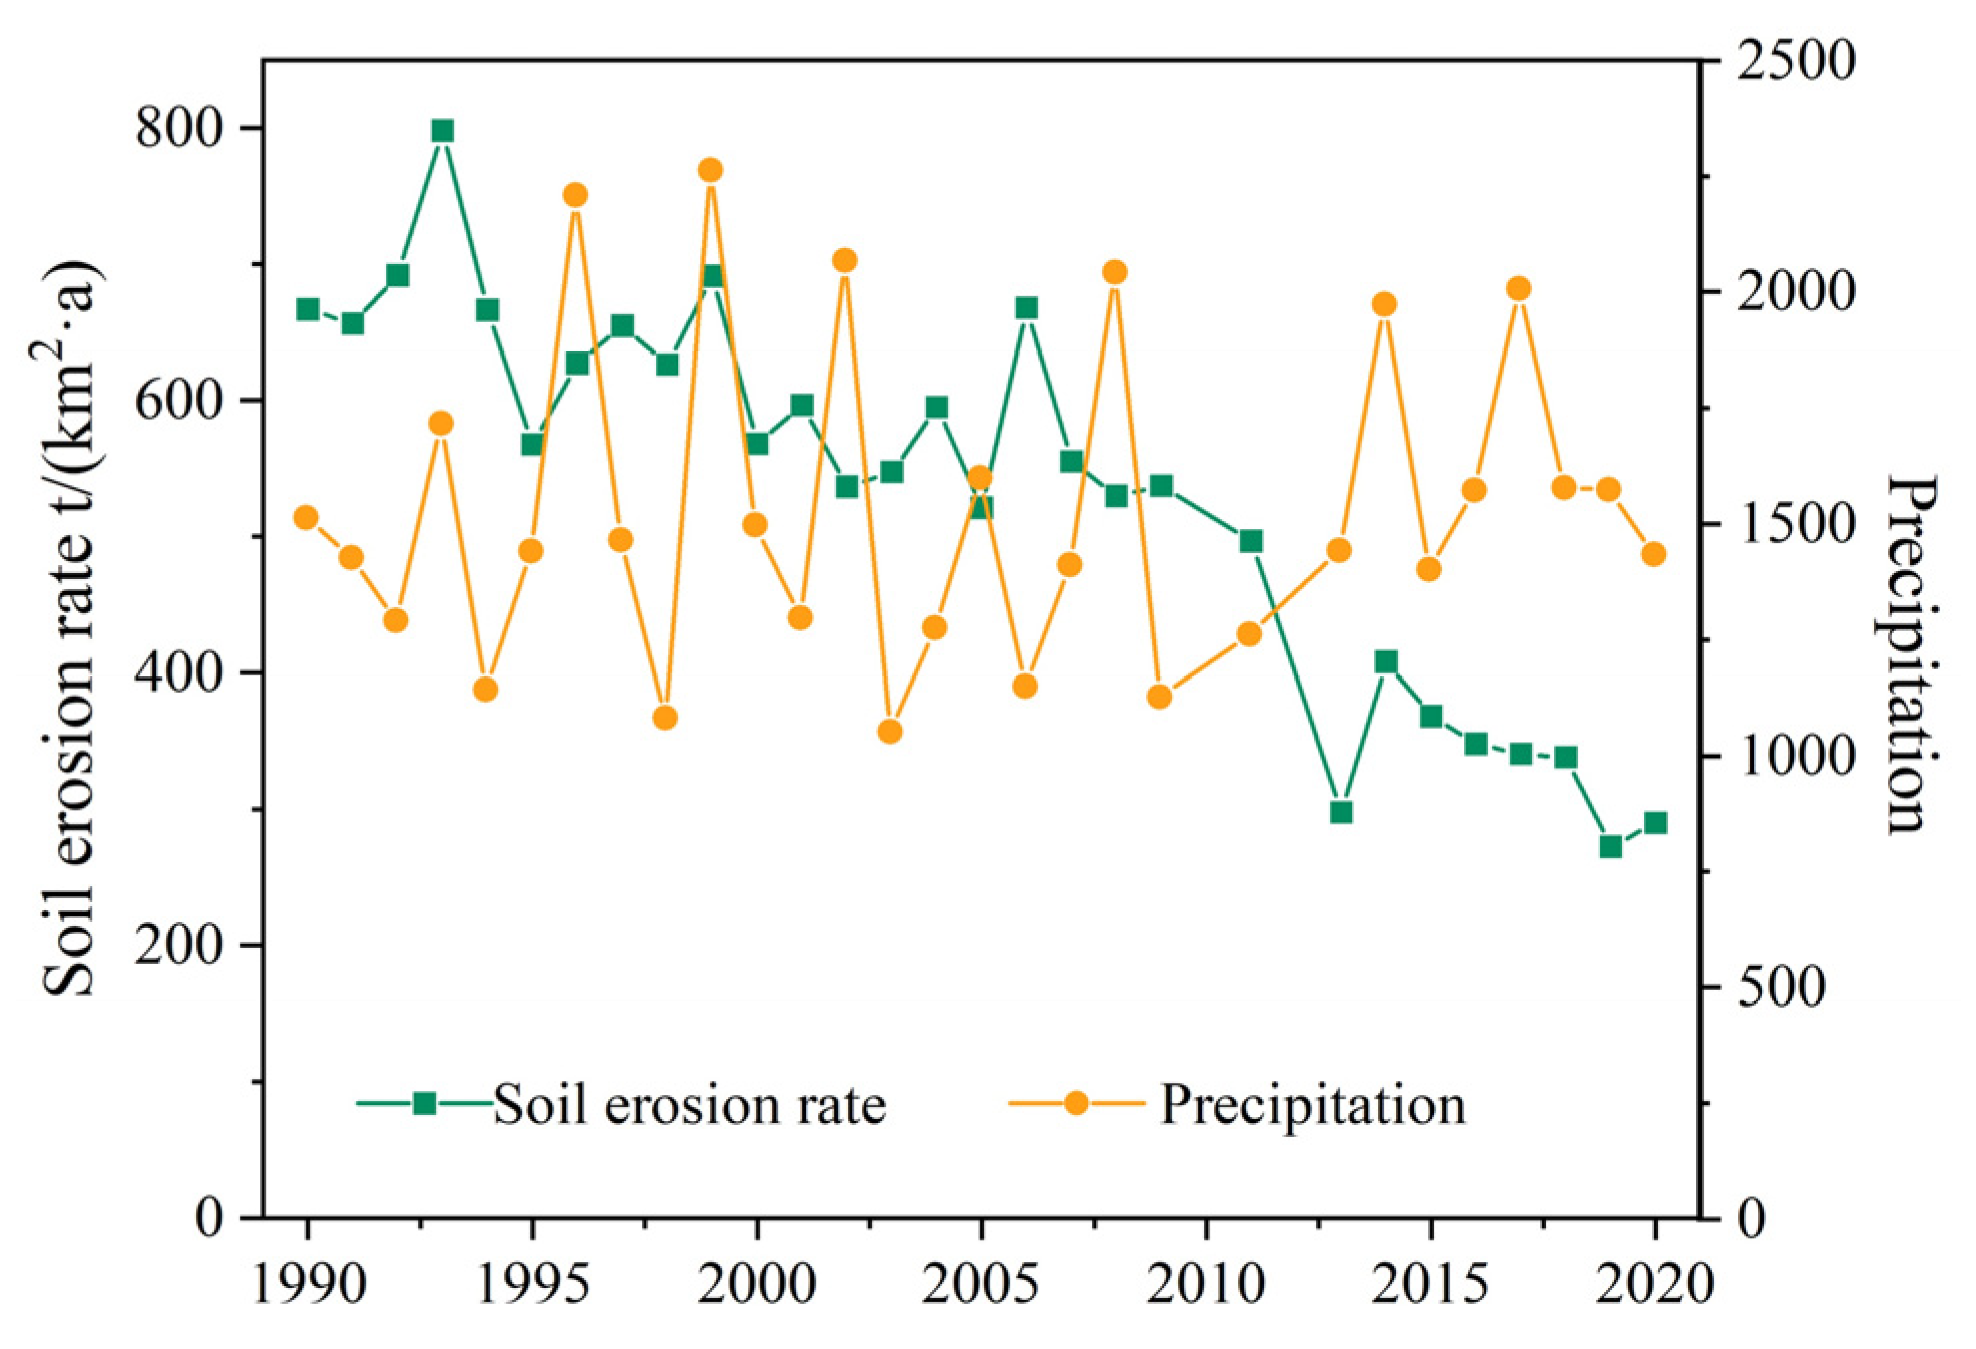
From 1990 to 2020, the annual average precipitation in GPRB was 1524.07 mm. The annual precipitation fluctuated under the impact of increasing extreme rainfall events (Figure 6) [61]. Annual precipitation and R factor had spatial heterogeneity, showing a decreasing trend from southeast to northwest. Although rainfall is an important factor for soil erosion, a previous study found that sometimes rainfall was not the significant trigger for soil erosion [1], especially in a basin like the GPRB with high forest cover that could reduce soil splash erosion bought by raindrops. The correlation coefficient between soil erosion rate and rainfall is extremely low(r ≈ 0.0), suggesting that rainfall does not play a dominant role in soil erosion in the GPRB, which was consistent with the study conclusion from Chen et al. [38].

3.4.2. NDVI

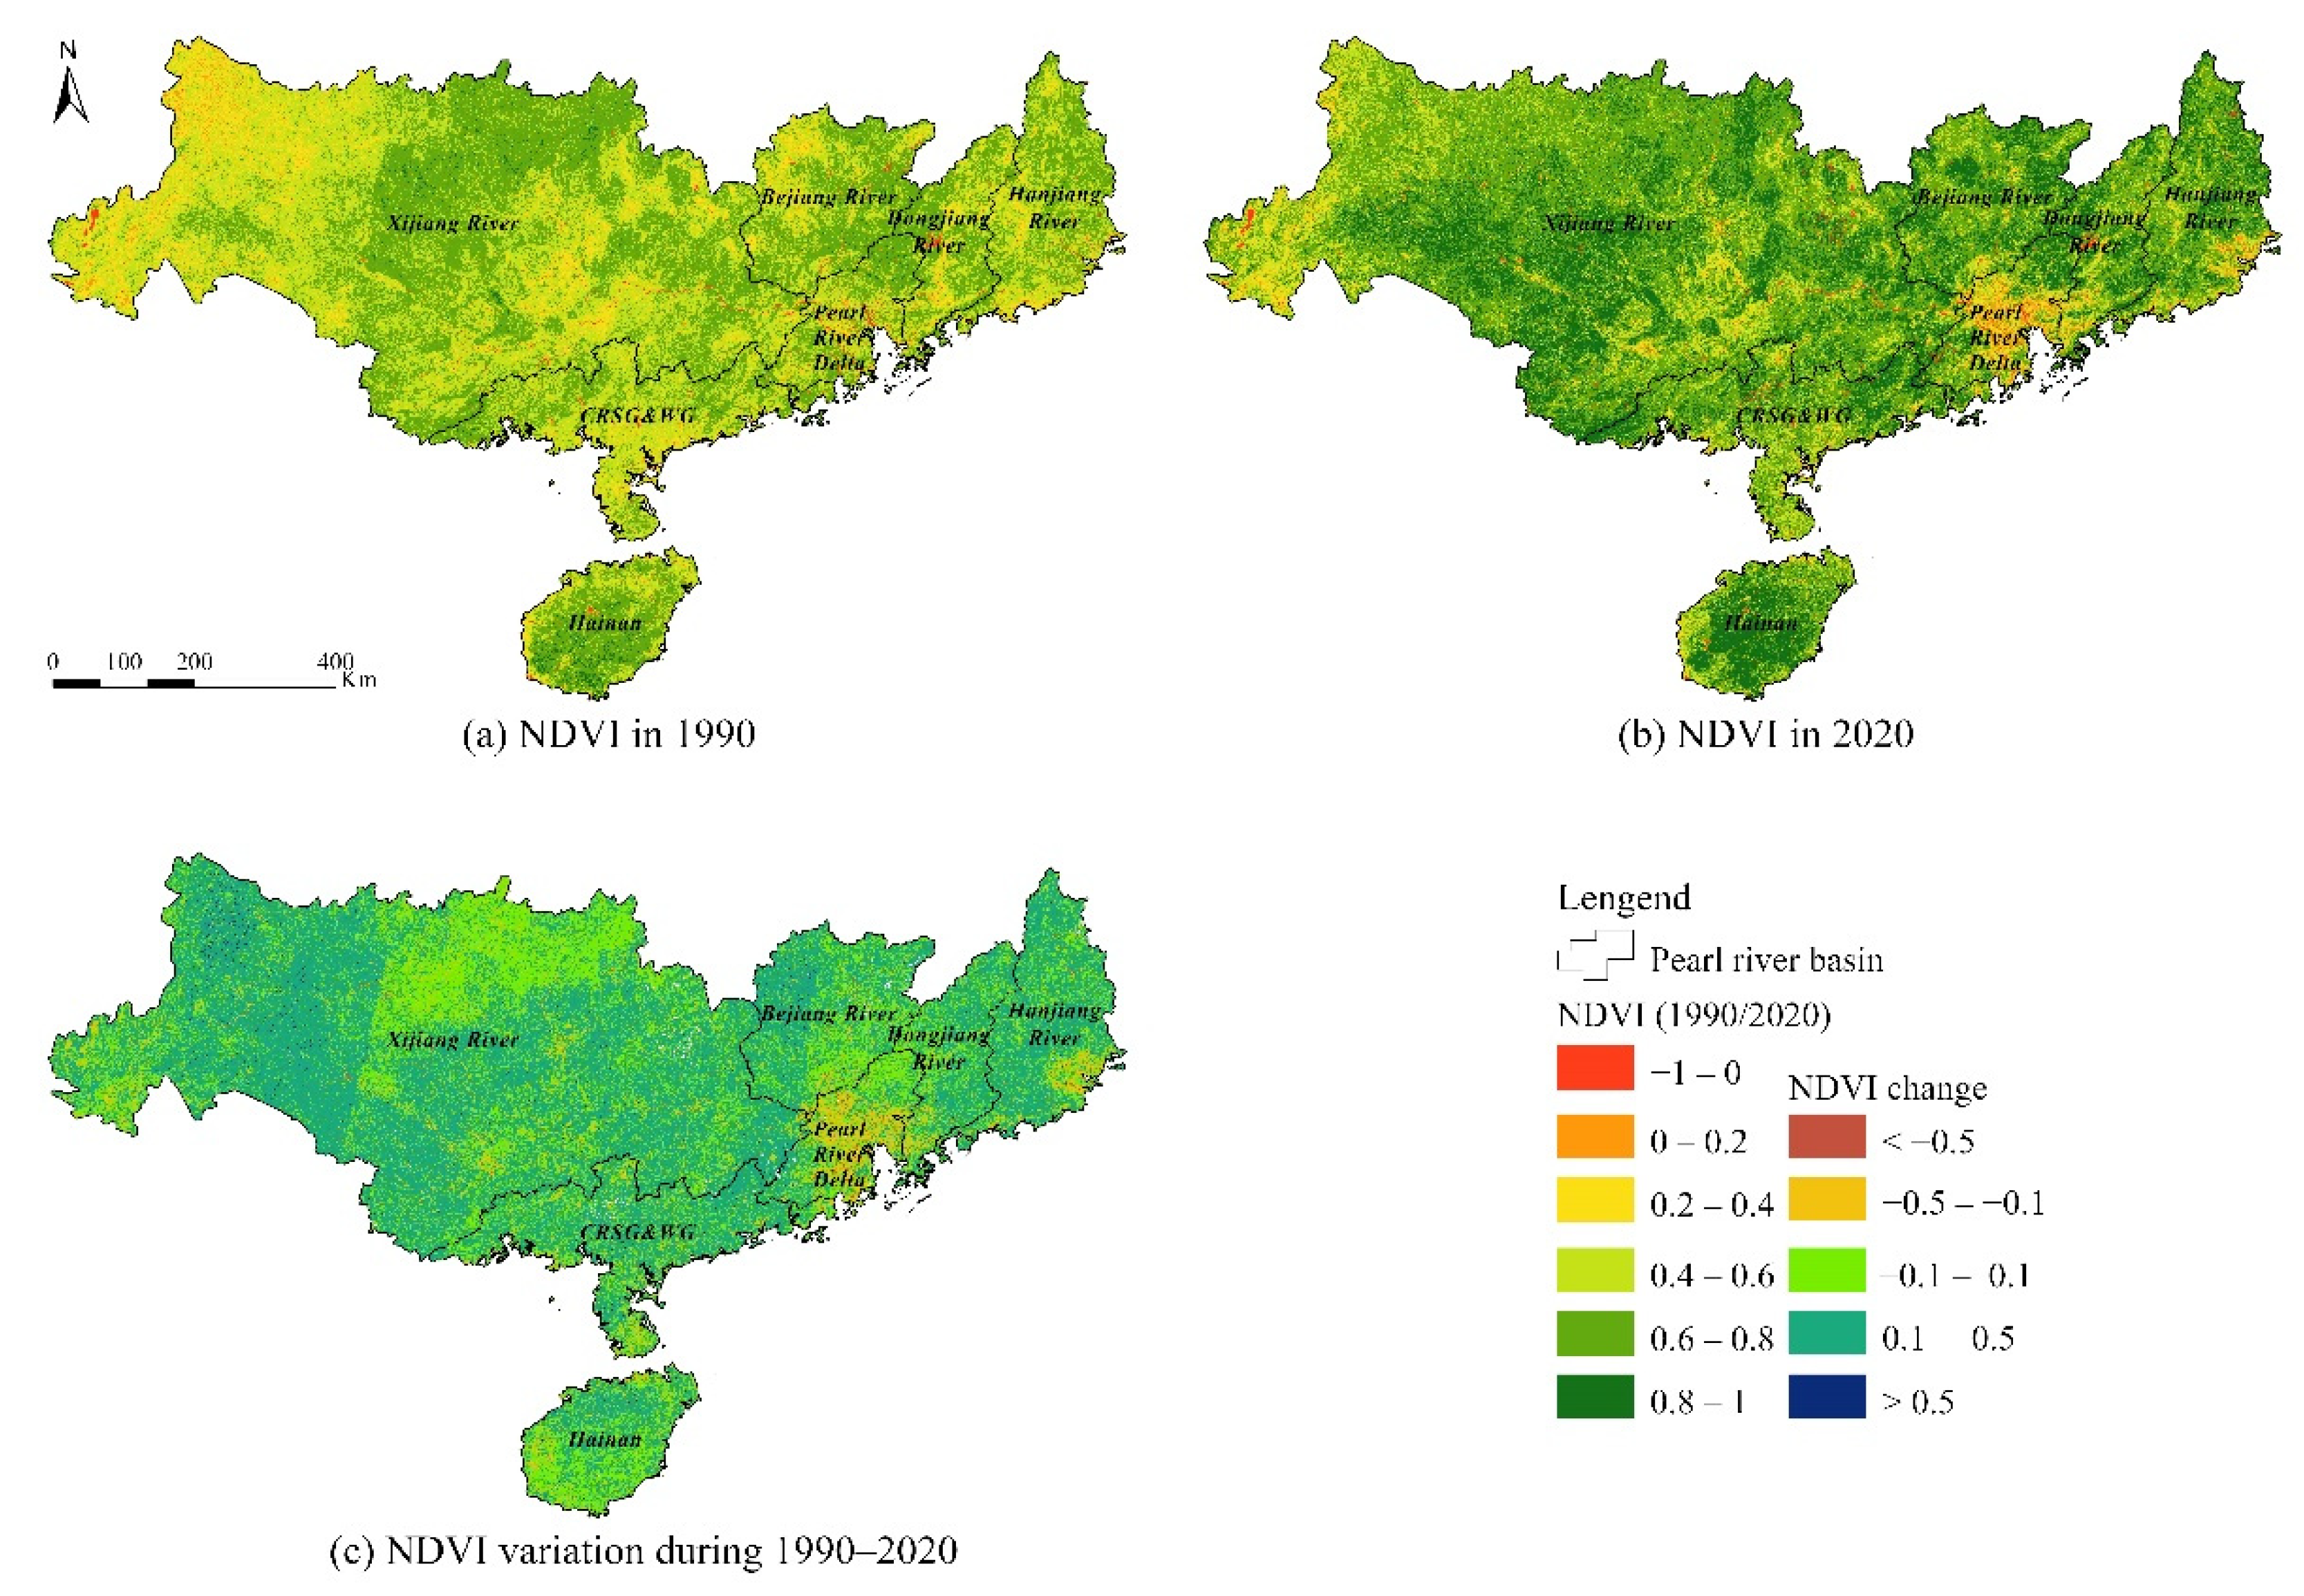
Based on our study results, NDVI has significantly increased from 0.549 in 1990 to 0.676 in 2020, with a relative increase of 23.14%. In 1990, in most areas of western XRB, the NDVI was between 0.2 and 0.4, while in 2020, it went up to between 0.6 to 0.8 (Figure 7). Even though the NDVI significantly increased in most sub-basins in the past 30 years, it was observed a dramatic reduction in the PRD and the lower reaches of HRB due to rapid urbanization. The correlation coefficient between the soil erosion rate and the NDVI was approximately −0.941 (Figure 8), implying that vegetation cover played a key role in soil erosion mitigation.

3.4.3. Land Cover

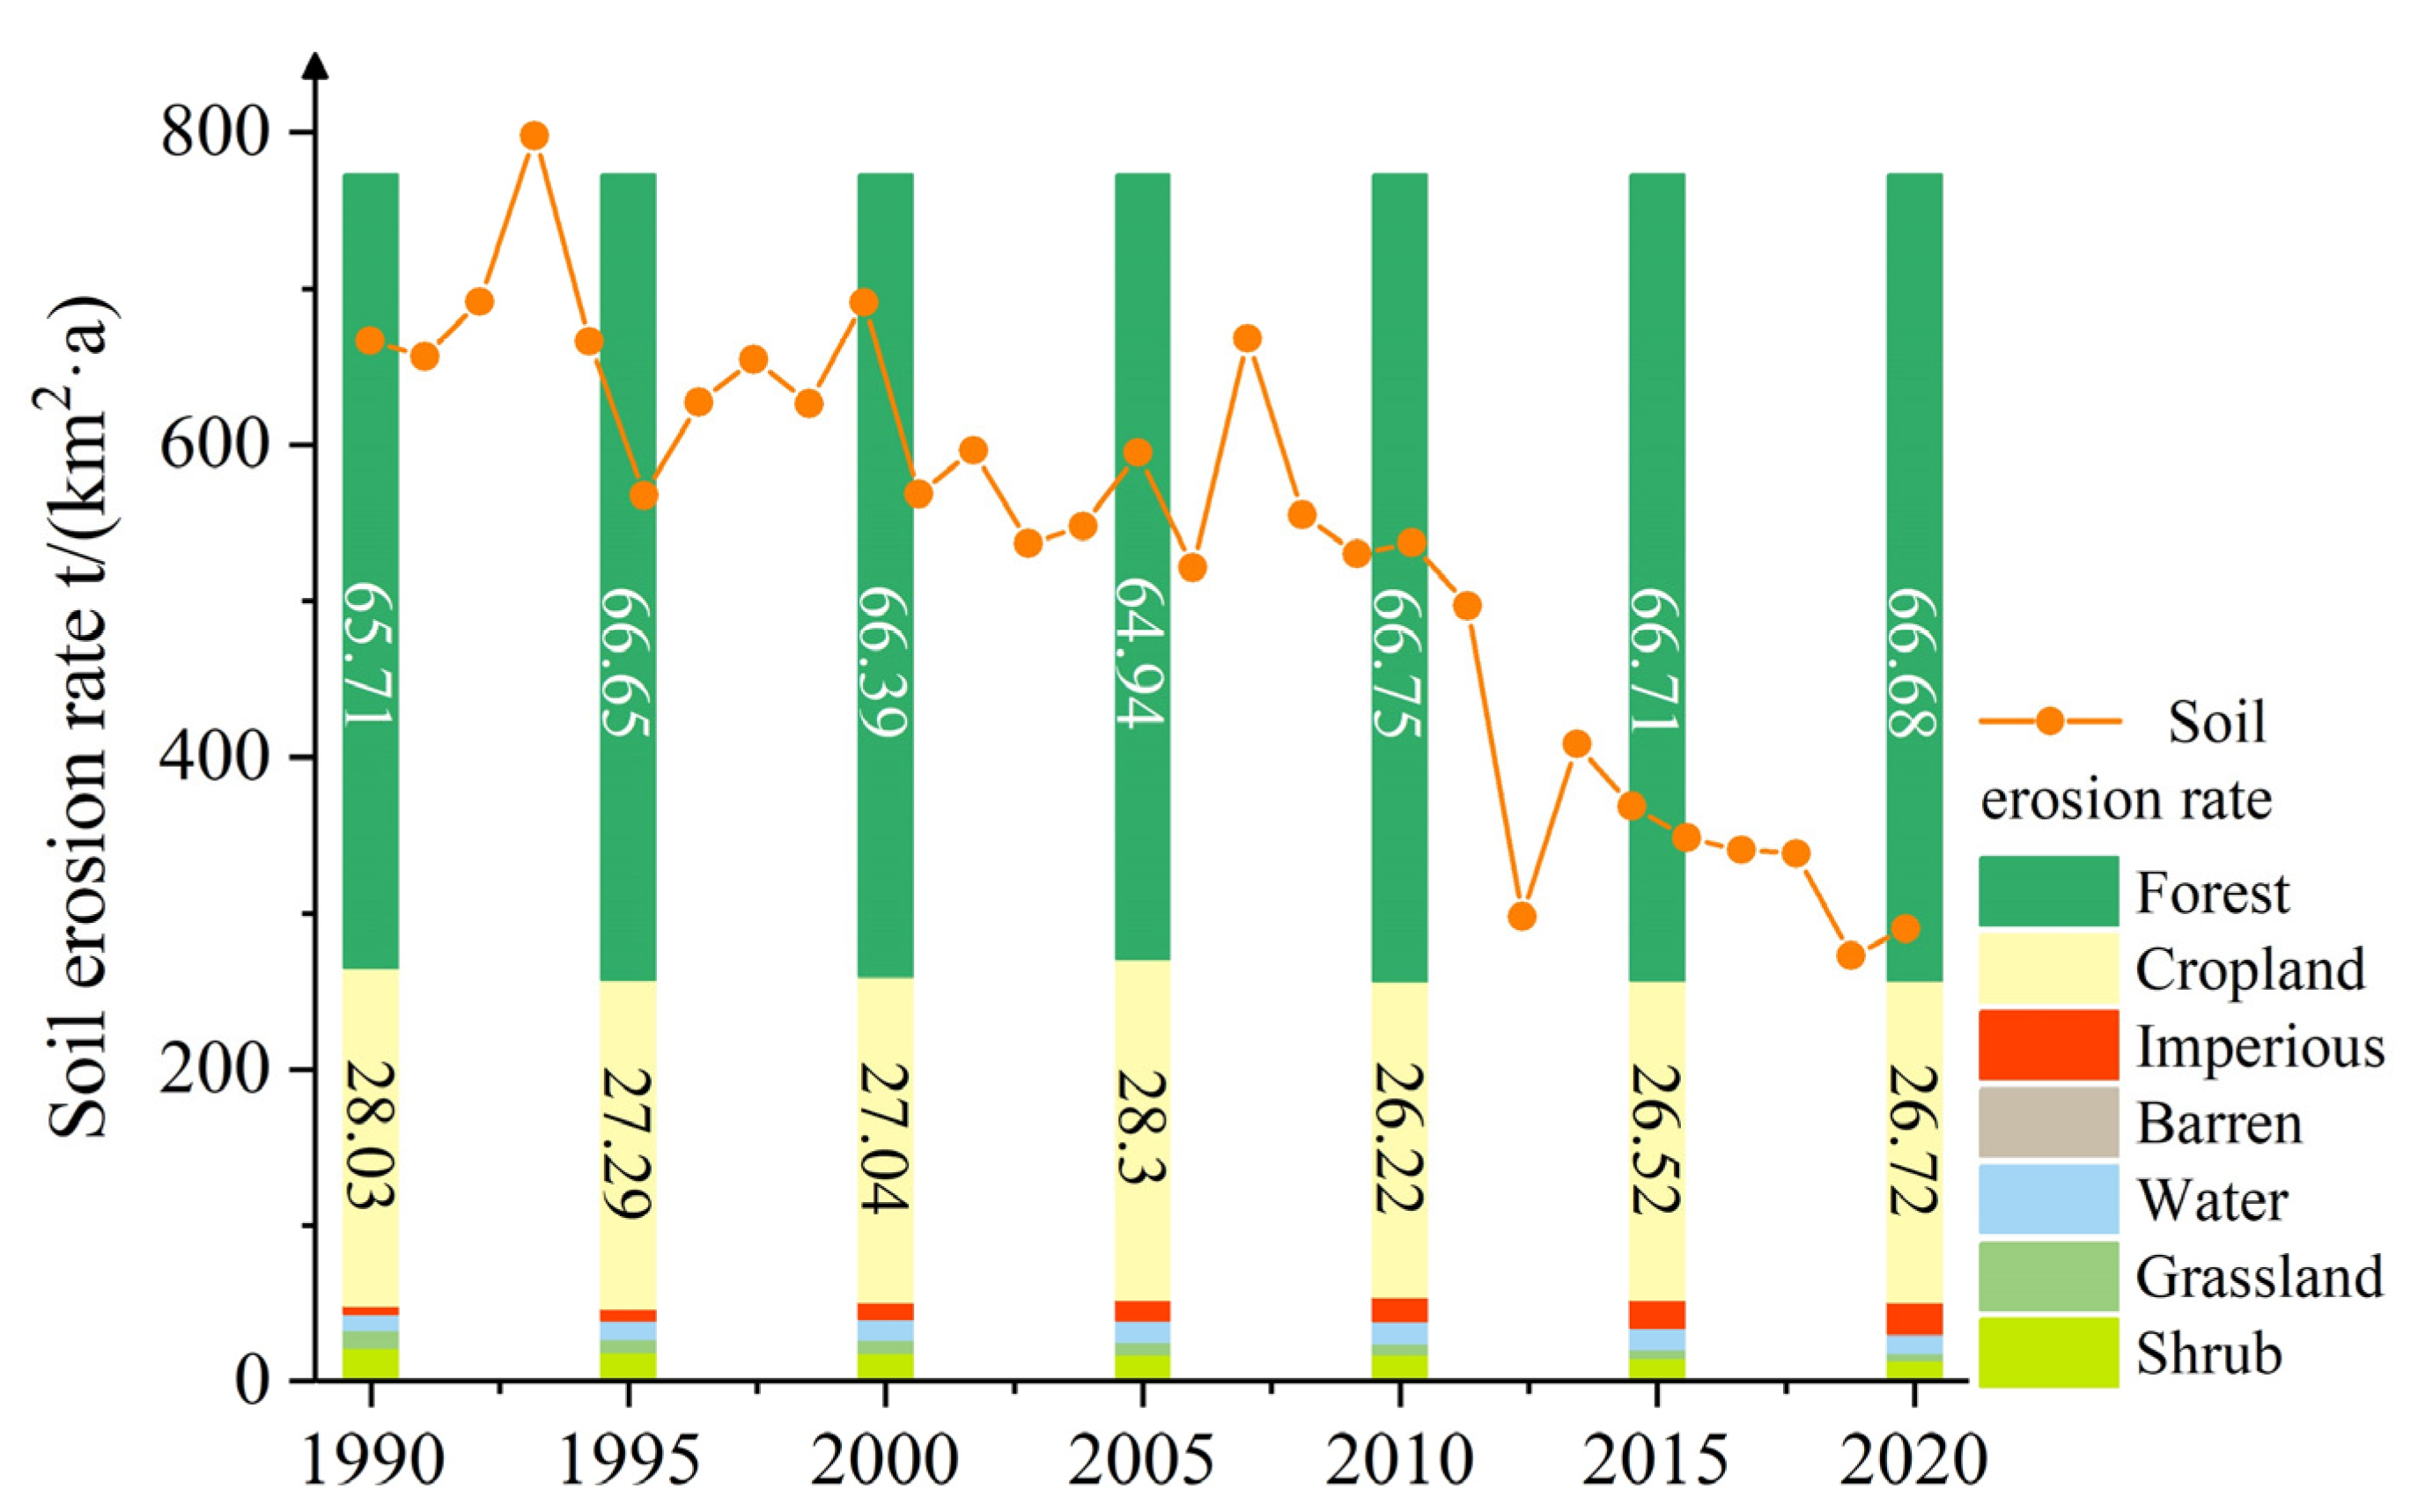
Land-cover change can significantly affect soil erosion [63]. Thus, we summarized the proportion of different land covers to analyze the contributions of soil erosion change in the GPRB (Figure 9 and Table 2). From 1990 to 1995, forests slightly increased from 65.71% to 66.65%, causing soil erosion to fluctuate down to less than 600 t/(km2·a). From 1995 to 2000, both forests and soil erosion remained relatively stable. From 2000 to 2005, forests decreased by 1.45%, but soil erosion remained relatively stable, despite the increase of 2.08% in croplands. From 2005 to 2010, due to China’s Grain for Green Program, forest coverage increased by 1.81%, but there was only a slight decrease in soil erosion. From 2010 to 2020, the forests remained very stable, but soil erosion dramatically decreased. After 2011, it was still at a very slight level, which was probably attributed to the relatively slowed urbanization and better vegetation structure with higher NDVI (Figure 8). Policy overhaul for soil and water conservation would also mitigate soil erosion. In 2007, the National Development and Reform Commission of China proposed a flood control project for the GPRB, focusing on mitigating soil erosion in the upper reaches of the PRB [64]. From 2013 to 2020, the soil erosion area decreased by 22.9 thousand km2, improving the environment in GPRB [65]. Overall, the improvement in forest vegetation structure expressed by the increase in the NDVI played a more significant role in mitigating soil erosion.

4. Discussion

4.1. Satellite Sensor Calibration

In this study, one of the primary and challenging tasks of long-term series datasets processing was to guarantee the consistency of the temporal NDVI datasets. In this study, only the NDVI dataset was produced by the authors; other data (land cover, precipitation, soil properties, etc.) were obtained from other open sources. Therefore, guaranteeing consistent results in the NDVI datasets was essential. To calculate the NDVI values from 1990 to 2020, images from three satellites were acquired: namely, Landsat-5 TM (1984–2012), Landsat-7 ETM+ (1999–2020), and Landsat-8 OLI (2013–2020). Different sensors are slightly different in spectral bands, leading to a slight deviation in surface reflectance and resultant NDVI values. Therefore, it is necessary to calibrate the NDVI values between different sensors.
In Landsat-5 TM, the red spectral band ranges from 0.630 to 0.690 μ m , and the NIR band ranges from 0.775 to 0.900 μ m . However, in Landsat-8 OLI, the red spectral band ranges from 0.630 to 0.680 μ m and the NIR band ranges from 0.845 to 0.885 μ m . Compared to Landsat-5 and -7, Landsat-8 has a narrower band range, a higher radiometric resolution, and larger resultant NDVI values calculated by surface reflectance. Roy et al. [66] collected a total of 59 million of the 30 m corresponding sensor observations from 6317 Landsat-7 ETM+ and Landsat-8 OLI images in the United States and modeled the statistical relationships of TOA NDVI and Surface NDVI between two different sensors. Although this model is designed for Landsat-7, it can also be applied to Landsat-5 because the two sensors have the same spectral band ranges. The formula is as follows:
O L I = 0.0149 + 1.0035   E T M
Due to the overall high quality of the Landsat-8 images, we used them as a benchmark to calibrate the Landsat-5 and Landsat-7 NDVI data. To check the calibration results, we selected the Ehuangzhang Nature Reserve in Guangdong Province, which is less affected by human activities, as the calibration area for sensor calibrating (Figure 10a).
During the calibration using Equation (12), the original NDVI values computed from the ETM+ sensor will be slightly increased. Even after the increasing operation, according to the scatter plot (Figure 10b), most scatter points still are located above the 1:1 line, indicating an increase in the NDVI from 2011 to 2013, which reflect the fact that the vegetation improved from 2011 to 2013. After sensor calibration, the NDVI data calculated by the TM and OLI sensors are more consistent over time, suggesting that the calibration worked.

4.2. Uncertainty Analysis

When calculating the soil erosion rate, we had to resample the datasets to the spatial resolution of 30 m to ensure consistent spatial resolution. However, the resampling operation may lead to the loss of the original information and increase the uncertainty of the results. In addition, obtaining the annual data for the support practice factor (P) is difficult. Here, based on a previous study [59], the P factor was empirically derived based on the combined information of elevation and land cover. Although this method has been widely used in previous studies as an effective alternative for the data of the P factor, it reused the effect of elevation and could weaken the role of the P factor in the overall model, leading to increased uncertainty in the final results.
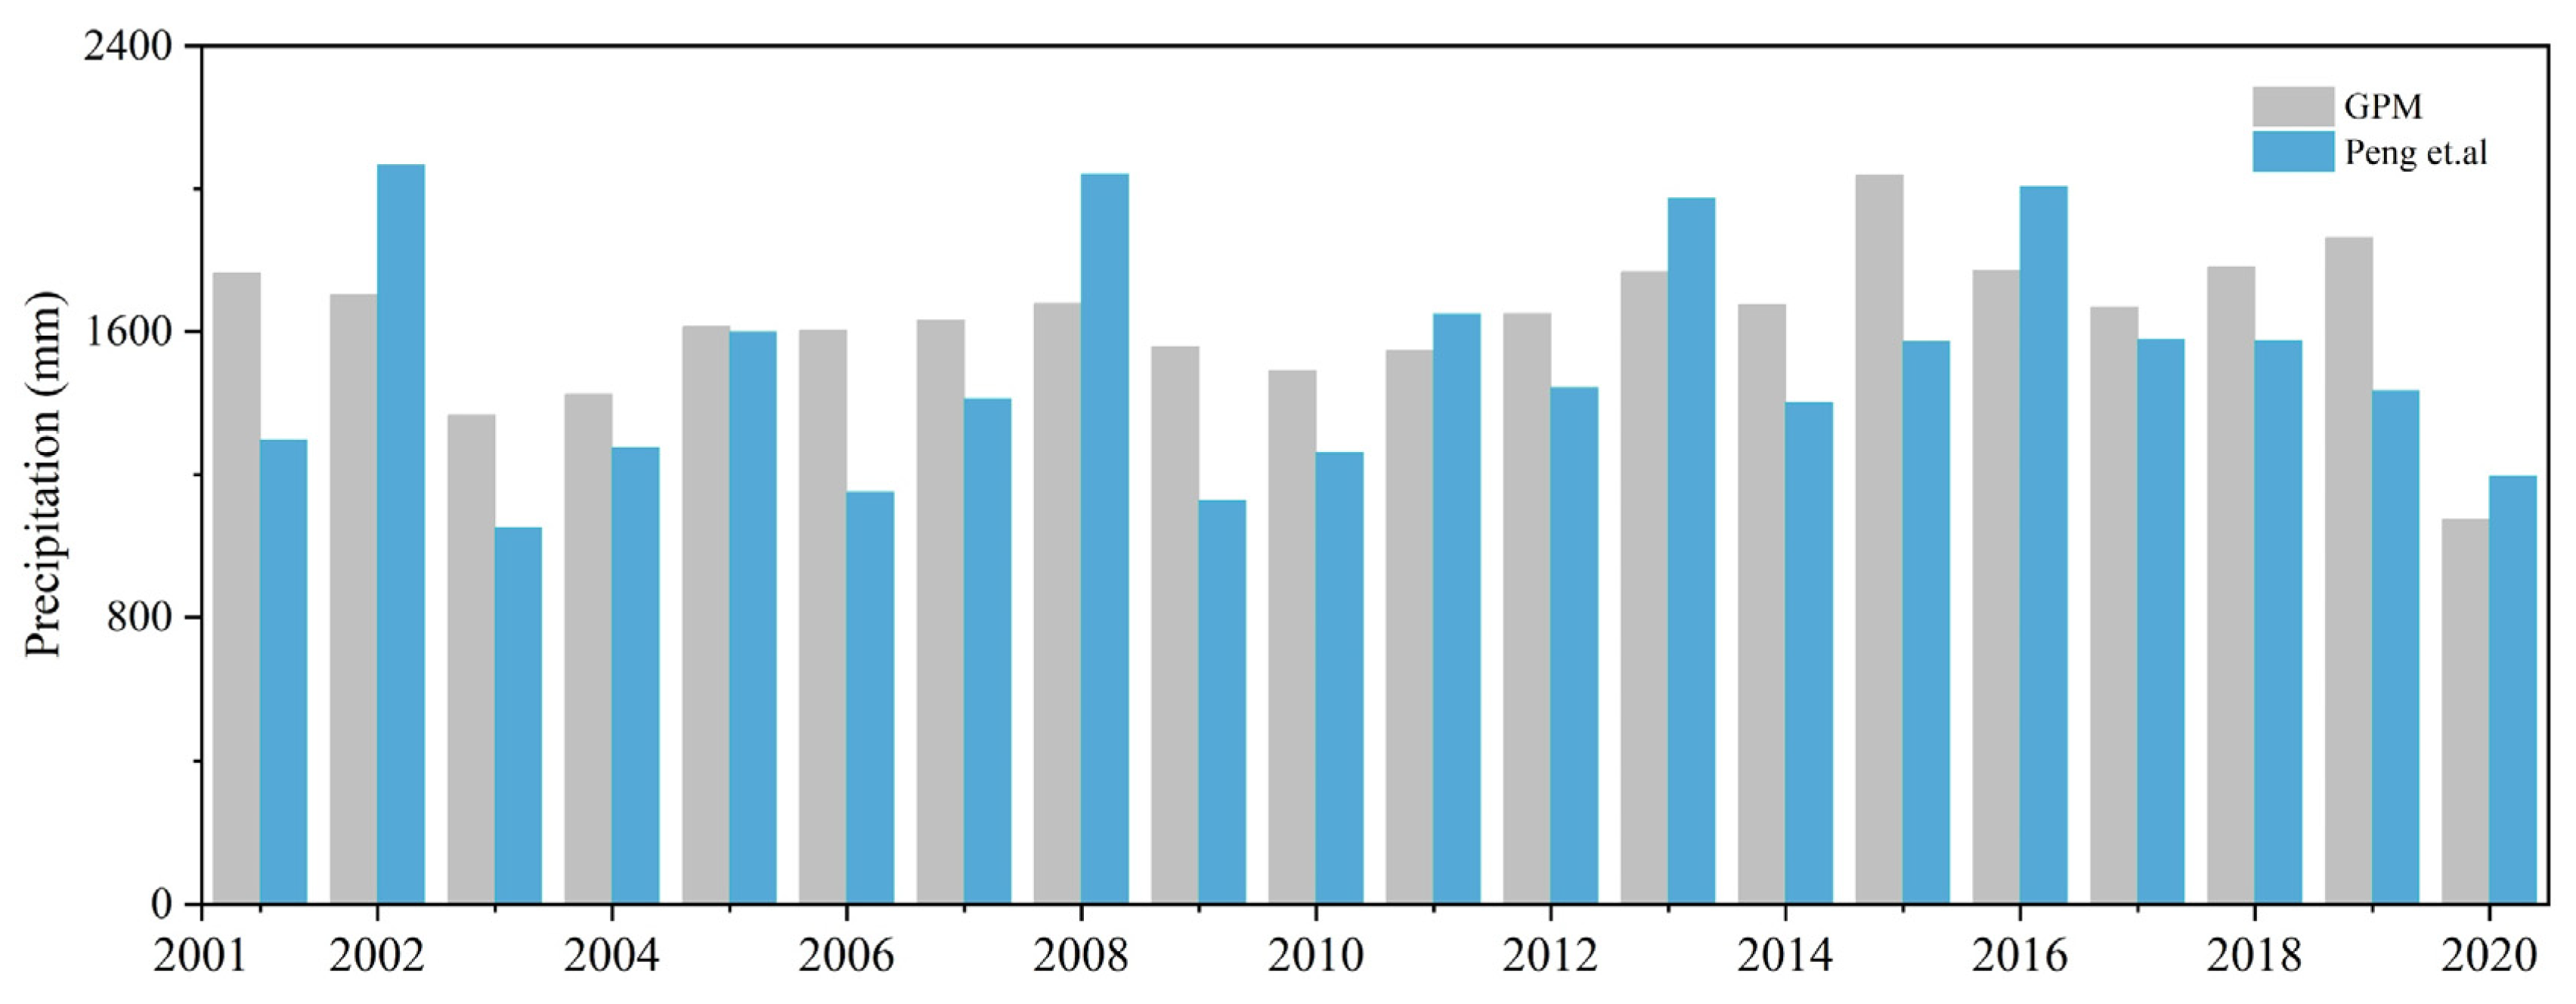
We have compiled some widely used rainfall data products (Table 3) for the calculation of the R factor. The global precipitation station data provided by NOAA and the ERA5 data provided by the Climate Data Store have the highest temporal resolution but are relatively more sparse than the stations provided by NOAA and have many missing values in terms of the Grand Pearl River Basin. For example, the Xuwen station in Guangdong Province only has data for the period before 2000. The ERA5 dataset with low spatial resolution would also reduce the spatial resolution in the soil erosion results, resulting in low accuracy. As a compromise, we used the precipitation dataset proposed by Peng et al. [43]. This dataset is a reanalysis product of the CRU climate dataset and the WorldClim climate dataset. It was validated using records from 496 independent meteorological observation sites in China. Compared with the original CRU dataset, the statistical deviation in this dataset was reduced by 25.7%. Although the datasets provided by Peng et al. [43] are reliable in terms of the entire Chinese territory, its accuracy in the Grand Pearl River Basin needs improvement. We also compared the dataset and the widely used GPM product (Figure 11).
It can be seen that the trends presented by the two datasets are basically similar: the bottom values of the two precipitation products were both observed in 2020, but two significant differences were also identified in 2002 and 2008. Peng’s dataset is slightly lower than the GPM dataset in most years and has larger fluctuations, which may lead to the underestimation of soil erosion, but this requires further verification.
Factor C was estimated based on the NDVI instead of crop species and the corresponding area adopted by Borrelli et al. [25]. This is mainly because the land-cover data we obtained did not provide detailed crop classes. In addition, the publicly available statistics on different crop types and areas do not include spatial information; therefore, it is difficult to acquire such data for the entire GPRB. The method using the NDVI data is more straightforward, which can reveal the spatial distribution of soil erosion, and is thus suitable for studies on large and long-term scales. It should be emphasized that the NDVI can only reflect the vegetation information; thus, the estimated C factor did not consider the resistance of litter to raindrop erosion [15].
We produced the NDVI datasets with high spatiotemporal resolution on the Google Earth Engine platform based on the 1990–2020 Landsat 30 m surface reflectance dataset. We developed a JavaScript script to filter the dataset using the parameters of study area extent, image acquisition time, and cloud coverage to obtain a total of 10,998 images. We also use a median function on a pixel-by-pixel basis to eliminate the influence of clouds. However, if few images with cloud coverage < 60% are available for a given year and a given region, the corresponding NDVI could be computed with high accuracy. For example, in the wet year of 2012, most Landsat ETM+ images were acquired with high cloud coverage and gaps, preventing the generation of NDVI products for 2012. Likewise, less than 300 images were available in 2002, 2007, 2010, and 2011, leading to incomplete NDVI coverage over the whole study area for these years. Fortunately, these gaps are relatively small and were filled with the NDVI products from the previous year. It should be highlighted that these gaps are relatively small and have a limited impact on the overall results at the basin scale. The obtained trends in NDVI dynamics are reliable for further soil erosion prediction.

4.3. Comparison with Previous Study

Based on the CSLE model, Chen et al. [38] utilized the methods of Map Algebra and Spatial Interpolation within ArcGIS, respectively, to map the soil erosion in the Pearl River Basin. The mean area-specific soil erosion rates in the GPRB calculated by the two tools were 791.78 t/(km2·a) and 615.37 t/(km2·a), respectively. The study did not state which year’s data were used. In this study, the estimated multi-year soil erosion rate in the GPRB was 538.95 t/(km2·a). In the first national water conservancy census in 2013, the identified total soil erosion area in the GPRB was 133,300 km2 or 20.4% of the total Pearl River Basin. The mapped results in this study were 147,000 km2 or 22.4% of the total Pearl River Basin. The two results are relatively close. Both results are basically consistent.
Few studies on soil erosion predictions were done in the GPRB over a long-time image series. Most of them were constructed in small watersheds. However, due to the influence of spatial scale effects, the results obtained from large-scale models may not be comparable to the results from small-scale soil investigations. The differences in data accuracy and the used models in large-scale studies may also derive different estimates. For example, in the Xijiang River Basin, with its higher soil erosion than the other tributaries, the area-specific soil erosion average in 2015 obtained in this study was 244.11 t/(km2·a), corresponding to the rate of 135.22 t/(km2·a) reported by Li et al. [36] based on the USLE-M model. The global soil erosion product developed by Borrelli et al. [25] shows that the area-specific soil erosion average in the same region in 2012 was ~310 t/(km2·a) [25]. Obviously, our results are closer to the global study result. Liu et al. [37] estimated the soil erosion average from 2000 to 2010 based on the RUSLE model in the North and South Panjiang river basin was 14.6 t/(hm2·a), corresponding to the result of 21.63 t/(hm2·a) obtained by this study. It should be highlighted that all of the aforementioned soil erosion predictions are only for the gross erosion, which is the on-site erosion potential, without considering redeposition. The net erosion, namely the difference between erosion and deposition processes at a given point, requires further analysis. Although differences in study scales, models, and data sources can affect soil erosion predictions, the spatial distribution and temporal trends derived from these results are similar.
The Pearl River has the smallest sediment concentration among the seven large Chinese rivers. The sediment size in the Pearl River Basin is bigger than that observed in the middle reaches of the Yellow River; thus, the proportion of suspended sediment is relatively lower than that obtained in the Yellow River. The retention of the bedload sediment along the way is quite significant; only 39% of it is transported by water [33]. A large amount of bedload sediment is deposited on the slopes, in channels and reservoirs, which creates a relatively low sediment concentration in rivers and thus hides the fact of the serious soil erosion in the Pearl River Basin.
Compared with the large and widely distributed soil erosion in the Yellow River Basin, the soil erosion in the Pearl River Basin is relatively mild and mainly concentrated in the upper reaches of the Xijiang River. The annual area-specific soil erosion average in the Pearl River Basin is 538.95 t/(km2·a). The average annual soil loss is approximately 353 million tons. A large amount of soil loss will lead to a large amount of carbon sequestered in the topsoil being released into the air, which will seriously impair the sustainability of terrestrial ecosystems.

5. Conclusions

Soil erosion is one of the important forms of soil degradation and a major threat to sustainable terrestrial ecosystems. Controlling soil erosion has been one of the most important tasks of terrestrial ecosystem management. Previous studies have indicated that human activities and resultant land cover change are the major causes of accelerated soil erosion. Due to fast population growth and urbanization, Asia has likely experienced more anthropogenic-activity-induced soil erosion than any other continent. The Grand Pearl River Basin, as a representation of large Asian river basins, is a typical watershed to demonstrate soil erosion dynamics in Asia. Here, we used a continuous Landsat satellite image dataset to investigate soil erosion dynamics over the past 30 years based on the RUSLE model across the Grand Pearl River Basin.
Our results indicated that the overall soil erosion displayed a decreasing trend over the past 30 years with an annual decreasing rate of −13.44(±1.53) t/(km2·a). Most soil erosion intensity is at slight or moderate levels, primarily observed in the tributary basin of the Xijiang River, especially in the areas with slopes > 15°, low vegetation coverage, or poorly managed forests. In the Grand Pearl River Basin, the NDVI and land cover were the dominant factors, versus the insignificant role precipitation played in the erosion procedure. The annual area-specific soil erosion average in the Grand Pearl River Basin is 538.95 t/(km2·a), leading to an average annual soil loss of approximately 353 million tons, which will enhance soil degradation and seriously impair the sustainability of terrestrial ecosystems.

Author Contributions

Conceptualization, X.M. and X.Y.; formal analysis, X.M., B.C. and X.Y.; data curation, X.M.; writing—original draft preparation, X.M.; writing—review and editing, X.M., J.Q., B.C., S.C., K.N. and X.Y.; supervision, X.Y. All authors have read and agreed to the published version of the manuscript.

Funding

The National Natural Science Foundation of China (Grant No.: 41871017) and the Natural Science Foundation of Guangdong Province (Grant No.: 2021A1515011533) funded this research.

Data Availability Statement

The data presented in this study are available on request from the corresponding author.

Acknowledgments

The authors are grateful to the National Tibet Plateau Data Center for providing precipitation data and soil organic data. They also thank the Resource Environment Science Data Center for providing soil texture datasets, including the USGS for the Landsat and STRM datasets, and Yang, J. and Huang, X. for sharing the 30 m annual land-cover data in China in their paper. Also thanks to the GEE platform.

Conflicts of Interest

The authors declare no conflict of interest.

References

  1. Marcinkowski, P.; Szporak-Wasilewska, S.; Kardel, I. Assessment of Soil Erosion under Long-Term Projections of Climate Change in Poland. J. Hydrology 2022, 607, 127468. [Google Scholar] [CrossRef]
  2. Amundson, R.; Berhe, A.A.; Hopmans, J.W.; Olson, C.; Sztein, A.E.; Sparks, D.L. Soil and Human Security in the 21st Century. Science 2015, 348, 1261071. [Google Scholar] [CrossRef] [PubMed] [Green Version]
  3. FAO. Status of the World’s Soil Resources (SWSR)—Main Report; Food and Agriculture Organization of the United Nations and Intergovernmental Technical Panel on Soils: Rome, Italy, 2016; 650p. [Google Scholar]
  4. Wuepper, D.; Borrelli, P.; Finger, R. Countries and the Global Rate of Soil Erosion. Nat. Sustain. 2020, 3, 51–55. [Google Scholar] [CrossRef]
  5. Wang, J.; Lu, P.; Valente, D.; Petrosillo, I.; Babu, S.; Xu, S.; Li, C.; Huang, D.; Liu, M. Analysis of Soil Erosion Characteristics in Small Watershed of the Loess Tableland Plateau of China. Ecol. Indic. 2022, 137, 108765. [Google Scholar] [CrossRef]
  6. Issaka, S.; Ashraf, M.A. Impact of Soil Erosion and Degradation on Water Quality: A Review. Geol. Ecol. Landsc. 2017, 1, 1–11. [Google Scholar] [CrossRef] [Green Version]
  7. Bossio, D.; Geheb, K.; Critchley, W. Managing Water by Managing Land: Addressing Land Degradation to Improve Water Productivity and Rural Livelihoods. Agric. Water Manag. 2010, 97, 536–542. [Google Scholar] [CrossRef]
  8. Larson, W.E.; Pierce, F.J.; Dowdy, R.H. The Threat of Soil Erosion to Long-Term Crop Production. Science 1983, 219, 458–465. [Google Scholar] [CrossRef]
  9. van Zelm, R.; van der Velde, M.; Balkovic, J.; Čengić, M.; Elshout, P.M.F.; Koellner, T.; Núñez, M.; Obersteiner, M.; Schmid, E.; Huijbregts, M.A.J. Spatially Explicit Life Cycle Impact Assessment for Soil Erosion from Global Crop Production. Ecosyst. Serv. 2018, 30, 220–227. [Google Scholar] [CrossRef]
  10. Li, D.; Lu, X.X.; Yang, X.; Chen, L.; Lin, L. Sediment Load Responses to Climate Variation and Cascade Reservoirs in the Yangtze River: A Case Study of the Jinsha River. Geomorphology 2018, 322, 41–52. [Google Scholar] [CrossRef]
  11. Shrestha, B.; Maskey, S.; Babel, M.S.; van Griensven, A.; Uhlenbrook, S. Sediment Related Impacts of Climate Change and Reservoir Development in the Lower Mekong River Basin: A Case Study of the Nam Ou Basin, Lao PDR. Clim. Chang. 2018, 149, 13–27. [Google Scholar] [CrossRef]
  12. Dutta, S. Soil Erosion, Sediment Yield and Sedimentation of Reservoir: A Review. Modeling Earth Syst. Environ. 2016, 2, 123. [Google Scholar] [CrossRef] [Green Version]
  13. Qiu, J.; Cao, B.; Park, E.; Yang, X.; Zhang, W.; Tarolli, P. Flood Monitoring in Rural Areas of the Pearl River Basin (China) Using Sentinel-1 SAR. Remote Sens. 2021, 13, 1384. [Google Scholar] [CrossRef]
  14. Oldeman, L.R.; Hakkeling, R.T.A.; Sombroek, W.G. World Map of the Status of Human-Induced Soil Degradation: An Explanatory Note; International Soil Reference and Information Centre: Wageningen, The Netherlands, 1990; ISBN 90-6672-042-5. [Google Scholar]
  15. Teng, M.; Huang, C.; Wang, P.; Zeng, L.; Zhou, Z.; Xiao, W.; Huang, Z.; Liu, C. Impacts of Forest Restoration on Soil Erosion in the Three Gorges Reservoir Area, China. Sci. Total Environ. 2019, 697, 134164. [Google Scholar] [CrossRef] [PubMed]
  16. Blanco, H.; Lal, R. Principles of Soil Conservation and Management; Springer: New York, NY, USA, 2008; Volume 167169. [Google Scholar]
  17. Bennett, H.H. A Permanent Loss to New England: Soil Erosion Resulting from the Hurricane. Geogr. Rev. 1939, 29, 196–204. [Google Scholar] [CrossRef]
  18. Beasley, D.B.; Huggins, L.F. Monke, ampEJ ANSWERS: A Model for Watershed Planning. Trans. ASAE 1980, 23, 938–944. [Google Scholar] [CrossRef]
  19. Laflen, J.M.; Lane, L.J.; Foster, G.R. WEPP: A New Generation of Erosion Prediction Technology. J. Soil Water Conserv. 1991, 46, 34–38. [Google Scholar]
  20. Yu, B.; Rose, C.W.; Ciesiolka, C.A.A.; Coughlan, K.J.; Fentie, B. Toward a Framework for Runoff and Soil Loss Prediction Using GUEST Technology. Soil Res. 1997, 35, 1191–1212. [Google Scholar] [CrossRef]
  21. Morgan, R.P.C.; Quinton, J.N.; Smith, R.E.; Govers, G.; Poesen, J.W.A.; Auerswald, K.; Chisci, G.; Torri, D.; Styczen, M.E. The European Soil Erosion Model (EUROSEM): A Dynamic Approach for Predicting Sediment Transport from Fields and Small Catchments. Earth Surf. Process. Landf. J. Br. Geomorphol. Group 1998, 23, 527–544. [Google Scholar] [CrossRef]
  22. NALDC.US. Predicting Rainfall Erosion Losses: A Guide to Conservation Planning. Available online: https://naldc.nal.usda.gov/download/CAT79706928/PDF (accessed on 22 November 2022).
  23. Renard, K.G. Predicting Soil Erosion by Water: A Guide to Conservation Planning with the Revised Universal Soil Loss Equation (RUSLE); United States Government Printing: Washington, DC, USA, 1997; ISBN 0-16-048938-5. [Google Scholar]
  24. Baoyuan, L.; Keli, Z.; Yun, X. An Empirical Soil Loss Equation. In Proceedings of the 12th International Soil Conservation Organization Conference, Beijing, China, 26–31 May 2002. [Google Scholar]
  25. Borrelli, P.; Robinson, D.A.; Fleischer, L.R.; Lugato, E.; Ballabio, C.; Alewell, C.; Meusburger, K.; Modugno, S.; Schütt, B.; Ferro, V. An Assessment of the Global Impact of 21st Century Land Use Change on Soil Erosion. Nat. Commun. 2017, 8, 1–13. [Google Scholar] [CrossRef] [Green Version]
  26. Panagos, P.; Katsoyiannis, A. Soil Erosion Modelling: The New Challenges as the Result of Policy Developments in Europe. Environ. Res. 2019, 172, 470–474. [Google Scholar] [CrossRef]
  27. Olorunfemi, I.E.; Komolafe, A.A.; Fasinmirin, J.T.; Olufayo, A.A.; Akande, S.O. A GIS-Based Assessment of the Potential Soil Erosion and Flood Hazard Zones in Ekiti State, Southwestern Nigeria Using Integrated RUSLE and HAND Models. CATENA 2020, 194, 104725. [Google Scholar] [CrossRef]
  28. Yue-Qing, X.; Xiao-Mei, S.; Xiang-Bin, K.; Jian, P.; Yun-Long, C. Adapting the RUSLE and GIS to Model Soil Erosion Risk in a Mountains Karst Watershed, Guizhou Province, China. Environ. Monit. Assess. 2008, 141, 275–286. [Google Scholar] [CrossRef] [PubMed]
  29. Liu, Y.; Fu, B.; Liu, Y.; Zhao, W.; Wang, S. Vulnerability Assessment of the Global Water Erosion Tendency: Vegetation Greening Can Partly Offset Increasing Rainfall Stress. Land Degrad. Dev. 2019, 30, 1061–1069. [Google Scholar] [CrossRef]
  30. Naipal, V.; Reick, C.; Pongratz, J.; Van Oost, K. Improving the Global Applicability of the RUSLE Model–Adjustment of the Topographical and Rainfall Erosivity Factors. Geosci. Model Dev. 2015, 8, 2893–2913. [Google Scholar] [CrossRef] [Green Version]
  31. Ostovari, Y.; Ghorbani-Dashtaki, S.; Bahrami, H.-A.; Naderi, M.; Dematte, J.A.M. Soil Loss Estimation Using RUSLE Model, GIS and Remote Sensing Techniques: A Case Study from the Dembecha Watershed, Northwestern Ethiopia. Geoderma Reg. 2017, 11, 28–36. [Google Scholar] [CrossRef]
  32. Niu, K.; Qiu, J.; Cai, S.; Zhang, W.; Mu, X.; Park, E.; Yang, X. Use of a MODIS Satellite-Based Aridity Index to Monitor Drought Conditions in the Pearl River Basin from 2001 to 2021. ISPRS Int. J. Geo-Inf. 2022, 11, 541. [Google Scholar] [CrossRef]
  33. Zhang, F. The stressed area to harness and the basic coutermeasures to soil and water loss in the Zhujiang watershed. Bull. Soil Water Conserv. 1990, 3, 25–29. (In Chinese) [Google Scholar] [CrossRef]
  34. Luk, S.H.; Yao, Q.Y.; Gao, J.Q.; Zhang, J.Q.; He, Y.G.; Huang, S.M. Environmental Analysis of Soil Erosion in Guangdong Province: A Deqing Case Study. CATENA 1997, 29, 97–113. [Google Scholar] [CrossRef]
  35. Feng, T.; Chen, H.; Polyakov, V.O.; Wang, K.; Zhang, X.; Zhang, W. Soil Erosion Rates in Two Karst Peak-Cluster Depression Basins of Northwest Guangxi, China: Comparison of the RUSLE Model with 137Cs Measurements. Geomorphology 2016, 253, 217–224. [Google Scholar] [CrossRef]
  36. Li, C.; Lu, Y.; Liu, B.; Xu, G. Estimation and Characteristics Analysis of Soil Erosion in Xijiang River Basin of Guangxi. Res. Soil Water Conserv. 2018, 25, 34–39. [Google Scholar] [CrossRef]
  37. Liu, L.; Cao, w.; He, T.; Wu, D.; Jiang, H. Analysis on spatial-temporal variation of soil loss and its driving factors in North-south Pan River watershed. Sci. Soil Water Conserv. 2019, 17, 69–77. [Google Scholar] [CrossRef]
  38. Chen, Y.; Yang, Q.; Liu, B.; Huang, C.; Wang, C.; Pang, G. Assessment of soil erosion intensity in Pearl River Basin based on CSLE model. Sci. Soil Water Conserv. 2021, 19, 86–93. [Google Scholar] [CrossRef]
  39. Field, C.B.; Barros, V.R.; Mastrandrea, M.D.; Mach, K.J.; Abdrabo, M.-K.; Adger, N.; Anokhin, Y.A.; Anisimov, O.A.; Arent, D.J.; Barnett, J. Summary for Policymakers. In Climate change 2014: Impacts, adaptation, and vulnerability. Part A: Global and sectoral aspects. Contribution of Working Group II to the Fifth Assessment Report of the Intergovernmental Panel on Climate Change; Cambridge University Press: Cambridge, UK, 2014; pp. 1–32. ISBN 1-107-64165-9. [Google Scholar]
  40. Zhang, W.; Cheng, Z.; Qiu, J.; Park, E.; Ran, L.; Xie, X.; Yang, X. Spatiotemporal Changes in Mulberry-Dyke-Fish Ponds in the Guangdong-Hong Kong-Macao Greater Bay Area over the Past 40 Years. Water 2021, 13, 2953. [Google Scholar] [CrossRef]
  41. Cao, B.; Qiu, J.; Zhang, W.; Xie, X.; Lu, X.; Yang, X.; Li, H. Retrieval of Suspended Sediment Concentrations in the Pearl River Estuary Using Multi-Source Satellite Imagery. Remote Sens. 2022, 14, 3896. [Google Scholar] [CrossRef]
  42. Qiu, J.; Yang, X.; Cao, B.; Chen, Z.; Li, Y. Effects of Urbanization on Regional Extreme-Temperature Changes in China, 1960–2016. Sustainability 2020, 12, 6560. [Google Scholar] [CrossRef]
  43. Peng, S.; Ding, Y.; Liu, W.; Li, Z. 1 Km Monthly Temperature and Precipitation Dataset for China from 1901 to 2017. Earth Syst. Sci. Data 2019, 11, 1931–1946. [Google Scholar] [CrossRef] [Green Version]
  44. RESDC.CN.A China Data Set of Soil Properties for Land Surface Modeling. Available online: https://www.resdc.cn/data.aspx?DATAID=260 (accessed on 22 November 2022).
  45. Yang, J.; Huang, X. 30 m Annual Land Cover and Its Dynamics in China from 1990 to 2019. Earth Syst. Sci. Data Discuss. 2021, 2021, 1–29. [Google Scholar] [CrossRef]
  46. NTPC.CN. Peng 1-Km Monthly Precipitation Dataset for China (1901–2020). Available online: https://www.tpdc.ac.cn/zh-hans/data/faae7605-a0f2-4d18-b28f-5cee413766a2/?q=%E4%B8%AD%E5%9B%BD1km (accessed on 22 November 2022).
  47. Wu, Y.; Xie, Y.; Zhang, W. Comparison of Different Methods for Estimating Average Annual Rainfall Erosivity. J. Soil Water Conserv. 2001, 3, 31–34. (In Chinese) [Google Scholar] [CrossRef]
  48. Zhang, W.; Fu, J. Rainfall erosivity estimation under different rainfall amount. Resour. Sci. 2003, 1, 35–41. (In Chinese) [Google Scholar] [CrossRef]
  49. Wischmeier, W.H.; Meyer, L.D. Soil Erodibility on Construction Areas. Soil Erosion: Causes, Mechanisms, Prevention and Control. US Highw. Res. Board Spec. Rep. 1973, 135, 20–29. [Google Scholar]
  50. EPIC: The Erosion-Productivity Impact Calculator. Available online: http://agrilife.org/epicapex/files/2015/05/EpicModelDocumentation.pdf (accessed on 22 November 2022).
  51. Shirazi, M.A.; Boersma, L. A Unifying Quantitative Analysis of Soil Texture. Soil Sci. Soc. Am. J. 1984, 48, 142–147. [Google Scholar] [CrossRef]
  52. Zhang, K.; Peng, W.; Yang, H. Soil erodibility and its estimation for agricultural soil in china. Acta Pedol. Sin. 2007, 6, 7–13. [Google Scholar] [CrossRef]
  53. Liu, B.Y.; Nearing, M.A.; Risse, L.M. Slope Gradient Effects on Soil Loss for Steep Slopes. Trans. ASAE 1994, 37, 1835–1840. [Google Scholar] [CrossRef]
  54. Desmet, P.J.J.; Govers, G. A GIS Procedure for Automatically Calculating the USLE LS Factor on Topographically Complex Landscape Units. J. Soil Water Conserv. 1996, 51, 427–433. [Google Scholar]
  55. McCool, D.K.; Brown, L.C.; Foster, G.R.; Mutchler, C.K.; Meyer, L.D. Revised Slope Steepness Factor for the Universal Soil Loss Equation. Trans. ASAE 1987, 30, 1387–1396. [Google Scholar] [CrossRef]
  56. Gutman, G.; Ignatov, A. The Derivation of the Green Vegetation Fraction from NOAA/AVHRR Data for Use in Numerical Weather Prediction Models. Int. J. Remote Sens. 1998, 19, 1533–1543. [Google Scholar] [CrossRef]
  57. Cai, C.; Ding, S.; Shi, Z.; Huang, L.; Zhang, G. Study of Applying USLE and Geographical Information System IDRISI to Predict Soil Erosion in Small Watershed. J. Soil Water Conserv. 2000, 2, 19–24. [Google Scholar] [CrossRef]
  58. Li, M.; Wu, B.; Yan, C.; Zhou, W. Estimation of Vegetation Fraction in the Upper Basin of Miyun Reservoir by Remote Sensing. Resour. Sci. 2004, 4, 153–159. (In Chinese) [Google Scholar] [CrossRef]
  59. Li, J.; Sun, R.; Xiong, M.; Yang, G. Estimation of soil erosion based on the RUSLE model in China. Acta Ecol. Sin. 2020, 40, 3473–3485. (In Chinese) [Google Scholar] [CrossRef]
  60. Lai, C.; Chen, X.; Wang, Z.; Zhao, S.; Wu, X.; Yu, H. Spatial and temporal variations of rainfall erosivity on Pearl River basin during 1960–2012. Trans. Chin. Soc. Agric. Eng. 2015, 31, 159–167. [Google Scholar] [CrossRef]
  61. Lai, C.; Chen, X.; Wang, Z.; Wu, X.; Zhao, S.; Wu, X.; Bai, W. Spatio-Temporal Variation in Rainfall Erosivity during 1960–2012 in the Pearl River Basin, China. CATENA 2016, 137, 382–391. [Google Scholar] [CrossRef]
  62. MEE.CN, Standards for Classification and Gradation of Soil Erosion. Available online: https://www.mee.gov.cn/ywgz/fgbz/bz/bzwb/stzl/202106/W020210910459257234201.pdf (accessed on 22 November 2022).
  63. Li, L.; Wang, Y.; Liu, C. Effects of Land Use Changes on Soil Erosion in a Fast Developing Area. Int. J. Environ. Sci. Technol. 2014, 11, 1549–1562. [Google Scholar] [CrossRef] [Green Version]
  64. NDRC.CN. Pearl River Basin Flood Protection Plan. Available online: https://www.ndrc.gov.cn/fggz/fzzlgh/gjjzxgh/200804/P020191104623802066146.pdf (accessed on 22 November 2022).
  65. MWR.CN. Pearl River Basin Soil and Water Conservation Bulletin. Available online: http://www.pearlwater.gov.cn/zwgkcs/lygb/stbc/202109/P020210914335796341337.pdf (accessed on 22 November 2022).
  66. Roy, D.P.; Kovalskyy, V.; Zhang, H.K.; Vermote, E.F.; Yan, L.; Kumar, S.S.; Egorov, A. Characterization of Landsat-7 to Landsat-8 Reflective Wavelength and Normalized Difference Vegetation Index Continuity. Remote Sens. Environ. 2016, 185, 57–70. [Google Scholar] [CrossRef] [PubMed]
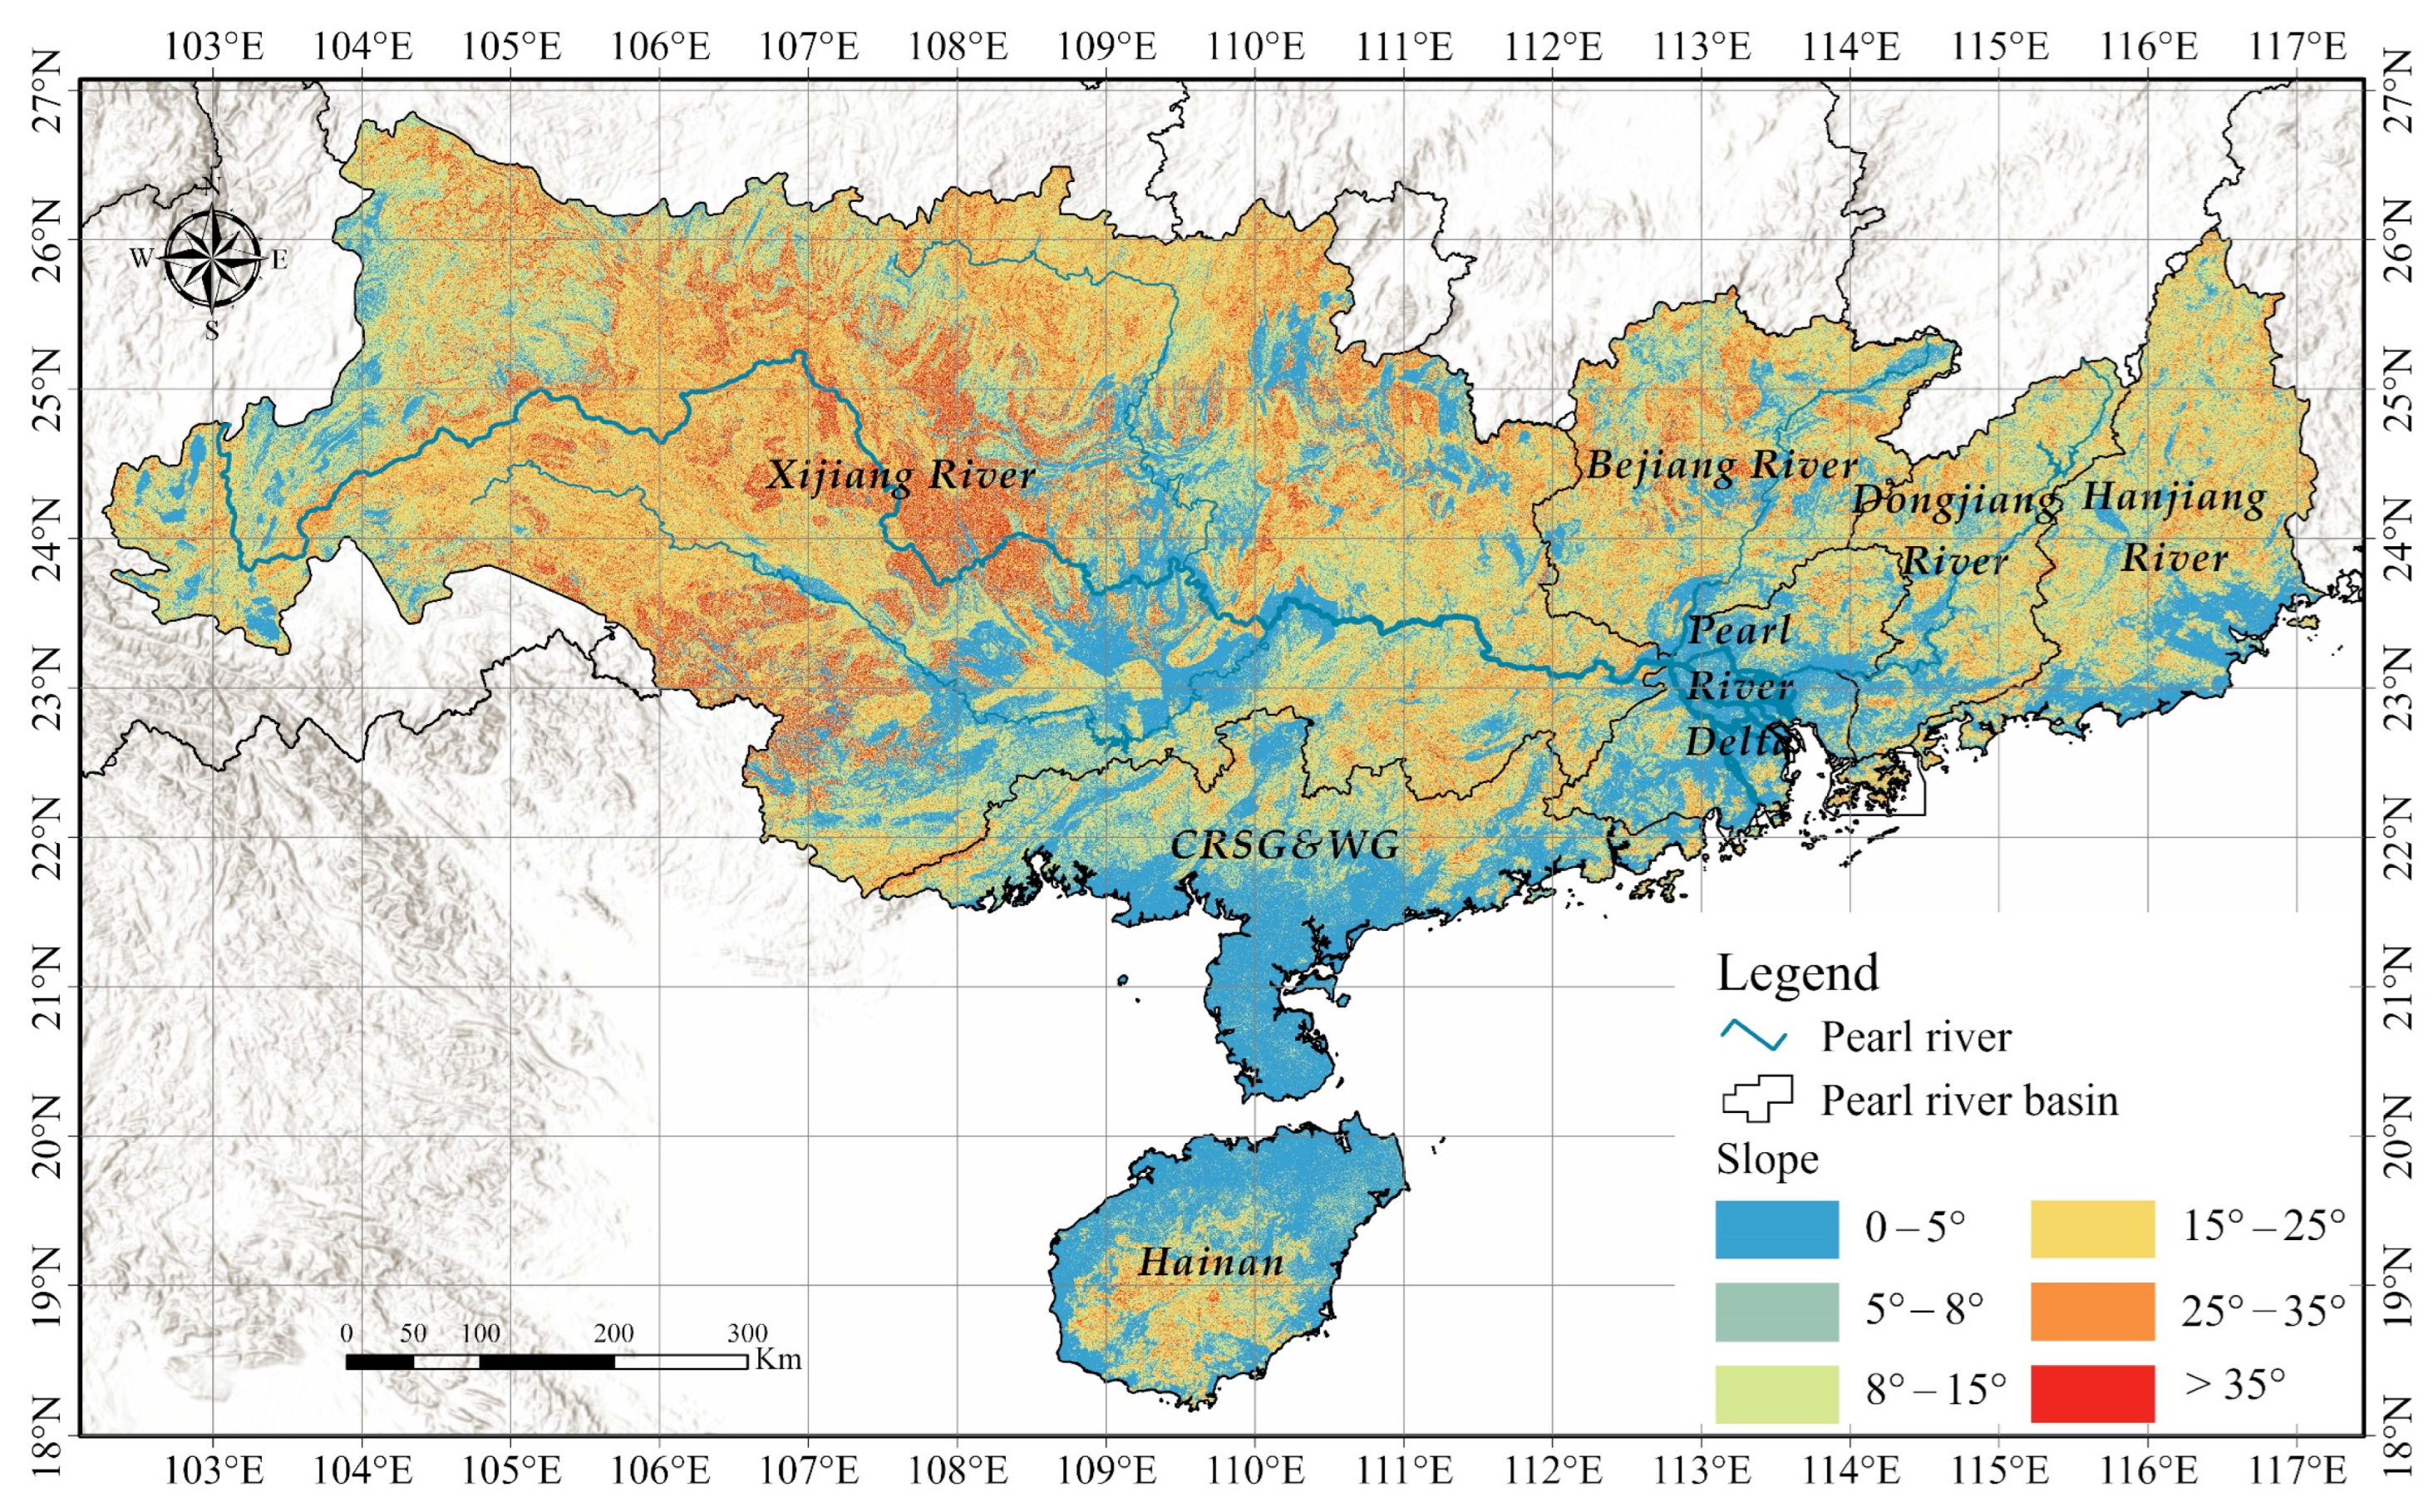
Figure 1. Location of the Grand Pearl River Basin.
Remotesensing 14 05949 g001
Figure 2. Spatial distribution of factors in the GPRB. (a) Rainfall erosivity factor (MJ·mm·hm−2·h−1·a−1); (b) Soil erodibility factor (t·h·MJ−1·mm−1); (c) slope length-steepness factor; (d) 30-year mean NDVI; (e) land cover in 2020.
Remotesensing 14 05949 g002
Figure 3. Spatiotemporal patterns of soil erosion in GPRB. According to the Chinese National Soil Erosion Classification Standard [62], soil erosion rate in the levels of very slight, slight, moderate, severe, very severe, and extremely severe are 0–500 t/(km2·a), 500–2500 t/(km2·a), 2500–5000 t/(km2·a), 5000–8000 t/(km2·a), 8000–15,000 t/(km2·a) and >15,000 t/(km2·a), (a) soil erosion intensity in 1990; (b) soil erosion intensity in 1995; (c) soil erosion intensity in 2000; (d) soil erosion intensity in 2005; (e) soil erosion intensity in 2010; (f) soil erosion intensity in 2015; (g) soil erosion intensity in 2020.
Remotesensing 14 05949 g003aRemotesensing 14 05949 g003b
Figure 4. Scatter plot of soil erosion rate from 1990 to 2020 (except 2012). The green dots represent soil erosion rate, the red curve is a linear fit line, and the gray band is a 95% confidence band. Please note: In 2010, soil erosion could be overestimated due to the cloud effect.
Remotesensing 14 05949 g004
Figure 5. Soil erosion rates in the GPRB and its sub-basins in the past 30 years. Most sub-basins experienced a significant decreasing trend, excluding the PRD. (a) soil erosion rate in PRD, PRB, XRB, BRB, DRB; (b) soil erosion rate in HI, PRB, HRB, CRSG&WG.
Remotesensing 14 05949 g005
Figure 6. Historical variations in soil erosion and precipitation in the GPRB and its sub-basins in the past 30 years.
Remotesensing 14 05949 g006
Figure 7. NDVI dynamics (1990–2020): (a) NDVI status in 1990, (b) NDVI status in 2020, (c) NDVI variation during 1990–2020.
Remotesensing 14 05949 g007
Figure 8. Historical changes in soil erosion rate and the NDVI in GPRB and its sub-basins in the past 30 years.
Remotesensing 14 05949 g008
Figure 9. The changes in the proportion of different land covers and soil erosion rate from 1990 to 2020.
Remotesensing 14 05949 g009
Figure 10. Validation of the NDVI calibration results using the selected area of the Ehuangzhang Nature Reserve in Guangdong Province: (a) the geographical location of the test site; (b) the comparison between the NDVI values obtained in 2011 using Landsat ETM+ sensor and 2013 using Land OLI sensor.
Remotesensing 14 05949 g010
Figure 11. Comparison of rainfall data with GPM data from Peng et al. [43].
Remotesensing 14 05949 g011
Table 1. Data sources and descriptions.
DatasetsSpatial ResolutionTemporal ResolutionData SourceExplanation/Purpose
SRTM DEM30 mN/AUSGSCalculation of the slope length and steepness factor in RUSLE
1 km monthly precipitation dataset for China1 kmMonthlyTPDC [46]Calculation of the rainfall erosivity factor in RUSLE
Soil properties1 kmN/ARESDC (soil texture data)
TPDC (soil organic data)
Calculation of the soil erodibility factor in RUSLE
Land Cover data30 mYearlyYang J. et al. [45]Calculation of the conservation practices factor in RUSLE
Table 2. Percentage of land cover in the GPRB from 1990 to 2020 (%).
Land Cover Type1990199520002005201020152020
Cropland28.0327.2927.0428.3026.2226.5226.72
Forest65.7166.6566.3964.9466.7566.7166.68
Shrub2.802.452.402.282.241.971.78
Grassland1.421.091.101.060.940.730.63
Water1.361.511.671.711.791.721.54
Barren0.020.010.010.010.010.010.01
Impervious0.670.991.401.712.062.352.64
Wetland<0.01<0.01<0.01<0.01<0.01<0.01<0.01
Table 3. Current popular used rainfall datasets.
DatasetDataset ProviderTemporal DomainSpatial Resolution
TerraClimateUniversity of California MercedMonthly (1958–2021)0.5° (lat-lon)
APHRODITEYatagai; HamadaDaily (1951–2007)0.5° (lat-lon)
TRMM 3B43NASA GES DISC at NASA Goddard Space Flight CenterMonthly (1998–2019)0.25° (lat-lon)
PERSIANN-CDRNOAA NCDCDaily (1983–present)0.25° (lat-lon)
ERA5Climate Data Store1 hourly (1981–present)0.1° (lat-lon)
GPM V6NASA GES DISC at NASA Goddard Space Flight Center3 hourly (2000–present)0.1° (lat-lon)
1-km monthly precipitation dataset for ChinaPeng et al.Monthly (1901–2020)0.00833° (~1 km)
Global precipitation station dataNOAA1 hourly (1942–present)N/A
Note: N/A—not applicable.
Publisher’s Note: MDPI stays neutral with regard to jurisdictional claims in published maps and institutional affiliations.