Article

Satellite Laser Altimetry Data-Supported High-Accuracy Mapping of GF-7 Stereo Images

1
College of Geoscience and Surveying Engineering, China University of Mining and Technology-Beijing, Beijing 100083, China
2
Land Satellite Remote Sensing Application Center, Ministry of Natural Resources, Beijing 100048, China
*
Author to whom correspondence should be addressed.
These authors contributed equally to this work.
Remote Sens. 2022, 14(22), 5868; https://doi.org/10.3390/rs14225868
Submission received: 27 October 2022 / Revised: 14 November 2022 / Accepted: 17 November 2022 / Published: 19 November 2022

Abstract

:
GaoFen 7 (GF-7) is China’s first submeter high-resolution stereo mapping satellite with dual-linear-array cameras and a laser altimeter system onboard for high-precision mapping. To further take advantage of the very high elevation accuracy of laser altimetry data and the high relative accuracy with stereo images, an innovative combined adjustment method for GF-7 stereo images with laser altimetry data is presented in this paper. In this method, two flexible and effective schemes were proposed to extract the elevation control point according to the registration of footprint images and stereo images and then utilized as vertical control in the block adjustment to improve the elevation accuracy without ground control points (GCPs). The validation experiments were conducted in Shandong, China, with different terrains. The results demonstrated that, after using the laser altimetry data, the root mean square error (RMSE) of elevation was dramatically improved from the original 2.15 m to 0.75 m, while the maximum elevation error was less than 1.6 m. Moreover, by integrating a few horizontal control points, the planar and elevation accuracy can be simultaneously improved. The results show that the method will be useful for reducing the need for field survey work and improving mapping efficiency.

Graphical Abstract

1. Introduction

Improving the geometric positioning accuracy of satellite imagery is important for high-precision mapping and subsequent remote sensing applications. Block adjustment with ground control points (GCPs) is the main method currently used to improve the geometric positioning of satellite imagery [1,2,3]. However, this method can be highly dependent on the distribution and amount of GCP for practical applications. Moreover, the data acquisition is often time-consuming and laborious, especially in deserts, forests, and even abroad. In the recent decades, as multisource geographic information data have advanced, satellite laser altimetry (SLA) data have gradually turned into an efficient public data source given their high elevation accuracy and good directivity [4,5,6].
For the Earth observation purposes, the Geoscience Laser Altimeter System (GLAS) onboard the Ice Cloud and Land Elevation Satellite (ICESat), launched in 2003, was the first spaceborne laser altimeter system in the world, with a nominal vertical accuracy of 0.15 m [7,8]. ICESat has contributed to many scientific domains, such as polar ice sheet monitoring, vegetation canopy height measurement, and topography mapping [8,9,10]. Shuman et al. [11] and Magruder et al. [12] conducted the accuracy assessments of ICESat elevation at the Antarctic ice sheet and White Sands Space Harbor, respectively. Martin et al. [13] used the surveyed surfaces with large slopes to validate the ICESat mission accuracy and concluded that the range bias was less than 2 cm and pointing errors were less than 2 arcsec. The follow-up ICESat-2 satellite was launched in September 2018, which featured a higher elevation accuracy and smaller laser spot size compared to ICESat/GLAS [14,15]. In 2016, China successfully launched the ZiYuan3-02 (ZY3-02) satellite, with the experimental laser altimeter onboard providing the Earth laser elevation survey for the first time over China [16,17]. Tang et al. [16] applied a ground-based electro-optical detection system to calibrate the pointing and ranging systematic errors. Their validation experiments revealed that the absolute elevation accuracy of ZY3-02 laser altimetry data in a flat area can reach 1 m. Li and Tang [18] analysed the accuracy of ZY3-02 satellite laser altimetry data and confirmed that it is possible to improve the geometric accuracy of stereo images with ZY3-02 laser altimetry data.
Given the high elevation accuracy of laser altimetry data, many researchers have used such data to improve the product accuracy of digital elevation models (DEMs). For instance, Gonzalez et al. [19] considered the GLAS as the reference elevation data to filter the elevation value of TanDEM-X. Tsutom et al. [20] provided an accurate interferometric synthetic aperture radar (InSAR) DEM for an Antarctic ice sheet after GLAS correction. Zhang et al. [21] presented a two-step block adjustment approach directly performed on digital surface models (DSMs) with high-accuracy ICESat-2 data. Their method can efficiently improve the accuracy for DSMs acquired by different sensor types. Besides the correction of topographic product, combined processing with satellite stereo images represents another important application field for laser altimetry data. In particular, Li et al. [22] and Zhou et al. [23] separated the planimetric and height control and selected the GLAS points as generalised elevation control points into the block adjustment. As a result, the elevation accuracy of ZiYuan3-01 (ZY3-01) satellite image has been significantly improved. Given the large laser spot size of GLAS and the similar planar accuracy with Chinese Mapping Satellite-1, Wang et al. [24] proposed a method to extract elevation control points through image matching within the laser spot radius, applied it to block adjustment, and improved the elevation accuracy from 5.88 m to 2.51 m. Moreover, Cao et al. [25] introduced the geometric model refinement general theory of satellite stereo images by using the laser altimetry data and validated with the stereo images and laser altimetry data of ZY3-02 satellite. Laser altimetry data were applied not only for vertical control in block adjustment but also to refine the satellite image imaging model with a laser ranging constraint. More specifically, Zhang et al. [6] and Li et al. [26] established a combined adjustment model with laser ranging information for integration of ZY3-02 stereo images and laser altimetry data for improved Earth topographic modelling. Their model ultimately improved the elevation accuracy of stereo images.
The GaoFen-7 (GF-7) satellite is the first Chinese submeter high-resolution stereo mapping satellite, which was launched in November 2019 [27]. The GF-7 satellite is equipped with dual-linear-array stereo cameras and a full-waveform laser altimeter system. The key objective of the laser altimeter system is to provide high-precision ground elevation control points, which facilitate optical imaging to achieve 1:10,000 mapping over China. Importantly, the GF-7 laser altimeter system is equipped with two laser footprint cameras for the first time in history. The laser footprint cameras are used to capture the images containing the laser spot and the ground surface information surrounding the laser spot at the moment of laser elevation measurement. Tang et al. [28] suggested to exploit the characteristics of the dual-beam laser altimeter of GF-7 satellite by introducing a two-step on-orbit geometric calibration scheme composed of single-beam laser pointing coarse calibration and dual-beam laser pointing and ranging combined calibration. The calibration of laser altimetry data confirmed that the absolute elevation accuracy of GF-7 satellite laser altimetry data in flat areas can reach 0.1 m.
The main aim of this study was to present a combined adjustment method of GF-7 satellite images and laser altimetry data for high-accuracy mapping. To this end, we examined the feasibility and effectiveness of this method. This study will allow researchers to take full advantage of the very high elevation accuracy of the GF-7 laser altimetry data and the novel laser footprint image registration with stereo images for extracting elevation control points.

2. Materials and Methods

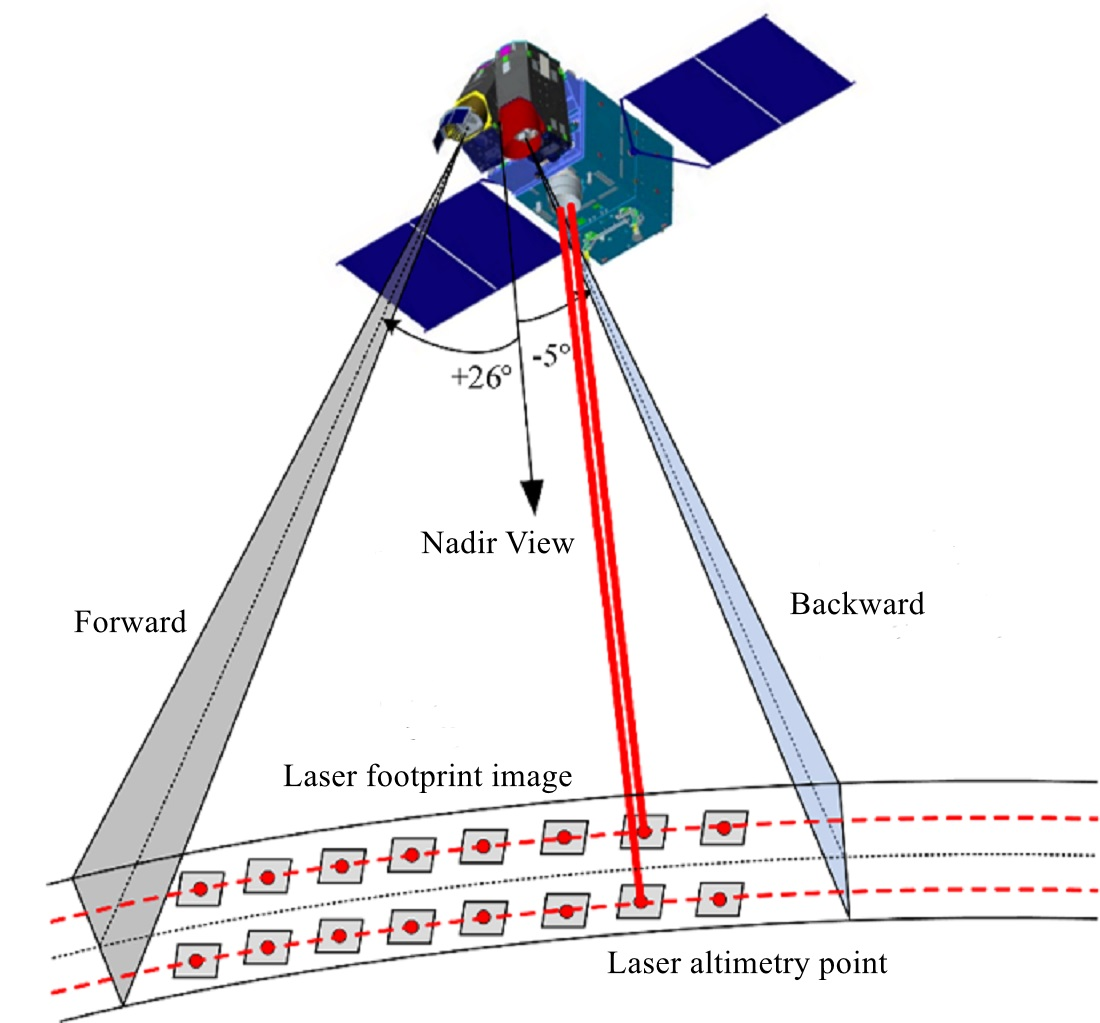
2.1. Stereo Image and Laser Altimetry Data of GF-7 Satellite

The dual-linear-array cameras equipped on the GF-7 satellite comprised forward (FWD) and backward (BWD) optical linear sensors. The FWD and BWD sensors are arranged at an inclination of 26° and −5°, respectively, to realize a base-to-height (B/H) ratio of 0.575. The main design parameters of the two cameras are shown in Table 1.
The GF-7 satellite laser altimeter system uses dual beams for synchronous Earth observation. It transmits a laser pulse at 3 Hz frequency and illuminates a spot on the Earth’s surface with a diameter of 17.5 m. Ideally, there are two columns of 16 laser spots in a standard image range, as shown in Figure 1a. The laser spot and surrounding ground objects were photographed using a footprint camera synchronously forming a footprint image. Figure 1b shows an example of a footprint image, where the red circle represents the laser spot size.
According to the characteristics of the GF-7 laser altimeter and data processing flow and application, GF-7 laser altimetry data are divided into six levels: satellite laser altimetry 01–06 (SLA01–SLA06). Of them, SLA03 is the laser altimetry standard product after full waveform processing, geometric positioning, atmospheric and tidal correction, etc., composed of three-dimensional coordinates (longitude, latitude, and ellipsoid height with respect to the World Geodetic System 1984 (WGS84)), footprint images, and waveform characteristic parameters, and is the basis for extracting elevation control points and making lake water level and other products [27,29].
It should be noted that not all laser altimetry data can reach the nominal accuracy given the influence of atmospheric, cloud, surface reflection, and other factors. To ensure the accuracy requirements of elevation control, certain rules have to be applied to screen and extract effective points from massive laser altimetry data. In this study, the item of elevation control point flag (ECP_Flag) in laser altimetry data metadata was selected as the main filter criterion [29]. Flags 1 and 2 indicate that the elevation accuracy of a point is very high or high and can be used as a vertical control point.

2.2. Workflow of Block Adjustment of GF-7 Stereo Images Integrating Laser Altimetry Data

The basic principle of laser altimetry data-supported stereo image block adjustment is that the very high-precision elevation value of laser altimetry data can be used to constrain the elevation value derived from the forward intersection of stereo images and use the elevation difference between the two as observations to construct an error equation, thus realising the approximation of the two elevations. The workflow is shown in Figure 2.
It should be noted that the laser altimetry data used in this study are Level SLA03 with item ECP_Flag marked as 1 or 2. Moreover, the stereo images should first undergo free network adjustment to improve the internal accuracy of block images and to confirm that the stereo images and laser altimetry data have high relative accuracy to ensure the extraction efficiency and accuracy of the elevation control points. In addition, this method is not only suitable for laser altimetry data-based block adjustment but also for combined adjustment when other control data are available.

2.3. Elevation Control Point Extracting Based on Footprint Image

Each GF-7 laser altimetry point provides rough planar coordinates and accurate elevation value, as well as footprint image and laser point image coordinates on the footprint image. The extraction of elevation control points is to determine the image coordinates of the laser point on the stereo images. The laser footprint image can be used to guide the extraction of laser elevation control points, which can be shown as in Figure 3.

2.3.1. Coarse-to-Fine Direct Matching Method

Conversely to the conventional image matching, the image point coordinates of the GF-7 laser point on the footprint image are known, so the point should be utilized as a constraint in the matching to a corresponding point on the stereo images. The coarse-to-fine matching method is proposed as follows:
  • Substitute the object coordinates of the laser altimetry point into the stereo image imaging model, and the initial position of the laser altimetry point on the stereo image (x, y) should be obtained; then, this point together with the image point (x0, y0) of the laser altimetry point on the footprint image construct a conjugate point pair.
  • Calculate the correlation coefficient between the stereo image area centred on (x, y) and the footprint image area centred on (x0, y0) with the same search window size (e.g., laser spot size) point by point according to Equation (1), and take the maximum correlation coefficient point (x1′, y1′) as the pixel-level registration point:
    ρ ( x 1 , y 1 ) = i = 1 h j = 1 w ( g ( x 0 + i , y 0 + j ) g ¯ ) ( g ( x + i , y + j ) g ¯ ) i = 1 h j = 1 w ( g ( x 0 + i , y 0 + j ) g ¯ ) 2 i = 1 h j = 1 w ( g ( x + i , y + j ) g ¯ ) 2
    where g and g′ are the grey values of the footprint image and stereo image, respectively, g ¯ and g ¯ are the average grey value of the matching window, and w and h represent the width and height of the search window, respectively.
  • Take the coordinates (x0, y0) as a constant and perform a least-squares matching according to Equation (2) with (x1′, y1′) as initial values for obtaining subpixel level registration point (x1, y1):
    g ( x 0 , y 0 ) = d 0 + d 1 g ( a 0 + a 1 x 0 + a 2 y 0 , b 0 + b 1 x 0 + b 2 y 0 )
    where d0 and d1 are image radiation distortion parameters, and (a0, a1, a2, b0, b1, b2) are the image geometric transformation parameters.
Considering the difference of image resolution, the image pyramids were established firstly, and then the coarse-to-fine matching strategy can be employed in the same level.

2.3.2. Local Constrain Method

The direct method heavily relies on the greyscale information of the image, but the footprint image and stereo image come from different sensors, and in their radiation quality exist larger differences. In order to ensure the success rate of laser point extraction, a method locally constrained can be used to extract the elevation control point.
  • Match the feature points in the laser footprint images with the corresponding area in the stereo images; the operator can be SIFT [30]. The distribution of feature points should be evenly, and the number should be more than three, which are called the constraint points;
  • Using the image coordinates of constraint points, an affine transformation model can be established, and the model is as follows:
    { x = a 0 + a 1 x + a 2 y y = b 0 + b 1 x + b 2 y
    where (x′, y′) are the image coordinate in stereo image, (x, y) are the image coordinates in laser footprint image, and (a0, a1, a2, b0, b1, b2) are the affine transform parameters.
  • Substitute the image coordinates of the laser altimetry point into Equation (3), and then the image coordinates of laser point in the stereo image can be calculated.
The local constraint method makes use of the characteristic of uniform transition of natural objects in a small range (e.g., footprint image). Although there exist radiation differences between images, a certain number of constraint points can be obtained, and then the image coordinates of laser points in the stereo image can be obtained, according to the geometric relationship established by constraint points. Therefore, this is an indirect extraction method.
It should be noted that in order to minimize the impact of huge differences in spatial resolution and radiation, the extraction of elevation control points is only carried out between the footprint image and the BWD stereo image, while the coordinate measurement of other stereo images is carried out using the BWD image as the reference. Otherwise, the measurement error of control points will occur. The relationship between the stereo image elevation error, base–height ratio, and image point coordinate measurement accuracy can be introduced as follows [31,32]:
Δ h e i = 2 y e Δ r B / H
where Δhei is the elevation error, ye is the image ground resolution, Δr is the measurement error, and B/H is the base–height ratio.
For the GF-7 satellite, the base–height ratio of the forward and backward cameras is 0.575; thus, the measurement error of 0.5 pixels in the image space will trigger an elevation error of approximately 0.80 m–0.98 m. Such error is much larger than the nominal accuracy of the laser altimetry point. Therefore, the measurement error should be thoroughly avoided.

2.4. Block Adjustment Model Based on Rational Function Model

The rational function model (RFM) uses a ratio polynomial to express the relationship between the normalised object–space coordinates (X, Y, Z) and corresponding normalised image–space coordinates (x, y). Given its simple form and high substitution accuracy, it has become a common geometric imaging model for satellite images [1,3,33]. Its general expression can be written as follows:
{ x = P 1 ( X , Y , Z ) P 2 ( X , Y , Z ) y = P 3 ( X , Y , Z ) P 4 ( X , Y , Z )
where P1, P2, P3, and P4 are general polynomials, the power of which generally takes three, as follows:
P i = a i 0 + a i 1 Y + a i 2 X + a i 3 Z + a i 4 Y X + a i 5 Y Z + a i 6 X Z + a i 7 Y 2 +      a i 8 X 2 + a i 9 Z 2 + a i 10 X Y Z + a i 11 Y 3 + a i 12 Y X 2 + a i 13 Y Z 2 +      a i 14 Y 2 X + a i 15 X 3 + a i 16 X Z 2 + a i 17 L 2 Z + a i 18 X 2 Z + a i 19 Z 3
where aij (i = 1, 2, 3, 4; j = 0, 1, … 19) are the rational polynomial coefficients (RPCs); consequently, there are 80 RPCs.
To alleviate the geolocation error in the RFM, the method of direct correction dominant RPCs (DCM) was used. The DCM method directly corrects the RPCs that have significant impact on geometric positioning, which has been proven to be an effective block adjustment method [3,34]. Compared with the most commonly used polynomial-based bias-compensation method at present, this method has no additional parameters, and its adjustment result is still RPC, which is convenient for other software for consequent processing. In the previous articles, the DCM method had only been tested in a small region, which will be evaluated in a large scale in this article to verify its effectiveness.
In the DCM, the dominant RPCs (the first four terms of numerator polynomials) and ground point object coordinates represent two types of unknowns requiring a solution. Moreover, in order to restrict the adjustment freedom and achieve the purpose of robust adjustment, two pseudo-observation equations were also established. Hence, the combined adjustment model can be represented in matrix form as follows:
{ V 1 = A X + B Y L 1 P 1 V 2 = Y L 2 P 2 V 3 = X L 3 P 3
X = [ Δ a 10 Δ a 11 Δ a 12 Δ a 13 Δ a 30 Δ a 31 Δ a 32 Δ a 33 ] T
Y = [ Δ l o n Δ l a t Δ h ] T
A = [ x a 10 x a 11 x a 12 x a 13 0 0 0 0 0 0 0 0 y a 30 y a 31 y a 32 y a 33 ]
B = [ x l o n x l a t x h y l o n y l a t y h ]
where the first observation equation is related to the image point, and another two are the pseudo-observation equations of ground point and dominant RPCs, respectively. Here, V1, V2, and V3 are the residual vectors; X is the correction terms of dominant coefficient; Y is the correction terms of ground point object coordinates; A, B are the corresponding coefficient matrix; L is the constant term calculated by the initial value; and P is the weight matrix.
It should be noted that, in the second observation equation, all three-dimensional coordinates are added for the GCP, whereas only the elevation coordinate is added for the laser altimetry data.
The different weights represent the contribution of the corresponding observations to the block adjustment. The weights are generally determined by P = σ 0 2 / σ 2 , where σ indicates the priori error of the observation, and σ 0 indicates the unit weight error. For the tie points, as they are obtained by high-accuracy matching algorithm, the priori error can be set as one-third of a pixel. For laser altimetry points, if a large number of laser altimetry points in the whole area are set to the same weight, the elevation direction will be distorted due to their elevation accuracy differences. The initial weight of the laser point can be determined according to the ECP_Flag parameter. For the laser altimetry point with ECP_Flag of 1, the priori error can be set to σ = 0.1 m, and 2 can be set to be σ = 0.4 m [29]. If GCPs are available, their weights can be determined by their actual accuracy. For the dominant RPCs, their weights are related to the original positioning accuracy of image. In our investigation, the setup of P3 follows that of Wu et al. [34]. Moreover, the weight of the observation can be appropriately changed according to the selecting weight iteration strategy in the adjustment iteration. This will help to reduce the influence of the gross error on the adjustment accuracy.

3. Experiment and Analysis

3.1. Experiment Data and Experiment Area

The experimental area is distributed in the Shandong mainland (China) and covers an area of approximately 158,000 km2. The terrain types are complex, with plains dominated in the north and west, accounting for approximately 65%, and the remaining are hills and mountains in the middle and east. The overall elevation fluctuates from −5 m to 1500 m above sea level. In total, 610 GF-7 stereo image pairs obtained from April 2020 to August 2022 were selected as the experimental data. In addition, 5512 laser altimetry points were collected to extract elevation control points. Finally, a total of 2384 effective elevation control points were obtained.
In total, 146 GCPs measured by the global positioning system were collected as checkpoints (CPs) to validate the adjustment accuracy. The horizontal and vertical accuracies of GCPs were both better than 0.1 m. The image coordinates of GCPs were manually measured in a stereo visualisation environment with an accuracy better than 0.5 pixels. The distribution of experimental area, GCPs, GF-7 stereo images, and laser altimetry data and one GCP diagram are shown in Figure 4.

3.2. Geometric Accuracy Effect Validation of Laser Altimetry Data on Stereo Images

In this experiment, the laser altimetry points were used as the vertical control points with the stereo images for combined block adjustment to validate the effect of the laser altimetry points on the geometric accuracy of stereo images in different terrain types. Furthermore, free network adjustment and combined adjustment with the GCPs as the vertical control points only were conducted for comparison. The results are presented in Table 2 and Figure 5.
As seen from Table 2 above, the overall planar positioning accuracy of GF-7 stereo images is 7.92 m, and the maximum error is 18.79 m without any external control. All the terrain results are similar, with no substantial terrain correlation observed. The elevation accuracy is 2.15 m, the maximum error is 5.24 m, and the overall elevation bias is notably 1.34 m. Figure 5a also shows that the horizontal and vertical residuals of free network adjustment exhibit a notably systematic pattern, with the horizontal errors tending to be small in the middle and large on both sides, pointing to the centre, while the elevation errors exhibit an upward trend. After combined adjustment with laser altimetry data, the overall plane accuracy is 8.05 m, which is equivalent to that in free network adjustment, and the plane accuracy of each terrain does not change significantly. Given that the laser altimetry data and stereo images are obtained on the same platform, their attitude and orbit determination error characteristics are similar, and they cannot alleviate each other like heterogeneous data. Therefore, the plane accuracy cannot be improved. However, the elevation accuracy has improved rapidly, reaching 0.75 m on the whole, which is nearly three times higher than the free network adjustment. Moreover, the mean elevation error of the whole region has been reduced from 1.34 m in the free network to 0.25 m, and the maximum error is only 1.59 m. This indicates that the elevation accuracy has been largely improved without elevation distortion. Figure 5b demonstrates that the plane error after combined adjustment is still displayed as a systematic error, and the overall error trend is similar to that in Figure 5a, but the elevation residual is greatly reduced, and the systematisation in the whole area is not strong.
The plane and elevation residuals, obtained after all GCPs were used as vertical control only, were similar to those in block adjustment with laser altimetry, as shown in Figure 5c. As there is no external plane constraint, the block images can only be adjusted within the original accuracy range. Therefore, the plane accuracy and error characteristics are consistent for the three adjustment modes. However, after the introduction of elevation control, the overall elevation continues to approach the external elevation control benchmark to achieve better elevation accuracy. Due to the incompletely unified accuracy of laser altimetry points, the adjustment elevation accuracy is indeed slightly inferior to that in adjustment with GCPs as vertical control only. However, the difference is only 0.1 m, which is negligible compared with the original elevation accuracy of stereo images. The maximum elevation error in mountain and the mean error, after adjustment with laser altimetry, are advantageously superior to that with GCPs. This may benefit from the better number and distribution of laser altimetry data. Based on the above analysis, it can be seen that the laser altimetry data can substantially improve the elevation accuracy; the overall elevation accuracy can reach 0.75 m, and the maximum elevation error is less than 1.6 m.

3.3. Block Adjustment with Different Control Condition

To verify the effect of combined adjustment of GCPs and laser altimetry points on the geometric accuracy of stereo images, the following experiments were carried out: P1: block adjustment with GCPs as horizontal and vertical control; P2: block adjustment with GCPs as horizontal control and laser altimetry points as vertical control; P3: block adjustment with GCPs as horizontal control; and GCPs and laser altimetry points as vertical control simultaneously. The experimental results are presented in Table 3.
As seen from Table 3, the plane accuracy of the entire area in P1 can be improved even with scarce GCPs (e.g., 5–10). For instance, when 10 GCPs were used around the region, the plane accuracy exhibited three times more improvement from 7.92 m in the free network adjustment to 2.34 m. Most of the plane systematic errors were eliminated, and the residuals exhibited chaos, as shown in Figure 5d. With the increase in GCPs, the improvement in the plane accuracy is no longer prominent. However, the improvement of a small number of GCPs on elevation accuracy is not ideal. Likewise, when 10 GCPs were used around the region, the elevation accuracy was 2.05 m, only 0.1 m higher than that of the free network, and it also has a large system error, as shown in Figure 5d. With the increase in GCPs, the elevation accuracy has been somewhat improved, but it is limited by 1.71 m when 30 GCPs are used, which are evenly distributed. To further improve the elevation accuracy, it is necessary to further increase the number of GCPs. When using the GCPs as the horizontal control and the laser altimetry point as the vertical control in the adjustment (P2), the plane residual characteristics are consistent with those of the adjustment with GCPs, and the plane accuracy is determined by the GCPs. However, the elevation accuracy is significantly improved (up to 0.75 m), which is equivalent to the use of only the laser altimetry points as the vertical control and is not affected by the GCPs. For instance, after the adjustment with 10 GCPs as plane control and laser altimetry as vertical control, the elevation accuracy and plane accuracy reach 0.75 m and 2.42 m, respectively. Figure 5e illustrates the distribution of elevation and plane residuals. As seen, it is similar to Figure 5b,d. Overall, Table 2 and Table 3 indicate that the elevation accuracy of the study area can be greatly improved using laser altimetry points, and its plane accuracy can be accordingly improved by using a few plane control points.
Moreover, when the GCPs are used as horizontal and vertical control together with laser altimetry points in the adjustment (P3), the elevation accuracy is affected by both. In our experiment area, laser altimetry points are more widely distributed and are more abundant compared with GCPs. Hence, small number of GCPs can only play a locally manifested control role, and the elevation accuracy is determined by the laser altimetry points. With the increase in GCPs, the control range of GCPs increases as well, so the impact on the elevation direction can be effective, which was confirmed by the elevation accuracy of 0.75 m when using 5 GCPs to 0.70 m when using 30 GCPs covering the whole area. When the GCPs are further added, the elevation accuracy is rapidly improved, even beyond the situation of using only GCPs or laser altimetry points. This is the common result induced by the wide distribution of laser altimetry points and the high accuracy of GCPs.

3.4. Accuracy Validation of Digital Surface Mode

To further verify the effectiveness of this method and to validate the elevation accuracy, two types of DSMs were generated with stereo images after block adjustment with/without laser altimetry points. For comparison, three stereo image pairs were selected in the flat, hilly, and mountainous areas to generate DSMs with dense image matching [35]. As there is no corresponding high-precision DSM, the DSMs derived from the stereo images after the adjustment with all GCPs only as the vertical control were used as the reference to evaluate the accuracy of the two types of DSM. The elevation difference maps and elevation difference histograms of the two DSM types are shown in Figure 6.
Figure 6 reveals that the DSMs generated after free network adjustment show substantial systematic deviations, which reached 1.05 m, 1.59 m, and 1.77 m. However, the elevation accuracy was markedly improved after laser altimetry data-assisted adjustment, reaching 0.17 m, 0.24 m, and 0.88 m, and they agreed well with the reference DSMs. Overall, these results show that the combined adjustment proposed in this study can effectively improve the elevation accuracy.

4. Discussion

RPCs have no specific physical meaning, but the influence of each RPC on geometric positioning can be very different, and current literature confirms that a good positioning result can be obtained by only modifying a subset of the RPCs. In this experiment, 42,831 tie points, 146 GCPs, and 2384 laser altimetry points were acquired; the image points RMSE was less than 0.3 pixels; and the maximum error was not more than 1.3 pixels, which can confirm the effectiveness and adaptability of block adjustment model. However, the RPC cannot be corrected out of order, and the issues of how to accurately determine the variation range of RPC and to ensure that the RFM model does not produce unexpected distortion are those of future work.
An interesting phenomenon is that the planar accuracy and elevation accuracy of the GF-7 satellite stereo image show almost opposite changes rule, as shown in Figure 7. Under the condition of a small number of GCPs, the planar accuracy is rapidly improved, while the elevation accuracy is not significantly improved. However, when the GCPs are increased to a certain level, the plane accuracy increases slowly, but the elevation accuracy is significantly improved. In fact, there is a great correlation between elevation accuracy and base–height ratio; it is difficult to obtain good elevation accuracy by relying only on a small number of GCPs given the small base–height ratio of the GF-7 satellite. In our experiments, when the uniform distributed 10 GCPs were used (in which the number of stereo models between GCPs exceeds 6), the elevation accuracy can only reach 2.05 m. By continuing to add 50 GCPs, the elevation accuracy can reach 1.44 m when the number of stereo models between GCPs is reduced to 3–4. When it is increased to 100 GCPs, the number of stereo models between GCPs is decreased to 1, while the elevation accuracy is greatly improved to 0.89 m. Hence, the elevation accuracy strongly depends on the number and distribution of GCPs and cannot provide ideal results with a few GCPs. On the contrary, the plane accuracy of GF-7 satellite image is mainly a systematic error, and few plane control points can eliminate most of the errors. Moreover, the stereo images used in our experiments were processed with the satellite real-time attitude and orbit data. When the postprocessed precise orbit and attitude data are adopted, the original accuracy will be better. For the laser altimetry data, however, due to their high accuracy, uniform distribution, and the large amount of data, it is sufficient to restrict the elevation in the whole region. This enables elevation accuracy to be significantly improved. Thus, the combination of sparse plane control points and laser altimetry data can be used to improve the plane and elevation accuracy simultaneously given the diversity of acquiring plane control points in practical operation (field survey points, existing orthoimage, open-source image, etc.). This finding opens excellent practical application prospects for saving field work and for providing important technical support for mapping difficult areas.
Although two different kinds of approaches to extract laser elevation control points were provided in this article, the extraction efficiency is still not ideal. In these experiments, there are 5512 laser points in total, and only 2384 points were successfully extracted as elevation control points, with a success rate of only 43.2%. This was caused by the huge difference in image resolution and radiometry, especially for the regions where there are single or repeated ground features, which will further affect the extraction of success rate. The matching method based on image structure is a hot topic in current research that can resist the radiometry difference between images and describe with the relatively stable geometry and shape features, which has a good matching effect in multimodal image matching [36,37]. In the future, this structure-based matching idea can be used as reference for the laser elevation control point extraction. Nonetheless, the elevation control points extracted by the method proposed in this paper can still achieve excellent elevation accuracy.

5. Conclusions

This paper presented a combined adjustment method for stereo image and laser altimetry data of GF-7 satellite for high-accuracy mapping. In our study, the elevation control points were automatically extracted according to the registration of laser footprint image and stereo images. The elevation of stereo images was then constrained by the excellent elevation of the laser altimetry data in the combined adjustment. Different validation experiments were carried out using stereo images distributed in the Shandong, China, and the corresponding laser altimetry data. The experimental results demonstrate that, after using laser altimetry data, the elevation accuracy can be effectively improved in flat, hilly, and mountainous areas, indicating that the GF-7 laser altimetry data can be applied to the most terrain areas. Moreover, by introducing additional sparse plane control points into the block adjustment, the plane accuracy and elevation accuracy can be greatly improved at the same time, which is important for reducing the need for field surveys and improving mapping efficiency.

Author Contributions

Conceptualization, C.L., X.C. and X.T.; methodology, C.L. and L.G.; software, C.L. and D.Y.; validation, C.L., S.L. and L.W.; formal analysis, C.L., X.C. and L.G.; investigation, C.L. and D.Y.; data support, X.W.; writing—original draft preparation, C.L.; writing—review and editing, L.G. and S.L.; supervision, X.C. and X.T.; project administration, X.T.; funding acquisition, X.C. and D.Y. All authors have read and agreed to the published version of the manuscript.

Funding

This research was funded by National Natural Science Foundation of China, grant numbers 52274169 and 52174160, the Natural Science United Foundation of Hebei Province, China, grant number E2020402086.

Data Availability Statement

Not applicable.

Acknowledgments

The authors would like to thank the editors and reviewers for their efforts to help the publication of this work.

Conflicts of Interest

The authors declare no conflict of interest.

References

  1. Grodecki, J.; Dial, G. Block Adjustment of High-Resolution Satellite Images Described by Rational Polynomials. Photogramm. Eng. Remote Sens. 2003, 69, 59–68. [Google Scholar] [CrossRef]
  2. Fraser, C.; Hanley, H. Bias-compensated RPCs for sensor orientation of high-resolution satellite imagery. Photogramm. Eng. Remote Sens. 2005, 71, 909–915. [Google Scholar] [CrossRef]
  3. Tang, X.; Liu, C.; Zhou, P.; Cao, N.; Li, F.; Wang, X. Satellite-imagery geometric accuracy improvement based on direct correction of dominant coefficients. Photogramm. Eng. Remote Sens. 2020, 86, 215–224. [Google Scholar] [CrossRef]
  4. Shan, J.; Tian, X.; Li, S.; Li, R. Advances of spaceborne laser altimetry technology. Acta Geod. Cartogr. Sin. 2022, 51, 964–982. [Google Scholar]
  5. Tang, X.; Liu, C.; Zhang, H.; Wang, X.; Li, G.; Mo, F.; Li, F. GF-7 Satellite Stereo Images Block Adjustment Assisted with Laser Altimetry Data. Geomat. Inf. Sci. Wuhan Univ. 2021, 46, 1423–1430. [Google Scholar]
  6. Zhang, G.; Xu, K.; Jia, P.; Hao, X.; Li, D. Integrating stereo images and laser altimeter data of the ZY3-02 satellite for improved earth topographic modeling. Remote Sens. 2019, 11, 2453. [Google Scholar] [CrossRef] [Green Version]
  7. Abshire, J.B.; Sun, X.L.; Riris, H.; Sirota, M.; McGarry, J.; Palm, S.; Ketchum, E.A.; Follas, R.B. Geoscience laser altimeter system (GLAS) on the ICESat mission: Pre-launch and on-orbit measurement performance. Geophys. Res. Lett. 2003, 32, 1534–1536. [Google Scholar]
  8. Schutz, B.E.; Zwally, H.J.; Shuman, C.A.; Hancock, D.; DiMarzio, J.P. Overview of the ICESat Mission. Geophys. Res. Lett. 2005, 32, L21S01. [Google Scholar] [CrossRef] [Green Version]
  9. Abshire, J.B.; Sun, X.L.; Riris, H.; Sirota, J.M.; Mcgarry, J.F.; Palm, S.; Yi, D.; Liiva, P. Geoscience Laser Altimeter System (GLAS) on the ICESat mission: On-orbit measurement performance. Geophys. Res. Lett. 2005, 32, L21S02. [Google Scholar] [CrossRef] [Green Version]
  10. Duncanson, L.I.; Niemann, K.O.; Wulder, M.A. Estimating forest canopy height and terrain relief from GLAS waveform metrics. Remote Sens. Environ. 2010, 114, 138–154. [Google Scholar] [CrossRef]
  11. Shuman, C.A.; Zwally, H.J.; Schutz, B.E.; Brenner, A.C.; Dimarzio, J.P.; Suchdeo, V.P.; Fricher, H.A. ICESat Antarctic elevation data: Preliminary precision and accuracy assessments. Geophys. Res. Lett. 2006, 33, L07501. [Google Scholar] [CrossRef]
  12. Magruder, L.A.; Webb, C.E.; Urban, T.; Silverberg, E.C.; Schutz, B.E. ICESat altimetry data product verification at White Sands Space Harbor. IEEE Trans. Geosci. Remote Sens. 2007, 45, 147–155. [Google Scholar] [CrossRef]
  13. Martin, C.F.; Thomas, R.H.; Krabill, W.B.; Manizade, S.S. ICESat range and mounting bias estimation over precisely-surveyed terrain. Geophys. Res. Lett. 2005, 32, L21S0721. [Google Scholar] [CrossRef]
  14. Neumann, T.A.; Martino, A.J.; Markus, T.; Bae, S.; Bock, M.R.; Brenner, A.C.; Brunt, K.M.; Cavanangh, J.; Fernandes, S.T.; Hancock, D.W.; et al. The Ice, Cloud, and Land Elevation Satellite-2 Mission: A Global Geolocated Photon Product Derived from the Advanced Topographic Laser Altimeter System. Remote Sens. Environ. 2019, 233, 111325. [Google Scholar] [CrossRef] [PubMed]
  15. Markus, T.; Neumann, T.; Martino, A.; Abdalati, W.; Brunt, K.; Csatho, B.; Farrell, S.; Fricker, H.; Gardner, A.; Harding, D.; et al. The Ice, Cloud, and land Elevation Satellite-2 (ICESat-2): Science requirements, concept, and implementation. Remote Sens. Environ. 2017, 190, 260–273. [Google Scholar] [CrossRef]
  16. Tang, X.; Xie, J.; Fu, X.; Mo, F.; Li, S.; Dou, X. ZY3-02 laser altimeter on-orbit geometrical calibration and test. Acta Geod. Cartogr. Sin. 2017, 46, 714–723. [Google Scholar]
  17. Xie, J.; Tang, X.; Mo, F.; Tang, H.; Wang, Z.; Wang, X.; Liu, Y.; Tian, S.; Liu, R.; Xia, X. In-orbit geometric calibration and experimental verification of the ZY3-02 laser altimeter. Photogramm. Rec. 2018, 33, 341–362. [Google Scholar] [CrossRef]
  18. Li, G.; Tang, X. Analysis and Validation of ZY-3 02 Satellite Laser Altimetry Data. Acta Geod. Cartogr. Sin. 2017, 46, 1939–1949. [Google Scholar]
  19. Gonzalez, J.H.; Bcchmann, M.; Scheiber, R.; Krieger, G. Definition of ICESat selection criteria for their use as height reference for TanDEM-X. IEEE Trans. Geosci. Remote Sens. 2010, 48, 2750–2757. [Google Scholar] [CrossRef]
  20. Tsutomu, Y.; Koichiro, D.; Kazuo, S. Combined use of InSAR and GLAS data to produce an accurate DEM of the Antarctic ice sheet: Example from the Breivika-Asuka station area. Polar Sci. 2010, 4, 1–17. [Google Scholar] [CrossRef] [Green Version]
  21. Zhang, X.; Xie, B.; Liu, S.; Tong, X.; Ding, R.; Xie, H.; Hong, Z. A Two-Step Block Adjustment Method for DSM Accuracy Improvement with Elevation Control of ICESat-2 Data. Remote Sens. 2022, 14, 4455. [Google Scholar] [CrossRef]
  22. Li, G.; Tang, X.; Gao, X.; Wang, H.; Wang, Y. ZY-3 Block Adjustment Supported by GLAS Laser Altimetry Data. Photogramm. Rec. 2016, 31, 88–107. [Google Scholar] [CrossRef]
  23. Zhou, P.; Tang, X.; Wang, Z.; Cao, N.; Wang, X. Vertical accuracy effect verification for satellite imagery with different GCPs. IEEE Geosci. Remote Sens. Lett. 2017, 14, 1268–1272. [Google Scholar] [CrossRef]
  24. Wang, J.; Zhang, Y.; Zhang, Z.; Li, X.; Tao, P.; Song, M. ICESat laser points assisted block adjustment for Mapping Satellite-1 stereo imagery. Acta Geod. Cartogr. Sin. 2018, 47, 359–369. [Google Scholar]
  25. Cao, N.; Zhou, P.; Wang, X.; Tang, X.; Li, G. Refined processing of laser altimeter data-aided satellite geometry model. J. Sens. 2018, 22, 599–610. [Google Scholar]
  26. Li, G.; Tang, X.; Gao, X.; Wang, X.; Fan, W.; Chen, J.; Mo, F. Integration of ZY3-02 satellite laser altimetry data and stereo images for high-accuracy mapping. Photogramm. Eng. Remote Sens. 2018, 84, 569–578. [Google Scholar] [CrossRef]
  27. Tang, X.; Xie, J.; Liu, R.; Huang, G.; Zhao, C.; Zhen, Y.; Tang, H.; Dou, X. Overview of the GF-7 laser altimeter system mission. Earth Space Sci. 2020, 7, e2019EA000777. [Google Scholar] [CrossRef]
  28. Tang, X.; Xie, J.; Mo, F.; Dou, X.; Li, X.; Li, S.; Li, S.; Huang, G.; Fu, X.; Liu, R.; et al. GF-7 dual-beam laser altimeter on-orbit geometric calibration and test verification. Acta Geod. Cartogr. Sin. 2021, 50, 384–395. [Google Scholar]
  29. Li, G.; Tang, X.; Chen, J.; Yao, J.; Liu, Z.; Gao, X.; Zuo, Z.; Zhou, X. Processing and preliminary accuracy validation of the GF-7 satellite laser altimetry data. Acta Geod. Cartogr. Sin. 2021, 50, 1–11. [Google Scholar]
  30. Lowe, D.G. Distinctive image features from scale-invariant keypoints. Int. J. Comput. Vis. 2004, 60, 91–110. [Google Scholar] [CrossRef]
  31. Zhang, J.Q.; Hu, A.W. Method and precision analysis of multi-baseline photogrammetry. Geomat. Inf. Sci. Wuhan Univ. 2007, 32, 847–851. [Google Scholar]
  32. Pan, H.B. The Research on Fine Processing of ZiYuan-3 Surveying Satellite Basic Products. Ph.D. Thesis, Wuhan University, Wuhan, China, May 2014. [Google Scholar]
  33. Tao, C.V.; Hu, Y. A comprehensive study of the rational function model for photogrammetric processing. Photogramm. Eng. Remote Sens. 2001, 67, 1347–1357. [Google Scholar]
  34. Wu, B.; Tang, S.; Zhu, Q.; Tong, K.Y.; Hu, H.; Li, G. Geometric integration of high-resolution satellite imagery and airborne LiDAR data for improved geopositioning accuracy in metropolitan areas. ISPRS J. Photogramm. Remote Sens. 2015, 109, 139–151. [Google Scholar] [CrossRef]
  35. Hirschmuller, H. Stereo Processing by Semiglobal Matching and Mutual Information. IEEE Trans. Pattern Anal. Mach. Intell. 2008, 30, 328–341. [Google Scholar] [CrossRef] [PubMed]
  36. Ye, Y.; Shan, J.; Bruzzone, L.; Shen, L. Robust Registration of Multimodal Remote Sensing Images Based on Structural Similarity. IEEE Trans. Geosci. Remote Sens. 2017, 55, 2941–2958. [Google Scholar] [CrossRef]
  37. Fan, Z.; Zhang, L.; Wang, Q.; Liu, S.; Ye, Y. A fast matching method of SAR and optical images using angular weighted orientated gradients. Acta Geod. Cartogr. Sin. 2021, 50, 1390–1403. [Google Scholar]
Figure 1. The distribution of the footprint image and the stereo image acquired simultaneously (a) and the footprint image and laser spot (b).
Remotesensing 14 05868 g001
Figure 2. Combined block adjustment workflow of laser altimetry data and stereo images of GF-7 satellite.
Remotesensing 14 05868 g002
Figure 3. The elevation control point extracting based on the footprint image. (a) Coarse-to-fine direct matching method; (b) local constrain method.
Remotesensing 14 05868 g003
Figure 4. Experiment area terrain and data distribution. (a) The distribution of experimental area, satellite images, GCPs, and laser data; (b) the approximate position of one GCP (in the red circle); (c) measurement diagram of (b).
Remotesensing 14 05868 g004
Figure 5. Residual distribution of block adjustment with different height control. (a) Without any control; (b) with all laser altimetry data as vertical control; (c) with all GCPs as vertical control; (d) with 10 GCPs as horizontal and vertical control; (e) with 10 GCPs as horizontal control and laser altimetry data as vertical control.
Remotesensing 14 05868 g005
Figure 6. Statistics of DSM elevation error before and after combined adjustment in different terrains. (ac) Elevation error map after free network adjustment in flat, hilly, and mountainous areas, respectively; (df) elevation error histograms after free network adjustment in flat, hilly, and mountainous areas, respectively; (gi) elevation error map after combined adjustment in flat, hilly, and mountainous areas, respectively; (jl) elevation error histograms after combined adjustment in flat, hilly, and mountainous areas, respectively.
Remotesensing 14 05868 g006aRemotesensing 14 05868 g006b
Figure 7. Plane and elevation accuracy changes tread. (a) Plane and elevation accuracy with GCP; (b) elevation accuracy change with GCP or satellite laser altimetry data.
Remotesensing 14 05868 g007
Table 1. Basic design parameters of stereo cameras and footprint camera.
ParameterStereo CamerasLaser Footprint Cameras
Imaging modeLinear-array PushbroomFrame
Focal length5520 mmCamera1: 2580 mm
Camera2: 2576 mm
Ground sample distanceForward panchromatic: 0.8 m
Backward panchromatic: 0.65 m
Backward multispectral: 2.6 m
3.2 m
Pixel sizePanchromatic: 7 µm
Multispectral: 28 µm
16.5 µm
Spectral rangePanchromatic: 0.45–0.9 µm
Multispectral: Blue: 0.45–0.52 µm
Green: 0.52–0.59 µm
Red: 0.63–0.69 µm
Near infrared: 0.77–0.89 µm
Visible light: 0.5–0.7 µm
Laser: 1064 nm
Swath width20 km1.6 km
Table 2. Statistics of block adjustment with laser altimetry data with different terrains in Shandong.
Adjustment SchemeTerrainsNo. of CPsX (m)Y (m)XY (m)Height (m)
RMSEMAXRMSEMAXRMSEMAXRMSEMeanMax
Free network adjustmentWhole1466.4117.714.65−11.737.9218.792.151.345.24
Plain916.3517.715.23−11.738.2218.791.951.115.21
Hill286.5314.193.44−8.547.3815.032.451.685.24
Mountain276.5214.473.54−5.427.4115.232.411.774.26
Laser altimetry as vertical controlWhole1466.5218.124.71−11.248.0519.030.750.251.59
Plain916.4718.125.21−11.248.3019.030.750.231.59
Hill286.6314.503.58−8.557.5415.230.710.271.46
Mountain276.5914.743.93−5.707.6715.410.810.331.50
All GCPs as vertical controlWhole1466.5018.104.71−11.558.0319.090.650.351.63
Plain916.4518.105.27−11.558.3319.090.590.271.53
Hill286.6014.473.52−8.677.4815.260.680.501.25
Mountain276.5814.703.68−5.587.5415.450.760.461.63
Table 3. Statistic of block adjustment with different control condition in Shandong.
SchemeNo. of GCPsMean (m)RMSE (m)MAX (m)
xyhxyxyhxyxyh
P150.96−0.891.313.911.994.392.12−9.645.119.705.24
100.19−0.291.261.741.572.342.05−5.354.446.255.21
300.19−0.000.971.351.191.801.71−5.21−3.315.225.17
600.27−0.050.791.151.141.621.443.98−3.854.095.17
120−0.000.010.440.991.051.450.80−3.98−2.904.372.79
146−0.000.030.360.931.011.380.65−3.822.804.341.64
P250.77−0.930.263.982.114.500.75−10.45.4510.511.59
100.15−0.400.261.821.612.420.75−5.894.626.511.59
300.15−0.090.261.431.191.860.75−5.81−3.415.811.60
600.26−0.140.261.151.131.610.763.98−3.704.091.59
120−0.00−0.030.260.991.061.450.76−3.91−2.914.301.61
146−0.00−0.000.260.931.011.380.76−3.752.784.271.56
P350.76−0.910.253.982.094.490.75−10.45.3810.541.59
100.15−0.390.261.811.592.410.74−5.884.536.461.60
300.16−0.070.241.421.201.860.70−5.78−3.345.781.59
600.27−0.110.211.151.131.610.653.98−3.694.081.58
120−0.01−0.020.180.991.051.440.55−3.90−2.864.301.37
146−0.010.010.150.931.021.380.51−3.752.814.281.38
Publisher’s Note: MDPI stays neutral with regard to jurisdictional claims in published maps and institutional affiliations.

