Article

Triangle Water Index (TWI): An Advanced Approach for More Accurate Detection and Delineation of Water Surfaces in Sentinel-2 Data

1
Institute of Space Science and Applied Technology, Harbin Institute of Technology (Shenzhen), Shenzhen 518055, China
2
Key Laboratory of Urban Land Resources Monitoring and Simulation, Ministry of Natural Resources, Shenzhen 518055, China
3
Remote Sensing Center for Earth System Research, Leipzig University, 04103 Leipzig, Germany
*
Author to whom correspondence should be addressed.
Remote Sens. 2022, 14(21), 5289; https://doi.org/10.3390/rs14215289
Submission received: 24 September 2022 / Revised: 18 October 2022 / Accepted: 20 October 2022 / Published: 22 October 2022
(This article belongs to the Special Issue Advances of Remote Sensing and GIS Technology in Surface Water Bodies)

Abstract

:
One of the most basic classification tasks in remote sensing is to distinguish between water bodies and other surface types. Although there are numerous techniques for extracting surface water from satellite imagery, there is still a need for research to more accurately identify water bodies with a view to efficient water maintenance in the future. Delineation accuracy is limited by varying amounts of suspended matter and different background land covers, especially those with low albedo. Therefore, the objective of this study was to develop an advanced index that improves the accuracy of extracting water bodies characterized by varying amounts of water constituents, especially in mountainous regions with highly rugged terrain, urban areas with cast shadows, and snow- and ice-covered areas. In this context, we propose a triangle water index (TWI) based on Sentinel-2 data. The principle of the TWI is that it first analyzes the reflectance values of water bodies in different wavelength bands to determine specific types. Then, triangles are constructed in a cartesian coordinate system according to the reflectance values of different water bodies in the respective wavelength bands. Finally, the TWI is achieved by using the triangle similarity theorem. We tested the accuracy and robustness of the TWI method using Sentinel-2 data of several water bodies in Mongolia, Canada, Sweden, the United States, and China and determined kappa coefficients and the overall precision. The performance of the classifier was compared with methods such as the normalized difference water index (NDWI), the modified normalized difference water index (MNDWI), the enhanced water index (EWI), the automated water extraction index (AWEI), and the land surface water index (LSWI). The classification accuracy of the TWI for all test sites is significantly higher than that of these indices that are commonly used classification methods. The overall precision of the TWI ranges between 95% and 97%. Moreover, the TWI is also effective in extracting flooded areas. Hence, the TWI can automatically extract different water bodies from Sentinel-2 data with high accuracy, which provides also a favorable analysis method for the study of droughts and flood disasters and for the general maintenance of water bodies in the future.

Graphical Abstract

1. Introduction

In recent years, flood events and natural disasters have been increasing due to the Earth’s considerable climatic and environmental changes [1,2]. These disasters cause human casualties, property damage, and economic loss [3,4]. Especially, water bodies have a significant impact on the climate [5], and therefore medium- to high-resolution remote sensing images provide an excellent database for regular monitoring and detailed extraction and analysis with very high accuracy. Presently, there are several methods of extracting water bodies available, from manual evaluation to automatic extraction methods, predominantly based on optical remote sensing data [6,7,8]. Manual classification methods using satellite images are reliant on visual interpreters, and thus the mapping results of surface waters are influenced by deviations in the results of the respective individuals and are very time consuming [9]. Several automatic methods currently used for surface water extraction can solve the problems of low efficiency and high cost [2,10,11]. These methods use one or a combination of techniques to identify water bodies in remote sensing images, including single-band thresholding, linear unmixing, two-band spectral water indices, and thematic approaches [12,13]. Classification methods can be divided into two categories, namely, those based on spectral and spatial characteristics of images, and thematic approaches based on image pixel characteristics.
Classification methods based on spectral and spatial characteristics are mainly applied to extract water in high-resolution remote sensing images. Typical methods applied include decision trees (DTs) [14,15], maximum likelihood classifiers (MLCs) [16], and statistical pattern recognition techniques [17]. Moreover, various machine learning algorithms have been applied to extract water bodies and shorelines from remote sensing images such as neural networks (NNs) [18], convolutional neural networks (CNNs) [19], artificial neural networks (ANNs) [11,20,21], support vector machines (SVMs) [22,23,24], naive Bayes (NB), random forest (RF) [25], gradient boosted machine (GBM), recursive partitioning and regression trees (RPARTs), and constraint energy minimizations (CEMs) [26,27,28]. Although these methods may, under certain conditions, attain higher accuracies than the spectral indices methods, there are disadvantages in choosing high-quality training samples, namely, the complexity of the respective algorithms, the requirement of up-to-date referenced data, and the need for varying expert knowledge, which limit the applicability of these methods to larger areas [4,12,29].
The second group of methods, based on thematic classifications, rests upon image pixel characteristics and is usually used to classify water bodies at medium- to low-resolution images, which is easy and effective. These methods are currently widely improving and are used because of their simple operation, relatively high mapping accuracy, and low computational expense [30]. Many high-quality articles propose different water body indices for the mapping of surface waters. McFeeters et al. [31] proposed the first water body index called the NDWI with a default threshold of 0 that utilizes the reflectance differences between water and vegetation in the visible red and near-infrared bands (VNIRs). However, the NDWI is somewhat limited in distinguishing buildings and soils from water bodies. To suppress the signals of city buildings, Xu et al. [32] replaced the NIR band with the shortwave infrared (SWIR) band in the NDWI formulation, creating the MNDWI. Although the MNDWI produces results of higher accuracies, it is still limited in recognizing semi-dry river channels in deeply shadowed areas. Therefore, Wang proposed the EWI, which could provide a practical solution for confusing semi-dry river channels and background noise in a water system [33]. Feyisa et al. proposed the AWEI, which tends to be more effective in different environments [34]. AWEI aims to effectively eliminate shadow pixels and improve the accuracy of water extraction in tailed areas or the vicinity of low reflecting surfaces. All water body index methods achieved good results delineating water features and faced the challenges of water body extraction in non-water dark surface regions [35].
Although the described water body index methods have improved over the years, still greater efforts in detailed water extraction should be made to maintain our water resources adequately in the future [36]. The extraction of water bodies using the above-mentioned indices still shows some disadvantages when dealing with waters containing high amounts of phytoplankton and/or suspended matter, waters in rough terrain with incident shadows, smaller water bodies located at high altitudes, and when the background of the targeted area is complex [37]. Further, extraction accuracy is still somewhat limited, especially for Sentinel-2 data, in separating water bodies from ice, snow, and shadows. This paper introduces a multiple-band index called the triangular water index (TWI) to improve these constraints, based on the unique vegetation-red-edge band and the water vapor band recorded by the Sentinel-2A/B MSIs [38]. The main objectives of this study are as follows: (a) To accurately detect and delineate water surfaces from Sentinel-2 data by automatically suppressing classification noise from the environment when the background land is covered by snow and ice or by shadows from mountains, buildings, and clouds; and (b) to examine the robustness of the new water body index (TWI) under different environmental conditions and assess its relative accuracy in comparison to existing water body indices. The results of this study also provide insights into the utilization of Sentinel-2 images in flood mapping based on automatic thresholding methods.

2. Study Areas

The accuracy and robustness of the TWI were tested considering several lakes and other water bodies in different environmental conditions. The test sites chosen are located in five different countries, Mongolia, Canada, Sweden, the United States, and China. All test sites are characterized by complex surface features, such as rough surfaces with cast shadows, built-up areas, snow, and dark surfaces as background to the water bodies. A summary of the basic characteristics of the test sites is shown in Table 1.
We selected numerous sub-scenarios with diverse types of water and non-water features and with high complexity. The test site in Mongolia shows plants on the surface of the water bodies. The test site in Canada is predominantly located on a mountain slope and in a high-altitude area primarily marked by snow and shadows. The United States site is characterized by complex backgrounds including farmland, bare land, and buildings but excluding extensive urban shadowing. The test sites in China include two aspects of important characteristics. Some sites show water containing suspended matter, salt, and ice, while other sites include rivers within cities and shadowed areas caused by high-rise buildings. In addition, three further sub-scenes were selected from Canada, China, and the United States to compare the results of the six chosen water index methods, which further verify the robustness of the newly developed TWI index.

3. Materials and Methods

3.1. Sentinel-2 Data

Sentinel-2A/B are two identically constructed satellites of the European Space Agency (ESA) carrying wide range high resolution multispectral imagers with a global revisit frequency of just five days. The identical sensors (MSIs) aboard the satellites record the Earth’s surface by the use of 13 spectral bands in the VNIR to SWIR range at different spatial resolutions (Table 2). In our study, we relied on data from the Sentinel-2A satellite only, processed to level 2A, which includes orthorectification and atmospheric correction. All bands were resampled to derive a spatial resolution of 10 m GSD. The original spectral band passes and band widths of Sentinel-2A data and their main utility are given in Table 2.
To meet the requirements of the improved extraction of waterbodies under various environmental conditions, we randomly selected Sentinel-2A images in different parts of the world. Thereby, the selection of images to be analyzed is based on a high diversity of water bodies with different amounts of features, varying topographies and shade in rural and city regions, and on their seasonal characteristics. Therefore, we chose images of sites in several countries at different seasons to extract water bodies. The test image of Qinghai Lake taken in autumn includes some snow, while the site in the East China Sea is turbid and carries sediments. The Huangpu River crosses a city and is surrounded by shady buildings. The Yangtze River has turbid water carrying high amounts of algae and sediments, and the chosen site is marked by drop shadows of buildings. The site in Sweden was recorded in the winter time, so the surface was covered by ice and snow. The selected sites in Canada and the United States include complex land surfaces at low altitudes. In contrast, the selected Mongolia site is located at high altitude in a mountainous region with strongly rugged terrain.
For processing, the Google Earth Engine (GEE) platform was used to extract water bodies of the Sentinel-2 images in this study [39]. Fine cirrus clouds in the test sites were removed using the cloud processing method of the GEE. For the precision evaluation, we used Google Earth images of the GEE platform as reference images. A detailed description of the utilized Sentinel-2 data and the corresponding reference images is shown in Table 3.

3.2. MNDWI

When using the NDWI to enhance water body features, the built-up land noise can be easily confused with the signal of water bodies. Water bodies extracted by NDWI are thus overestimated [32]. Xu et al. (2007) found that the reflectance of buildings is strongly enhanced from the NIR band to the SWIR band. For this reason, the SWIR band is used instead of the NIR band in the MNDWI. The MNDWI enhances open water bodies, and buildings can be effectively separated. The formula is as follows:
MNDWI = B Green B SWIR 3 B Green + B SWIR 3
where BGreen denotes the reflectance of the green band that corresponds with Band 3 (B3) of Sentinel-2, and BSWIR3 indicates the reflectance of the SWIR3 band, which corresponds to Band 12 (B12) of Sentinel-2.

3.3. Analysis of the Spectral Response Characteristics of Water Bodies

A water body index is usually a mathematical combination of several spectral features that enhance the contrast between water and non-water pixels [34,40]. Each trait of different land cover types on the Sentinel-2 imagery has obvious separability [41]. Because water bodies on Sentinel-2 data also have their distinct spectral characteristics, the spectral feature analysis of water is a prerequisite for establishing an optimal feature combination and thereby for obtaining an effective water body index [42].
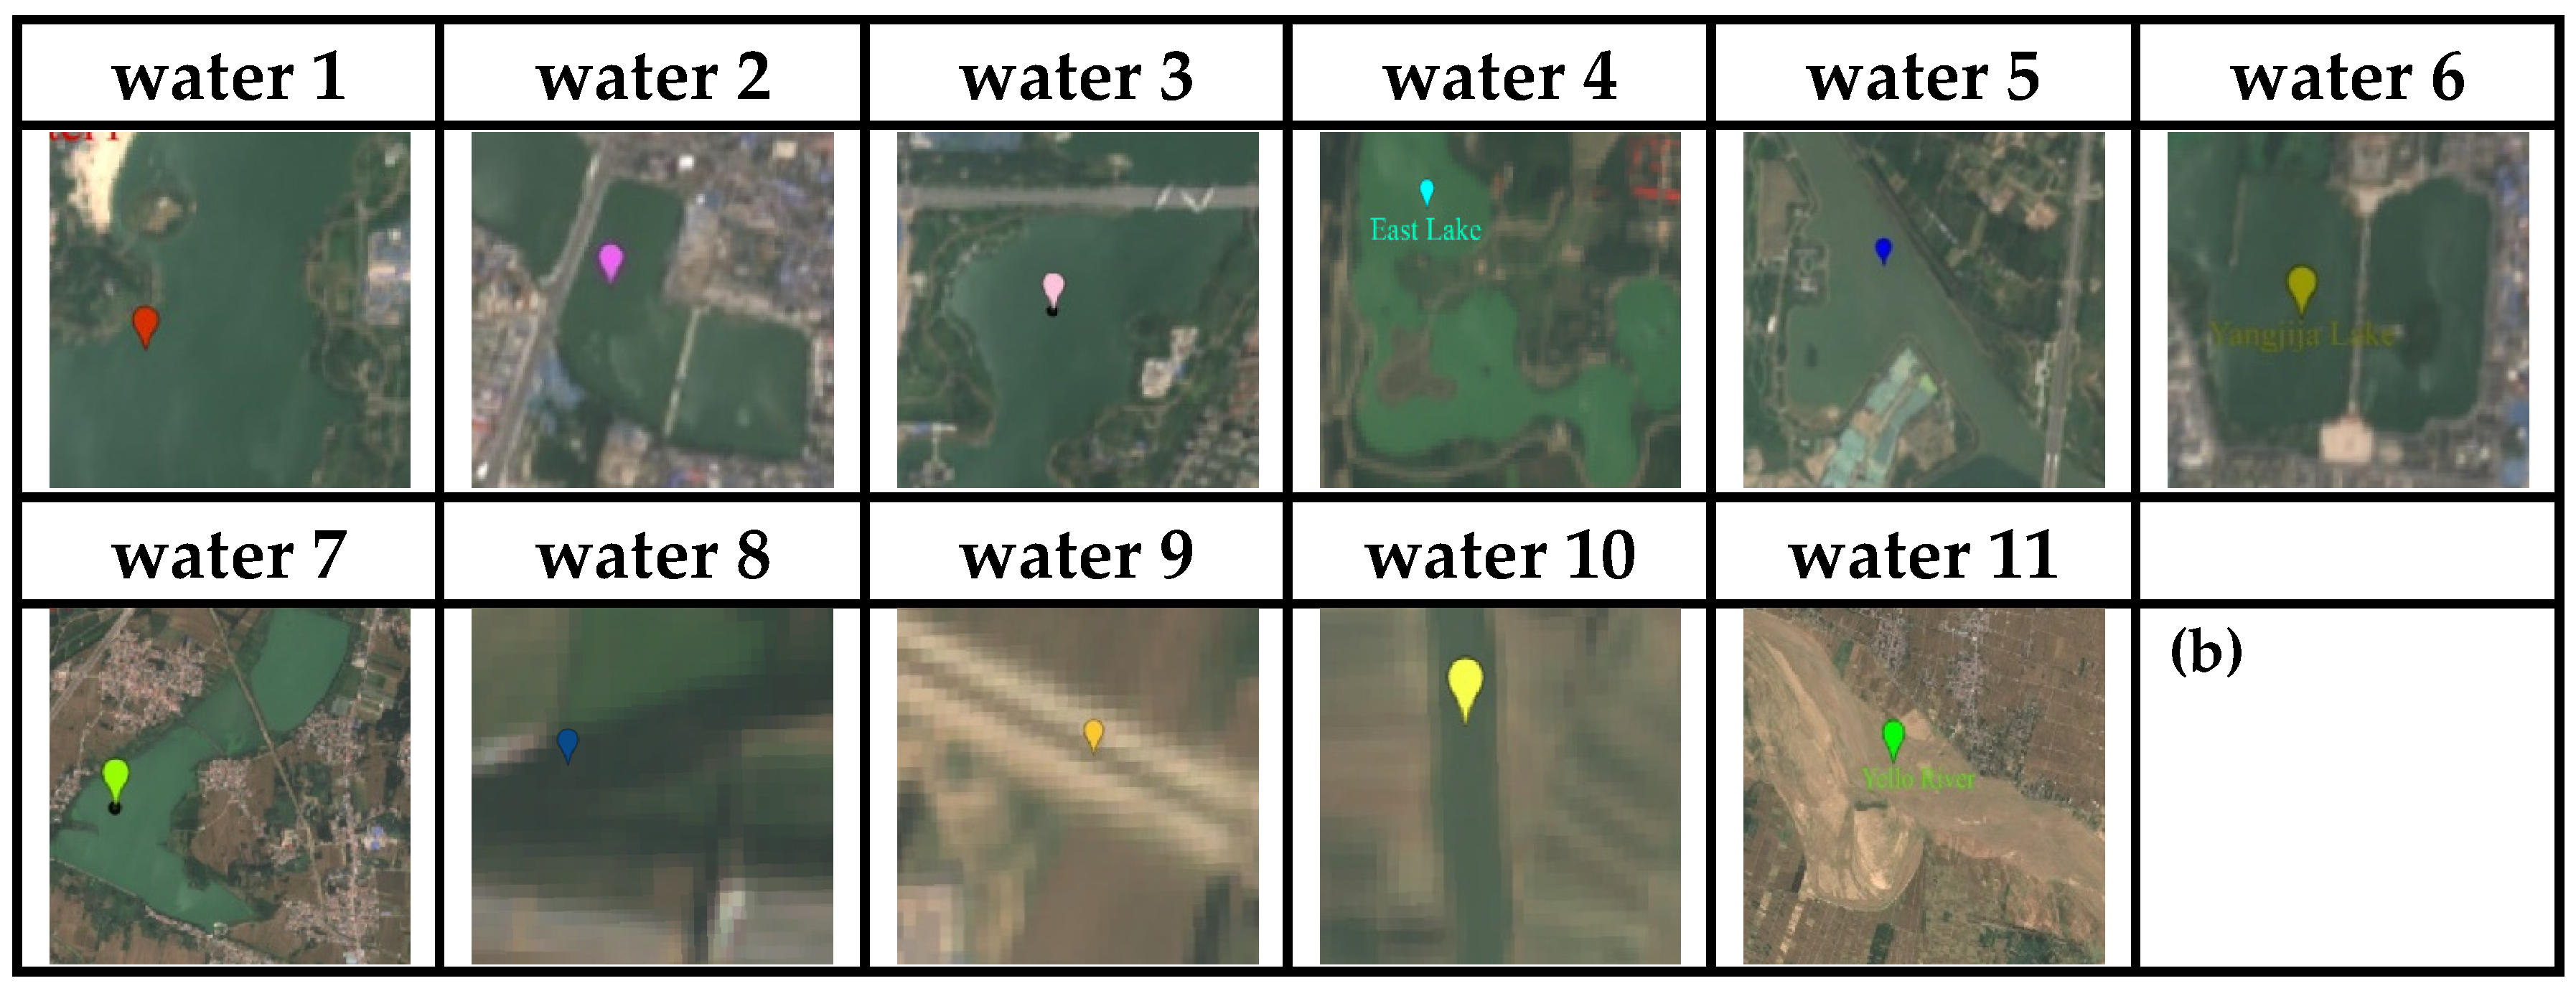
To develop the water index, only the spectral reflectance characteristics of water bodies are considered, while the spectral information of all other ground features is neglected [43]. We selected water samples at different locations and recorded at different times with varying properties such as water covered by snow and ice, saline, freshwater, as well as clear and turbid waters. Moreover, we chose samples in locations with different topographies and backgrounds to further evaluate the influence of drop shadows and low reflecting targets on the performance of the TWI. All Sentinel-2 images were orthorectified and processed for bottom of atmosphere reflectance (BoA) [44]. The reflectance values were used to inspect patterns of water bodies, aiming to design a method that accurately discriminates between water and other surface types. Therefore, a variety of water body samples with different sizes and properties was selected from a Sentinel-2 image of Xinxiang city Henan Province, China, acquired on 30 December 2020, including large and small rivers, lakes, and reservoirs (Figure 1).
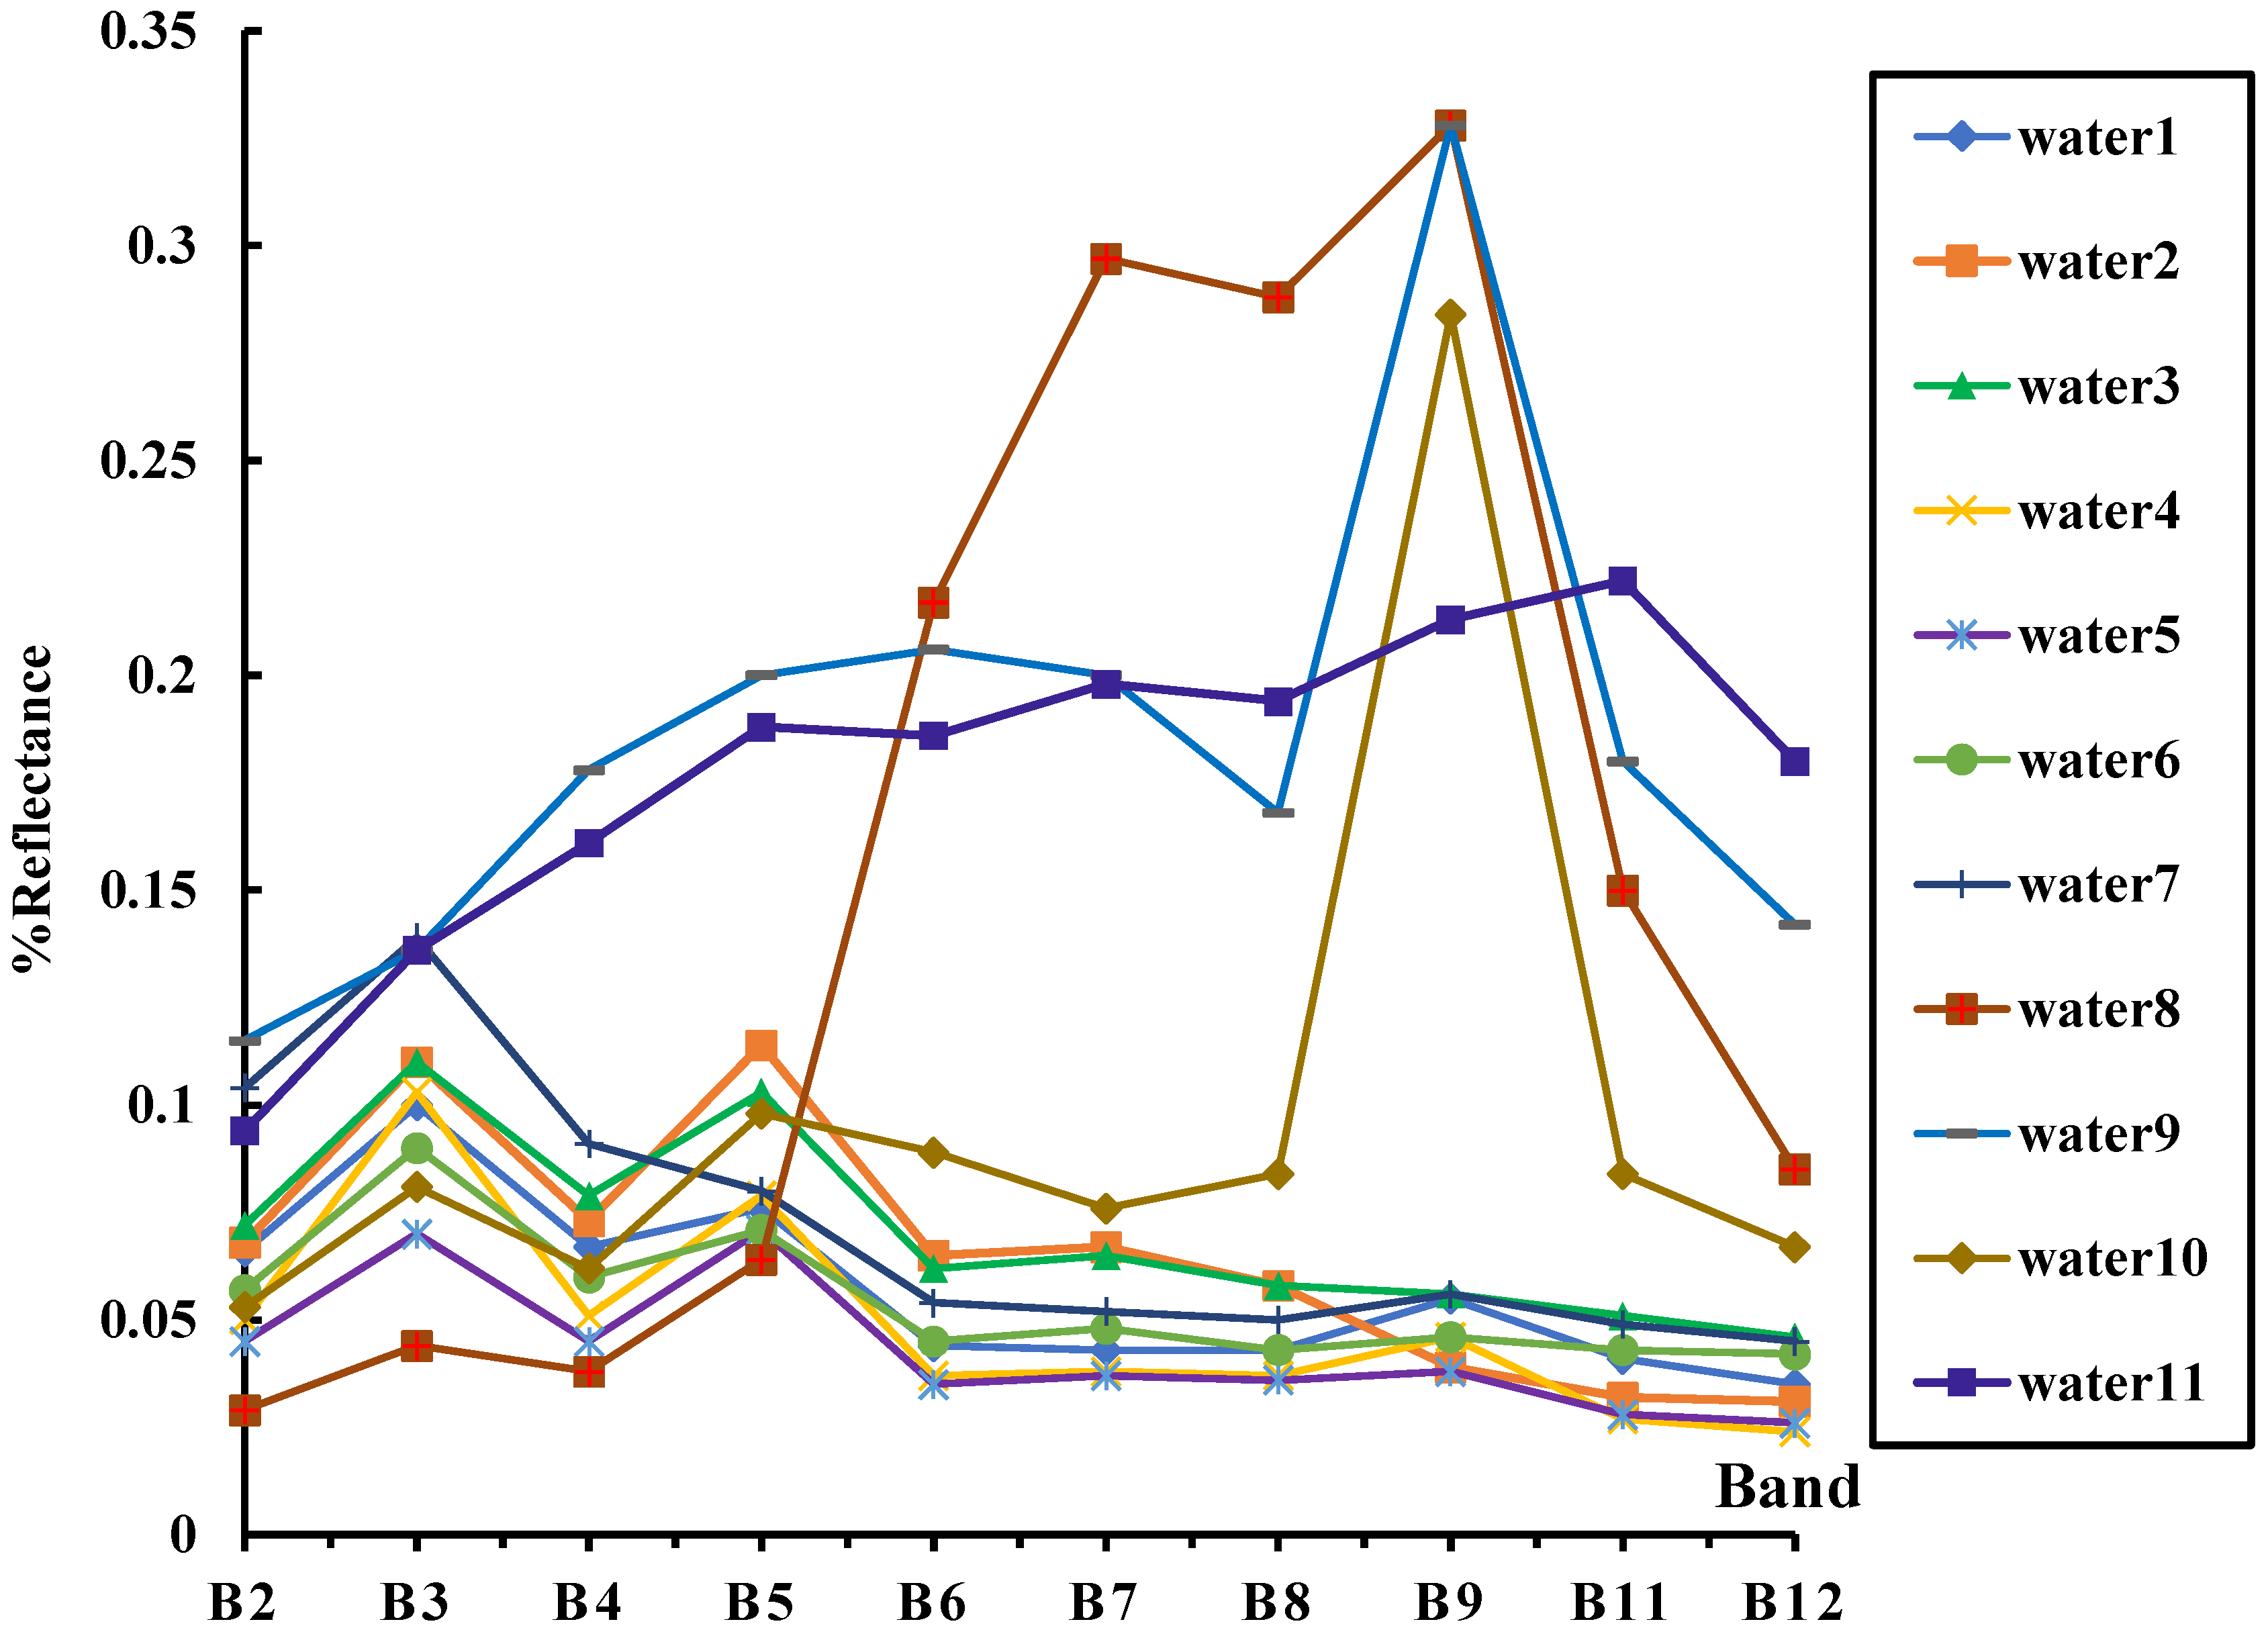
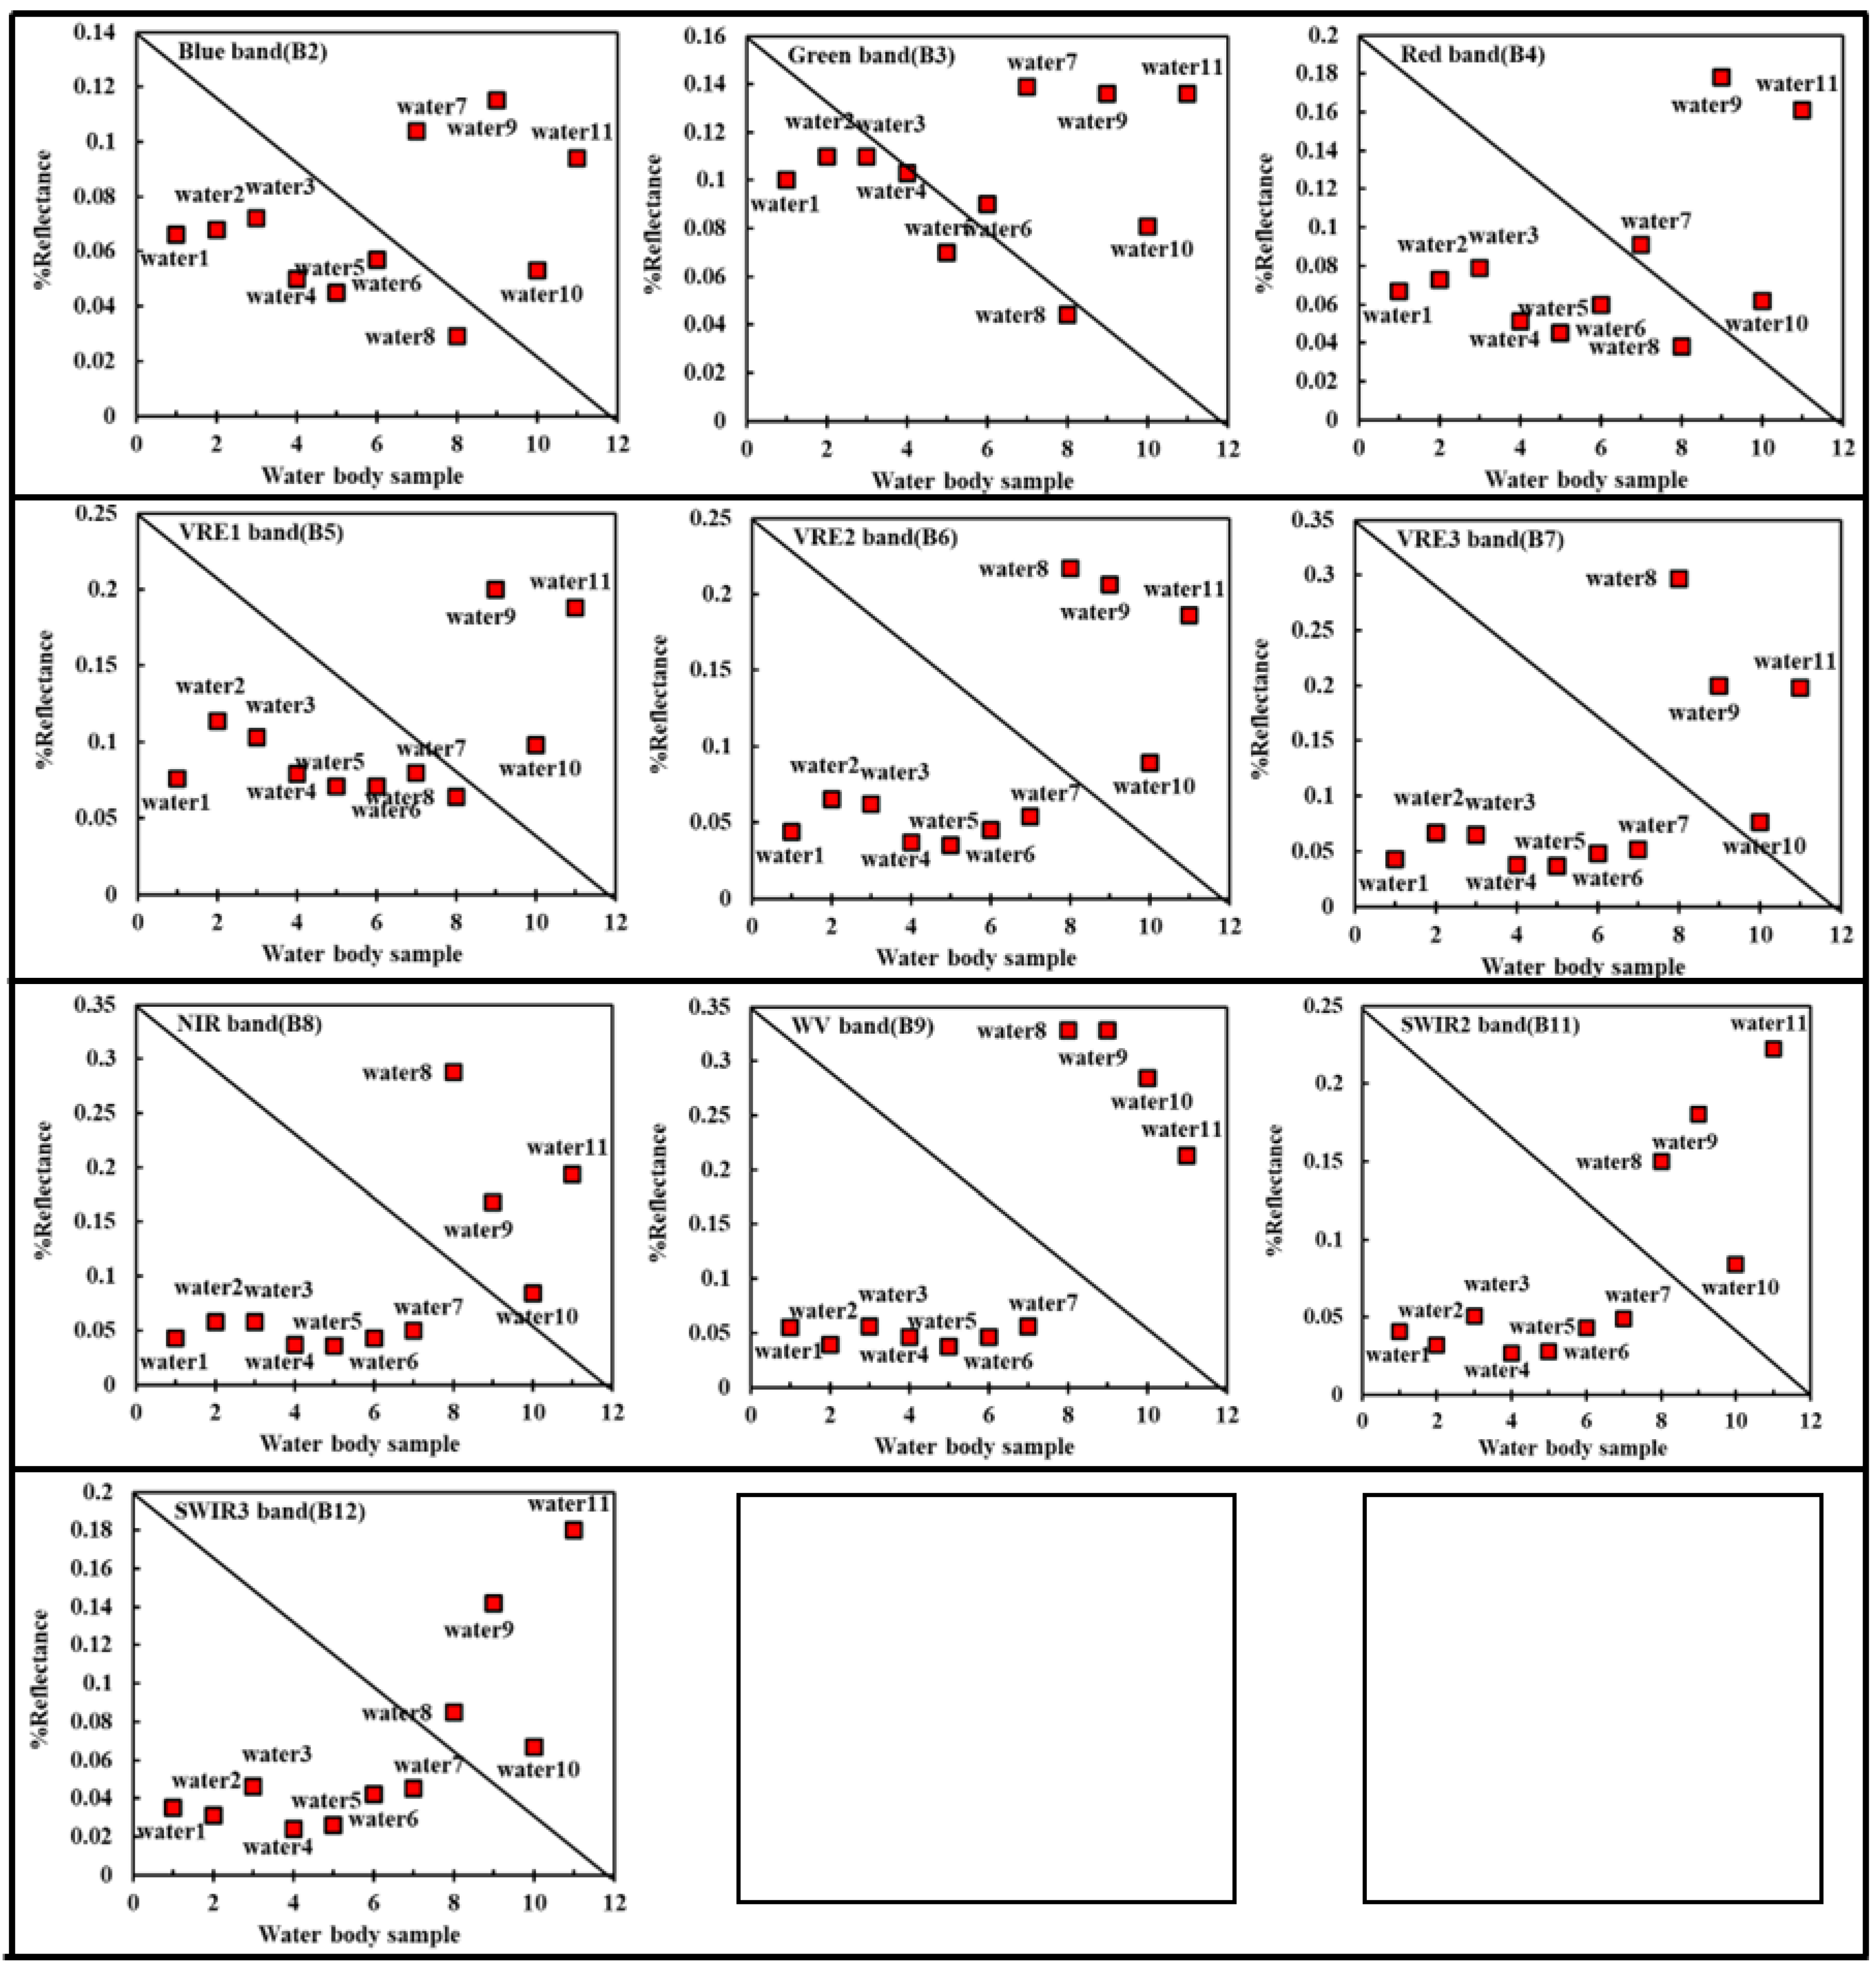
The reflectance values of all Sentinel−2 bands of the marked water body samples (Figure 1) are depicted in Figure 2 and Figure 3, apart from bands 1, 8A, and 10. Band 1 was placed to monitor coastal aerosols and record data at a 60 m GSD only [45]. Due to its smaller bandwidths, B8A provides somewhat more detail of the mesophyll peak than the corresponding band B8, but it is largely redundant for water applications. B10 is defined for the detection of cirrus clouds and therefore is centered outside of atmospheric windows with strong absorptions of water vapor [45]. For these reasons B1, B8A, and B12 were excluded from the TWI construction.
Figure 2 and Figure 3 indicate that the reflectance values of the different water bodies in each waveband were somewhat similar in their entirety, but they also showed certain different characteristics. Both separated largely two groups of water bodies with different spectral behaviors due to their varying constituents. One group comprised sample numbers 1 to 7, while another group included sample numbers 8 to 11. The reflectance values of samples 1 to 7 had major inflection point values in B3, B4, B5, and B6 and showed relatively stable and uniform behavior across the entire wavelength range (Figure 2). Furthermore, the spectra of this group illustrated that reflectance values of the water bodies were quite low and sensitive to noise. Water samples 8 to 11 depicted inflection points in B3, B8, and B9, and they showed low values in B2 and B12 and a high spectral volatility trend.
Thus, the two different groups of water bodies represented waters with different features in varying amounts. Group I, comprising waters 1–7, showed varying contents of phytopigments indicated by small peaks in band 3 and 5 covering the green and NIR wavelengths ranges (Figure 2). Waters 2 and 7 depicted the highest amounts of pigments, and water 5 the lowest. The entire spectral waveform did not point to floating sediments. Waters 8 and 10 of the second water group exhibited quite a large amount of suspended matter (phytoplankton and sediment load), while the spectra of samples 9 and 11 pointed to high sediment loads only (Figure 2). The peaks in band 9 could be attributed to the high content of water vapor. From now on, water bodies belonging to the first group (water samples 1–7) are named type I water bodies, and those waters of the second group (water samples 8–11) are named type II water bodies. Overall, both groups of waters thus, contain the most representative components for creating an index.

3.4. Formulation of the Triangle Water Index (TWI)

First, all bands were grouped according to the above described reflectance characteristics into type I and type II water bodies. Then, the grouped bands were used to construct two different triangles based on the respective reflectance values in a rectangular coordinate system.
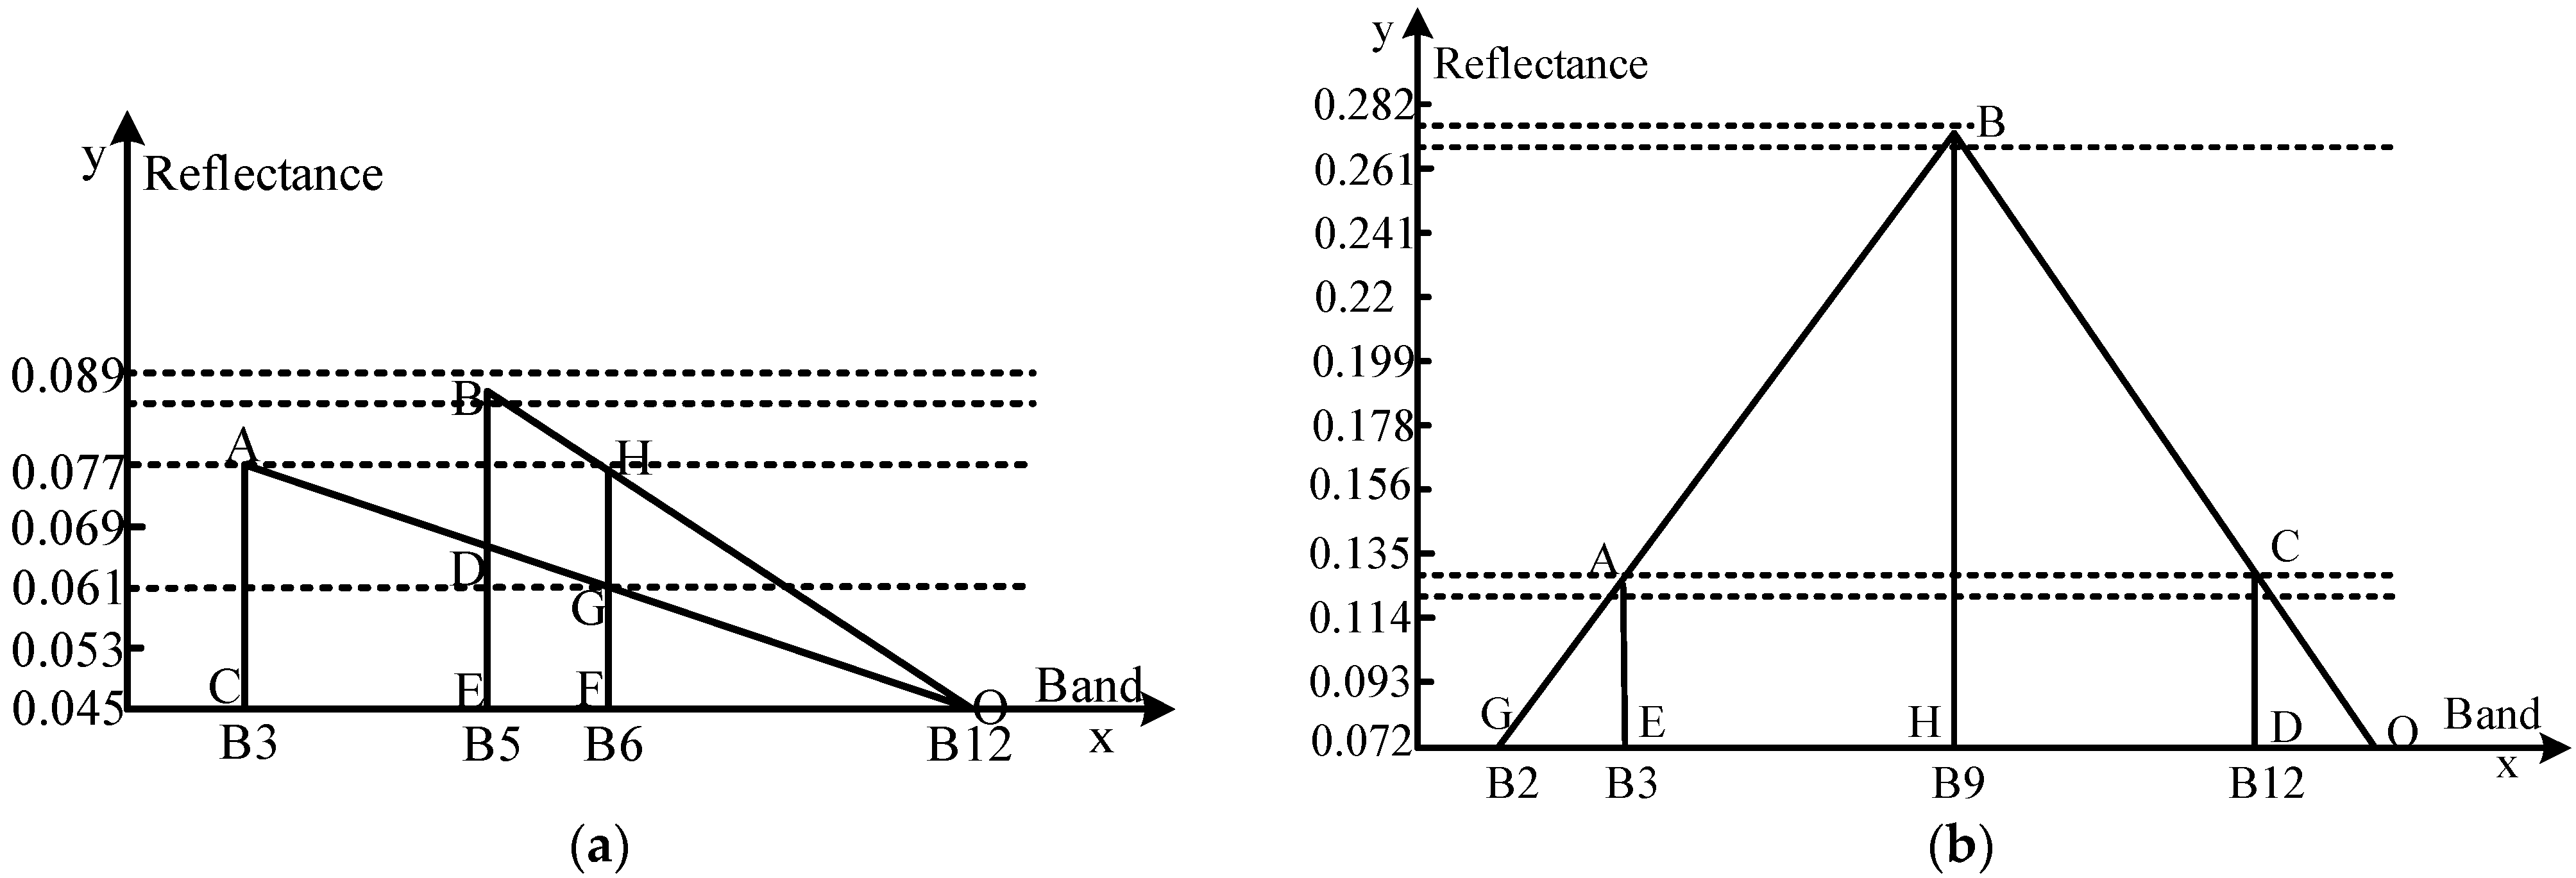
In Figure 2 and Figure 3, reflectance values of the type I water bodies show the highest mean values in B3 and B5 and the lowest mean values in B6 and B12. The lowest values of reflectance of the type I water bodies are shown by B12. Consequently, the triangle constructed for the type I water bodies uses the values of B3, B5, B6, and B12 in a cartesian coordinate system (Figure 4a). The reflectance values of the type II water bodies exhibit a strong increasing trend from B8 to B9 and a slightly increasing trend from B2 to B3. The values further exhibit a decreasing trend from B9 to B12. The highest reflectance values in this group are shown in B9. Based on these characteristic trends, the triangle for the type II water bodies was created based on B2, B3, B8, B9, and B12 in a cartesian coordinate system (Figure 4b). This way, the detection of different waterbodies could be transformed into a mathematical formulation, and an index could be established.
The initial water index method was first established based on triangles (Figure 4) of the two types of water bodies. Then, the water indices of the two types of water bodies were calculated separately using the triangle similarity theorem [46]. Finally, the two indices were summed up to obtain the final water index for Sentinel-2A data, namely, the triangular water index (TWI). The detailed calculation process is as follows:
The spectral characteristics of the type I water bodies conformed to the MNDWI method. Therefore, the water index of the type I water bodies (TWI1) was established based on the MNDWI. However, the MNDWI is constrained by accuracy problems with discriminating water from non-water surfaces. The paper therefore proposed a TWI1, where the MNDWI was modified by replacing the (B3–B12) of the Sentinel-2A data [32]. Thus, the TWI1 used B5 and B6 data to replace B3 and B12. According to this judgment theorem, there are ΔACO≌ΔDEO, ΔBEO≌ΔHFO in Figure 4a. The similarity theorem of similar triangles has the property that the corresponding sides of similar triangles are proportional. Therefore, Equation (2) can be obtained from the ΔACO and ΔDEO in Figure 4a. Equation (3) can be obtained from the ΔBEO and ΔHFO in Figure 4a. According to the calculation principle of geometry in mathematics, Equation (4) is given in the ΔBEO and ΔHFO in Figure 4a:
( B 12 B 3 ) ( B 12 B 5 ) = | A C | | D E |
( B 12 B 6 ) ( B 12 B 5 ) = | H F | | B E |
B 6 B 5 = ( B 12 B 5 ) ( B 12 B 6 )
Equation (5) is given by deriving Equation (2):
B 12 B 5 = ( | D E | | A C | ) × ( B 12 B 3 )
Substituting Equation (5) into Equation (3) results in:
B 12 B 6 = | H F | | B E | × | D E | | A C | × ( B 12 B 3 )
By substituting Equations (5) and (6) into Equation (3) by replacing the (B12–B6) and (B12–B5) of Equation (3), then (B3–B12) is substituted by (B5–B6). The relation between (B3–B12) and (B5–B6) is given as:
B 3 B 12 = | A C | | D E | × | B E | | B E | | H F | × ( B 5 B 6 )
Thereby, the TWI1 is set by Equation (8).
T W I 1 = | A C | | D E | × ( | B E | | B E | | H F | ) × ( B 5 B 6 ) ( B 3 + B 12 )
To calculate the TWI2 for type Ⅱ water bodies, B8 and B9 were used. There are medium strong absorptions depicted in B8, while B9 is characterized by high reflectance [13]. Hence, B8 and B9 of Sentinel-2A data were used to develop the type Ⅱ water body index (TWI2) by increasing the difference between water and low reflecting land surfaces. The calculation for the initial water index of the TWI2 was realized by a mathematical operation and applying different coefficients. Accordingly, the equation of TWI2 was proposed to effectively suppress non-water pixels and extract surface water with improved accuracy (Equation (9)):
T W I 2 = B 9 B 8 B 9 + B 8
However, the results were not stable because B9 is located in a wavelength region dominated by water vapor. Therefore, B9 needs to be replaced using the mathematical geometric operation principles similarity. According to the calculation principle of geometry in mathematics, Equation (10) is given in ΔBGH of Figure 4b:
B 9 B 8 = ( B 9 B 2 ) ( B 8 B 2 )
The similarity theorem of similar triangles implies that corresponding sides of similar triangles are proportional. Therefore, Equations (11) and (12) can be obtained from the ΔAEG≌ΔBHG and ΔOHB≌ΔODC in Figure 4b:
| A E | | B H | = B 3 B 2 B 9 B 2
| C D | | B H | = | O D | | O H |
Equation (13) is deduced from Equations (11) and (12):
B 9 B 2 = ( | B H | | C D | ) × ( | C D | | A E | ) × ( B 3 B 2 )
By changing the form of Equation (13), the B9 of Equation (13) is given as:
B 9 = ( | B H | | A E | ) × ( B 3 ) + ( 1 | B H | | A E | ) × ( B 2 )
Next, the (B9–B2) of Equation (10) is replaced with Equation (13). The expression of (B9–B8) is changed to Equation (15):
( B 9 B 8 ) = ( | B H | | C D | ) × ( | C D | | A E | ) × ( B 3 B 2 ) ( B 8 B 2 )
Finally, the TWI2 can be derived by substituting Equations (14) and (15) into Equation (9) and is calculated as follows:
T W I 2 = ( ( | B H | | A E | ) × ( B 3 B 2 ) ( B 8 B 2 ) ) ( B 8 + | B H | | A E | × B 3 + ( 1 | B H | | A E | ) × ( B 2 ) )
The indices of the two types of water bodies were obtained according to the above calculation processes. In general, a water body presents an area based on its distribution shape. Thereby, the sum of all water bodies of our Sentinel-2 images was treated as a set (here set A) according to the concept of sets. Type I and II water bodies were assigned as sets B and C, respectively. According to the addition principle for sets, A equals B + C. Thereby, the water body index (TWI) of all water bodies on Sentinel-2A images was added by TWI1 of Type I water bodies and TWI2 of Type II water bodies. When summing up the TWI1 and TWI2, the final total triangular water body index (TWI) was derived:
T W I = ( T W I 1 + T W I 2 ) = | A C | | D E | × ( | B E | | B E | | H F | ) × ( B 5 B 6 ) ( B 3 + B 12 ) + ( ( | B H | | A E | ) × ( B 3 B 2 ) ( B 8 B 2 ) ) ( B 8 + | B H | | A E | × B 3 + ( 1 | B H | | A E | ) × B 2 )
where both |DE| and |BE| correspond to B5 of Sentinel-2A data in Figure 4a. Values of |DE| and |BE| are length values of line segments DE and BE of Figure 4a. |HF| and |AC| indicate average values of the difference between the maximum and minimum reflectance value for waters 1–7 in B6 and B3. The sizes of |AE| and |BH| are averaged values of the difference between the respective maximum and the minimum reflectance values for waters 8–11 in B3 and B9. An iterative process was applied to identify parameters that maximize the separability of water and non-water surfaces characterized by low reflectance. In the final index, the coefficients were rounded for ease of use, which were, respectively, | A C | | D E | × ( | B E | | B E | | H F | ) 2.84 and ( | B H | | A E | ) 1.25 . Thus, the TWI was lastly defined as follows:
T W I = 2.84 × ( B 5 B 6 ) ( B 3 + B 12 ) + ( 1.25 × ( B 3 B 2 ) ( B 8 B 2 ) ) ( B 8 + 1.25 × B 3 0.25 × B 2 )

3.5. The Otsu Automatic Threshold

The water body index needs optimal thresholds for demarcating the water coverage area from the remaining land. These can be automatically calculated by the Otsu threshold algorithm [47]. The Otsu algorithm is known as one of the most effective threshold methods [48]. It is further considered to be the better algorithm for threshold selection in image segmentation because it is simple to calculate and is not affected by image brightness and contrast. The calculation principle of the Otsu algorithm is to divide images into background and foreground regions according to the grayscale characteristics of the image. Because the variance is a measure of the gray distribution uniformity, the greater the inter-class variance between the background and the foreground, the greater the difference between the two parts of the image. When a part of the foreground is mistakenly classified as the background or vice versa, the difference between the two parts will become smaller. Therefore, when the interclass variance (σ2) is largest, the probability of misclassification is the smallest. The maximum value threshold of σ2 is the best threshold T in the study area. In the process of water body extraction, a water body W is detected by the T and extracted according to the following rules.
W = { 1 i > T 0 i < T
where i represents the gray level. W = 1 is a water body, and W = 0 denotes non-water.
This method does not require artificial parameter settings while it automatically selects thresholds to derive better results. It applies not only to single-valued threshold selections for two regions but also to multi-region, multi-threshold selections.

3.6. Accuracy Assessment

There were 1581 sampling points were collected based on different types of water bodies selected for accurate assessment by the stratified random sampling method. More sampling points were included for smaller water bodies (e.g., lakes, rivers) and for areas that interfered with the extraction of water bodies (e.g., snow and shadows). The classification of sample points was based on currently available data. Each point was evaluated and labeled using Google Earth images and maps. Accuracy estimation is a process that validates the extracted submerged and non-submerged areas based on independent validation datasets. There are about a few hundred verification points on each image based on a simple random sampling method. The classification accuracy was evaluated by the use of confusion matrices. Confusion matrices are also known as error matrices. Each row of the matrix represents the instance in the actual class, while each column represents the instance in the prediction class [49]. Concerning the extraction of water bodies, each row of the matrix represents the water body and non-water body of the land surface, while each column of the matrix represents the predicted water body and non-water body. The kappa coefficients and the overall precision were calculated based on confusion matrices. The kappa coefficient is a measure of accuracy. It is the ratio of agreement between classified images and reference data [50,51]. The overall accuracy shows the percentage of validated pixels that are correctly classified [52]. The kappa is given as follows:
K a p = P 0 P e 1 P e
P e = 1 M 2 k m k 1 m k 2
where P0 and Pe denote the relative observed agreement and the hypothetical probability of chance agreement, respectively, M is the number of samples, and mki is the number of times rater i predicts category Kap.
Four test sites were selected to compare the accuracies of the TWI and other methods by confusion matrices. Other methods referred to six commonly used water body indices, namely, LSWI, MNDWI, NDWI, AWEI, and EWI. This paper compared the accuracy of the TWI in comparison to other methods at the optimal threshold for each method.

4. Results and Discussion

The new TWI was constructed to more precisely extract water bodies from Sentinel-2 data, especially in rough mountainous areas or near buildings with their associated shadows and to eliminate non-water pixels. To prove its capability, it was applied and tested at different sites in several countries.

4.1. Water Extraction Maps

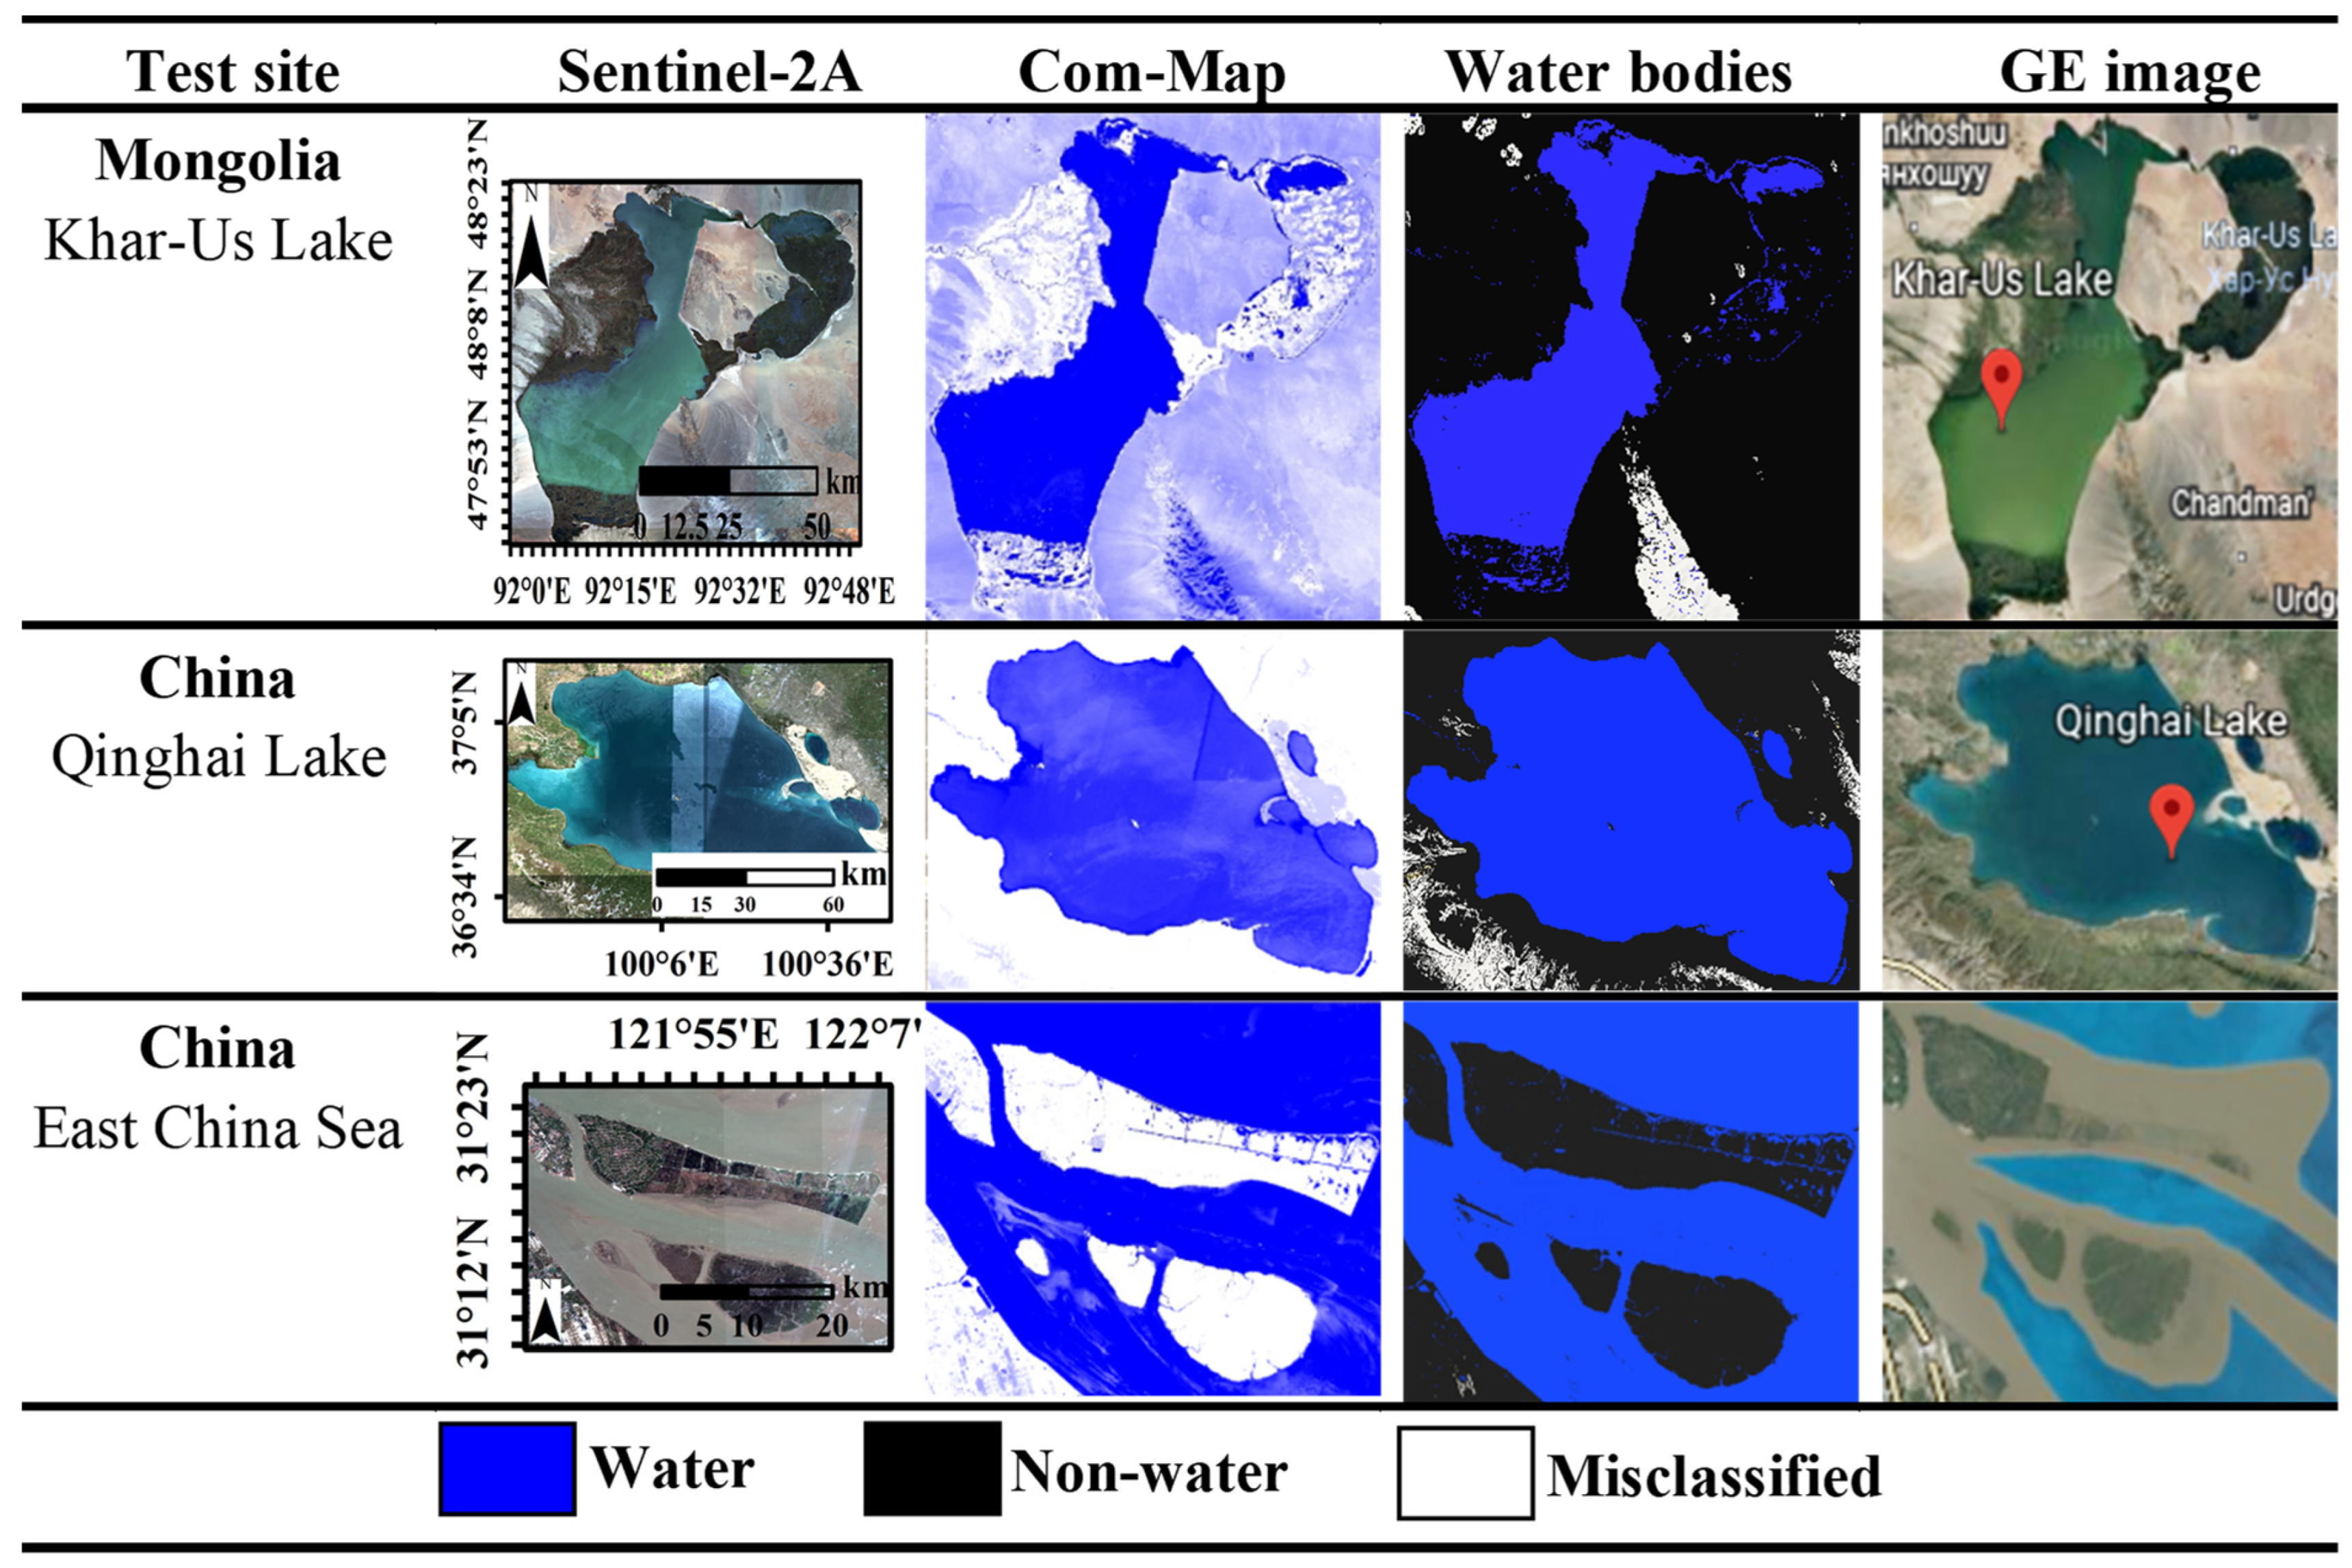
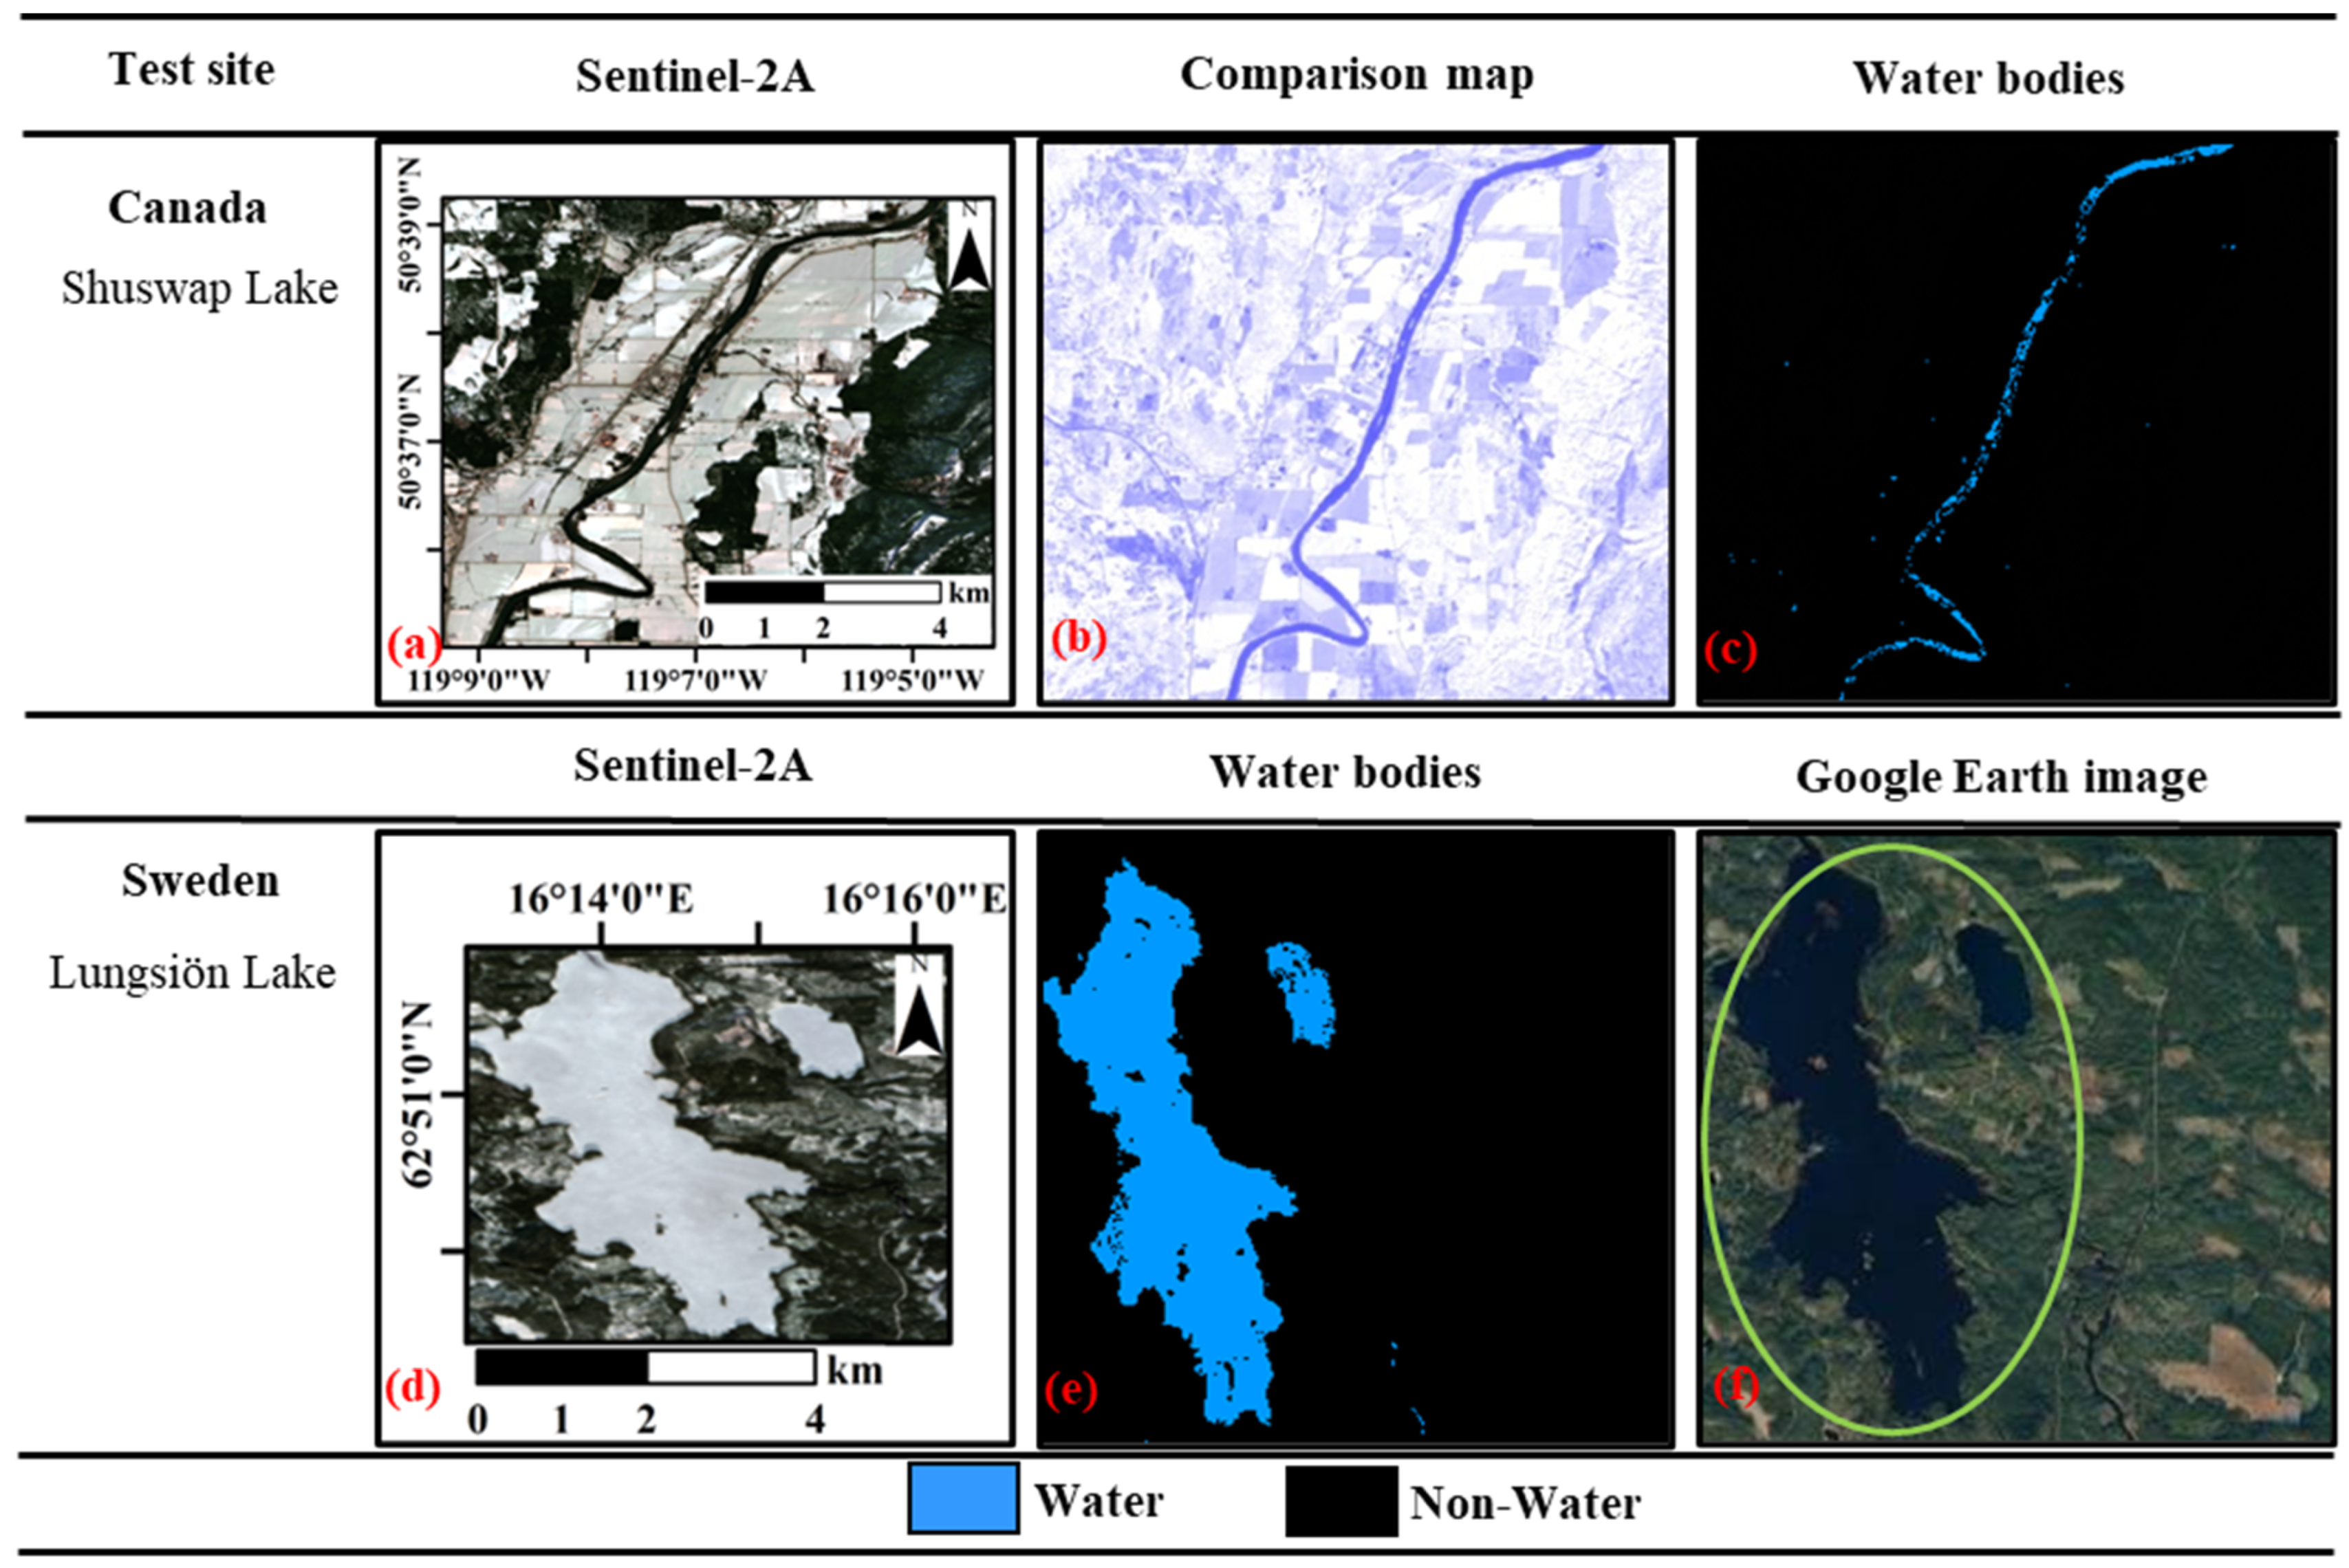
In order to test the applicability of the TWI, it was used to extract water bodies recorded at different times and with varying backgrounds. The outputs of the water extraction at three test sites are presented in Figure 5. The results of water extraction in areas covered by snow and ice are presented in Figure 6. Because the original Sentinel-2A image sets are composed of mean values, comparative maps were exported based on mean values. Comparative maps calculated by the TWI method were exported, as seen in Figure 5 and Figure 6. Snow and shadows were masked by digital elevation models (DEMs) for comparative maps before using thresholds to extract the water bodies. Then, the integration of the TWI and Otsu algorithm on the GEE platform was used to calculate the water extraction results.
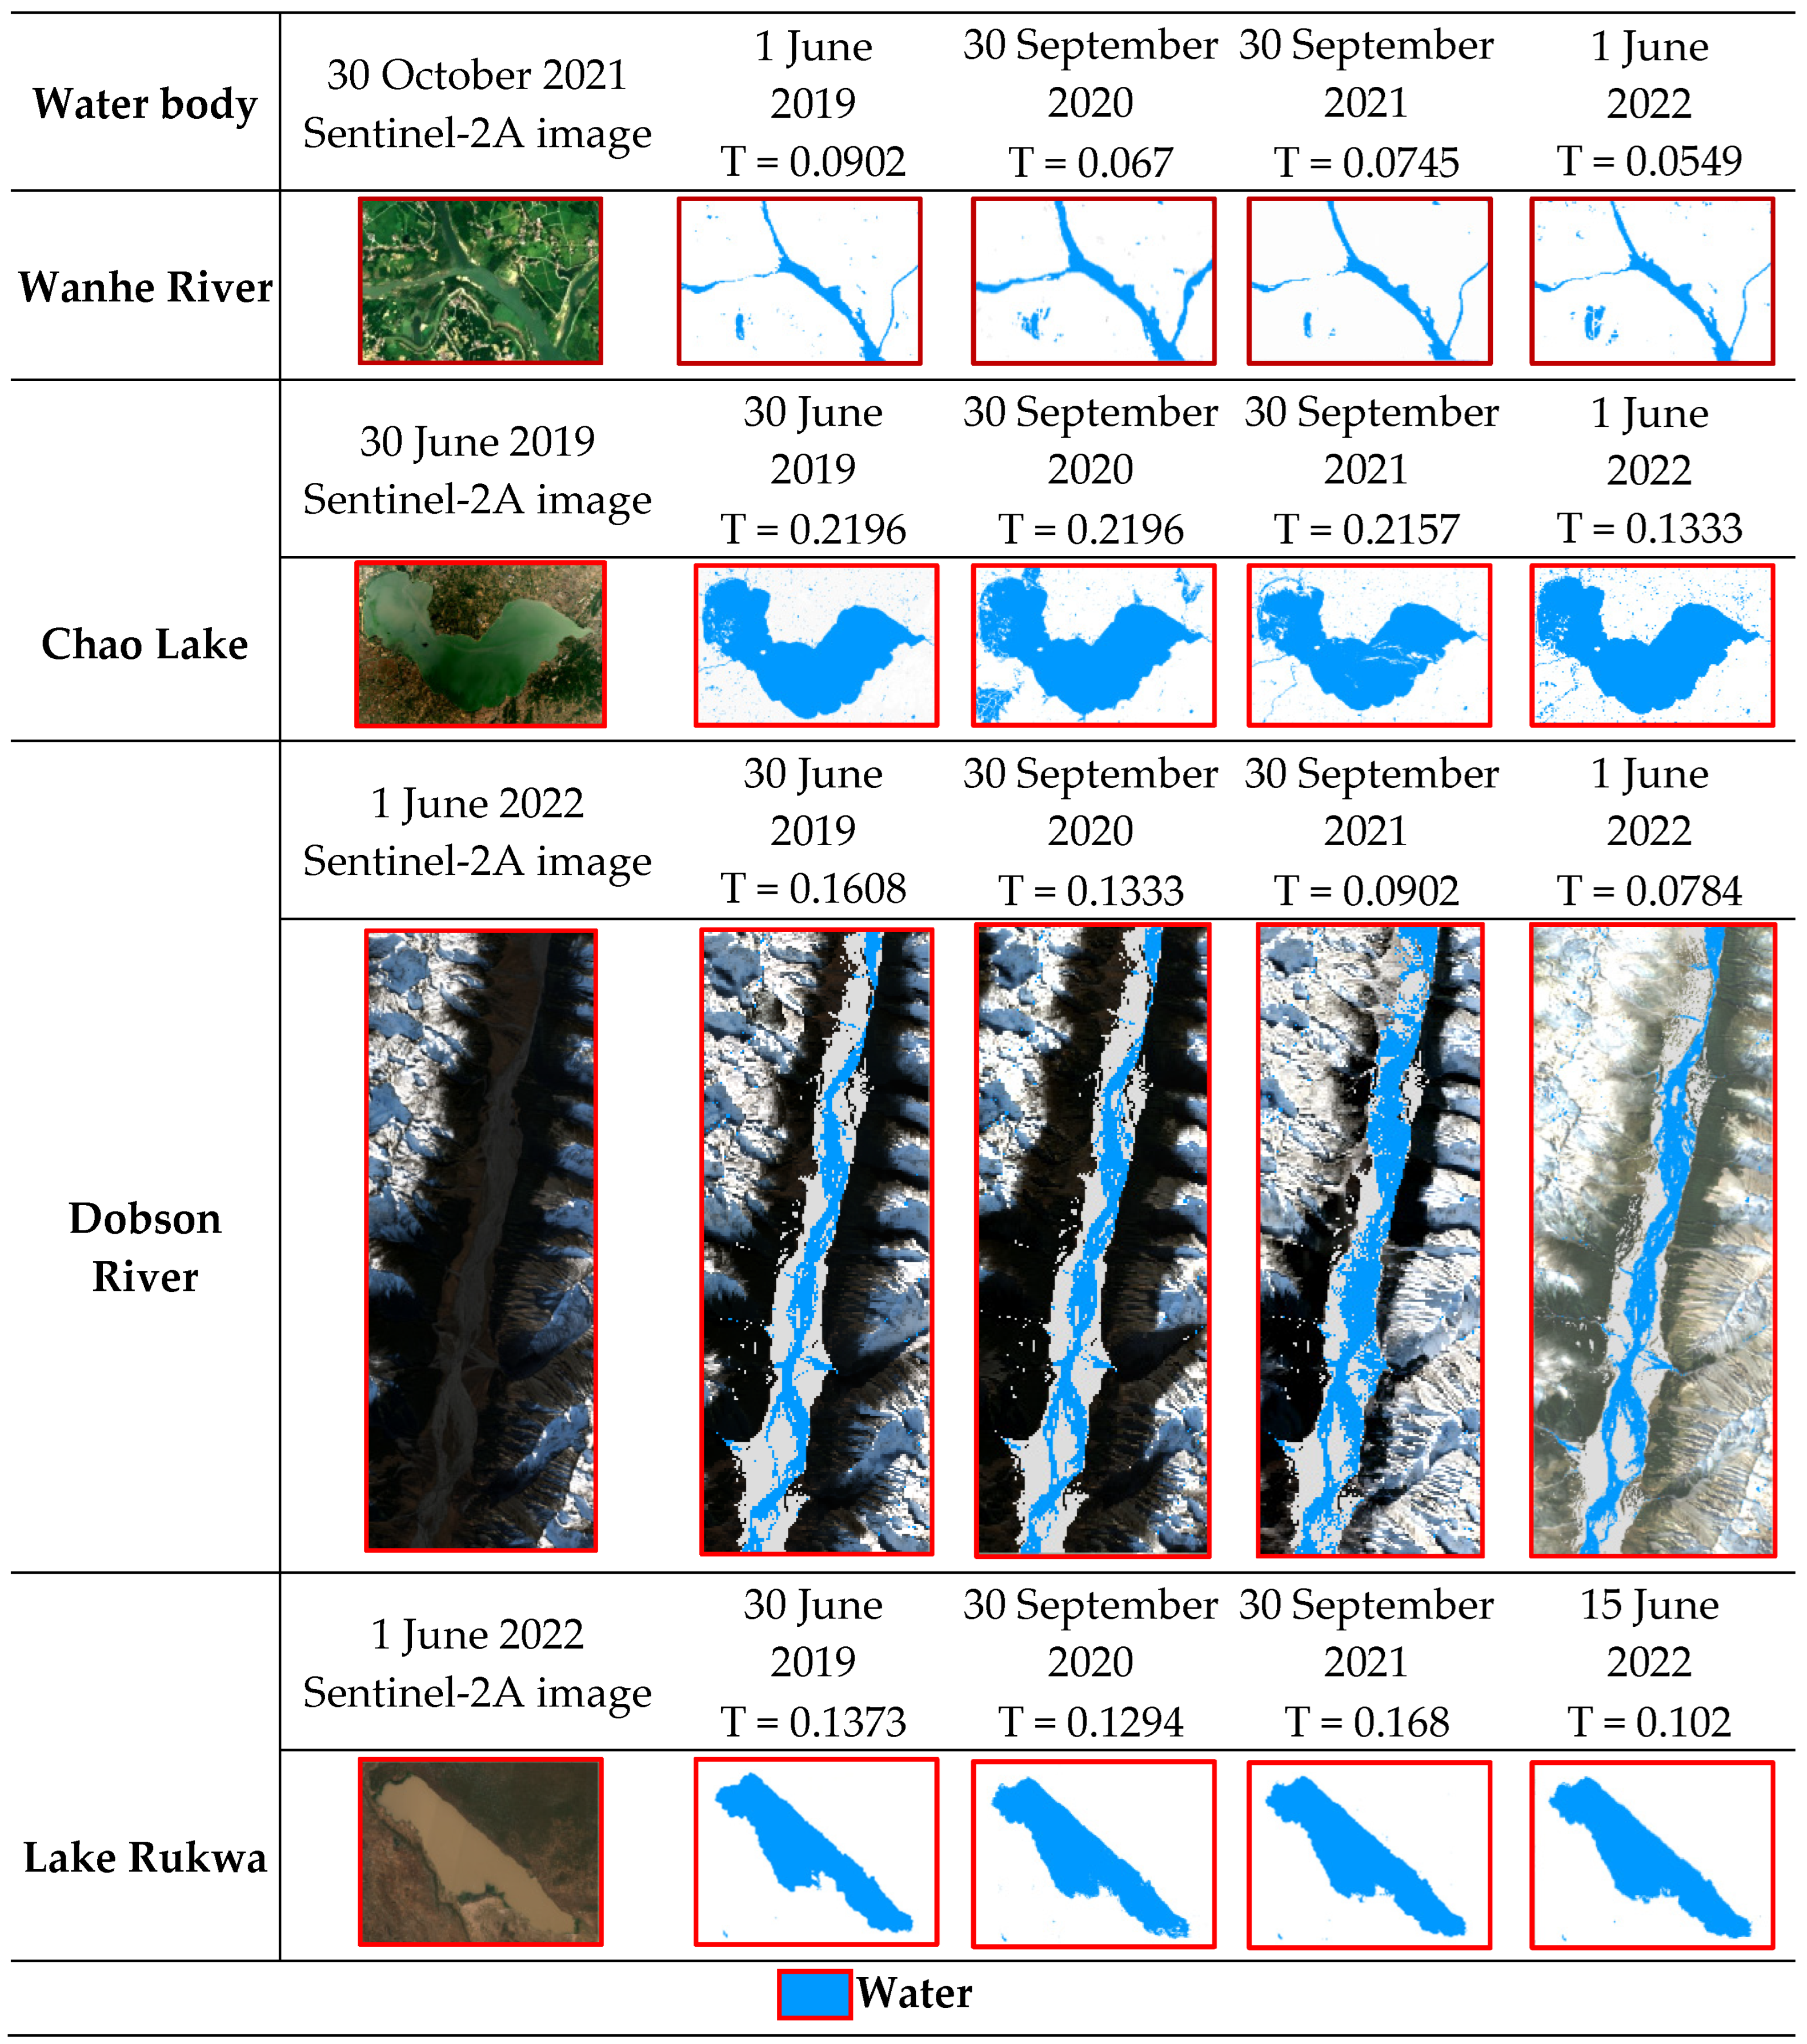
The TWI exports the means of contrast values to evaluate the separation between water and non-water bodies. The first test site, shown in Figure 5, demonstrated that the TWI could distinguish between the water body and its pollutants. The second test site of Figure 5 was saltwater. The TWI could identify the water body as well as non-water areas. Snow around Qinghai Lake was not extracted as water Although the third test site of Figure 5 had a complex environment, the TWI could distinguish water bodies, even if they contained high amounts of suspended matter. Two more water body areas (Figure 6) covered by snow and ices were selected to test the validity of the TWI. This further illustrates the potential of the new method to delineate small rivers and water areas covered by snow and ice. The results of water extraction using the TWI at different test sites proved that the results are robust and consistent. The TWI can also exactly extract water bodies in Sentinel-2 images during different seasons with varying coverages and loaded with varying amounts of suspended matter. Therefore, the TWI was applied to extract four different types of water bodies of Sentinel-2 images from 2019 to 2022 (Figure 7), which further proved the quality of the TWI in classifying water even in the presence of shadows, low-albedo, and snow in high-altitude areas.
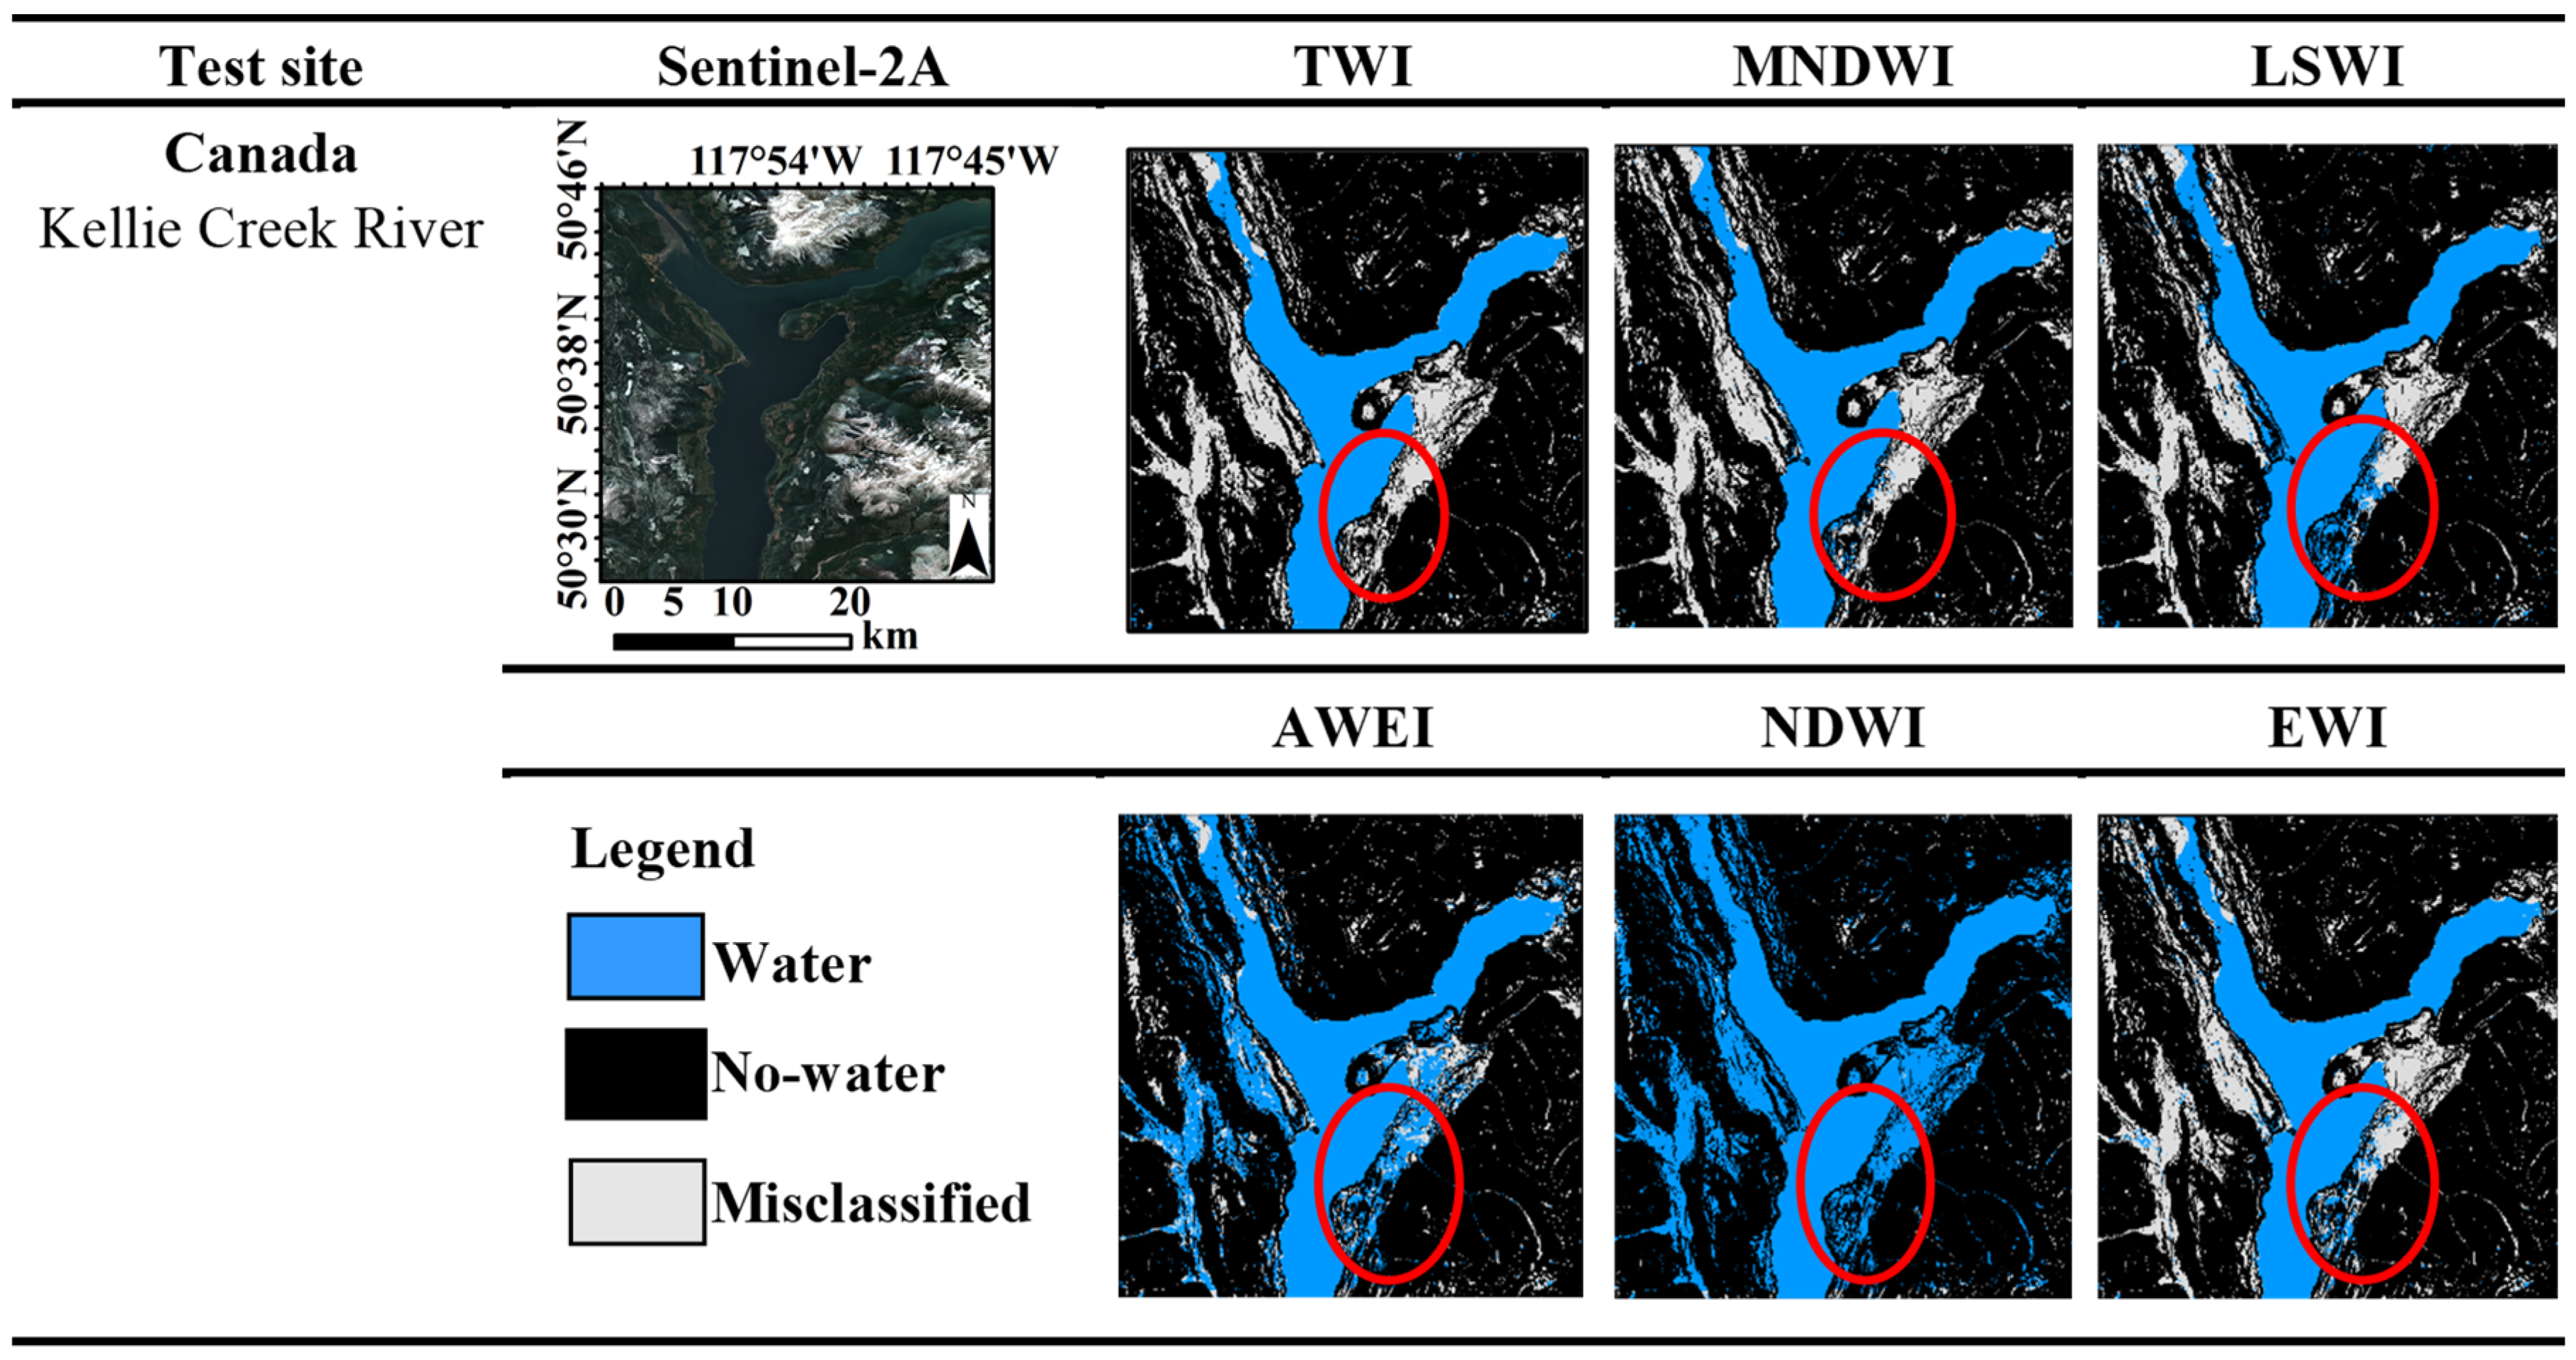
Three test sites, located in Canada, the United States, and China, were selected to compare the accuracy of the TWI with those derivable by other methods, namely, the MNDWI, LSWI, AWEI, NDWI. and EWI. The comparison maps of all indices were masked by DEM data before the water bodies were extracted by thresholds. A comparison of the results using seven distinct water indices at four test sites is presented in Figure 8, Figure 9, Figure 10 and Figure 11.
The Sentinel-2A image of the Canadian site in Figure 8 shows a snow-covered hilly area. A visual inspection within the red marked areas shows that the shadow of the hill is recognized as such by the TWI, in contrast to other water body indices that classified some shadows as water bodies. Among the five compared methods, the NDWI method created the worst results. Although the MNDWI was not as good as the TWI, it could also overcome the problems of mountain shadows. The EWI and other methods misclassified snow as water. In general, the TWI produced results of higher accuracy concerning shady areas, as compared to the other six water body index methods. Although the common six methods can also extract the water bodies, there is a noticeable shortage in, e.g., differentiating the water bodies from shadows and snow covered areas.
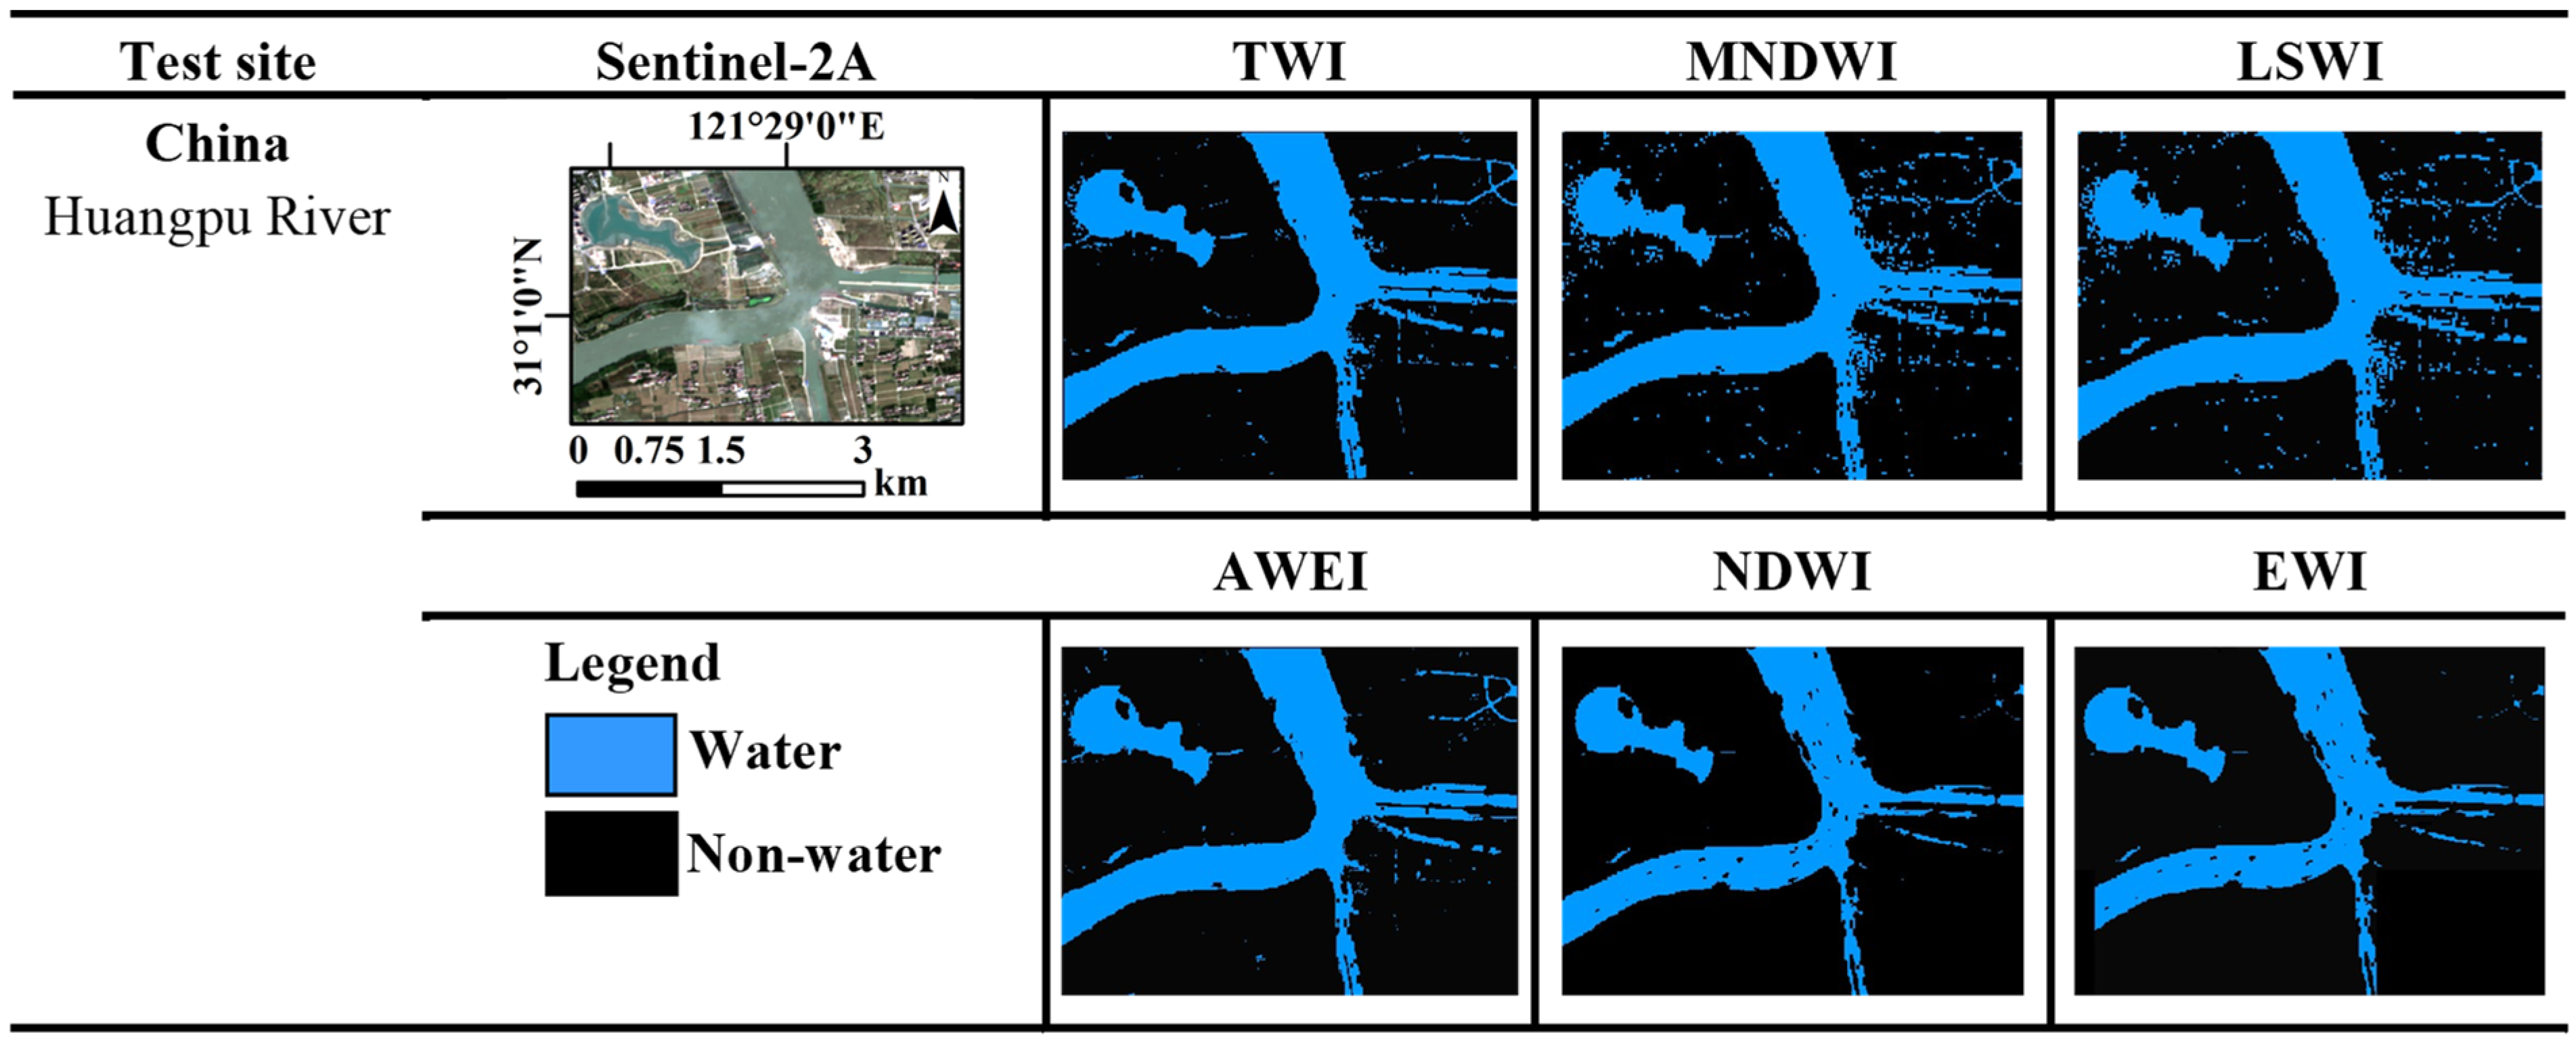
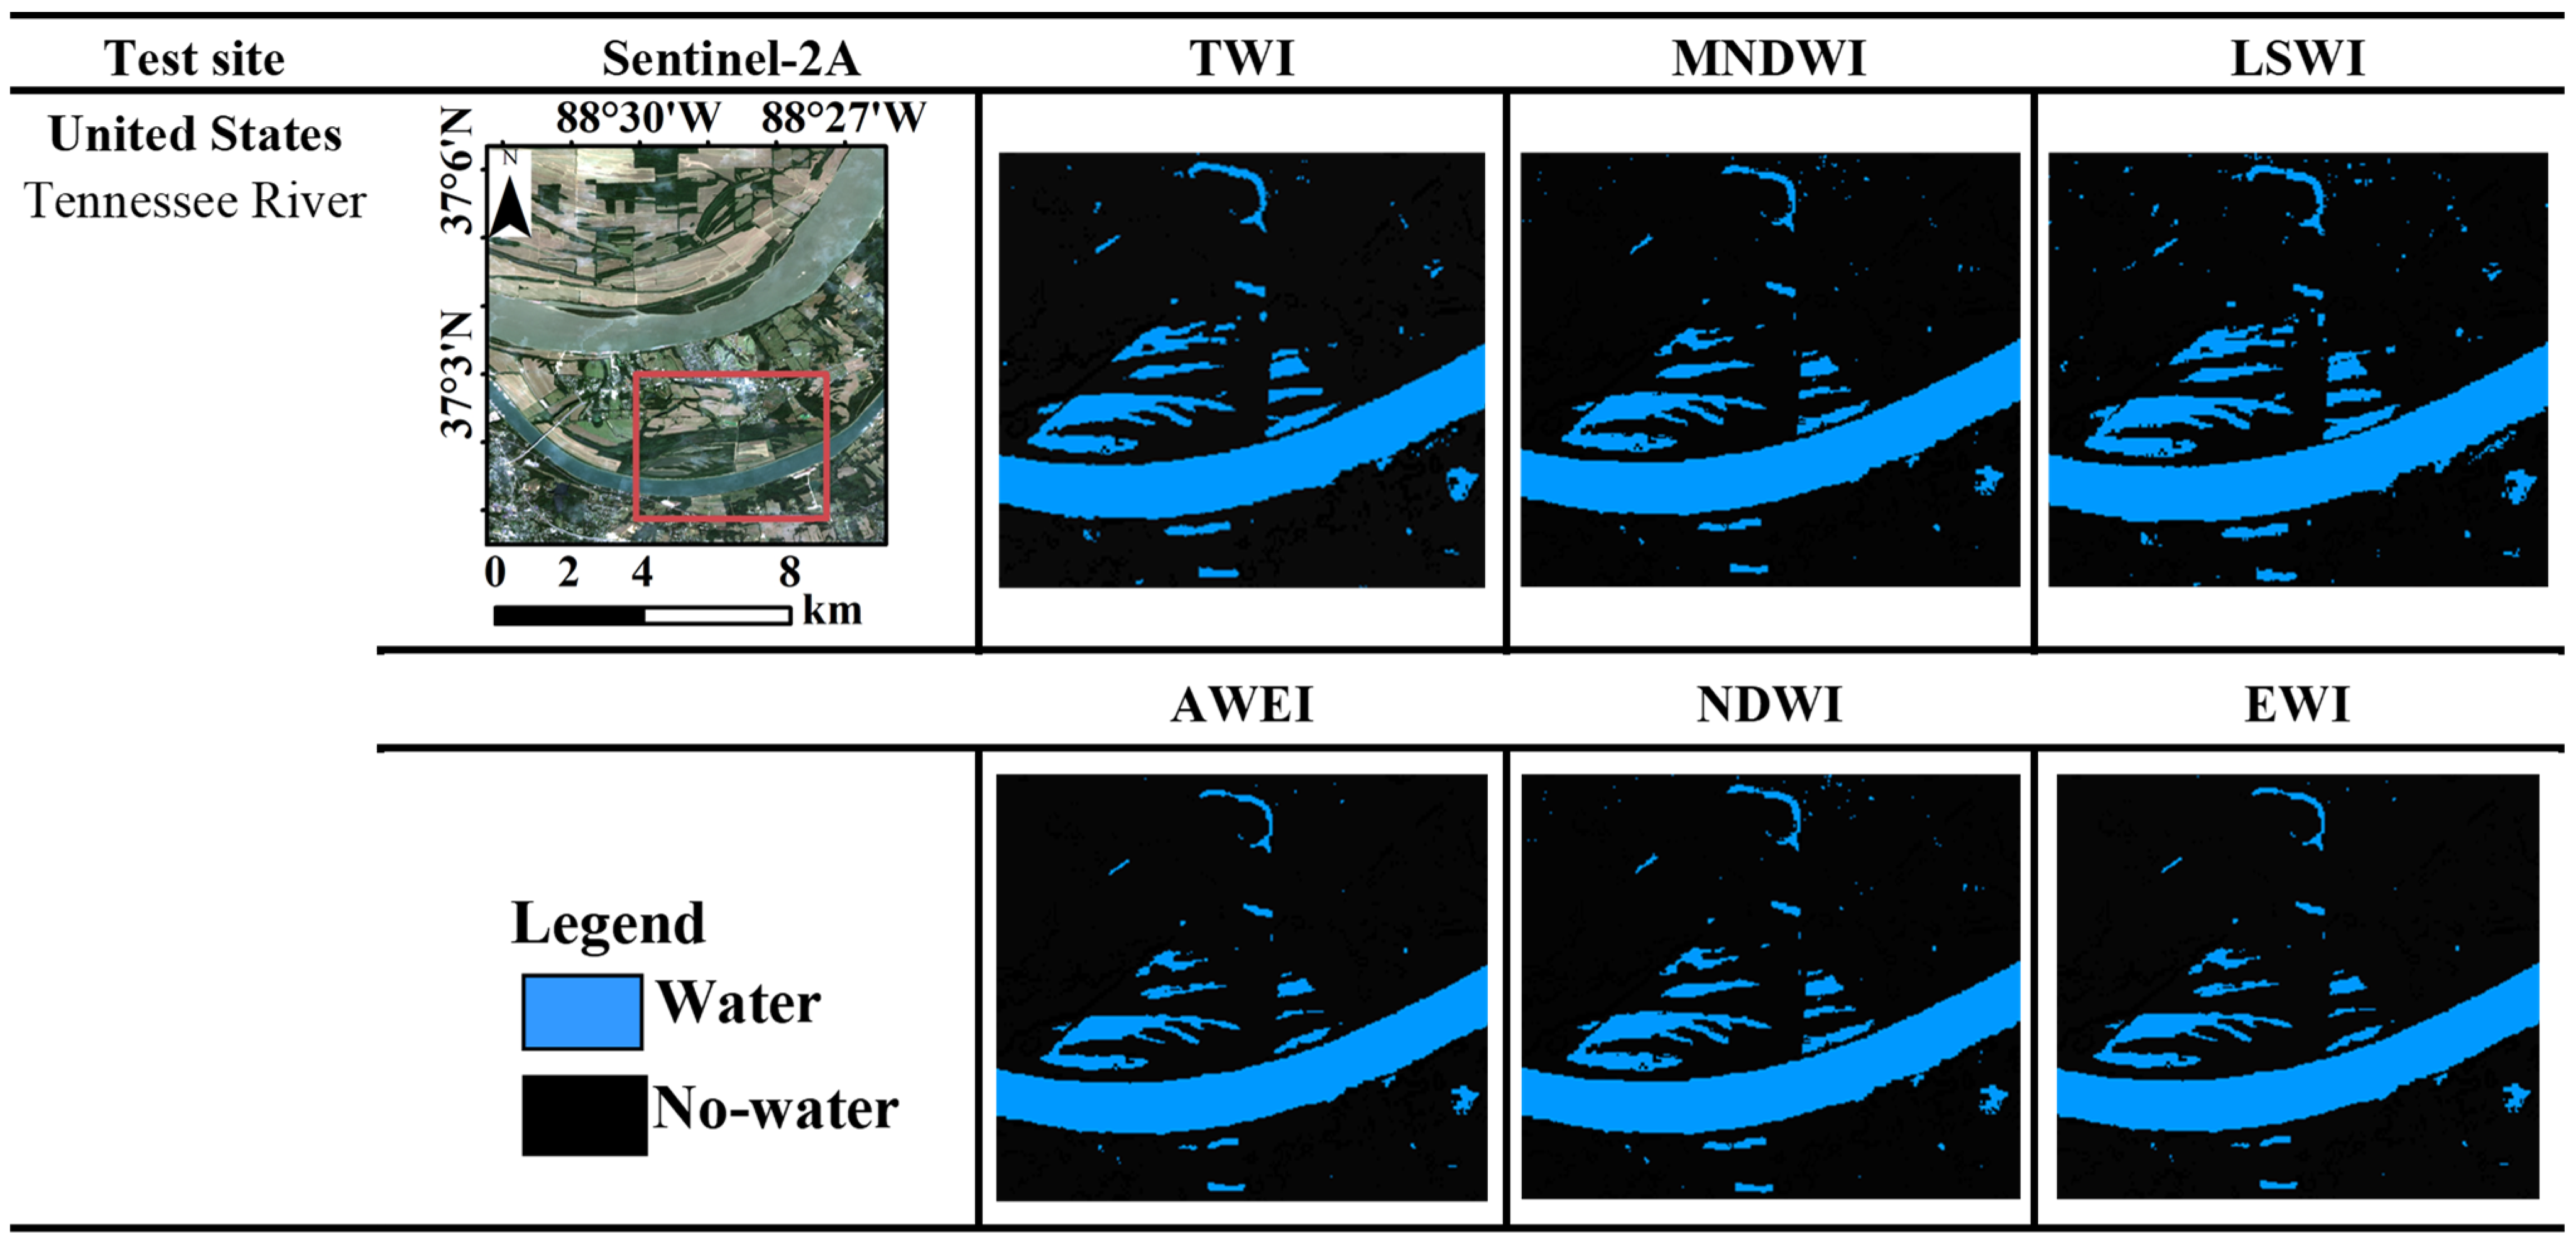
The test site illustrated in Figure 9 is located in the urban area of Shanghai, where the main influencing factors for water extraction are the shadows of large urban buildings. Here the TWI and AWEI showed superior performance as compared to the other methods. Especially the methods MNDWI and LSW showed problems separating the drop shadows of building. Moreover, the EWI and NDWI did not extract small water bodies. The MNDWI and LSWI methods could extract small water bodies, but there was a shortage due to over-extraction. Figure 10 shows the Tennessee River in the United States. The original Sentinel-2 image showed the river lined by tilled farmlands and bare lands. All water index methods were used to extract water bodies in this flat area. The overall effect of the results was good, although the LSWI and NDWI methods misclassified some small non-water objects as water. For this case, the TWI and AWEI were consistently better at identifying other non-water surfaces.
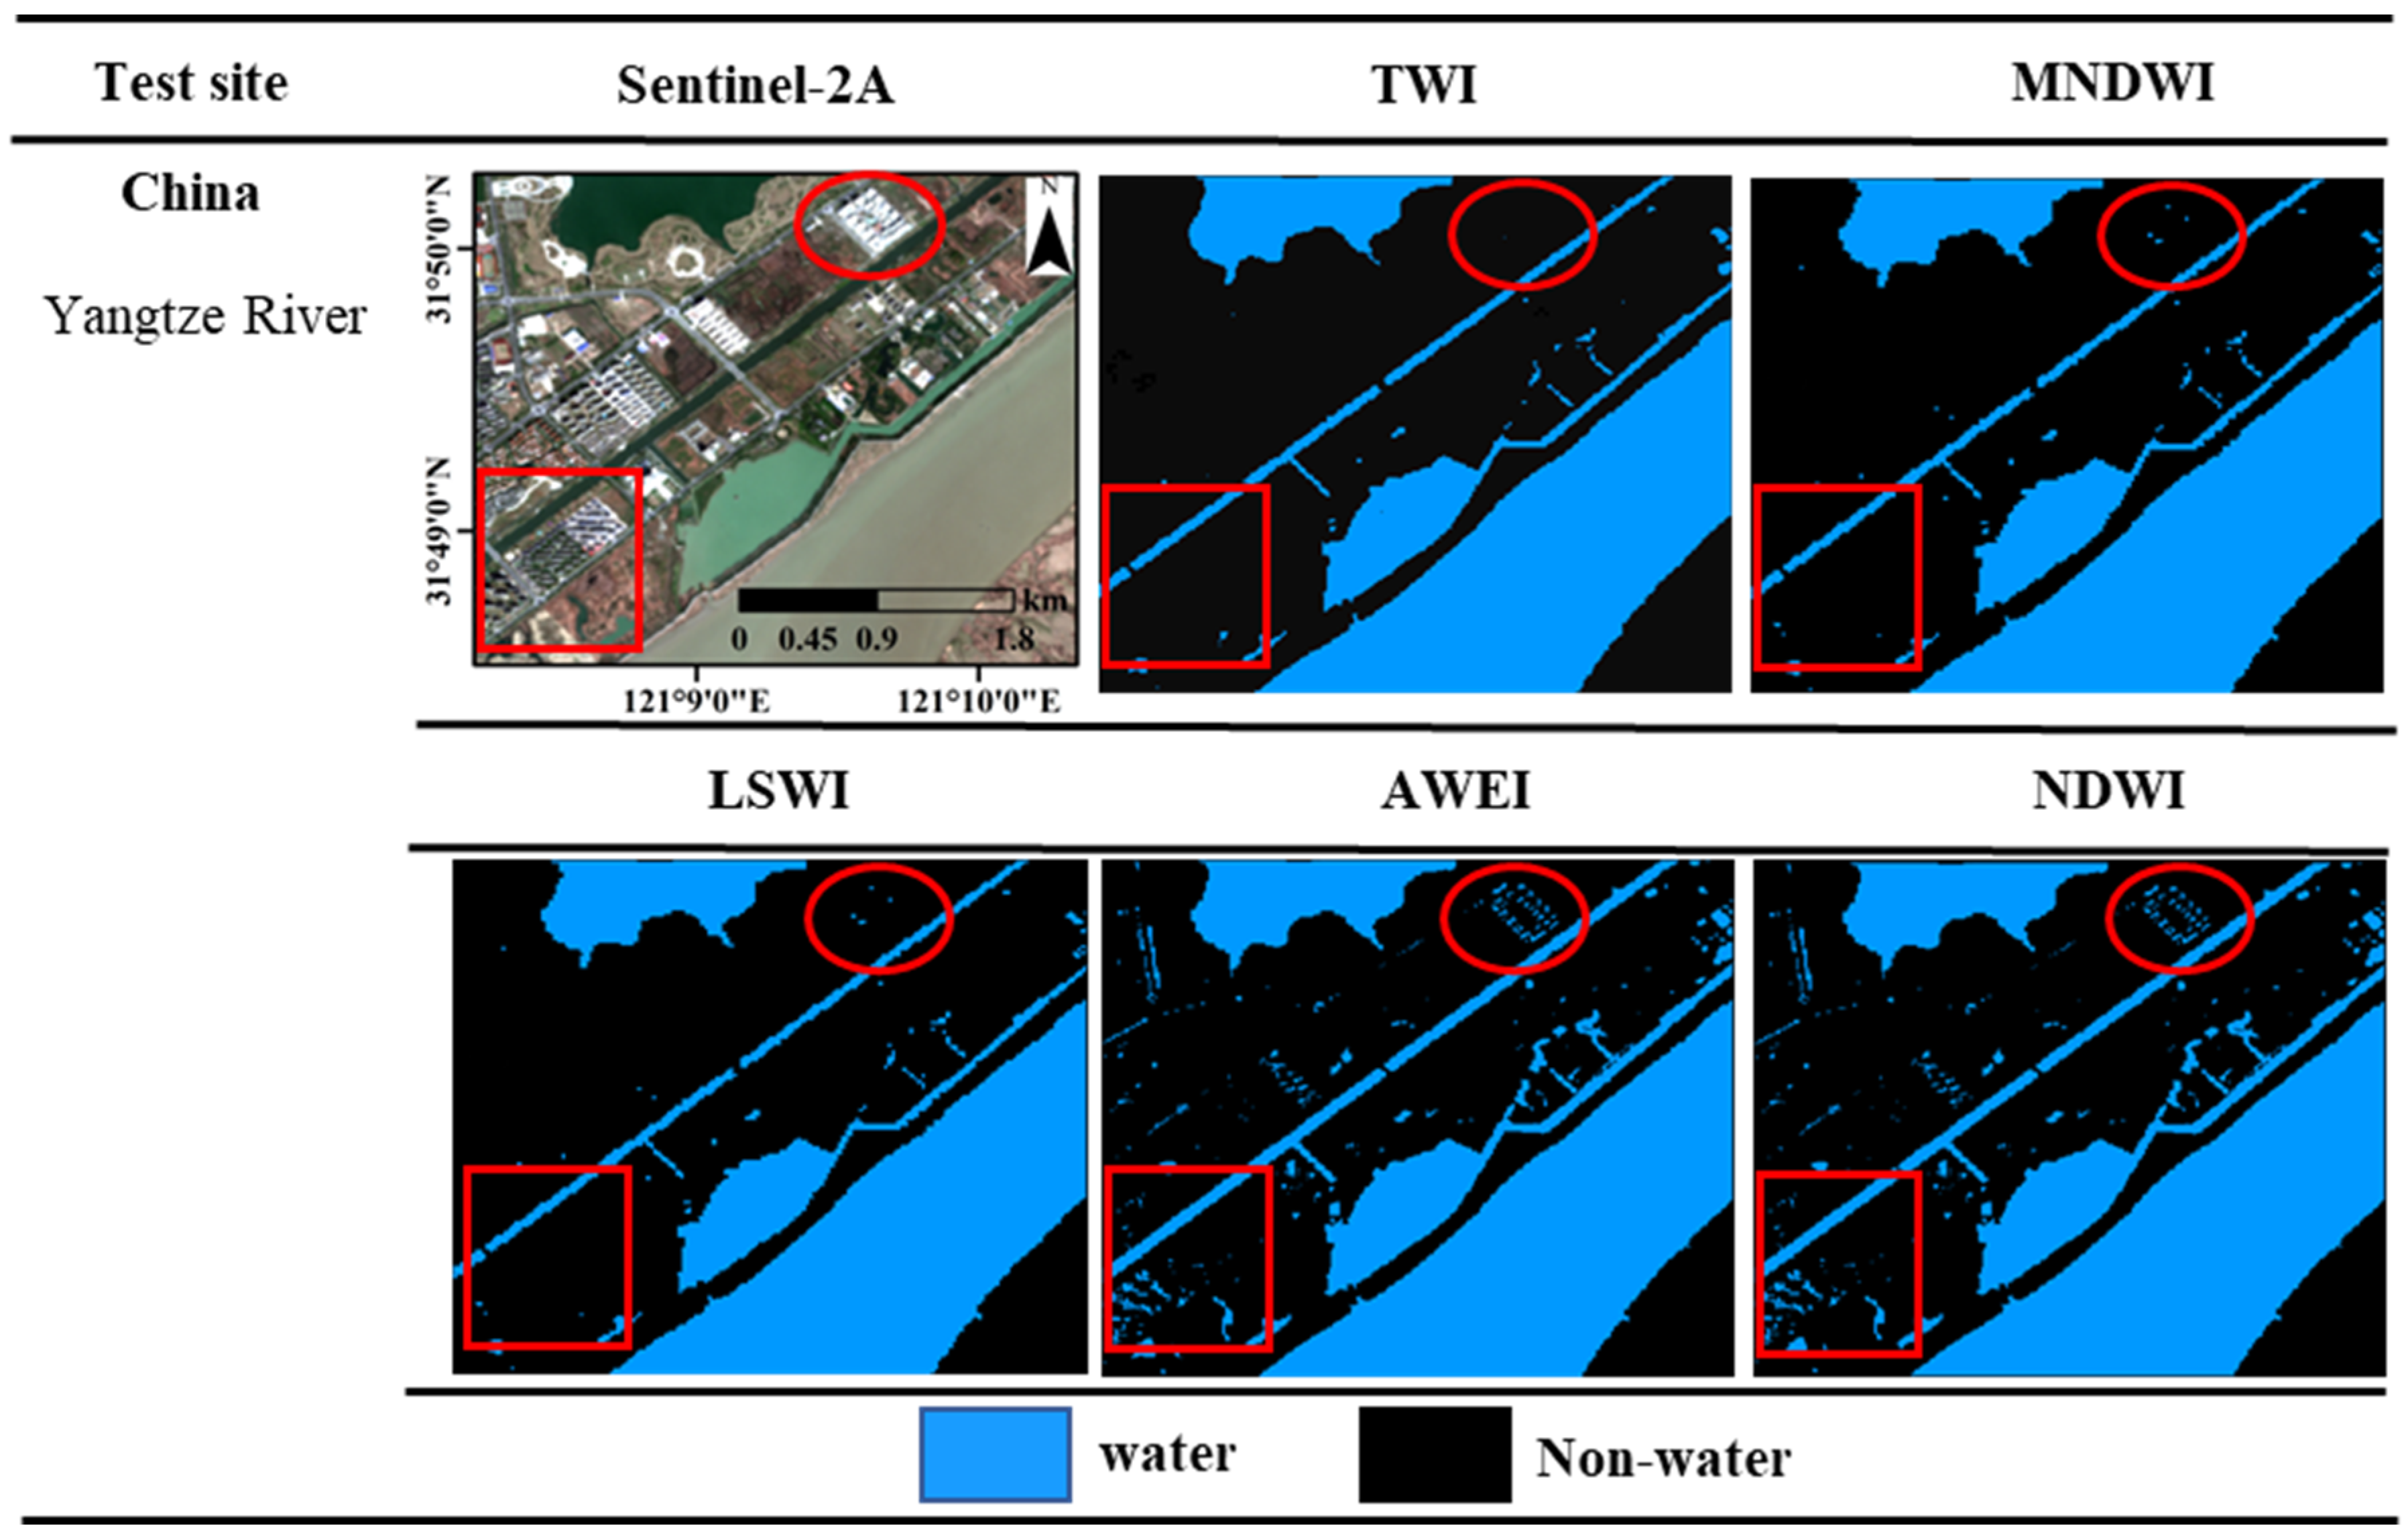
To further analyze the accuracy of extraction results, a Sentinel-2 image of a built-up area next to the Yangtze River was selected to verify the accuracy of the TWI when extracting water bodies surrounded by low albedo environments (Figure 11). The extraction accuracy of the TWI, LSWI, and MNDWI was higher than that of the AWEI and NDWI methods, as depicted in the red square area of Figure 11. Looking at the results in the red cycle, it becomes obvious that the TWI performed better. Thus, the overall identification of water bodies in shady and low reflecting areas by the TWI was more accurate than that using one of the other six methods.
Results from numerical experiments suggest that the performance of the TWI index showed higher accuracies in mapping surface waters as compared to other water body-related indices. Particularly for the test sites in Canada and the United States, the TWI was consistently better in suppressing ice, snow, shadow, and other non-water surfaces.

4.2. Classification Accuracy

To verify the accuracy of the TWI and its advantages and disadvantages as compared to six commonly used water indices, four test sites located in different environments were chosen to calculate the respective confusion matrices. In this context, the kappa coefficient and the overall precision were calculated. For the Canadian test site 475 random verification points were selected, for that in the United States 539, for the Swedish site 409, and 158 for the Mongolian site. The results of the mapping accuracy at each of the four main test sites are summarized in Table 4. Therein, the overall precision of the TWI and the six other indices are compared based on their optimal thresholds (Figure 12). The results of TWI’s kappa coefficients and its overall precision at each of the four test sites are shown in Figure 13.
Table 4 and Figure 12 clearly indicate a higher classification accuracy of the TWI as compared to the classification methods of the EWI, EWI, AWEI, LSWI, and MNDWI indices at all test sites. At the test sites in the United States, the accuracy rates extracted by the TWI and NDWI methods were almost the same, but the accuracy of the NDWI was lower than that of the TWI at the other test sites. The overall accuracy of the TWI was about 97% (Figure 12) at the Canadian and the United States sites. The overall precisions of the NDWI, MNDWI, LSWI, EWI, and AWEI methods at both sites were about 94% to 96%. Thus, the kappa coefficients of the TWI were superior to those of the other water body indices at the Canadian and the United States sites (Table 4), and thus the TWI validated its higher accuracy for water delineation in flat regions. At the Sweden site, the Sentinel-2 image was covered by snow and ice. The overall accuracy and kappa coefficients of the TWI were about 0.93 (Table 4) and 96% (Figure 12), respectively, which suggests that the TWI can also extract water bodies in areas covered by snow and ice. The water extraction accuracy of the TWI was also higher than that of the other methods at the test sites of Mongolia, which shows that TWI improves the accuracy of extracting water bodies also in mountainous regions with highly rugged terrain. For many water body indices, the lack of stability of the thresholds was an important issue, making it difficult to decide which value for water extraction should be used in each respective situation. In contrast, the accuracies derived from the TWI are based on Otsu optimal thresholds, and thus it is preferably applicable for the extraction of various water bodies in different environments (Figure 13).

5. Conclusions

Considering the unique spectral band design of the MSI sensor aboard the Sentinel-2A satellite and its related image characteristics, a TWI index based on the triangle similarity principle was proposed, aiming at the accuracy improvement of water body extraction, especially in regions with complex backgrounds such as hill shadows, snow, and different land cover categories. To increase the spectral separability between water and non-water surfaces, we introduced a new automatic water extraction method (TWI) for Sentinel-2A images and compared it with commonly used classification methods such as LSWI, MNDWI, NDWI, AWEI, and EWI. Thereby the integration of the TWI and the Otsu algorithm turned out to be an effective solution for accurately extracting various water body types. To perform test processing and validation, we selected Sentinel-2A images of five different countries, including Canada, China, Mongolia, Mongolia, and the United States. The test results show that the accuracy of the TWI is improved compared to other methods, whether in the United States and Canada sites with flat terrain or at high altitude sites such as in Sweden or Mongolia. The overall accuracy and kappa coefficients of the TWI calculated for the Mongolia test site explain the significantly improved accuracies in regions with different background surfaces such as snow and ice. Visual evaluation suggests that the extraction accuracy of the TWI is high for Qinghai Lake, Khar-Us Lake, and East Sea in China. The extraction accuracy of the TWI is better than that of the MNDWI, LSWI, AWEI, NDWI, and EWI for Canada, Mongolia, and the United States.
While the TWI was tested under a wide range of environmental conditions and water types, several variables were not considered that could affect the accuracy of the newly developed water extraction method. Seasonal and daily changes in solar angle, varying atmospheric compositions, bathymetry, and particularly changes in the biophysical and chemical properties of water bodies, such as, e.g., the amounts of suspended matter (phytoplankton and inorganic sediments) may affect the reflectance patterns of water bodies [53].
Finally, it can be stated that the integration of the TWI and the Otsu algorithm can realize automatic high-precision water extraction using Google Earth Engine, which provides a favorable analysis platform also for research in related disciplines such as hydrology, environment, and ecology, and in case of droughts and flood disasters.

Author Contributions

All authors participated in editing and reviewing the manuscript. L.N. implemented the methodology, analyzed the data, produced the results, and wrote the original paper. G.Z., G.X. and H.K. supervised the research and revised the manuscript. C.J., Y.H. and M.S. assisted in handling the data and revised the manuscript. All authors have read and agreed to the published version of the manuscript.

Funding

The research is supported by the Guangdong Basic and Applied Basic Research Foundation (2021A1515012600) and the Open Fund of Key Laboratory of Urban Land Resources Monitoring and Simulation, Ministry of Natural Resources (KF-2021-06-104).

Acknowledgments

The authors would like to thank the anonymous reviewers for their help and constructive comments.

Conflicts of Interest

The authors declare that they have no known competing financial interests or personal relationships. No conflicts of interest exist in the submission of this manuscript, and the manuscript is approved by all authors for publication.

References

  1. Dang, T.D.; Cochrane, T.A.; Arias, M.E. Quantifying suspended sediment dynamics in mega deltas using remote sensing data: A case study of the Mekong floodplains. Int. J. Appl. Earth Obs. Geoinf. 2018, 68, 105–115. [Google Scholar] [CrossRef]
  2. Ji, L.; Zhang, L.; Wylie, B. Analysis of Dynamic Thresholds for the Normalized Difference Water Index. Photogramm. Eng. Remote Sens. 2009, 75, 1307–1317. [Google Scholar] [CrossRef]
  3. Chen, Y.; Fan, R.; Yang, X.; Wang, J.; Latif, A. Extraction of Urban Water Bodies from High-Resolution Remote-Sensing Imagery Using Deep Learning. Water 2018, 10, 585. [Google Scholar] [CrossRef] [Green Version]
  4. Rishikeshan, C.A.; Ramesh, H. An automated mathematical morphology driven algorithm for water body extraction from remotely sensed images. ISPRS J. Photogramm. Remote Sens. 2018, 146, 11–21. [Google Scholar] [CrossRef]
  5. Habeeb, R.; Gupta, Y.; Chinwan, H.; Barker, E. Assessing Demographic and Water Sensitivities Arising due to Urban Water Insecurity in Haldwani, Uttarakhand (India): A GIS-Based Spatial Analysis. J. Geovis. Spat. Anal. 2019, 3, 8. [Google Scholar] [CrossRef]
  6. Feng, W.; Sui, H.; Huang, W.; Xu, C.; An, K. Water Body Extraction From Very High-Resolution Remote Sensing Imagery Using Deep U-Net and a Superpixel-Based Conditional Random Field Model. IEEE Geosci. Remote Sens. Lett. 2019, 16, 618–622. [Google Scholar] [CrossRef]
  7. Moser, G.; Zerubia, J.; Serpico, S.B.; Benediktsson, J.A. Mathematical Models for Remote Sensing Image Processing. In Signals and Communication Technology; Moser, G., Zerubia, J., Eds.; Springer: Cham, Switzerland, 2018; pp. 1–36. [Google Scholar] [CrossRef]
  8. Matsushita, B.; Yang, W.; Chang, P.; Yang, F.; Fukushima, T. A simple method for distinguishing global Case-1 and Case-2 waters using SeaWiFS measurements. ISPRS J. Photogramm. Remote Sens. 2012, 69, 74–87. [Google Scholar] [CrossRef] [Green Version]
  9. Nguyen, U.N.T.; Pham, L.T.H.; Dang, T.D. An automatic water detection approach using Landsat 8 OLI and Google Earth Engine cloud computing to map lakes and reservoirs in New Zealand. Environ. Monit. Assess. 2019, 191, 235. [Google Scholar] [CrossRef]
  10. Sun, F.; Sun, W.; Chen, J.; Gong, P. Comparison and improvement of methods for identifying waterbodies in remotely sensed imagery. Int. J. Remote Sens. 2012, 33, 6854–6875. [Google Scholar] [CrossRef]
  11. Pham, L.T.H.; Brabyn, L. Monitoring mangrove biomass change in Vietnam using SPOT images and an object-based approach combined with machine learning algorithms. ISPRS J. Photogramm. Remote Sens. 2017, 128, 86–97. [Google Scholar] [CrossRef]
  12. Chawla, I.; Karthikeyan, L.; Mishra, A.K. A review of remote sensing applications for water security: Quantity, quality, and extremes. J. Hydrol. 2020, 585, 124826. [Google Scholar] [CrossRef]
  13. Nandi, D.; Chowdhury, R.; Mohapatra, J.; Mohanta, K.; Ray, D. Automatic delineation of water bodies using multiple spectral indices. Int. J. Sci. Res. Sci. Eng. Technol. IJSRSET 2018, 4, 14. [Google Scholar]
  14. Acharya, T.D.; Lee, D.H.; Yang, I.T.; Lee, J.K. Identification of Water Bodies in a Landsat 8 OLI Image Using a J48 Decision Tree. Sensors 2016, 16, 1075. [Google Scholar] [CrossRef] [PubMed] [Green Version]
  15. Mueller, N.; Lewis, A.; Roberts, D.; Ring, S.; Melrose, R.; Sixsmith, J.; Lymburner, L.; McIntyre, A.; Tan, P.; Curnow, S.; et al. Water observations from space: Mapping surface water from 25 years of Landsat imagery across Australia. Remote Sens. Environ. 2016, 174, 341–352. [Google Scholar] [CrossRef] [Green Version]
  16. Yang, J.; Du, X. An enhanced water index in extracting water bodies from Landsat TM imagery. Ann. GIS 2017, 23, 141–148. [Google Scholar] [CrossRef]
  17. Acharya, T.D.; Subedi, A.; Lee, D.H. Evaluation of Water Indices for Surface Water Extraction in a Landsat 8 Scene of Nepal. Sensors 2018, 18, 2580. [Google Scholar] [CrossRef] [Green Version]
  18. Rokni, K.; Ahmad, A.; Solaimani, K.; Hazini, S. A new approach for surface water change detection: Integration of pixel level image fusion and image classification techniques. Int. J. Appl. Earth Obs. Geoinf. 2015, 34, 226–234. [Google Scholar] [CrossRef]
  19. Liu, W.; Chen, X.; Ran, J.; Liu, L.; Wang, Q.; Xin, L.; Li, G. LaeNet: A Novel Lightweight Multitask CNN for Automatically Extracting Lake Area and Shoreline from Remote Sensing Images. Remote Sens. 2020, 13, 56. [Google Scholar] [CrossRef]
  20. Skakun, S. A neural network approach to flood mapping using satellite imagery. Comput. Inform. 2010, 29, 1013–1024. [Google Scholar]
  21. Weng, Q. Remote sensing of impervious surfaces in the urban areas: Requirements, methods, and trends. Remote Sens. Environ. 2012, 117, 34–49. [Google Scholar] [CrossRef]
  22. Bofana, J.; Zhang, M.; Nabil, M.; Wu, B.; Tian, F.; Liu, W.; Zeng, H.; Zhang, N. Comparison of Different Cropland Classification Methods under Diversified Agroecological Conditions in the Zambezi River Basin. Remote Sens. 2020, 12, 2096. [Google Scholar] [CrossRef]
  23. Sun, F.; Zhao, Y.; Gong, P.; Ma, R.; Dai, Y. Monitoring dynamic changes of global land cover types: Fluctuations of major lakes in China every 8 days during 2000–2010. Chin. Sci. Bull. 2013, 59, 171–189. [Google Scholar] [CrossRef]
  24. Mallet, C.; Bretar, F.; Roux, M.; Soergel, U.; Heipke, C. Relevance assessment of full-waveform lidar data for urban area classification. ISPRS J. Photogramm. Remote Sens. 2011, 66, S71–S84. [Google Scholar] [CrossRef]
  25. Belgiu, M.; Drăguţ, L. Random forest in remote sensing: A review of applications and future directions. ISPRS J. Photogramm. Remote Sens. 2016, 114, 24–31. [Google Scholar] [CrossRef]
  26. Acharya, T.D.; Subedi, A.; Lee, D.H. Evaluation of Machine Learning Algorithms for Surface Water Extraction in a Landsat 8 Scene of Nepal. Sensors 2019, 19, 2769. [Google Scholar] [CrossRef] [Green Version]
  27. Ji, L.; Geng, X.; Sun, K.; Zhao, Y.; Gong, P. Target Detection Method for Water Mapping Using Landsat 8 OLI/TIRS Imagery. Water 2015, 7, 794–817. [Google Scholar] [CrossRef] [Green Version]
  28. Wu, X.; Kumar, V.; Ross Quinlan, J.; Ghosh, J.; Yang, Q.; Motoda, H.; McLachlan, G.J.; Ng, A.; Liu, B.; Yu, P.S.; et al. Top 10 algorithms in data mining. Knowl. Inf. Syst. 2007, 14, 1–37. [Google Scholar] [CrossRef] [Green Version]
  29. Kaplan, G.; Avdan, U. Object-based water body extraction model using Sentinel-2 satellite imagery. Remote Sens. 2017, 50, 137–143. [Google Scholar] [CrossRef] [Green Version]
  30. Khalid, H.W.; Khalil, R.M.Z.; Qureshi, M.A. Evaluating spectral indices for water bodies extraction in western Tibetan Plateau. Egypt. J. Remote Sens. Space Sci. 2021, 24, 619–634. [Google Scholar] [CrossRef]
  31. McFeeters, S.K. The use of the Normalized Difference Water Index (NDWI) in the delineation of open water features. Int. J. Remote Sens. 2007, 17, 1425–1432. [Google Scholar] [CrossRef]
  32. Xu, H. Modification of normalised difference water index (NDWI) to enhance open water features in remotely sensed imagery. Int. J. Remote Sens. 2007, 27, 3025–3033. [Google Scholar] [CrossRef]
  33. Wang, S.; Baig, M.H.A.; Zhang, L.; Jiang, H.; Ji, Y.; Zhao, H.; Tian, J. A Simple Enhanced Water Index (EWI) for Percent Surface Water Estimation Using Landsat Data. IEEE J. Sel. Top. Appl. Earth Obs. Remote Sens. 2015, 8, 90–97. [Google Scholar] [CrossRef]
  34. Feyisa, G.L.; Meilby, H.; Fensholt, R.; Proud, S.R. Automated Water Extraction Index: A new technique for surface water mapping using Landsat imagery. Remote Sens. Environ. 2014, 140, 23–35. [Google Scholar] [CrossRef]
  35. Engler, R.; Waser, L.T.; Zimmermann, N.E.; Schaub, M.; Berdos, S.; Ginzler, C.; Psomas, A. Combining ensemble modeling and remote sensing for mapping individual tree species at high spatial resolution. For. Ecol. Manag. 2013, 310, 64–73. [Google Scholar] [CrossRef]
  36. Jiang, W.; Ni, Y.; Pang, Z.; Li, X.; Ju, H.; He, G.; Lv, J.; Yang, K.; Fu, J.; Qin, X. An Effective Water Body Extraction Method with New Water Index for Sentinel-2 Imagery. Water 2021, 13, 1647. [Google Scholar] [CrossRef]
  37. Pahlevan, N.; Smith, B.; Schalles, J.; Binding, C.; Cao, Z.; Ma, R.; Alikas, K.; Kangro, K.; Gurlin, D.; Hà, N.; et al. Seamless retrievals of chlorophyll-a from Sentinel-2 (MSI) and Sentinel-3 (OLCI) in inland and coastal waters: A machine-learning approach. Remote Sens. Environ. 2020, 240, 11604. [Google Scholar] [CrossRef]
  38. Wieland, M.; Martinis, S. Large-scale surface water change observed by Sentinel-2 during the 2018 drought in Germany. Int. J. Remote Sens. 2020, 41, 4742–4756. [Google Scholar] [CrossRef]
  39. Tamiminia, H.; Salehi, B.; Mahdianpari, M.; Quackenbush, L.; Adeli, S.; Brisco, B. Google Earth Engine for geo-big data applications: A meta-analysis and systematic review. ISPRS J. Photogramm. Remote Sens. 2020, 164, 152–170. [Google Scholar] [CrossRef]
  40. Huang, C.; Chen, Y.; Zhang, S.; Wu, J. Detecting, Extracting, and Monitoring Surface Water From Space Using Optical Sensors: A Review. Rev. Geophys. 2018, 56, 333–360. [Google Scholar] [CrossRef]
  41. Matsushita, B.; Yang, W.; Yu, G.; Oyama, Y.; Yoshimura, K.; Fukushima, T. A hybrid algorithm for estimating the chlorophyll-a concentration across different trophic states in Asian inland waters. ISPRS J. Photogramm. Remote Sens. 2015, 102, 28–37. [Google Scholar] [CrossRef] [Green Version]
  42. Gao, H.; Wang, L.; Jing, L.; Xu, J. An effective modified water extraction method for Landsat-8 OLI imagery of mountainous plateau regions. IOP Conf. Ser. Earth Environ. Sci. 2016, 34, 012010. [Google Scholar] [CrossRef]
  43. Waser, L.T.; Rüetschi, M.; Psomas, A.; Small, D.; Rehush, N. Mapping dominant leaf type based on combined Sentinel-1/-2 data—Challenges for mountainous countries. ISPRS J. Photogramm. Remote Sens. 2021, 180, 209–226. [Google Scholar] [CrossRef]
  44. Main-Knorn, M.; Pflug, B.; Louis, J.; Debaecker, V.; Müller-Wilm, U.; Gascon, F. Sen2Cor for Sentinel-2. Image Signal Process. Remote Sens. 2017, 10427, 37–48. [Google Scholar]
  45. Segl, K.; Richter, R.; Küster, T.; Kaufmann, H. End-to-end sensor simulation for spectral band selection and optimization with application to the Sentinel-2 mission. Appl. Opt. 2012, 51, 439–449. [Google Scholar] [CrossRef] [Green Version]
  46. Picciotto, H. Triangle Congruence and Similarity A Common-Core-Compatible Approach. Available online: https://www.mathed.page/transformations/triangle-congruence-similarity-v1.pdf (accessed on 3 May 2022).
  47. Otsu, N. A Threshold Selection Method from Gray-Level Histograms. IEEE Trans. Syst. Man Cybern. 1979, 9, 62–66. [Google Scholar] [CrossRef] [Green Version]
  48. Xu, X.; Xu, S.; Jin, L.; Song, E. Characteristic analysis of Otsu threshold and its applications. Pattern Recognit. Lett. 2011, 32, 956–961. [Google Scholar] [CrossRef]
  49. Powers, D.M.W. Evaluation: From Precision, Recall and F-Measure to ROC, Informedness, Markedness & Correlation. J. Mach. Learn. Technol. 2011, 2, 29. [Google Scholar] [CrossRef]
  50. Foody, G.M. Classification accuracy comparison: Hypothesis tests and the use of confidence intervals in evaluations of difference, equivalence and non-inferiority. Remote Sens. Environ. 2009, 113, 1658–1663. [Google Scholar] [CrossRef] [Green Version]
  51. Foody, G.M. Explaining the unsuitability of the kappa coefficient in the assessment and comparison of the accuracy of thematic maps obtained by image classification. Remote Sens. Environ. 2020, 239, 111630. [Google Scholar] [CrossRef]
  52. Morales-Barquero, L.; Lyons, M.B.; Phinn, S.R.; Roelfsema, C.M. Trends in Remote Sensing Accuracy Assessment Approaches in the Context of Natural Resources. Remote Sens. 2019, 11, 2305. [Google Scholar] [CrossRef] [Green Version]
  53. Zhang, Y.; Feng, L.; Li, J.; Luo, L.; Yin, Y.; Liu, M.; Li, Y. Seasonal-spatial variation and remote sensing of phytoplankton absorption in Lake Taihu, a large eutrophic and shallow lake in China. J. Plankton Res. 2010, 32, 1023–1037. [Google Scholar] [CrossRef]
Figure 1. Sample region and respective Sentinel−2A image samples: (a) Xinxiang city area, Henan Province, China, with marked Sentinel−2A image sample region; (b) Sentinel−2A images of water body samples 1 to 11. Color tags in each imagery mark the location where reflectance values were taken in the satellite imagery using 3 × 3 matrices except for small rivers.
Remotesensing 14 05289 g001aRemotesensing 14 05289 g001b
Figure 2. Reflectance values of different water bodies in all Sentinel-2 wavebands apart from B1, B8A, and B10.
Remotesensing 14 05289 g002
Figure 3. Distribution of reflectance values per water sample for all Sentinel-2 bands used. The line drawn from the point of origin at the bottom right of the rectangular coordinate system to the top left separates two clusters of waterbodies with different features, as described above.
Remotesensing 14 05289 g003
Figure 4. Triangles of two different water bodies: (a) Type I water bodies, (b) Type II water bodies. The ordinate y shows average values of the difference between the maximum and minimum reflectance values corresponding to bands for water body samples in each band of the Sentinel−2A image. The abscissa X represents spectral bands of Sentinel−2A. The dotted lines represent extension lines based on the reflectance values of the respective bands. A–H are intersections of bands and corresponding to the ordinate y.
Remotesensing 14 05289 g004
Figure 5. The results of water extraction using the TWI at three selected test sites. Sentinel-2 color composite bands 4, 3, 2 coded RGB. Google Earth Imagery: courtesy of Earth View.
Remotesensing 14 05289 g005
Figure 6. Results of extracted water bodies using the TWI method at different test sites. Sentinel-2A images of a small branch of (a) Lake Shuswap, acquired in September 2020, resampled to 10 m GSD. The river area is covered by snow and ice. (b) Comparison map used for the TWI. (c) Extracted water body based on thresholds. (d) Lungsiön Lake area covered by snow and ice. (e) Extracted water body. (f) Extracted water body superimposed on Google Earth imagery. Water bodies are marked by a green circle.
Remotesensing 14 05289 g006
Figure 7. Water extraction on multitemporal imagery based on the TWI method at different test sites. Sentinel-2A images are resampled to 10 m GSD. Color composites, bands 4, 3, 2 coded RGB.
Remotesensing 14 05289 g007
Figure 8. Comparison of water extraction results using seven different water indices at the Kellie Creek River site in Canada. Sentinel-2A color composite, bands 4, 3, 2 coded RGB. The red circles mark the areas where snow and shadows are present in the Sentinel-2 imagery.
Remotesensing 14 05289 g008
Figure 9. Comparison of water extraction results using seven different water indices at the Huangpu River site in Shanghai, China. Sentinel-2A color composite, bands 4, 3, 2 coded RGB.
Remotesensing 14 05289 g009
Figure 10. Comparison of water extraction results using seven different water indices at the United States test site. Sentinel-2A color composite, bands 4, 3, 2 coded RGB. The area of the red frame is used to test water bodies’ delineations.
Remotesensing 14 05289 g010
Figure 11. Comparative display of water extraction results based on five different methods. Sentinel-2A color composite bands 4, 3, 2 coded RGB. Red marked areas are regions of building shadows.
Remotesensing 14 05289 g011
Figure 12. Overall precision of all water body indices at each of the four test sites.
Remotesensing 14 05289 g012
Figure 13. Results of TWI’s kappa coefficient and overall precision at each of the four test sites.
Remotesensing 14 05289 g013
Table 1. Locations of studied water bodies and their typical characteristics.
Countries and Names of Water BodiesCenter Point Coordinates of Test Sites
(WGS84)
TopographyCharacteristics
Mongolia
Khar-Us Lake47.97°N, 92.22°EBasin predominantly flatFreshwater
pollution
United States
Tennessee River37.06°N, 88.51°WPredominantly flatNormal water
Canada
Kellie Creek50.65°N,117.78°WHills, rugged terrainNormal water
Shuswap Lake50.69°N, 119.05°WPredominantly flatRiver surrounded by snow and ice
China
Qinghai Lake36.90°N, 100.17°EPredominantly flatInland saltwater
East China Sea31.27°N, 121.92°EFlatMuddy water
Huangpu River31.02°N, 121.49°EFreshwater
Clear water
Yangtze River31.82°N, 121.15°EWater body including suspended matter
Sweden
Lungsiön Lake62.84°N, 16.24°ETerrain slopes from northwest to southeastWater covered by snow and ice.
Table 2. Parameter information of Sentinel-2A/B data. WR = wavelength range, GSD = original spatial resolution.
Bands and DescriptionWR/μmGSD/mMain Utility Conc. Water
Band 1—Blue Coastal Aerosol0.433–0.45360Aerosol monitoring
Band 2—Blue0.4575–0.522510Relative maximum for phytoplankton in band 3;
strong chlorophyll absorptions in bands 2 and 4
Band 3—Green0.5425–0.577510
Band—Red0.65–0.6810
Band 5—Vegetation Red Edge 1 (VRE 1)0.6975–0.712520Blue and red shift phenomenon;
iron rich sediments
Band 6—Vegetation Red Edge 2 (VRE2)0.7325–0.747520
Band 7—Vegetation Red Edge 3 (VRE 3)0.773-0.79320
Band 8—Near-Infrared (NIR)0.7845–0.899510Reduced reflectance peak of phytopigments; biomass
Band 8A—Near-Infrared (VRE 4)0.855–0.87520
Band 9—Water Vapor (WV)0.935–0.95560Water vapor monitoring
Band 10—Shortwave Infrared 1 (SWIR 1)1.36–1.3960Cirrus clouds detection
Band 11—Shortwave Infrared 2 (SWIR 2)1.565–1.65520Floating sediments, soils
Band 12—Shortwave Infrared 3 (SWIR 3)2.10–2.2820
Table 3. Description of Sentinel-2 scenes and corresponding reference data.
Test SiteSentinel-2 DataReference Image on GEE
Acquisition DataSeason
Mongolia AutumnGoogle Earth Map data @2021 imagery
@2021CNES/Airbus.
Khar-Us Lake30 October 2021
Canada AutumnGoogle Earth Map data @2021imagery@2021, CNES/Airbus, Landsat/Copernicus
Kellie Creek30 September 2021
China
Qinghai Lake30 October 2019AutumnGoogle Earth Map data @2021imagery @2021,CNES/Airbus, Landsat/Copernicus, Maxar Technologies
East China Sea30 December 2020AutumnGoogle Earth Map data @2021imagery @2021CNES/Airbus, Maxar Technologies
Huangpu River30 June 2021SummerGoogle Earth Map data @2021imagery, @2021CNES/Airbus, Maxar Technologies
Yangtze River09 June 2020SummerGoogle Earth Map data @2021imagery@2021, Maxar Technologies, USDA/FPAC/GEO
United States Winter
Tennessee River30 November 2019
Sweden30 November 2021WinterGoogle Earth Map data @2021 imagery @2021, Terra Metrics
Lungsiön Lake09 September 2020Autumn
Table 4. Results of the classification accuracy (kappa coefficient) for each of the four test sites.
Water Body IndexCanadaUnited StatesSwedenMongolia
Kappa Coeff.Kappa Coeff.Kappa Coeff.Kappa Coeff.
TWI0.9400.9290.9260.897
EWI0.9230.8730.9130.847
AWEI0.9290.9000.9160.845
LSWI0.9360.8950.9130.884
NDWI0.9360.9290.8820.857
MNDWI0.9360.9250.9230.884
Publisher’s Note: MDPI stays neutral with regard to jurisdictional claims in published maps and institutional affiliations.