Abstract
Spaceborne LiDAR altimetry has been demonstrated to be an essential source of data for the estimation and monitoring of inland water level variations. In this study, water level estimates from the Global Ecosystem Dynamics Investigation (GEDI) were validated against in situ gauge station records over Lake Geneva for the period between April 2019 and September 2020. The performances of the first and second releases (V1 and V2, respectively) of the GEDI data products were compared, and the effects on the accuracy of the instrumental and environmental factors were analyzed in order to discern the most accurate GEDI acquisitions. The respective influences of five parameters were analyzed in this study: (1) the signal-over-noise ratio (SNR); (2) the width of the water surface peak within the waveform (gwidth); (3) the amplitude of the water surface peak within the waveform (A); (4) the viewing angle of GEDI (VA); and (5) the acquiring beam. Results indicated that all these factors, except the acquiring beam, had an effect on the accuracy of GEDI elevations. Nonetheless, using VA as a filtering criterion was demonstrated to be the best compromise between retained shot count and water level estimation accuracy. Indeed, by choosing the shots with a VA ≤ 3.5°, 74.6% of the shots (after an initial filter) were retained with accuracies similar to choosing A > 400 (46.2% retained shots), SNR > 15 dB (63.3% retained shots), or gwidth < 10 bins (46.5% of retained shots). Finally, the comparison between V1 and V2 elevations showed that V2, overall, provided elevations with a more constant, but higher, bias and fewer deviations to the in situ data than V1. Indeed, by choosing GEDI shots with VA ≤ 3.5°, the unbiased RMSE (ubRMSE) of GEDI elevations was 27.1 cm with V2 (r = 0.66) and 42.8 cm with V1 (r = 0.34). Results also show that the accuracy of GEDI (ubRMSE) does not seem to depend on the beam number and GEDI acquisition dates for the most accurate GEDI acquisitions (VA ≤ 3.5°). Regarding the bias, a higher value was observed with V2, but with lower variability (54 cm) in comparison to V1 (35 cm). Finally, the bias showed a slight dependence on beam GEDI number and strong dependence on GEDI dates.
1. Introduction
In the last couple of decades, active remote sensing technologies such as radar or LiDAR based sensors have become an essential source of information for the monitoring of inland water body levels due to their validated high accuracies [1,2,3,4,5,6] and as a way to fill-in for the ever-decreasing water-level gauge stations that has been reported worldwide [7,8].
In this study, we are interested in evaluating the accuracy of the recently launched spaceborne-based full-waveform LiDAR sensor, the Global Ecosystem Dynamics Investigation (GEDI) on board the International Space Station (ISS). GEDI, which became operational in 2019, is equipped with three 1064 nm lasers with a pulse repetition frequency (PRF) of 242 Hz. One of the lasers’ power is split in two, and are hereafter referred to as coverage lasers, while the remaining two operate at full power, hereafter referred to as power lasers. These four lasers are equipped with beam dithering units (BDUs) that rapidly deflect the light by 1.5 mrads in order to produce eight tracks of data. The acquired footprints along the eight tracks are separated by 600 m across the track, and 60 m along the track, with a footprint diameter of 25 m. As the ISS is not maintained in a repeating orbit [9], the repeat cycle of GEDI acquisitions is not guaranteed. However, GEDI has the ability to be rotated up to six degrees, allowing the lasers to be pointed as much as 40 km on either side of the ISS’s ground track [9]. The echoed waveforms are digitized to a maximum of 1246 bins with a vertical resolution of 1 ns (15 cm), corresponding to a maximum of 186.9 m of height ranges, with a vertical accuracy over relatively flat, non-vegetated surfaces of ~3 cm [9].
The Advanced Topographic Laser Altimeter System (ATLAS) on board the Ice, Cloud and land Elevation Satellite (ICESat-2) is another spaceborne LiDAR system. ATLAS’s mission goals is to measure ice-sheet topography, cloud and atmospheric properties, and global vegetation. In contrast to GEDI, ATLAS is equipped with a single 532 nm wavelength laser (and one backup laser) that emits six beams (arranged into three pairs). Beam pairs are separated by ~3 km across-track with a pair spacing of 90 m. The nominal footprint of ATLAS is 17 m with a spacing interval of 0.7m along-track. Moreover, unlike GEDI, ATLAS uses a photon counting system rather than a full waveform system, and has the ability to detect single echoed photons. There have been many studies that assessed the accuracy of ICESat-2’s ATLAS water level estimation capabilities over different lakes around the world. In the study of Ryan et al. [10], ICESat-2 and for the first 12 months of data acquisition, provided good accuracy overall (±14.1 cm) over the 3712 global reservoirs that were studied with surface areas ranging from <1 to >10,000 km2. In the study of Madson and Sheng [11] over lakes and reservoirs in the continental United States found that ICESat-2 derived water levels were within ±25 cm of in situ gauge station measurements, and within ±5 cm for ~52% of ICESat-2 acquisitions. Finally, in the study of Frappart et al. [12], the accuracy of ICESat-2 to retrieve water levels was better than 6 cm (root mean squared error, RMSE) with a constant bias (0.42 ± 0.03) across ten of the largest lakes in Switzerland for the period between December 2018 and October 2019 based on data availability.
While ICESat-2 provides good accuracies for the estimation of water levels, GEDI could provide additional sources of information given the sporadic acquisitions made by ICESat-2 [13]. Nonetheless, since the launch of GEDI, there have been few studies that assessed its accuracy for the estimation of in-land water levels [4,12,14]. The first study conducted by Fayad et al. [4] used the first two months of GEDI acquisitions (mid-April to mid-June 2019) to assess the accuracy of GEDI altimetry over eight lakes in Switzerland. For these two months, they reported a mean difference between GEDI and in situ gauge water elevations (bias) ranging from −13.8 cm (under estimation) to +9.8 cm (over estimation) with a standard deviation (SD) of the bias ranging from 14.5 to 31.6 cm. The study conducted by Xiang et al. [14] over the five great lakes of North America (Superior, Michigan, Huron, Erie and Ontario) using five months of GEDI acquisitions (April to August 2019) found a bias ranging from −32 cm (under estimation) to 11 cm (over estimation) with a SD that ranged from 15 to 34 cm. Finally in the study of Frappart et al. [12], which assessed the accuracy of GEDI data over ten Swiss lakes using acquisitions spread over seven months (April to October 2019), they found a bias that ranged from −15 cm (under estimation) to +21 cm (over estimation) with a SD ranging from 10 cm to 30 cm.
There are several factors affecting the physical shape of the waveform and therefore the accuracy of LiDAR’s altimetric capabilities, however, these influences have been undetected with traditional filtering techniques used on GEDI acquisitions thus far. For example, the viewing angle at acquisition time was demonstrated to increase elevation errors for ICESat-1 GLAS when the viewing angle deviates from nadir due to precision attitude determination [15]. Water specular reflection is also another potential source of errors due to the saturation of the detector [16]. Finally, clouds and their composition are major factors that affect the quality of LiDAR acquisitions [17,18]. Indeed, and while opaque clouds attenuate the LiDAR signal, thus the receiver only captures noise, less opaque clouds allow the LiDAR to make a full round trip, but could potentially increase the photon path length due to forward scattering (atmospheric path delay), thus resulting in biases in elevation measurements [19]. Moreover, GEDI’s return signal strength will greatly vary between cloud-free shots and clouded acquisitions [17].
These potential sources of uncertainty in GEDI acquisitions have not been studied in depth in previous studies mostly due to the quantity of available GEDI acquisitions, which at most, have only covered acquired shots spread over seven months of acquisitions. Moreover, the Land Processes Distributed Active Archive Center (LP DAAC) recently released version two (hereafter referred to as V2) of the preprocessed GEDI data. Going forward, V2 will be the only data available from GEDI acquisitions (V1 is only available until September 2020). V2 should provide better geolocation (latitude, longitude, elevation) accuracy in comparison to the first release (hereafter referred to as V1) (mean horizontal geolocation error of 11.9 and 25.3 m for 95% of the data for V2 and V1 respectively). Nonetheless, improved elevation accuracies remain unknown up until now.
The objectives of this study are two-faceted. First, after a preliminary filtering scheme that removes the least viable GEDI shots over Lake Geneva (Switzerland), an in-depth analysis on the accuracy of the remaining GEDI acquisitions across several parameters affecting GEDI’s elevation estimation accuracy was conducted. The aim of this first objective is to provide a filtering scheme that allows for the detection of viable GEDI shots but do not provide enough vertical accuracy for hydrological studies without eliminating much of the available shots. The second objective was the assessment of the vertical accuracy of GEDI shots from the second release of GEDI data in comparison to the first release.
The rest of this paper is organized as follows. A description of the study site and datasets is given in Section 2, followed by the methodologies in Section 3. The results of the evaluation of GEDI elevations are given in Section 4, followed by a discussion in Section 5. Finally, the main conclusions are presented.
2. Study Area and Datasets
2.1. Study Area
This study was conducted over Lake Geneva (Figure 1), the largest lake by surface area and volume in Central Europe. Lake Geneva is located on the northern side of the Alps and is shared between Switzerland (60% of its surface) and France (40%). Overall, the lake has a surface are of 580 km2, with a maximum length of 72 km, and 15 km in width. The lake’s mean depth is 80 m, and reaches a maximum depth of 310 m in the broad portion between Évian-les-Bains and Lausanne in France.
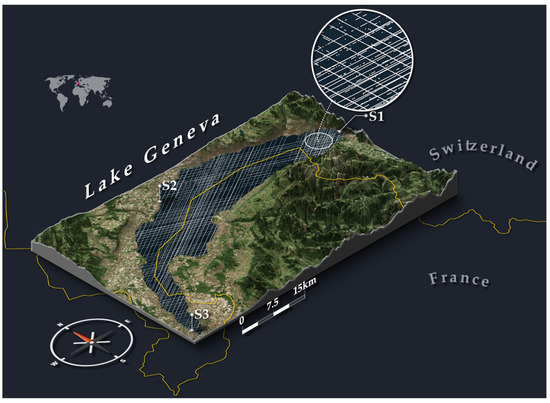
Figure 1.
Distribution of the 51,807 GEDI shots (white points) after filtering of the GEDI dataset over Lake Geneva. The yellow lines represent country borders.
2.2. In Situ Water Levels
Water level records from in situ gauge stations over Lake Geneva were obtained from the Hydrology Department of the Federal Office for the Environment (FOEN) (www.hydrodaten.admin.ch, accessed on 10 January 2022). FOEN currently monitors the quantity and quality of surface water and groundwater through a network of 260 gauging stations across Switzerland. In this study, water level readings were obtained from three stations that monitor Lake Geneva. These stations are Chillon (ID 2026, S1 Figure 1), St-Prex (ID 2027, S2 Figure 1), and Sécheron (ID 2028, S3 Figure 1). Correspondence between gauge station measurements and GEDI footprints was based on the distance between the GEDI shot and its nearest station. This simple correspondence was used as the difference between two station measurements at any given time did not exceed 5 cm. Finally, time difference between gauge station measurements and GEDI acquisitions was at most 10 min.
2.3. GEDI Data
Two GEDI data products were used in this study, the level 1B (L1B), and level 2A (L2A). The L1B data product contains detailed information about the transmitted and received waveforms, the location and elevation of each waveform footprint, and other ancillary information such as mean and standard deviation of the noise, and acquisition time. The L2A data product contains the elevation data and height metrics of the vertical structures within the waveform. For both the L1A and L2B, we downloaded both release versions V1 (L1B: [20], L2A: [21]) and V2 (L1B: [22], L2A: [23]) from the LC DAAC. The dataset comprises 44 acquisition dates over Lake Geneva, spanning from April 2019 until September 2020 (available GEDI datasets in both V1 and V2). For each acquisition date, GEDI acquires data over eight parallel tracks, where the first four tracks (henceforth referred to as beams and numbered 0 through 3) correspond to the data acquired by the coverage lasers, and the remaining four track acquisitions (beams 4 through 7) correspond to acquisitions by the two full power lasers.
3. Methodology
3.1. GEDI Data Preprocessing
In order to extract the relevant parameters for water level retrieval from the acquired GEDI waveforms, a series of processing steps were conducted by the LC DAAC. First, in order to reduce the noise in the signal, the received waveforms were smoothed using a Gaussian filter with a width of 6.5 ns (97.5 cm) [9]. Next, to determine the position of the relevant reflecting objects (e.g., the open water surface) within the footprint, a second Gaussian filter was applied to the waveforms, and the first derivative of the waveform was calculated. Finally, the position of the objects, which is represented by distinct peaks or modes within the waveform [18], was determined by finding each zero crossing of the calculated first derivative [9].
Currently, the extracted GEDI waveform-derived parameters (hereafter referred to as metrics) are issued using six different settings groups or algorithms (a1 to a6), representing different threshold and smoothing settings applied to the waveforms. The values of the thresholds for each algorithm are presented in Appendix A. In this study, we extracted the metric values from the L2A dataset calculated from each of the six algorithms.
For both versions (V1 [20] and V2 [22]) of the L1B dataset, we first extracted the geolocation of the ground peak from the waveforms (latitude, longitude, and elevation). The latitude, longitude, and elevation correspond to the latitude, longitude, and elevation of the lowest detected mode in the L2A dataset (i.e., surface return). Over water surfaces, in general, the waveforms are unimodal in shape (Figure 2a), and as such, the lowest detected return corresponds to the only detected peak in the waveform. We also extracted from the l2A dataset and from both versions of the product releases V1 [21], and V2 [23], the width and amplitude of the water surface mode using respectively the variables rx_gwidth (hereafter referred to as gwidth) and zcross_amp (hereafter referred to as A). A corresponds to the amplitude of the smoothed waveform’s lowest detected mode while gwidth is the width of the Gaussian fit of the received waveform. Six possible values of A are present in the L2A dataset due to the different algorithms used, therefore, all possible values of A were extracted. Next, the viewing angle (VA) and the signal-to-noise ratio (SNR) were calculated for each waveform. The viewing angle was calculated for each shot (s) using the following formula:
where is the haversine distance between the location of an acquired GEDI shot (s) and the location of the GEDI instrument (i) projected at nadir onto the WGS84 reference ellipsoid and ai is the altitude of GEDI instrument over the referenced ellipsoid at acquisition time of shot s. The location of the GEDI instrument for each acquired waveform was extracted from the latitude_instrument and longitude_instrument variables in the L1B dataset, while its altitude was extracted from the altitude_instrument variable. VA is expressed in degrees (°).
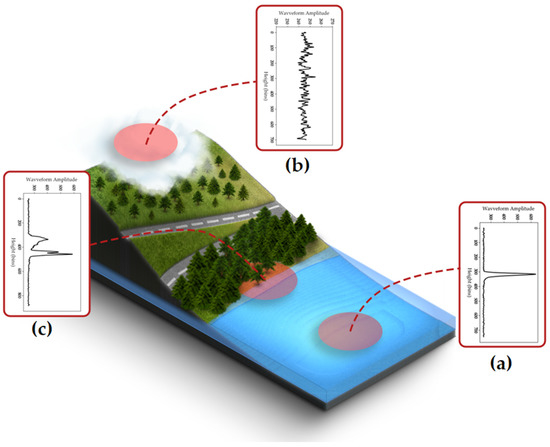
Figure 2.
Example of three acquired GEDI waveforms: (a) over water surface, (b) in the presence of clouds, and (c) at the limit between water and the shoreline.
The SNR was calculated based on the formulation of Nie et al. [24], and is defined as:
where Amax is the maximum amplitude within an acquired waveform; µn is the mean background noise; and σn is the standard deviation of the background noise. Amax is defined as the maximum of up to 19 possible values of rx_modeamps available in the L2A dataset. rx_modeamps correspond to the amplitude of each detected mode within the waveform. µn and σn are defined in the L1B data product by the variables mean and stddev, respectively. SNR is expressed in dB.
Finally, the number of detected modes was also extracted from the num_detectedmodes variable in the L2A data product.
3.2. GEDI Data Filtering
Within the period between April 2019 and September 2020, GEDI acquired 92,414 shots spread over 44 dates over Lake Geneva. Nonetheless, not all shots were usable since LiDAR signals can be affected by atmospheric conditions (e.g., the presence of opaque and thick clouds [17]) that attenuate the LiDAR signal. Therefore, to remove non-viable shots, several filters were applied:
- First, since a footprint acquired over a water surface should only have a single return or mode, as such, all acquired GEDI shots with a number of detected modes different from one () were removed. Waveforms with zero detected modes (Figure 2b, ~42% of acquired waveforms) correspond mostly to noisy acquisitions due to cloud presence. In fact, all these acquisitions had a SNR of zero (in linear mode), indicating waveforms consisting of only noise. Conversely, waveforms with num_detectedmodes >1 (Figure 2c) are mainly shots acquired near the lake’s shore (land–water limit) or ports (e.g., presence of boats). Therefore, only 980 shots with more than one detected modes were removed.
- After the application of the first filter, a second filter was applied that removed the shots having an elevation difference to the SRTM DEM of more than 100 m. This filter removed an additional 870 shots.
For this study, after the application of the previously mentioned filters, 51,807 shots were retained and used, or around 56% of all the acquired shots.
Finally, given that gauge station levels are provided with respect to the Swiss height measurement system (LN02), and the water levels derived from GEDI are geolocated with respect to the WGS84 ellipsoid, conversion of the GEDI reported elevations with respect to the Swiss height measurement system (LN02) was necessary. This conversion was made using the REFRAME geodesic web service provided by the Swiss federal office of topography (swisstopo, https://www.swisstopo.admin.ch/en/maps-data-online/calculation-services/reframe.html accessed on 10 January 2022).
3.3. GEDI Elevation Evaluation Strategy
The accuracy of GEDI elevations over water surfaces were evaluated for both data product releases V1 and V2 using four metrics: (1) the mean elevation difference (bias) between GEDI and in situ elevations; (2) the unbiased root mean squared error (ubRMSE); (3) the root mean squared error (RMSE); and (4) the Pearson correlation coefficient (r). ubRMSE, RMSE, and r are defined as follows:
where is the in situ elevation and is the GEDI elevation.
where is the in situ elevation and is the GEDI elevation.
where and represent respectively in situ and the mean of in situ elevations, and and represent the GEDI and the mean of GEDI elevations, respectively.
The analysis of GEDI’s elevation accuracy was conducted as a function of the acquisition beam, viewing angle (VA), width (gwidth), and amplitude (A) of the water surface return, and finally the SNR, as defined earlier. The distribution (in percentage) of the GEDI shots as a function of SNR, VA, and, A, and gwidth are shown respectively in Figure 3a–d. The GEDI database resulting from the filtering mostly had a SNR between 10 and 25 dB, a VA between 0 and 3°, amplitude (A) between 300 and 700, and a gwidth between 5 and 15 bins (Figure 3).
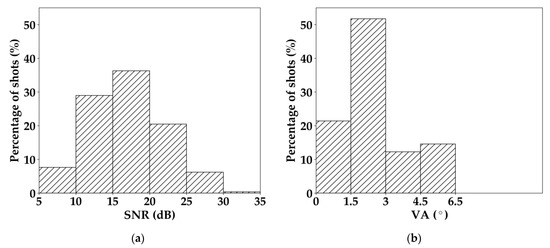
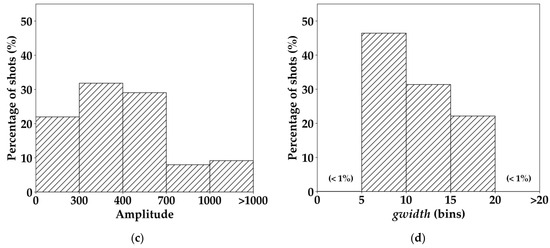
Figure 3.
Distribution of GEDI shots according to SNR (a), VA (b), Amplitude A (c), and gwidth (d). One (1) bin corresponds to 15 cm.
The values of the previously mentioned metrics (SNR, VA, A, and gwidth) were extracted using algorithm a1 as it showed the highest accuracy among the six possible algorithms in the study conducted by Fayad et al. [4] over several lakes in Switzerland including Lake Geneva. Next, an analysis of GEDI elevations using metric values extracted from the remaining algorithms (a2 to a6) was made more succinctly in comparison to a1.
4. Results
4.1. V1 and V2 Elevation Differences
Using the 51,807 selected shots following the approach presented in Section 3.2, we observed that elevations acquired from algorithm a1 in the first released version (V1) had a bias (resp. ubRMSE) to in situ elevations of 32.9 cm (resp. 66.2 cm). In contrast, for the second release (V2), the bias increased to 71.1 cm (resp. 68.9 cm). While the ubRMSE was relatively similar (66.2 cm vs. 68.9 cm) for both releases (V1 and V2), the ubRMSE from V1 was higher than what was previously obtained in Fayad et al. [4] (ubRMSE between ~14 and ~31 cm) and Frappart et al. [12] (ubRMSE between ~10 and ~30 cm) using smaller subsets of V1 over Lake Geneva. Therefore, an in-depth analysis of these differences as a function of different acquisitions parameters (amplitude (A) and width (gwidth) of the surface return mode, SNR, and VA) is required.
In addition, Figure 4 shows that the difference between GEDI V1 and in situ elevations was not well correlated to the difference between GEDI V2 and in situ elevations (r = 0.33). It can be seen that some of GEDI’s elevations were quite close when comparing the V1 and V2 versions while others were generally higher with V2 than with V1 (the dots on the upper part of Figure 4). Indeed, within a 0.5 standard deviation (±0.5 σ) of the mean difference between V2 and V1 elevations (Figure 4, Table 1), the correlation between V2 and V1 elevations (64.8% of the data) was 0.92, with V2 presenting higher bias to in situ data in comparison to V1 (bias = 53.1 cm for V2 and 27.5 cm for V1). For ±1σ (86.6% of the data, Figure 4, Table 1), the correlation between V2 and V1 elevations decreased to 0.85 with similar bias as the data within ±0.5σ. Finally, for ±4σ (99.8% of the data, Figure 4, Table 1), the correlation between V1 and V2 elevations was 0.34, with V2 presenting a significantly higher bias than V1 (70.5 cm vs. 33.0 cm).
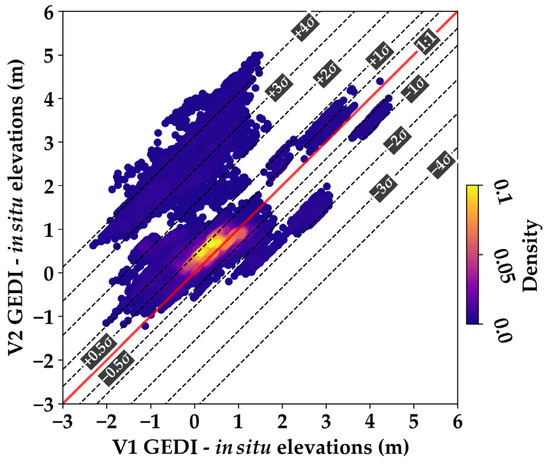
Figure 4.
Difference between GEDI V2 and in situ elevations as a function of the difference between GEDI V1 and in situ elevations. Each dot in the figure corresponds to a GEDI shot that was retained after the application of the approach presented in Section 3.2. σ is the standard deviation of the mean difference between V2 and V1 elevations.

Table 1.
Summary statistics of the difference between V2 GEDI-in situ elevations and V1 GEDI-in situ elevations. σ is the standard deviation of the mean difference between the V2 and V1 elevations.
The analysis of the precision of GEDI acquisitions by date showed that for three acquisition dates (20 February, 07 July, and 17 July 2020), a higher bias (mean elevation difference between GEDI and in situ elevations) was observed in comparison to the remaining acquisitions. For the remaining dates, the bias varied between -1 and +1 m (Figure 5a). The analysis of ubRMSE showed values lower than 0.5 m except for seven dates in 2020 where high ubRMSE values were observed (20 February, 07 July, 19 July, 22 July, 25 July, and 18 August 2020). Moreover, for most of these dates, the ubRMSE from V1 was higher than that of V2 (Figure 5b).
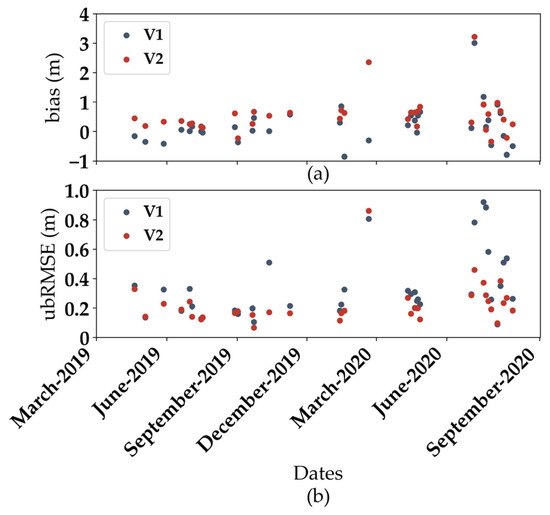
Figure 5.
Mean difference between GEDI and in situ elevations of V1 and V2 product releases according to GEDI acquisition dates (bias, (a)) and the unbiased root mean squared error of GEDI elevations (ubRMSE, (b)).
4.2. Accuracy Analysis According to GEDI’s Water-Surface Return Amplitude (A)
In this section, the accuracy of GEDI elevations is analyzed according to the amplitude of the water-surface mode within the waveform for five amplitude (A) ranges: A < 300; 300 ≤ A < 400; 400 ≤ A < 700; 700 ≤ A < 1000; and A ≥ 1000. The results presented in Figure 6 show that the ubRMSE of GEDI to in situ elevations decreased with increased A for both product releases V1 and V2. For V2, the ubRMSE decreased from 117.3 cm for A < 300 to 24.5 cm for A > 1000. For the V1 release, the ubRMSE decreased from 94.0 cm for A < 300 to 36.6 cm for A > 1000 (Table 2). The most accurate results for A > 400 corresponded to 46.2% of the shots and this for both V1 and V2. For A > 400, the ubRMSE for V1 was 40.4 cm and 25.7 cm for V2. This result shows an improvement in the vertical precision of GEDI in the second release of the data products by 14.7 cm in comparison to V1. Moreover, for A < 300, the second release of GEDI data did not show any improvements in the elevation accuracy of the acquisitions. Indeed, for low A values (A ≤ 300), the difference between GEDI V2 and in situ elevations varied between −1.2 and 5.0 m (resp. −2.0 and 4.4 m for V1). This difference decreased with the amplitude. These results show low performances for hydrological applications in the case of low amplitudes (ubRMSE close to 1 m for both V1 and V2).
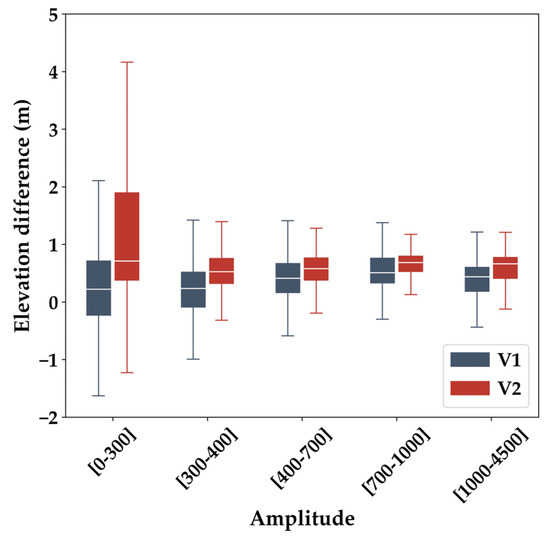
Figure 6.
Difference between GEDI and in situ elevations as a function of the amplitude of the water-surface mode. V1 and V2 refer respectively to GEDI elevations from the first and second data releases.

Table 2.
Summary statistics of the difference between GEDI and in situ elevations according to the five classes of the GEDI water-surface mode amplitude (A).
Regarding the bias (mean difference between GEDI and in situ elevations), the results showed an increased bias with V2 for A < 300 (116.7 cm). Nonetheless, it decreased for A > 300, and ranged between 56.0 and 64.1 cm, with an average of 58.4 cm. For V1, the bias varied greatly based on A, and ranged between 18.5 cm and 52.7 cm, with an average of 32.9 cm. Nonetheless, for all A values, V2 showed on general higher bias than V1.
4.3. GEDI Elevation Accuracy Analysis According to SNR
In this section, the accuracy of GEDI elevations were analyzed according to waveform SNR for four SNR ranges: SNR < 10 dB; 10 dB ≤ SNR < 15 dB; 15 ≤ SNR < 20; and SNR ≥ 20. According to Equation (2), SNR is highly correlated with the waveform’s amplitude. Nonetheless, given that a signal’s SNR is also affected by the noise levels (e.g., atmospheric perturbations in the case of LiDAR waveforms), it is necessary to study the effects of SNR on the acquired waveforms.
Figure 7 shows that the deviation of the reported elevations by GEDI decreased with increased SNR. Indeed, lower differences were obtained in general with waveforms with a SNR higher than 15 dB (63.4% of shots that remained after the filter detailed in Section 3.2) in comparison to waveforms with lower SNR. These results were observed for both the first (V1) and second release (V2) of the GEDI data products. Moreover, the results reported in Table 3 show that the ubRMSE for SNR > 15 dB was 28.4 cm for V2 in comparison to 43.2 cm for V1.
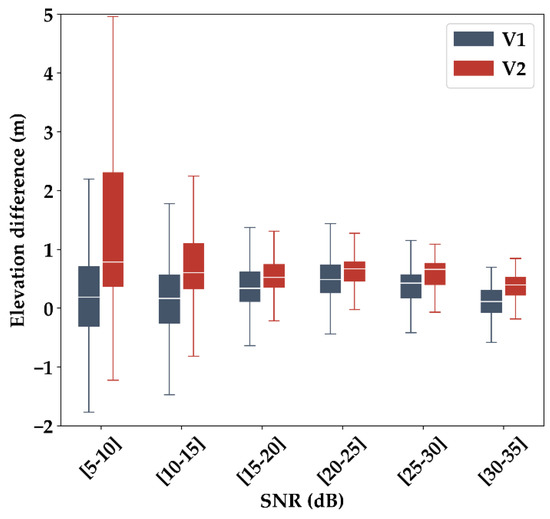
Figure 7.
Difference between GEDI and in situ elevations as a function of waveform SNR. V1 and V2 refer to GEDI elevations from the first and second data releases, respectively.

Table 3.
Summary statistics of the difference between GEDI and in situ elevations according to the four classes of the waveform’s signal-to-noise ratio (SNR).
Therefore, by comparison to the results obtained as a function of the amplitude (A), we can observe that choosing a SNR threshold of 15 dB as a selection criteria for waveforms with the most accurate elevations would yield an increase of 17% of the total number of retained shots (63.4% of shots kept with SNR > 15 dB vs. 46.2% of shots kept for A > 400). Moreover, these additional 17% more shots would only increase the ubRMSE by 3 cm (e.g., ubRMSE increased from 25.7 to 28.4 cm). For the shots with a SNR less than 15 dB, V2 did not show increased precision in comparison to V1, and both releases showed imprecise elevations with an ubRMSE close to 100 cm.
Finally, in terms of bias, the V2 release showed a bias that decreased from 133.8 cm for SNR < 10 dB to 86.3 cm for SNR between 10 and 15 dB, and reached a minimum of 56.8 cm for SNR higher than 15 dB. In contrast with the first release (V1), the correlation between the bias and SNR was less evident, and varied between 19.8 and 46.3 cm depending on the range of the analyzed SNR (Table 3).
4.4. Elevation Accuracy Analysis According to gwidth
The analysis of the accuracy of GEDI elevations with respect to gwidth showed that the smallest deviations to the in situ measurements were obtained when gwidth values were the lowest (gwidth < 10 bins, Figure 8). For gwidth < 10 bins, the ubRMSE was 33.6 cm with V2 and 44.1 cm with V1, and increased with increasing gwidth (Table 4). Moreover, the percentage of GEDI acquisitions with gwidth < 10 bins was 46.5%. Therefore, gwidth is not a good filtering criterion in comparison to SNR or A, as it removed an additional 20% of GEDI shots without significantly increasing the accuracy.
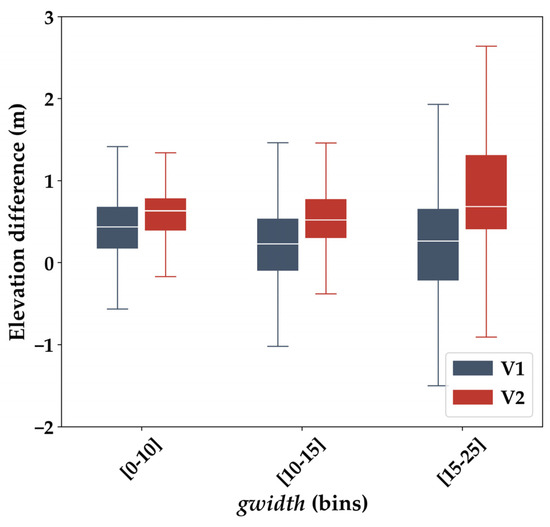
Figure 8.
Difference between GEDI and in situ elevations as a function of gwidth. V1 and V2 refer to GEDI elevations from the first and second data releases, respectively.

Table 4.
Summary statistics of the difference between GEDI and in situ elevations according to the three classes of gwidth.
Concerning the bias, the analysis showed that it increased with increasing gwidth for V2, and decreased with increasing gwidth for V1 (Table 4)
4.5. Analysis According to the Viewing Angle (VA)
In this section, we analyzed the effects of the VA on the accuracy of the elevations of the acquired GEDI elevations. The analysis was conducted over four VA ranges: VA < 1.5°; 1.5° ≤ VA < 3.5°; 3.5° ≤ VA 4.5°; and VA ≥ 4.5° (between 4.5° and 6.5°).
The results presented in Figure 9 show that the ubRMSE of GEDI elevations increased with increasing VA, and this was observed for both GEDI data product releases V1 and V2. For VA less than 1.5°, the ubRMSE was similar for both V1 and V2 (26.6 cm for V1 and 23.4 cm for V2, Table 5). For the shots acquired with a VA between 1.5° and 3.5°, the ubRMSE with V2 was smaller than V1 with an ubRMSE of 23.9 cm for V2 and 44.8 cm for V1. Finally, for both V1 and V2, the ubRMSE increased to around 1 m with viewing angles greater than 3.5°. In fact, the points that are in the upper left part of Figure 4 (shots with higher bias with V2) correspond to acquisitions with a viewing angle (VA) larger than 3.5°.
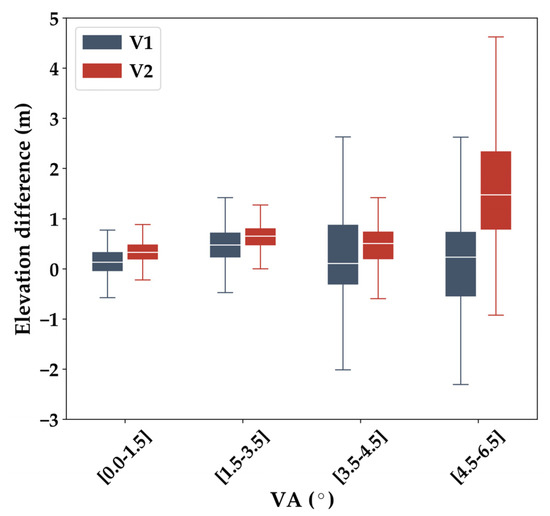
Figure 9.
Unbiased root mean squared error of GEDI elevations (ubRMSE) as a function of GEDI’s viewing angle (VA).

Table 5.
Summary statistics of the difference between GEDI and in situ elevations according to the four classes of the GEDI’s viewing angle (VA).
A total of 74.6% of filtered GEDI data were acquired with a VA less than 3.5° and had an ubRMSE of 42.8 cm for V1 and 27.1 cm for V2. As such, the VA seems to be the criterion with the best compromise between the number of retained GEDI shots and accuracy in comparison to A (46.2% retained shots and ubRMSE of 25.7 cm), SNR (63.3% retained shots and ubRMSE of 28.4 cm), and gwidth (46.5% of retained shots and ubRMSE of 33.6 cm).
Using the following filtering criteria: VA < 3.5°, A > 400, SNR > 15 dB, and gwidth < 10 bins, the calculated ubRMSE over the 42.1% of the GEDI shots that satisfy this filtering criteria was 39.3 cm with V1 and 25.3 cm with V2. This figure is only marginally better than the ubRMSE of 27.1 cm obtained by filtering V2 GEDI data according to VA < 3.5° only (ubRMSE of 42.8 cm with V1). However, using the four previously mentioned criteria, an additional 32.5% of shots were eliminated in comparison to only filtering using VA < 3.5°. In conclusion, it is sufficient to apply only the filter on the viewing angle (VA < 3.5°) because the accuracy does not improve by adding other criteria while the number of shots maintained in the database is reduced by half (from 74.6% to 42.1% of GEDI shots). Figure 9 shows that the ubRMSE increased with GEDI VA for both V1 and V2 products. The results also showed that the correlation between ubRMSE and VA were significantly lower for V2 in comparison to V1.
Concerning the mean elevation difference (bias) between GEDI and in situ elevations, we observed an increase in the bias for V2 when VA increased. It increased from 33.9 cm for VA < 1.5° to 162.4 cm for VA between 4.5° and 6.5° (Table 5). For the V1 product, the bias seemed to depend less than V2 on the viewing angle (fluctuates between 12.7 cm and 43.5 cm).
4.6. Analysis According to GEDI’s Beam Number
In this section, we analyzed the accuracy of GEDI shots based on their beam number. Moreover, only shots with a VA less than 3.5° (74.6% of the shots) were considered in the analysis. The results presented in Table 6 show that the ubRMSE is independent of the beam number for V2 with an ubRMSE between 24.3 and 27.6 cm. For V1, similar results were observed (independence of accuracy on the beam number). However, for V1, the ubRMSE was higher and ranged between 34.7 cm and 41.8 cm. Finally for both V1 and V2, the results showed that waveforms acquired with favorable acquisition conditions (high SNR) or a small viewing angle had almost the same accuracies regardless of whether they were acquired with the coverage laser (beams 0 to 3) or the full power lasers (beams 4 to 7).

Table 6.
Summary statistics of the difference between GEDI and in situ elevations according to the acquiring GEDI beam.
Regarding the bias, the results presented in Table 6 show that the bias from the second release of the GEDI data products were less dependent on the beam than those in the initial release (V1). In fact, the bias varied between 43.0 and 64.6 cm according to the beam number for V2 and between 15.8 and 68.2 cm for V1 (Table 6).
4.7. Analysis of the Results Based on Processing Algorithms a2 to a6
The configuration settings of algorithms a1 to a6 (Appendix A) showed differences mainly between a1 and a2, while the remaining settings groups were either close to a1 or a2. Therefore, by analyzing the 51,808 GEDI shots preprocessed using a2 and filtered using the filtering scheme described in Section 3.2, the results indicate that a1 provides slightly better accuracies than a2 (less than 2 cm in terms of ubRMSE for both V1 and V2). Moreover, the mean elevation difference between GEDI and the in situ measurements (bias) was slightly higher with a2 than a1 for both V1 and V2. In fact, the bias increased from 32.9 to 38.5 cm with a2 using V1 data, and from 71.2 to 76.8 cm with a2 using V2 data.
By using the most accurate GEDI data (VA ≤ 3.5°, 74.6% of remaining shots), the ubRMSE increased from 27.1 cm for (a1, V2) to 33.2 cm for (a2, V2), and from 42.8 cm for (a1, V1) to 44.4 cm for (a2, V1). As such, the results showed that the second release (V2) of the GEDI data products is more precise than V1 in terms of elevation estimation, and the waveforms processed using the configuration settings group a1 were slightly better than a2. The bias calculated on the dataset with GEDI VA lower than 3.5° showed a value higher by about 5 cm with a2 compared to the one observed with a1.
Regarding algorithm a4, the obtained accuracies on the elevations were identical to those obtained with a1, and for both V1 and V2. For algorithms a3 and a6, respectively 83 and 395 shots showed lower elevations (between 2 to 15 m) in comparison to a2, the elevation of the remaining shots were identical. Finally, the elevations obtained using algorithm a5 were identical to those obtained with a2 and for both data releases (V1 and V2) except for 4123 shots that were magnitudes lower (2 to 158 m difference) in elevation with a5 in comparison to a2.
5. Discussion
In our analysis, the most prominent filter that allows selecting the most accurate GEDI acquisitions without eliminating many shots is based on the viewing angle of the GEDI instrument. Nonetheless, this parameter was found to be correlated to the other studied parameters (e.g., A, gwidth, and SNR). Indeed, Figure 10a,b show that the shots acquired with a VA higher than 3.5° had respectively lower amplitudes and lower SNR. Moreover, a weak correlation was found between VA and gwidth given that the shots acquired at lower VA could frequently have higher gwidth (Figure 10c).
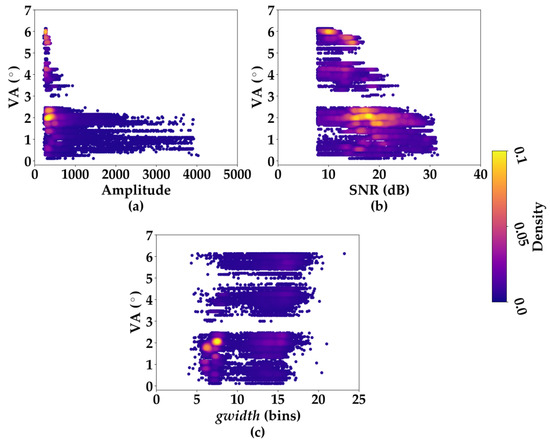
Figure 10.
GEDI’s viewing angle (VA) as a function of Amplitude (a), SNR (b), and gwidth (c).
The analysis of the values of A, SNR, and VA according to GEDI’s acquisition dates showed that the dates with the highest differences between GEDI and in situ elevations corresponded to one or more of the following reasons: low A (Figure 11a), low SNR (Figure 11b), and high VA (Figure 11c). Moreover, the ubRMSE was also higher for dates with low A, SNR, or VA. Finally, gwidth not shown here did not show particularly high values for certain dates.
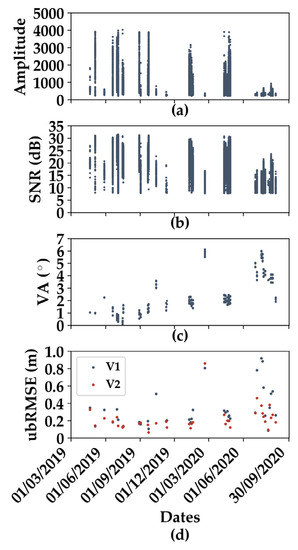
Figure 11.
Distribution of amplitude (a), SNR (b), VA (c), and ubRMSE (d) for each acquisition date.
Overall, the second release of the GEDI data products (V2) seemed to provide better elevation precision (lower ubRMSE) in comparison to V1 but lower accuracy (higher bias). For VA ≤ 3.5°, V1 provides slightly lower root mean squared errors in comparison to V2, which are 0.55 m and 0.60 m, respectively. The elevation accuracy provided by the coverage lasers or the full power lasers were also within the same magnitudes in V2 in comparison to V1, which showed more deviations according the acquiring beam. Therefore, in order to increase the accuracy (i.e., by decreasing the bias) of V1 and V2, we propose subtracting the observed mean differences between GEDI and the in situ elevations for V1 (bias of 34.7 cm) and V2 (bias of 54.4 cm). After subtracting the bias from V1 and V2, the results presented in Figure 12 show that on average, the reported elevations by V2 (RMSE = 27.0 cm, r = 0.66) were more accurate than those provided by V1 (RMSE = 42.7 cm, r = 0.34) for GEDI shots with VA ≤ 3.5°.
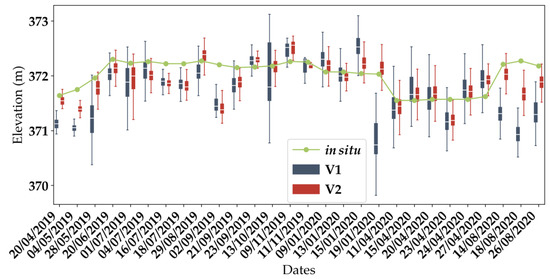
Figure 12.
Box-whiskers plot by date of the estimated elevations by GEDI’s first (blue) and second (red) data product releases. The green line represents in situ elevations. For each date, the V1 and V2 box plot locations were moved to 12 h before and 12 h respectively after the acquisition for better visibility.
The ubRMSE does not seem to depend on beam number for the most accurate GEDI acquisitions (VA ≤ 3.5°) (Table 5), and ubRMSE appears to show a very weak dependence on the acquisition dates (ubRMSE ranged from 6.6 to 32.9 cm according to GEDI date). Conversely, the bias showed a strong dependence on GEDI dates (bias ranged from −23.5 to +84.7 cm).
In addition to the previously mentioned factors adding to the uncertainties of the estimated GEDI elevations, several additional factors such as standing waves (seiches), and wind-generated waves that are commonly present over Lake Geneva are also an additional source of errors due to the relatively small size of GEDI’s footprints [25,26]. Indeed, Fayad et al. [4] showed that the 25 m GEDI footprints could be affected by water surface variations.
6. Conclusions
In this study, GEDI’s ability to measure and monitor water levels was assessed against in situ water levels across Lake Geneva in Switzerland. Both GEDI’s data-product release versions V1 and V2 were used. The assessment was performed as a function of several factors affecting the physical shape of the waveform, and could thus potentially introduce uncertainties in the estimated elevations. Five factors were analyzed: (1) the signal-over-noise ratio (SNR), (2) the width of water surface peak (gwidth), (3) the amplitude of the water surface peak (A), (4) the viewing angle of GEDI (VA), and (5) The acquiring beam. The goal of this analysis is two folds. First, it allows the understanding of the impact of each of these factors on the elevation estimation accuracy, and second, it provides filtering criteria by which only the most accurate GEDI shots could be retained. The analysis results showed that the best criterion to filter less accurate GEDI waveforms is based on the viewing angle (VA). Indeed, for acquisitions with VA higher than 3.5°, the ubRMSE was 2.5 times higher than acquisition with VA less than 3.5°. Moreover, choosing VA as a filtering criterion allows us to retain close to 75% of shots (after the initial filters which eliminated near 44% of all available acquisitions) without a significant decrease in accuracy compared to 46.2% of the shots with A > 400, 63.6% of shots with SNR > 15 dB, and 46.5% of shots with gwidth < 10 bins. Finally, the comparison between V1 and V2 elevations showed that V2 provides a better precision of water levels. Indeed, by choosing GEDI shots with VA ≤ 3.5°, the ubRMSE was 27.1 cm with V2 and 42.8 cm with V1. Nonetheless, V2 elevations had higher bias (i.e., less accuracy) than V1, with a bias of 54 and 35 cm, respectively.
Author Contributions
I.F.: Conceptualization, methodology, software, validation, formal analysis, data curation, visualization, writing—original draft. N.B.: Conceptualization, methodology, validation, formal analysis, data curation, writing—original draft. F.F.: Conceptualization, methodology, validation, formal analysis, data curation, writing—original draft. All authors have read and agreed to the published version of the manuscript.
Funding
This research received funding from the French Space Study Center (CNES, TOSCA 2021 project), the Research Infrastructure IR Data Terra, and the National Research Institute for Agriculture, Food, and the Environment (INRAE).
Data Availability Statement
GEDI data were obtained from the LP DAAC (https://e4ftl01.cr.usgs.gov/GEDI/, accessed on 22 September 2021). In situ water levels were obtained from the Hydrology Department of the Federal Office for the Environment (FOEN) (www.hydrodaten.admin.ch, accessed on 22 September 2021).
Acknowledgments
The authors would like to thank the GEDI team and the NASA LPDAAC (Land Processes Distributed Active Archive Center) for providing the GEDI data. The authors would also like to thank the Swiss Federal Office for the Environment (FOEN) for providing the national gauge database.
Conflicts of Interest
The authors declare no conflict of interest.
Appendix A

Table A1.
The different parameters used in each of the six algorithms for the interpretation of the received waveforms. Smooth_width is the width used for the first Gaussian filter. Smoothwidth_zcross is the width of the Gaussian filter used before the first order derivative of the waveform to detect the modes. Front_threshold and Back_threshold are the thresholds used to find the signal start and signal end, respectively.
| Algorithm | Smooth Width | Smoothwidth_Zcross | Front_ Threshold | Back_ Threshold |
|---|---|---|---|---|
| 1 | 6.5 | 6.5 | 3 | 6 |
| 2 | 6.5 | 3.5 | 3 | 3 |
| 3 | 6.5 | 3.5 | 3 | 6 |
| 4 | 6.5 | 6.5 | 6 | 6 |
| 5 | 6.5 | 3.5 | 3 | 2 |
| 6 | 6.5 | 3.5 | 3 | 4 |
References
- Birkett, C.; Reynolds, C.; Beckley, B.; Doorn, B. From Research to Operations: The USDA Global Reservoir and Lake Monitor. In Coastal Altimetry; Vignudelli, S., Kostianoy, A.G., Cipollini, P., Benveniste, J., Eds.; Springer: Berlin/Heidelberg, Germany, 2011; pp. 19–50. ISBN 978-3-642-12795-3. [Google Scholar]
- Crétaux, J.-F.; Biancamaria, S.; Arsen, A.; Bergé-Nguyen, M.; Becker, M. Global Surveys of Reservoirs and Lakes from Satellites and Regional Application to the Syrdarya River Basin. Environ. Res. Lett. 2015, 10, 015002. [Google Scholar] [CrossRef] [Green Version]
- Abdallah, H.; Bailly, J.-S.; Baghdadi, N.; Lemarquand, N. Improving the Assessment of ICESat Water Altimetry Accuracy Accounting for Autocorrelation. ISPRS J. Photogramm. Remote Sens. 2011, 66, 833–844. [Google Scholar] [CrossRef] [Green Version]
- Fayad, I.; Baghdadi, N.; Bailly, J.S.; Frappart, F.; Zribi, M. Analysis of GEDI Elevation Data Accuracy for Inland Waterbodies Altimetry. Remote Sens. 2020, 12, 2714. [Google Scholar] [CrossRef]
- Normandin, C.; Frappart, F.; Diepkilé, A.T.; Marieu, V.; Mougin, E.; Blarel, F.; Lubac, B.; Braquet, N.; Ba, A. Evolution of the Performances of Radar Altimetry Missions from ERS-2 to Sentinel-3A over the Inner Niger Delta. Remote Sens. 2018, 10, 833. [Google Scholar] [CrossRef] [Green Version]
- Shu, S.; Liu, H.; Beck, R.A.; Frappart, F.; Korhonen, J.; Lan, M.; Xu, M.; Yang, B.; Huang, Y. Evaluation of Historic and Operational Satellite Radar Altimetry Missions for Constructing Consistent Long-Term Lake Water Level Records. Hydrol. Earth Syst. Sci. 2021, 25, 1643–1670. [Google Scholar] [CrossRef]
- Shiklomanov, A.I.; Lammers, R.B.; Vörösmarty, C.J. Widespread Decline in Hydrological Monitoring Threatens Pan-Arctic Research. Eos Trans. AGU 2002, 83, 13. [Google Scholar] [CrossRef]
- Hannah, D.M.; Demuth, S.; van Lanen, H.A.J.; Looser, U.; Prudhomme, C.; Rees, G.; Stahl, K.; Tallaksen, L.M. Large-Scale River Flow Archives: Importance, Current Status and Future Needs. Hydrol. Process. 2011, 25, 1191–1200. [Google Scholar] [CrossRef]
- Dubayah, R.; Blair, J.B.; Goetz, S.; Fatoyinbo, L.; Hansen, M.; Healey, S.; Hofton, M.; Hurtt, G.; Kellner, J.; Luthcke, S.; et al. The Global Ecosystem Dynamics Investigation: High-Resolution Laser Ranging of the Earth’s Forests and Topography. Sci. Remote Sens. 2020, 1, 100002. [Google Scholar] [CrossRef]
- Ryan, J.C.; Smith, L.C.; Cooley, S.W.; Pitcher, L.H.; Pavelsky, T.M. Global Characterization of Inland Water Reservoirs Using ICESat-2 Altimetry and Climate Reanalysis. Geophys. Res. Lett. 2020, 47. [Google Scholar] [CrossRef]
- Madson, A.; Sheng, Y. Automated Water Level Monitoring at the Continental Scale from ICESat-2 Photons. Remote Sens. 2021, 13, 3631. [Google Scholar] [CrossRef]
- Frappart, F.; Blarel, F.; Fayad, I.; Bergé-Nguyen, M.; Crétaux, J.-F.; Shu, S.; Schregenberger, J.; Baghdadi, N. Evaluation of the Performances of Radar and Lidar Altimetry Missions for Water Level Retrievals in Mountainous Environment: The Case of the Swiss Lakes. Remote Sens. 2021, 13, 2196. [Google Scholar] [CrossRef]
- Kropáček, J.; Braun, A.; Kang, S.; Feng, C.; Ye, Q.; Hochschild, V. Analysis of Lake Level Changes in Nam Co in Central Tibet Utilizing Synergistic Satellite Altimetry and Optical Imagery. Int. J. Appl. Earth Obs. Geoinf. 2012, 17, 3–11. [Google Scholar] [CrossRef]
- Xiang, J.; Li, H.; Zhao, J.; Cai, X.; Li, P. Inland Water Level Measurement from Spaceborne Laser Altimetry: Validation and Comparison of Three Missions over the Great Lakes and Lower Mississippi River. J. Hydrol. 2021, 597, 126312. [Google Scholar] [CrossRef]
- Urban, T.J.; Schutz, B.E.; Neuenschwander, A.L. A Survey of ICESat Coastal Altimetry Applications: Continental Coast, Open Ocean Island, and Inland River. Terr. Atmos. Ocean. Sci. 2008, 19, 1–19. [Google Scholar] [CrossRef] [Green Version]
- Lehner, B.; Döll, P. Development and Validation of a Global Database of Lakes, Reservoirs and Wetlands. J. Hydrol. 2004, 296, 1–22. [Google Scholar] [CrossRef]
- Fayad, I.; Baghdadi, N.; Riedi, J. Quality Assessment of Acquired GEDI Waveforms: Case Study over France, Tunisia and French Guiana. Remote Sens. 2021, 13, 3144. [Google Scholar] [CrossRef]
- Shu, S.; Liu, H.; Frappart, F.; Kang, E.L.; Yang, B.; Xu, M.; Huang, Y.; Wu, B.; Yu, B.; Wang, S.; et al. Improving Satellite Waveform Altimetry Measurements With a Probabilistic Relaxation Algorithm. IEEE Trans. Geosci. Remote Sens. 2021, 59, 4733–4748. [Google Scholar] [CrossRef]
- Yang, Y.; Marshak, A.; Palm, S.P.; Varnai, T.; Wiscombe, W.J. Cloud Impact on Surface Altimetry From a Spaceborne 532-Nm Micropulse Photon-Counting Lidar: System Modeling for Cloudy and Clear Atmospheres. IEEE Trans. Geosci. Remote Sens. 2011, 49, 4910–4919. [Google Scholar] [CrossRef]
- Dubayah, R.; Luthcke, S.; Blair, J.; Hofton, M.; Armston, J.; Tang, H. GEDI L1B Geolocated Waveform Data Global Footprint Level V001. 2020. distributed by NASA EOSDIS Land Processes DAAC. Available online: https://doi.org/10.5067/GEDI/GEDI01_B.001 (accessed on 10 January 2022).
- Dubayah, R.; Hofton, M.; Blair, J.; Armston, J.; Tang, H.; Luthcke, S. GEDI L2A Elevation and Height Metrics Data Global Footprint Level V001. 2020. distributed by NASA EOSDIS Land Processes DAAC. Available online: https://doi.org/10.5067/GEDI/GEDI02_A.001 (accessed on 10 January 2022).
- Dubayah, R.; Luthcke, S.; Blair, J.; Hofton, M.; Armston, J.; Tang, H. GEDI L1B Geolocated Waveform Data Global Footprint Level V002. 2021. distributed by NASA EOSDIS Land Processes DAAC. Available online: https://doi.org/10.5067/GEDI/GEDI01_B.002 (accessed on 10 January 2022).
- Dubayah, R.; Hofton, M.; Blair, J.; Armston, J.; Tang, H.; Luthcke, S. GEDI L2A Elevation and Height Metrics Data Global Footprint Level V002. 2021. distributed by NASA EOSDIS Land Processes DAAC. Available online: https://doi.org/10.5067/GEDI/GEDI02_A.002 (accessed on 10 January 2022).
- Nie, S.; Wang, C.; Li, G.; Pan, F.; Xi, X.; Luo, S. Signal-to-Noise Ratio–Based Quality Assessment Method for ICESat/GLAS Waveform Data. Opt. Eng 2014, 53, 103104. [Google Scholar] [CrossRef]
- Oesch, D.; Jaquet, J.-M.; Klaus, R.; Schenker, P. Multi-scale Thermal Pattern Monitoring of a Large Lake (Lake Geneva) Using a Multi-sensor Approach. Int. J. Remote Sens. 2008, 29, 5785–5808. [Google Scholar] [CrossRef] [Green Version]
- Lemmin, U.; D’Adamo, N. Summertime Winds and Direct Cyclonic Circulation: Observations from Lake Geneva. Ann. Geophys. 1996, 14, 1207–1220. [Google Scholar] [CrossRef] [Green Version]
Publisher’s Note: MDPI stays neutral with regard to jurisdictional claims in published maps and institutional affiliations. |
© 2022 by the authors. Licensee MDPI, Basel, Switzerland. This article is an open access article distributed under the terms and conditions of the Creative Commons Attribution (CC BY) license (https://creativecommons.org/licenses/by/4.0/).