Abstract
A waterlogging assessment framework based on the stormwater management model (SWMM), considering the microtopography, is proposed (taking into account the complexity of the underlying surface, which contains various micro-surface features within the Chinese ancient city site). We used the ancient city site of PuZhou as the study case and the framework is detailed in this paper. First, the land cover was classified by combining the analysis of UAVs and field surveys; subsequently, a revised sub-catchment division method considering the land cover was proposed to obtain more accurate and reliable sub-catchments; thirdly, the parameters used in SWMM were determined by analyzing the micro-surface features; finally, the inundation area was calculated based on the SWMM-GIS. To verify the advantage of our proposed framework, two comparative experiments where the land cover and the micro-surface features were not considered in the stages of the sub-catchment division and parameter estimations were carried out. The simulated inundation area derived from our proposed framework with the return periods of 10a., 50a., 100a., and 1000a. were (separately) 22,500 m2, 29,500 m2, 33,600 m2, and 44,200 m2, which are more in line with the actual situation compared with the two designed comparative experiments. The experimental results show that our proposed framework has significant meaning to the waterlogging assessment on the Chinese ancient city site.
1. Introduction
1.1. Background
China’s ancient city sites are important parts of our cultural heritage and have important historical, cultural, and economic values. As global warming and extreme weather events intensify, the natural disaster risks of China’s ancient city sites increase [1]. China’s ancient city sites, which are surrounded by city walls, have relatively closed spaces and are more seriously damaged by waterlogging, which is caused by accumulated rainwater that cannot be drained in time. To further protect the cultural heritages within the ancient city sites, it is necessary to carry out research on waterlogging risk assessments in China’s ancient city sites [2,3].
A hydrological hydrodynamic simulation method based on the stormwater management model (SWMM), which can effectively simulate waterlogging mechanisms, is one of the most popular methods used for waterlogging risk assessments. Many previous works have demonstrated that selecting the parameters is the key to the success of this type of method [4]. In other words, the parameters used in the SWMM should be modified according to the specified study object. For example, Janet Barco et al. [5] proposed an automatic calibration method of the U.S. EPA SWMM model for the large urban catchment; Kong F. et al. [6] explored the hydrological responses of stormwater runoff characteristics to four different land use conversion scenarios at the city scale using GIS-based SWMM; G. Krebs et al. [7] presented a high-resolution SWMM model for a highly-urbanized small catchment located in Southern Finland.
For China’s ancient city sites, there are various micro-surface features (such as small soil slopes, ponds, paddy fields, etc.) due to ancient human farming and long-term natural erosion. These micro-surface features have important impacts on the parameter selection in the process of constructing the SWMM as there are various cultural heritages within the ancient city sites. On the one hand, survey data with higher resolutions are required to obtain micro-terrain characteristics; on the other hand, some micro-surface features have their own influence mechanisms of hydrological characteristics, such as surface runoff, rainfall infiltration, and surface water storage, which cannot be ignored [8]. Hence, how to construct the hydrodynamic model for Chinese ancient city sites, considering microtopography, is important.
1.2. Related Works
1.2.1. SWMM
SWMM is a hydrological hydrodynamic method that can simulate the occurrence and evolution processes of floods by constructing the rain flood model in the study area and can realize the visualization of flood inundation range, characteristics, and distribution [9]. It was developed by the EPA in the 1970s and has been recognized all over the world in terms of applicability and application [10].
In its early days, SWMM was only used for simulation. Javier temprano et al. [11] made use of SWMM to predict pollution in rainy weather in a combined sewer system catchment in Santander, Spain. Liu, J. et al. [12] constructed a rainfall–runoff model based on SWMM, which suited flooding and drainage characteristics in Shanghai to simulate flooding management. With the continuous demand improvements, some people gradually combined geographic information system (GIS) visualization technology or coupled other models for simulation to achieve high-precision simulation effects. In [13], an alternative approach to catchment discretization based on GIS was proposed and the automatic discretization approach was successfully applied to rainfall–runoff modeling in Macau using SWMM. Pawan Kumar Rai et al. [14] developed a GIS-based auto-calibrated SWMM, which was used to model the flood-prone Brahmani River watershed in India. However, these constructed SWMMs ignored the influence of microtopography on the simulated results. In fact, microtopography, which refers to the terrain with little surface fluctuation in the small-scale range, such as depressions and small hills, will affect the generation of slope runoff and other hydrological processes, thus affecting the accuracy of the model [15].
To overcome this limitation, in recent years, some researchers have turned their attention to the impacts of surface micro-terrains and surface roughness on surface hydrological characteristics. For example, LAN Zeng et al. [16] proposed a d-vca model, which combined the simulation of the hydrological process with the surface terrain analysis program, making the results of the model more accurate by considering the influence of micro-terrain factors such as depressions. S. Frei et al. [17] evaluated the complex hydrologic dynamics of a riparian wetland with micro-topography through a virtual modeling experiment and showed the effects of micro-topography on the complex hydrological process dynamics. Christian H. Mohr et al. [18] used rainfall simulations to examine the hydrologic response of soil to clear-cutting using rainfall simulations; their experimental results showed that the impact of microtopography on surface runoff connectivity and water-repellent properties of the topsoil acted as first-order controls for the hydrological and erosion processes in such environments.
1.2.2. The Acquisition of the Microtopography
The digital elevation model (DEM) is a digital simulation of ground terrain through limited terrain elevation data and has been proven to be one of the most important data models affecting the accuracy of the hydrological hydrodynamic model [19]. Nowadays, how to obtain DEM with the best resolution to reduce the impact of micro-terrains on the simulation results is a research hotspot. For example, Jing Li et al. [20] compared the impacts of different DEM data on flood simulation results. They analyzed the precautions for hydrological application using river network data derived from a DEM and the difficulty of coordinating the differences between elevation data from different sources and different resolutions. A. Thomas et al. [21] determined an optimal DEM resolution that is used in agricultural landscape areas with complex terrain dominated by micro-terrain features by comparing a series of different DEM products and simulation accuracies under different resolutions.
In terms of terrain data acquisition, the National Elevation Dataset (NED), Space Shuttle Radar Terrain Mission (SRTM) data, and optical detection and ranging (LIDAR) data have become the main terrain data sources for the hydrological hydrodynamic model. The digital elevation model derived from SRTM, with low precision and resolution, inevitably damages the quality of the hydraulic model and flood risk map [22,23,24]. In recent years, the development of UAV photogrammetry technology has provided new technical means for terrain data acquisition and has been proven in many fields. Compared with traditional ground topographic surveys and laser scanning programs, the cost is lower. Moreover, the UAV technique is more flexible and can carry different sensors for flight operation to obtain a high-resolution digital elevation model according to different environmental requirements [25].
In recent years, researchers have focused on the application of UAVs in hydraulic modeling. Perks et al. [26] applied UAV technology to capture real-time video and estimate the free surface velocity by tracking the motion of objects in the water in the burn flood event in Allis, Scotland. In research by LEIT ã et al. [27], the digital elevation model derived from the UAV images (UAVs) was reconstructed for the urban surface flow modeling to potentially connect the drainage model of Swiss towns. Mourato et al. [28] developed a digital surface runoff model based on UAVs for flood disaster mapping. Hashemi Beni et al. [29] used a DEM derived from UAVs to investigate the spatial flood assessment mapping and assessed the extent of flood events in Princeville, North Carolina. They highlighted the challenges related to the on-demand digital elevation model generation during flood events. In research by Lee et al. [30], the ground point was extracted by using a point cloud obtained from UAVs with Terra Scan software and the DEM was constructed using the region growth algorithm for river management.
1.3. Motivations
In this paper, we constructed a framework for assessing the waterlogging of China’s ancient city sites, so that the assessment results can be used in the risk mitigation processes in China’s ancient city sites. A waterlogging assessment framework of China’s ancient city sites (considering microtopography) is presented in this paper. The main contributions of this paper are listed as follows.
- The hydrodynamic model of the ancient city site (relying on UAVs) was constructed based on SWMM and GIS technology; a new sub-catchment area division method is proposed.
- A new sub-catchment division method and the influence of pond factors on surface runoff are discussed, respectively, which will provide a reference for the flood control and disaster reduction measures of urban site cultural relics in the future.
The rest of this paper is organized as follows: Section 2 presents a brief introduction to the SWMM and the materials. Section 3 details the outline of the waterlogging assessment based on SWMM. Section 4 presents the performance and discusses the experimental results followed by a comparative analysis. Finally, Section 5 concludes this paper.
2. Study Area and Materials
2.1. Study Area
The ancient city site of PuZhou is located on the east bank of the Yellow River, in Yongji city, south of Shanxi province (Figure 1a), and is about 150 km from the ancient city of Xi’an. It contains an inner-city and outer-city (Figure 1b), is 2.49 km long from east to west, and 1.71 km wide from north to south, with an area of about 4.26 square kilometers. The PuZhou ancient city—with 5000 years of history—is a typical ancient city and has experienced various dynasties in China. The preserved site is a rare ‘material’ that could be used to study the historical development of China’s ancient city walls. In 2001 and 2003, the State Council announced that the ancient city site of PuZhou was the fifth batch of national key cultural relic protection units and that it was included in the second batch of the national archaeological site park construction project list, separately. Figure 1c,d show the west gate of the PuZhou ancient city and the urn city at the north gate of the PuZhou ancient city, separately. Because of its proximity to the Yellow River, the ancient city site of PuZhou is threatened by the water of the Yellow River due to the Ming Dynasty. In the autumn of 1946, the Yellow River rose again, the riverbed was higher than the city, and the residents of the city moved out. The surviving ancient city of PuZhou is the Ming Jiajing, 34 years (1606) rebuilt. The wall, which was built in the Ming Dynasty, is now only high and is exposed to the ground.
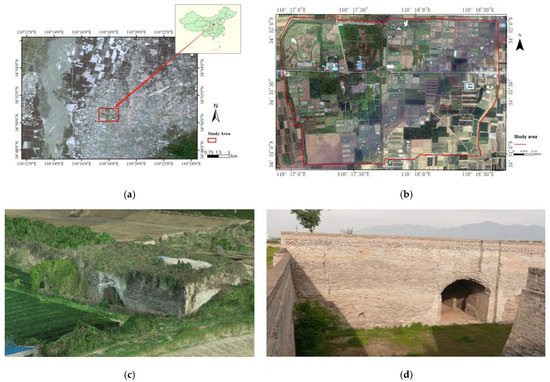
Figure 1.
(a) The location of the ancient city site of PuZhou; (b) the top view of the ancient city site of PuZhou; (c) the west gate of the ancient city of PuZhou; (d) the urn city at the north gate of the ancient city of PuZhou.
The temporal and spatial distributions of precipitation in the area where the ancient city site of PuZhou is located are uneven, the annual average precipitation is between 500 and 600 mm, and the rainfall distribution decreases from southeast to northwest. Rainfall is unevenly distributed in time. According to the analysis of meteorological data, the annual average precipitation is 504.7 mm (1972–2000), with 48% in the summer, 29% in the autumn, 20% in the spring, and only 3% in the winter. The interannual variation range of precipitation is not small, reaching 919.2 mm at most and 288.0 mm at the ‘youngest’, with a variation of more than three times. This brings many inconveniences and even disasters to agriculture, industries, and lives.
2.2. SWMM Model
There are three kinds of water routing models in SWMM: the steady flow routing model, kinematic wave routing model, and dynamic wave routing model. The dynamic wave routing model was selected for this project [31]. The flow route of the channels and pipelines was controlled by the de Saint-Venant equation. For the gradually changing unsteady flow, the de Saint-Venant equation consists of the mass conservation equation (Equation (1)) and the momentum conservation equation (Equation (2)). In the transport carriage, SWMM uses the explicit finite difference method to solve the de Saint-Venant equation, step-by-step [32]:
where is the flow, is the cross-sectional area of the flow, is the depth of water, is the longitudinal distance, is the time, is the gravitational acceleration, is the river slope, is friction. The EPA storm SWMM 5 [33], which can provide all features required to meet the objectives of this research, was selected for this study. The rainfall/runoff and the flow routing module were used to simulate the stormwater flow from the ground surface through this software.
2.3. Data Acquisition and Preprocessing
On 19 May 2021, a digital protection project was carried out to meet the requirements of the flood assessment in the ancient city site of PuZhou. In this project, the UAV images were collected by a Phantom 4 Pro-DJI system, which is developed by DJI Company and is composed of one FC6310R camera, as shown in Figure 2. The camera FC6310R had a sensor size of 20 MP, a pixel size of 2.4 µm, a radiometric resolution of 8 , multi-directional motion compensation, a maximum rate of 0.3 s per image, and an 8.8 mm lens. Table 1 shows the basic information about the FC6310R camera.
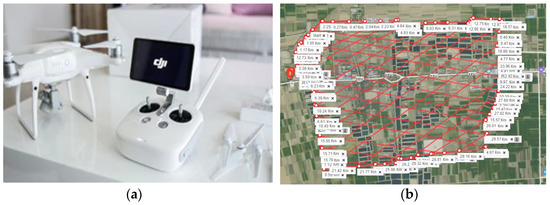
Figure 2.
Data acquisition of (a) the Phantom 4 Pro-DJI system; (b) the job scenarios.

Table 1.
The basic information of the camera FC6310R.
In the process of data acquisition, the approximate image overlap in the nadir view is set as 70% in flight and 50% across flight directions. With a flying height of around 160 m above ground and baselines of approximately 45 m, the base-to-height ratio is about 0.3. The ground sampling distance (GSD) for all cameras is approximately . The Phantom 4 Pro-DJI system can automatically plan the flight path and manage the photo acquisition based on information. A total of 1673 photos were collected.
Here, the commercial software package ContextCapture Master was used to process the collected images. The GPS data of the images generated by GNSS of the Phantom 4 Pro-DJI system were conducted in the reference system WGS84/UTM Zone 49N, and were used for further investigations. For 331,919 tie points, the reprojection error (RMS) was 0.54 pixels and the median resolution equaled 0.0438 m/pixel through the bundle block adjustment. The orthophoto and dense image matching (DIM) points were separately generated. We inputted the generated DIM points into the ArcGIS to produce the DEM and contour map with the help of the corresponding tool. The generated orthophoto, contour map, and DEM are shown in Figure 3.
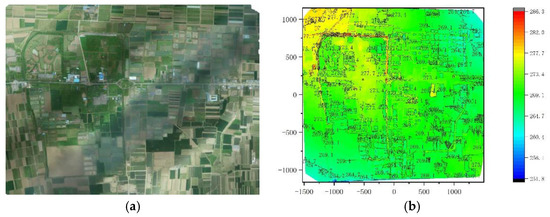
Figure 3.
The generated (a) orthophoto; (b) contour map and DEM.
3. The Framework of the Waterlogging Assessment Considering Microtopography
As shown in Figure 4, the proposed framework of the waterlogging assessment on the ancient city site of PuZhou was divided into four parts: (1) land cover classification combining the analysis of UAVs and the field survey; (2) sub-catchment division considering the land cover; (3) model parameter determination; (4) inundation range calculation based on the SWMM-GIS. Each part is described as follows.
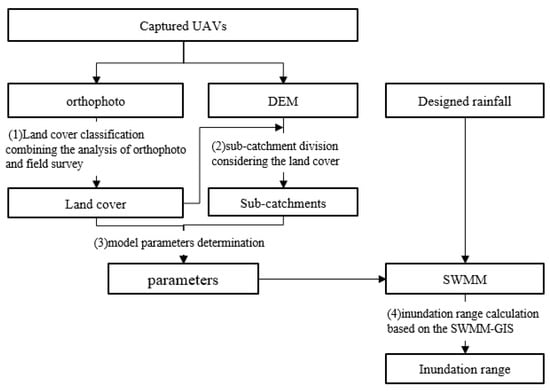
Figure 4.
The outline of the waterlogging assessment on the ancient city site of PuZhou.
3.1. Land Cover Classification Combining the Analysis of Orthophoto and the Field Survey
Land cover is the physical material at the surface of the earth and can be divided into 17 classifications, including grass, asphalt, trees, bare ground, water, etc., according to the International Geosphere-Biosphere Program (IGBP). It plays an important role in the processing of the parameter estimation in the SWMM. Considering that the area of the ancient city site of PuZhou is small, the small misclassifications will damage the simulated results. Although some automatic classification methods can be applied for the land cover of the UAVs, the classification accuracy of land cover is still low.
To obtain accurate and reliable classification results, a method combining the analysis of the orthophoto generated by the collected UAVs in Section 2.3 and the field survey is used in this paper. The process of capturing the land cover is listed as follows:
- At first, the initial ground scene is manually labeled on the generated orthophoto.
- Secondly, the ground scene information is checked based on the field survey. If the labeled ground scene is not consistent with the true ground scene, the ground scene information is revised.
- Finally, the ground scene is converted to the corresponding land cover based on the classification criteria of the land cover.
The land covers within the ancient city site of PuZhou contain a cultural relic element, an orchard, house, and fish pond (shown in Figure 5).
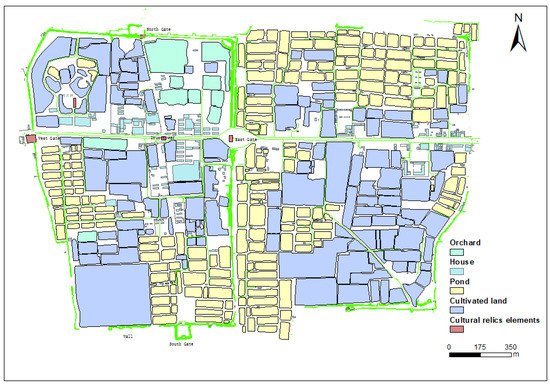
Figure 5.
Generated land cover of the ancient city site of PuZhou, combining the UAVs and field survey.
3.2. Sub-Catchment Division Considering the Land Cover
Sub-catchment is an area in which surface runoff or other substances converge to a common outlet; it is an enclosed area [34]. The popular sub-catchment division methods can be divided into two categories: the hydrological methods based on the deterministic eight-node (D8) algorithm [35] and the geometric methods based on Voronoi (Tyson polygon) [36]. The former divides the whole area into grids and assumes that the water within a single grid can only flow into one of the adjacent grids. The direction of the water flow can be calculated by dividing the height difference between the central grid and the adjacent grid by the distance between these two grids. The area of the ancient city site of PuZhou is small and the slope of the land is gentle. This brings difficulties for the precise calculation of the flow direction of the water based on the D8 algorithm.
The geometric methods based on Voronoi first estimate the nodes according to the research objectives; then, a region for each node based on a group of nodes is defined. Each point in the region is closer to the starting node of the region than any other node. Figure 6 shows the construction process of a Voronoi diagram. The catchment area determined by this type of method has the catchment ridge line with the same flow direction and contains a variety of surface feature types.

Figure 6.
The construction process of the Voronoi diagram, (a) the selected nodes; (b) the Delaunay triangle; (c) Voronoi diagram.
Although the divided sub-catchment based on Voronoi has the conditions for the model analysis, there are still some limitations to China’s ancient city site. On the one hand, the ancient city site of PuZhou lacks a complete drainage system and information on the pipe network and nodes. It is hard to construct Tyson polygons to obtain a high-precision sub-catchment range by using the traditional method alone to construct Tyson polygons based on nodes. On the other hand, different subsurface types correspond to different Manning coefficients. If the refinement is not continued, there is a large uncertainty factor when setting the catchment area parameters in the later SWMM construction.
To obtain high precision sub-catchments, a modified geometric method based on Voronoi is proposed. The process is described as follows:
- The lowest points within the local area are selected as the nodes based on the DEM; then, the derived nodes are used to construct a Tyson polygon and obtain the initial sub-catchment area.
- To improve the accuracy of simulation results, the surface type data in the city site area and the surface type data (divided into five categories: farmland, pond, forest land, hardened road, and house) are superimposed with the roughly divided catchment area to obtain several map spots.
- Finally, the sub-catchment area is manually corrected to obtain a high-precision sub-catchment area range map.
It can be seen in Figure 7 that the number of corrected sub-catchment areas is adjusted to 8. Compared with generated sub-catchment areas by the traditional Voronoi method, the modified sub-catchment areas reflect the factors of runoff changes caused by surface types and human activities, make the model simpler, and reduce the calculation time.
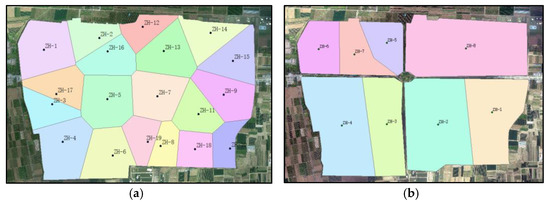
Figure 7.
The generated sub-catchment areas by (a) the Voronoi method; (b) the modified geometric method based on Voronoi.
3.3. Model Parameters Determination
The parameters used in the SWMM model are divided into deterministic parameters and uncertain parameters. Deterministic parameters, such as the pipe network length, shape, size, sub-catchment area, slope, impermeability percentage, etc., were obtained through basic data processing. The uncertain parameters were determined by the reference value provided by SWMM, including the Manning coefficient of the permeable area, impervious area, pipeline and river channel, depression water storage of permeable area, and impervious area [37].
3.3.1. Calculation of Impermeability Considering Fish Ponds
Imperviousness is an important parameter that influences the simulation results [38]. Numerous studies have shown that parameters that play important roles in the SWMM, such as the runoff coefficient and flood flow, are positively correlated with imperviousness [39]. How to obtain the accurate imperviousness is particularly important. At present, many scholars focus on the improved various extraction algorithms to extract more impervious surface information in the region (in remote sensing images) to reduce the confluence flow influence [40,41]. However, in addition to the feature classification extraction accuracy, the influence of microtopography on the runoff during confluence needs to be considered. This influence is often reflected in the simulations by parameters such as imperviousness.
In the rainfall process, the physical process of runoff generated by the fish pond is complex. As shown in Figure 8, Q represents the surrounding surface runoff, D represents the depth of the fish pond, and represents the depth of runoff generated by the pond. After evaporation and infiltration, rainwater generates runoff inside the pond, but unlike the surface runoff on the plane, the runoff generated will not converge outward. Through a field investigation, it was found that the depth d of the pond in the site area was generally about , which was far greater than the sum of the runoff generated by the pond during rainfall and the surrounding surface runoff. Therefore, to obtain high-precision simulation results, the influence of the pond must be considered.
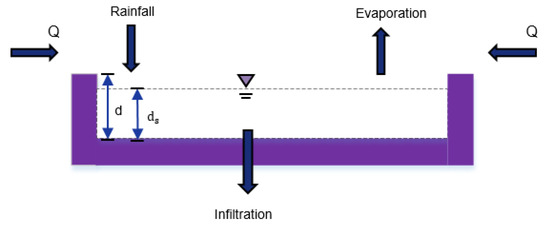
Figure 8.
Evolution of fish pond runoff generation during rainfall.
This paper proposes an imperviousness calculation method considering fish ponds. The method uses GIS to extract the impervious surface of the site area through land use data to obtain impervious surface information for each sub-catchment. To reduce the impact of ponds on the runoff, the area occupied by ponds was removed from the total area of each sub-catchment to reduce the impact of ponds on the total runoff during rainfall, as shown in Figure 9.
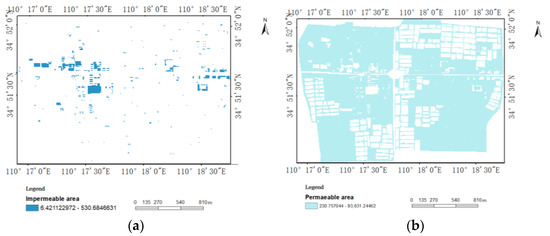
Figure 9.
(a) The extracted impervious area; (b) the extracted impervious area without fish ponds.
After obtaining the impervious area, the impervious rate of each sub-catchment area can be calculated by using Formula (3) with the help of CAD software.
where —impervious rate (%); —the area of impervious land cover (m2) (including roads, houses, hardened floors, etc.; —the area of sub-catchment (m2).
The area of each imperviousness sub-catchment is shown in Figure 10. C-Imperv and Z-Imperv represent the impervious rates before and after removing the fish pond, respectively. It is obvious that the impervious rate increases significantly when the fish ponds are considered, and the highest impervious rate and the lowest impervious rates are 28% and 1.9%.
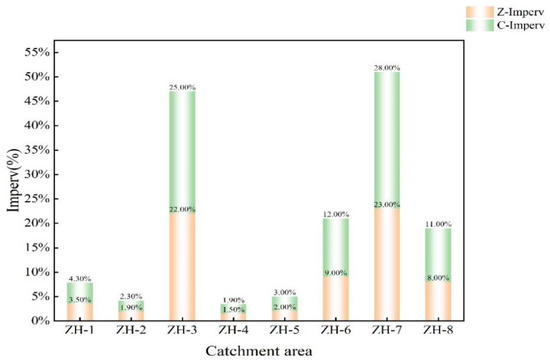
Figure 10.
The area of each imperviousness sub-catchment.
Moreover, the fish ponds impact the calculation of the slope of the sub-catchment area. To obtain the accurate slope of the sub-catchment area, we used the revised digital elevation model, which is derived from the original DEM through the filling processing to calculate the average slope of each sub-catchment area with the help of ArcGIS. Besides the impermeability, the other deterministic parameters contain the area and slope of the sub-catchment. After the sub-catchment division, the area and slope of the sub-catchment area can be automatically calculated.
3.3.2. Uncertain Parameters
Uncertain parameters are mainly used for the dynamic simulation of rainwater infiltration in SWMM. Compared with the city, the area of the ancient city site of PuZhou is small and the soil type contained in the same sub-catchment area is single. To better reflect the infiltration effect of the underlying surface of the ancient city of PuZhou, the Horton model, which is most commonly used to represent the change in stormwater infiltration rates over time as well as predict the infiltration rates for saturated and unsaturated soils, was selected for this paper. The parameters used in the Horton model mainly included the maximum infiltration rate, minimum infiltration rate, attenuation constant, drainage time, and maximum infiltration volume. Combined with the reference value given by SWMM and the soil texture of the ancient city site of PuZhou, the parameter value was determined as shown in Table 2.

Table 2.
Uncertain parameters used in SWMM model.
The uncertainty parameters, mainly the empirical parameter values, were set according to the ground characteristics of the ancient city of PuZhou, and the parameter values were set with reference to the SWMM model manual and relevant literature at home and abroad. As shown in Table 2, the Manning coefficients of the impervious area and permeable area were set as 0.012 and 0.24, respectively. The depression storages in the impervious and permeable areas were set to 1.3 and 5.
3.4. Inundation Range Calculation Based on the SWMM-GIS
Although the SWMM can calculate the surface runoff of the study area during the rainstorm process, which includes infiltration and evaporation, it is difficult to obtain the flood-inundated area and the depth of waterlogging caused by the overflow in the rainwater and flood management of the real city site. In view of this, this paper used the GIS spatial analysis function to convert the surface runoff depth output by SWMM under different scenario simulations into the inundation range and inundation depth of the city site, and realized the calculation and analysis of the inundation range and inundation depth of the waterlogged area. The process is shown in Figure 11. The flood inundated area and depth, which indicate the flood information, were the main aspects to be researched.
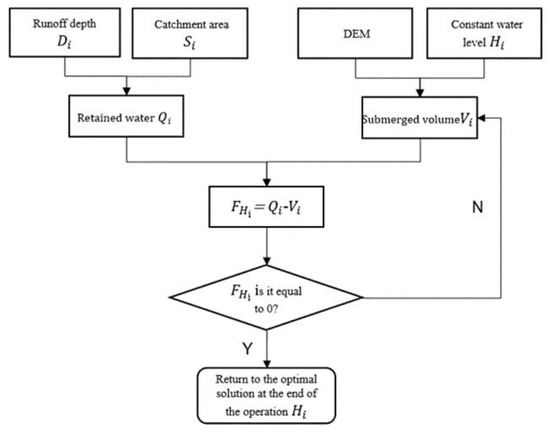
Figure 11.
Inundation range calculation based on SWMM–GIS.
The specific method was to continuously give the flood water level in GIS, calculate the volume of the corresponding inundation area on the basis of DEM; subsequently, we compared it to the simulated retained flood water volume , used the dichotomy approximation algorithm to continuously iterate, found out the volume closest to the out-of-limit flood water volume, and calculated the water inundation perimeter.
where is the given flood level, is the elevation of the grid; is the inundated cell area; is the inundated connectivity.
4. Experiment
To evaluate the performance of our proposed framework, three experiments were carried out in this section. The detailed data of the three experiments are listed as follows:
- In the first experiment, the SWMM constructed based on our proposed framework was labeled . The study area was divided into eight sub-catchments and the parameters used in were estimated when the micro-surface features were considered.
- In the second experiment, the SWMM, which is labeled , was constructed using the general sub-catchment division method. It included 19 sub-catchment areas in total and the other parameter calculation method remained unchanged.
- The third SWMM, which is labeled , was constructed by using the modified sub-catchment division method; however, the influence of the fish pond and the other micro-terrain were not considered in the parameter calculation.
Before the experiments, the rainfall should be designed. This section consists of two parts: (1) rainfall designing; (2) experimental results and analysis.
4.1. Rainfall Designing
The Chicago rainfall model, which was put forward by Keifer and Chu in 1957, is an uneven rainfall model based on the intensity–duration–frequency relationship and has been widely used in the assessment of floods. In this paper, the rainfall intensities for each duration and a set of selected return periods were calculated according to the rainstorm intensity (Formula (6)) in Yuncheng City.
where —the average rainfall intensity(L/s-ha); —the return period of the designed rainfall; t—is the rainfall duration (min); —the groundwater collection time(min), which is set based on the distance, slope, and land cover (it is usually set at 5–15 min); —time of rainwater prevalence in the pipe (min), which is the average rainfall intensity. In this paper, the rainfall duration was set as 3 h and the peak coefficient was set as 0.3. The rainfall characteristic values of different rainfall repetition periods are shown in Table 3. When the rainfall peak coefficient is 0.3, the rainfall time curve of each repetition period is shown in Figure 12.

Table 3.
The parameters of each return period.
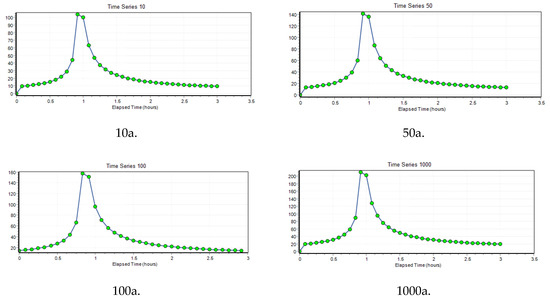
Figure 12.
Rainfall duration of each return period.
4.2. Experimental Results and Analysis
4.2.1. Calibration and Validation of Parameters under Different Rainfall Conditions
The continuity error of the simulated surface runoff derived from the three constructed SWMM models with four return periods was less than 2% and the simulation surface runoff was reasonable, according to the guidelines of SWMM.
To verify whether the designed models were reasonable without the measured data of the relevant actual runoff coefficient of the ancient city site of PuZhou, a comprehensive runoff coefficient method proposed by Liu xingpo et al. [42] was used. This method selected the coefficient of variation () as the evaluation index. The calculation formula of is shown in Formula (8).
In this formula, is the coefficient of variant; is the difference between the simulated comprehensive runoff coefficient and the actual comprehensive runoff coefficient; is the average of the simulated comprehensive runoff coefficient and the actual comprehensive runoff coefficient.
According to the underlying surface type of the ancient city site of PuZhou, and referring to the SWMM manual, the pavement was regarded as the impervious surface, and the runoff coefficient of the pavement and roof was labeled as 0.9. The actual comprehensive runoff coefficient of the study area was weighted according to the distribution of the forest land, roof, and road in each sub-catchment area and the actual comprehensive runoff coefficient of the overall study area was 0.604, as shown in Table 4.

Table 4.
The comprehensive runoff coefficient calculation.
The simulated comprehensive runoff coefficient was calculated by the simulated surface runoff value and was simulated and output by the results of the rainfall return periods 10a., 50a., 100a., and 1000a. as shown in Figure 13. With the different return periods of the rainfall, the calculated runoff coefficients of the variation derived from , , and are shown in Table 5.
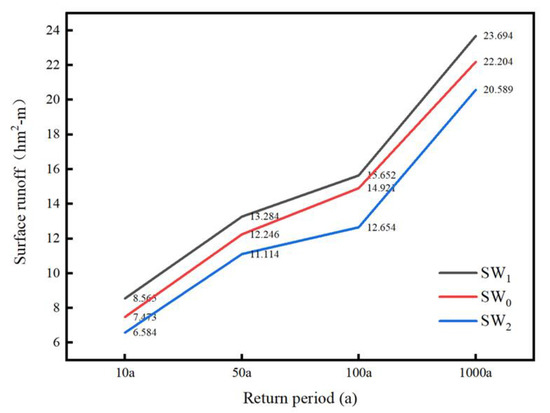
Figure 13.
The simulated surface runoff with different return periods of rainfall.

Table 5.
The runoff coefficient of variation () in the ancient city site of PuZhou.
As shown in Table 5, the calculated s, which increase with the increase of the return period, are within ±5%. The constructed SWMM models in the three experiments are reasonable according to the former research conclusion [42]. The runoff coefficients of variation derived from were 3.9%, −4.2%, 4.4%, and −4.7% under the different repetition periods of rainfall, respectively. Compared with , the of and were larger with the same return periods of rainfall. This shows that the constructed, based on our proposed method, is closer to the actual situation.
4.2.2. The Extent of Inundation at the PuZhou Ancient City Site
Runoff depth refers to the depth of the water layer obtained by flattening the total amount of runoff on a certain overflow section over the watershed area above the section during the calculation period. It is important data used for calculating the inundation range [43]. Based on the simulation of the SWMM model, the surface runoff depths of the ancient city of PuZhou with the return periods of 10a., 50a., 100a., and 1000a. are shown in Figure 14. The maximum runoff appeared in sub-catchment area 3 and reached 36.19, 55.61, 65.89, and 94.26 mm, respectively; the minimum runoff was in the sub-catchment area and reached 12.68, 22.11, 27.8, and 43.27 mm, respectively.
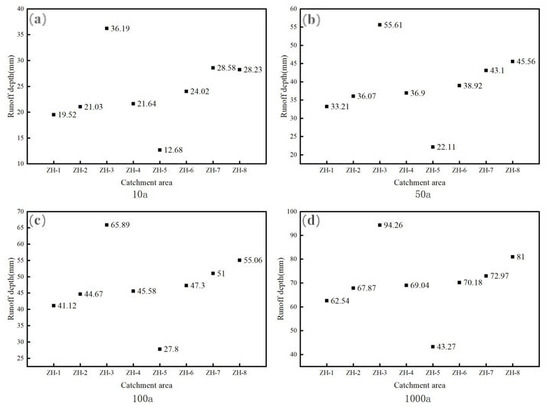
Figure 14.
The flood depth of the inundated sub-catchment area. Return period of rainfall is (a) 10a., (b) 50a., (c) 100a., (d) 1000a.
Relying on the GIS, the best water level value of each sub-catchment area was calculated when the different flood water levels were given. As shown in Table 6, the water level value of each sub-catchment area was almost the same with the same rainfall return period (as the slope of the ancient site of PuZhou is relatively slow).

Table 6.
The best flood level of each sub-catchment.
Combined with the derived DEM, the inundation ranges of the ancient city site of PuZhou under four scenarios were , respectively. Similarly, the inundation areas of and could be calculated. The inundation ranges of , , and are shown in Figure 15 and Table 7.
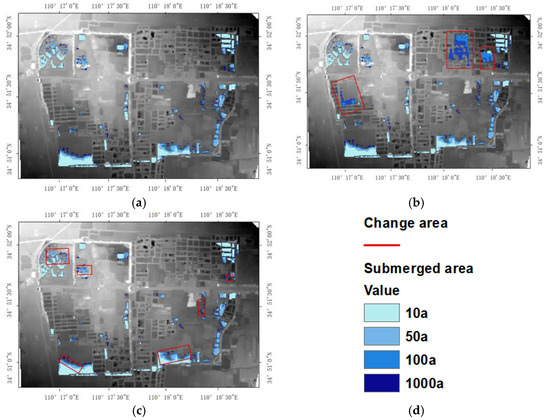
Figure 15.
The flood inundated ranges of different recurrence periods. The inundation areas of (a) , (b) , (c) ,(d) legend.

Table 7.
The inundation area derived from , , and .
As shown in Table 7, the inundation area of the is larger than the inundation area derived from , and increased by 17.7%, 10.1%, 11.9%, and 18% with different return periods of rainfall, respectively. The revised sub-catchments area used in were generated by merging the sub-catchment areas used in ; thus, the slope of the sub-catchment area used in was larger than that of the revised sub-catchments area. Under the same conditions, rainwater flowed through steep slopes faster than flat lands. The fast flow rate made it difficult for rainwater to penetrate into the ground and form surface runoff. This not only led to the increase in surface runoff, but also to the decrease in surface water storage. In , the final surface water storage was significantly less than that of the original model with a maximum difference of 2.615 ) and the drainage capacity ratio of was higher, as shown in Figure 16. As shown in Figure 15b, the increased inundation area mainly contained fish ponds.
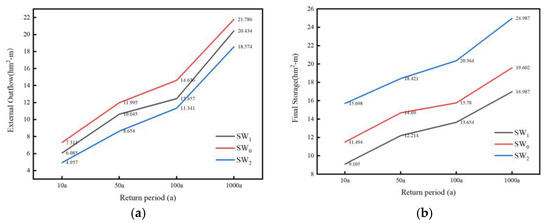
Figure 16.
The comparison of simulation results of different models. (a) External outflow; (b) final storage.
However, some inundation areas derived from were unreasonable. The direction depended on the elevation differences between the adjacent grids. The elevations of some grids that were inundated were higher than that of their uneven adjacent grids. So, the modified method of is reasonable.
In , the fish ponds were regarded as depressions, and the rainwater flowed into the fish ponds during the simulation process. Hence, the final water storage of the increased compared with , and the maximum difference between the and reached 5.385 ) as shown in Figure 16b. As plenty of rainwater was stored in the fishponds, the surface runoff of was smaller than that of , as shown in Figure 13. Similarly, the outgoing flow of was lower than that of , as shown in Figure 16a. Table 7 shows that the inundation area of the was smaller than that of , and the inundation area was reduced by 4.4%, 6.7%, 5.9%, and 9% at return periods of rainfall, respectively. It can be seen from Figure 15c that the area where the reduced inundation area was located was the area with the low slope. is more reasonable.
5. Conclusions
A waterlogging assessment framework based on SWMM is proposed for the prediction of the inundation area of the Chinese ancient city site in this paper. Our conclusions are as follows:
- Through the comparative experiments, our proposed method (considering microtopography) can achieve good performance and the simulated inundation area is more in line with the actual waterlogging situation of the ancient city site of PuZhou.
- The simulated inundation areas of the ancient city site of PuZhou, based on our proposed method, were 22,500, 29,500, 33,600, and 44,200 with different return periods of rainfall, respectively. The simulated inundation range was mainly near the city wall. As there was no drainage pipe network, corresponding protective measures should be carried out.
The experimental results show that UAVs can depict the micro-surface features and these types of data can play important roles in the waterlogging assessments of ancient city sites in China. In future work, we will focus on how to extract the micro-surface features of various Chinese ancient city sites based on UAV images. Additionally, analyzing the influence of floods on heritage elements will also be necessary.
Author Contributions
Conceptualization, Y.D. and Y.L.; methodology, Y.L.; software, Y.L.; validation, Y.D. and Y.L.; formal analysis, X.C.; investigation, X.C.; resources, Y.L.; data curation, Y.D.; writing—original draft preparation, X.C.; writing—review and editing, X.C.; visualization, Y.L.; supervision, Y.D.; project administration, Y.D.; funding acquisition, Y.D. All authors have read and agreed to the published version of the manuscript.
Funding
This research was funded by the National Key Research and Development Program of China (2019YFC15208005).
Acknowledgments
The authors thank researcher Ge Chuan for the support.
Conflicts of Interest
The authors declare no conflict of interest.
References
- Li, W.; Lin, K.; Zhao, T.; Lan, T.; Chen, X.; Du, H.; Chen, H. Risk assessment and sensitivity analysis of flash floods in ungauged basins using coupled hy-drologic and hydrodynamic models. J. Hydrol. 2019, 572, 108–120. [Google Scholar] [CrossRef]
- Jha, M.K.; Afreen, S. Flooding urban landscapes: Analysis using combined hydrodynamic and hydrologic modeling ap-proaches. Water 2020, 12, 1986. [Google Scholar] [CrossRef]
- Chen, W.; Huang, G.; Zhang, H.; Wang, W. Urban inundation response to rainstorm patterns with a coupled hydrodynamic model: A case study in Haidian Island, China. J. Hydrol. 2018, 564, 1022–1035. [Google Scholar] [CrossRef]
- Abdelkarim, A.; Gaber, A.F.D.; Youssef, A.M.; Pradhan, B. Flood hazard assessment of the urban area of Tabuk City, Kingdom of Saudi Arabia by integrating spatial-based hydrologic and hydrodynamic modeling. Sensors 2019, 19, 1024. [Google Scholar] [CrossRef]
- Barco, J.; Wong, K.M.; Stenstrom, M.K. Automatic Calibration of the U.S. EPA SWMM Model for a Large Urban Catch-ment. J. Hydraul. Eng. 2008, 134, 466–474. [Google Scholar] [CrossRef]
- Kong, F.; Ban, Y.; Yin, H.; James, P.; Dronova, I. Modeling stormwater management at the city district level in response to changes in land use and low impact development. Environ. Model. Softw. 2017, 95, 132–142. [Google Scholar] [CrossRef]
- Kreb, G.; Kokkonen, T.; Valtanen, M.; Koivusalo, H.; Setälä, H. A high resolution application of a stormwater management model (SWMM) using genetic parameter optimization. Urban Water J. 2013, 10, 394–410. [Google Scholar] [CrossRef]
- Luo, J.; Zheng, Z.; Li, T.; He, S. Spatial heterogeneity of microtopography and its influence on the flow convergence of slopes under different rainfall patterns. J. Hydrol. 2017, 545, 88–99. [Google Scholar] [CrossRef]
- Bellos, V.; Tsakiris, G. A hybrid method for flood simulation in small catchments combining hydrodynamic and hydrological techniques. J. Hydrol. 2016, 540, 331–339. [Google Scholar] [CrossRef]
- Gironás, J.; Roesner, L.A.; Rossman, L.A.; Davis, J. A new applications manual for the Storm Water Management Model (SWMM). Environ. Model. Softw. 2010, 25, 813–814. [Google Scholar] [CrossRef]
- Temprano, J.; Arango, Ó.; Cagiao, J.; Suárez, J.; Monzón, I.T. Stormwater quality calibration by SWMM: A case study in Northern Spain. Water S. A. 2006, 32, 55–63. [Google Scholar] [CrossRef]
- Liu, J.; Guo, L.H. Study on Simulation of Drainage and Flooding in Urban Areas of Shanghai Based on Improved SWMM. China Water Wastewater 2006, 22, 64–66. [Google Scholar]
- Zhao, D.; Chen, J.; Haozheng, W.; Tong, Q. GIS-based urban rainfall-runoff modeling using an automatic catchment-discretization approach: A case study in Macau. Environ. Geology. 2009, 59, 465–472. [Google Scholar]
- Rai, P.K.; Chahar, B.R.; Dhanya, C.T. GIS-based SWMM model for simulating the catchment response to flood events. Hydrol. Res. 2017, 48, 384–394. [Google Scholar] [CrossRef]
- Hu, L.; Bao, W.; Shi, P.; Wang, J.; Lu, M. Simulation of overland flow considering the influence of topographic depressions. Sci. Rep. 2020, 10, 6128. [Google Scholar] [CrossRef]
- Zeng, L.; Chu, X. A new probability-embodied model for simulating variable contributing areas and hydrologic processes dominated by surface depressions. J. Hydrol. 2021, 602, 126762. [Google Scholar] [CrossRef]
- Frei, S.; Lischeid, G.; Fleckenstein, J.H. Effects of micro-topography on surface–subsurface exchange and runoff generation in a virtual riparian wetland—A modeling study. Adv. Water Resour. 2010, 33, 1388–1401. [Google Scholar] [CrossRef]
- Mohr, C.H.; Coppus, R.; Iroumé, A.; Huber, A.; Bronstert, A. Runoff generation and soil erosion processes after clear cutting. Jounral Geophys. Res. Earth Surf. 2013, 118, 814–831. [Google Scholar] [CrossRef]
- Nelson, A.; Reuter, H.I.; Gessler, P. DEM production methods and sources. Dev. Soil Sci. 2009, 33, 65–85. [Google Scholar]
- Jing, L.; Wong, D. Effects of DEM sources on hydrologic applications. Comput. Environ. Urban Syst. 2010, 34, 251–261. [Google Scholar]
- Thomas, I.A.; Jordan, P.; Shine, O.; Fenton, O.; Mellander, P.-E.; Dunlop, P.; Murphy, P.N.C. Defining optimal DEM resolutions and point densities for modelling hydrologically sensitive areas in agricultural catchments dominated by microtopography. Int. J. Appl. Earth Obs. Geoinf. 2017, 54, 38–52. [Google Scholar] [CrossRef]
- Aplin, P.; Atkinson, P.M.; Tatnall, A.R.; Cutler, M.E.; Sargent, I. SAR imagery for flood monitoring and assessment. In Proceedings of the 1999 RSS99 Earth Observation—From Data to Information, Cardiff, UK, 7–9 September 1999; pp. 557–563. [Google Scholar]
- Casas, A.; Benito, G.; Thorndycraft, V.R.; Rico, M. The topographic data source of digital terrain models as a key element in the accuracy of hydraulic flood modelling. Earth Surf. Processes Landf. J. Br. Geomorphol. Res. Group 2006, 31, 444–456. [Google Scholar] [CrossRef]
- Lillesand, T.; Kiefer, R.W.; Chipman, J. Remote Sensing and Image Interpretation; John Wiley & Sons: Hoboken, NJ, USA, 2015. [Google Scholar]
- Molina, J.L.; Rodríguez-Gonzálvez, P.; Molina, M.C.; González-Aguilera, D.; Espejo, F. Geomatic methods at the service of water resources modelling. J. Hydrol. 2014, 509, 150–162. [Google Scholar] [CrossRef]
- Perks, M.T.; Russell, A.J.; Large, A.R.G. Technical Note: Advances in flash flood monitoring using UAVs. Hydrol. Earth Syst. Sci. Discuss. 2016, 20, 4005–4015. [Google Scholar] [CrossRef] [Green Version]
- Leitão, J.P.; Moy de Vitry, M.; Scheidegger, A.; Rieckermann, J. Assessing the quality of digital elevation models obtained from mini unmanned aerial vehicles for overland flow modelling in urban areas. Hydrol. Earth Syst. Sci. 2016, 20, 1637–1653. [Google Scholar] [CrossRef]
- Mourato, S.; Fernandez, P.; Pereira, L.; Moreira, M. Improving a DSM obtained by unmanned aerial vehicles for flood modelling. IOP Conf. Ser. Earth Environ. Sci. 2017, 95, 022014. [Google Scholar]
- Hashemi-Beni, L.; Jones, J.; Thompson, G.; Johnson, C.; Gebrehiwot, A. Challenges and opportunities for UAV-based digital elevation model generation for flood-risk management: A case of princeville, north carolina. Sensors 2018, 18, 3843. [Google Scholar] [CrossRef]
- Lee, G.; Choi, M.; Yu, W.; Jung, K. Creation of river terrain data using region growing method based on point cloud data from UAV photography. Quat. Int. 2019, 519, 255–262. [Google Scholar] [CrossRef]
- Bai, Y.; Zhao, N.; Zhang, R.; Zeng, X. Storm water management of low impact development in urban areas based on SWMM. Water 2018, 11, 33. [Google Scholar] [CrossRef]
- Ahmed, K.; Chung, E.S.; Song, J.Y.; Shahid, S. Effective design and planning specification of low impact development practices using Water Management Analysis Module (WMAM): Case of Malaysia. Water 2017, 9, 173. [Google Scholar] [CrossRef]
- EPA. Storm Water Management Model (SWMM). Available online: https://www.epa.gov/water-research/storm-water-management-model-swmm (accessed on 22 June 2020).
- Jain, G.V.; Agrawal, R.; Bhanderi, R.J.; Jayaprasad, P.; Patel, J.N.; Agnihotri, P.T.; Samtani, B.M. Estimation of sub-catchment area parameters for Storm Water Management Model (SWMM) using geo-informatics. Geocarto Int. 2016, 31, 462–476. [Google Scholar] [CrossRef]
- Li, Z.M.; Wei, J.W.; Wang, M.; Huang, Y.T.; Sun, F.Q. Extraction of river network based on D8 algorithm and Dinf algorithm. Water Resour. Water Eng. 2016, 27, 42–45. [Google Scholar]
- Medvedev, N.N.; Voloshin, V.P.; Luchnikov, V.A.; Gavrilova, M.L. An algorithm for three-dimensional Voronoi S-network. J. Comput. Chem. 2006, 27, 1676–1692. [Google Scholar] [CrossRef]
- De Souza, B.A.; Paz, I.D.S.R.; Ichiba, A.; Willinger, B.; Gires, A.; Amorim, J.C.C. Multi-hydro hydrological modelling of a complex peri-urban catchment with storage basins comparing C-band and X-band radar rainfall data. Hydrol. Sci. J. 2018, 63, 1619–1635. [Google Scholar] [CrossRef]
- Chaudhuri, A.S.; Singh, P.; Rai, S.C. Assessment of impervious surface growth in urban environment through remote sensing estimates. Environ. Earth Sci. 2017, 76, 541. [Google Scholar] [CrossRef]
- Gholami, V.; Saravi, M.M.; Ahmadi, H. Effects of impervious surfaces and urban development on runoff generation and flood hazard in the Hajighoshan watershed. Casp. J. Environ. Sci. 2010, 8, 1–12. [Google Scholar]
- Li, J.-J.; Wang, X.-R.; Wang, X.-J.; Ma, W.-C. Remote sensing evaluation of urban heat island and its spatial pattern of the Shanghai metropolitan area, China. Ecol. Complex. 2009, 6, 413–420. [Google Scholar] [CrossRef]
- Leinenkugel, P.; Esch, T.; Kuenzer, C. Settlement detection and impervious surface estimation in the Mekong Delta using optical and SAR remote sensing data. Remote Sens. Environ. 2011, 115, 3007–3019. [Google Scholar] [CrossRef]
- Liu, X. Parameter calibration method for urban rainfall-runoff model based on runoff coefficient. Jishui Paishui/Water Wastewater Eng. 2009, 35, 11. [Google Scholar]
- Romulus, C.; Iulia, F.; Ema, C. Assessment of surface runoff depth changes in Sǎrǎţel River basin, Romania using GIS techniques. Central Eur. J. Geosci. 2014, 6, 363–372. [Google Scholar] [CrossRef]
Publisher’s Note: MDPI stays neutral with regard to jurisdictional claims in published maps and institutional affiliations. |
© 2022 by the authors. Licensee MDPI, Basel, Switzerland. This article is an open access article distributed under the terms and conditions of the Creative Commons Attribution (CC BY) license (https://creativecommons.org/licenses/by/4.0/).