Article

Contribution of GRACE Satellite Mission to the Determination of Orthometric/Normal Heights Corrected for Their Dynamics—A Case Study of Poland

Institute of Geodesy and Cartography (IGiK), Centre of Geodesy and Geodynamics, 27 Modzelewskiego St., 02-679 Warsaw, Poland
*
Author to whom correspondence should be addressed.
Remote Sens. 2022, 14(17), 4271; https://doi.org/10.3390/rs14174271
Submission received: 5 August 2022 / Revised: 25 August 2022 / Accepted: 26 August 2022 / Published: 30 August 2022

Abstract

:
Physical heights were traditionally determined without considering the dynamic processes of the Earth induced from temporal mass variations. The Gravity Recovery and Climate Experiment (GRACE) mission provided valuable data that allow the estimation of geoid/quasigeoid height changes and vertical deformations of the Earth’s surface induced from temporal mass loading, and thereby temporal variations of physical heights. The objective of this investigation is to discuss the determination of orthometric/normal heights considering mass transports within the Earth’s system. An approach to determine such heights was proposed. First, temporal variations of orthometric/normal heights (ΔHH*) were determined using the release 6 GRACE-based Global Geopotential Models together with load Love numbers obtained from the preliminary reference Earth model. Then, those variations were modelled and predicted using the seasonal decomposition (SD) method. The proposed approach was tested on the territory of Poland. The main results obtained reveal that ΔHH* over the area investigated are at the level of a couple of centimetres and that they can be modelled and predicted with a millimetre accuracy using the SD method. Orthometric/normal heights corrected for their dynamics can be determined by combining modelled ΔHH* with orthometric/normal heights referred to a specific reference epoch.

Graphical Abstract

1. Introduction

The determination of heights is one of the major tasks in geodesy. Knowledge of heights is needed in various engineering applications as well as in scientific research associated with the Earth’s shape and its dynamics. Physical heights, e.g., orthometric/normal heights (H/H*), were traditionally obtained using the expensive and time-consuming precise spirit levelling. Nowadays, they are more and more frequently determined as a combination of ellipsoidal heights from precise satellite navigation techniques with geoid/quasigeoid heights derived from gravity data. Extensive investigations have thus been conducted to determine geoid/quasigeoid heights, ellipsoidal heights, and the resulting orthometric/normal heights of high accuracy. The issue of modelling gravimetric geoid/quasigeoid of a sub-cm accuracy is currently discussed by many authors, e.g., [1,2,3]. It is also considered as one of the main activities of the International Association of Geodesy [4]. The ellipsoidal heights can be determined with a couple of millimetres accuracy using long GNSS (global navigation satellite system) observation sessions and a high-precision scientific GNSS data processing software [5]. The H/H* of the mean square error of the adjusted levelling network less than 1 mm/km can be obtained from the first-order levelling network established using spirit levelling.
Excluding the areas of an evident land subsidence/uplift in which the annual change of H/H* is considered [6,7,8], H/H* are, nowadays, practically treated as static heights in the majority of land areas. The modern precise observation techniques indicate, however, that H/H* are worldwide affected by both annual and semi-annual variations. Heights obtained from repeated levelling measurements are influenced by artifacts and aliasing induced from both secular and seasonal vertical land motion [9]. The seasonality of the ellipsoidal height determined from GNSS data induced by temporal mass loading was demonstrated by numerous authors, e.g., in a global scale [10] and a regional as well as local scale in South America [11], Europe [12], Japan [13], the Amazon basin [14], Bangladesh [15], West Africa [16], North America [17], China [18], Tibet [19], Poland [20,21,22], and East Africa [23]. The Gravity Recovery and Climate Experiment (GRACE [24]) satellite mission considerably contributed to the improvement of the knowledge concerning temporal mass variations within the Earth’s system (TMVES) and thereby the Earth’s time-variable gravity field as well as the dynamic processes of the Earth. Based on data from the GRACE satellite mission, changes of the geoid/quasigeoid height in the time domain (ΔNζ) have been investigated by many authors, e.g., [25,26,27,28,29,30,31,32]. Vertical deformations of the Earth’s surface, Δh, induced from the temporal mass loading have also been investigated using GRACE satellite mission data [12,33]. Godah et al. [30,31], and Öztürk et al. [34] investigated orthometric/normal height changes (ΔHH*) estimated using GRACE data over Central Europe and over Turkey. They reveal that peak to peak variations of ΔHH* reach 23 mm over Central Europe and 25 mm over Turkey. Godah et al. [35] assessed ΔHH* induced by hydrological mass transports for twenty-four worldwide large river basins, using GRACE data. They illustrated that for the river basin of a strong hydrological signal (e.g., the Amazon River basin), peak to peak variations ΔHH* are ca. 80 mm. In general, all these studies reveal the importance of considering ΔNζ, Δh, and ΔHH* in the Earth’s science-related disciplines. Moreover, temporal variations of the aforementioned heights remain one of the problems that should carefully be handled for the vertical datum unification [36]. In addition to the GRACE satellite mission, the GRACE-Follow On (cf. https://gracefo.jpl.nasa.gov/ accessed on 4 August 2022) and next generation gravity missions [37] as well as atomic clock measurements [38] are aimed to improve the modelling of TMVES and thereby the monitoring of those temporal heights variations.
Taking into consideration the ΔNζ and Δh induced from TMVES, correcting H/H* for their dynamics will essentially be required. The overarching objective of this research is to discuss the determination of orthometric/normal heights corrected for their dynamics considering the effect of TMVES. Four examples illustrating the impact of TMVES on heights are discussed in Section 2. Section 3 describes an approach for the determination of H/H* corrected for their dynamics. Section 4 illustrates the determination of such heights over Poland as a case study. Finally, conclusions and recommendations are provided in Section 5.

2. The Impact of TMVES on Heights

The TMVES interact with height changes in different ways depending mainly on the location of mass changes and whether they exhibit an increase or decrease in mass. Herein, four cases are discussed (see Figure 1). In the first and second cases, the mass change is assumed to be beneath the geoid/quasigeoid surface (Figure 1a,b) [35]. They show that when the mass under the geoid/quasigeoid surface increases/decreases, (1) the gravitational potential also increases/decreases, and thereby the geoid/quasigeoid surface ascends/descends, and (2) the Earth’s surface gets deformed upward/downward. In the third and fourth cases illustrated in Figure 1c,d, the mass changes are assumed on the Earth’s surface, i.e., above the geoid/quasigeoid surface, such as hydrological mass changes. When the mass on the Earth’s surface increases/decreases, the Earth’s surface deforms downward/upward and the geoid/quasigeoid surface ascends/descends. In the third and fourth cases, ΔHH* are inversely proportional to TMVES.

3. The Determination of Orthometric/Normal Heights Corrected for Their Dynamics

The orthometric/normal heights corrected for their dynamics H(t)/H*(t) can be defined at arbitrary time t as a sum of the orthometric/normal height H(t0)/H*(t0) at the reference epoch t0, and temporal variations of orthometric/normal heights ∆H(t)/∆H*(t) at t.
The mathematical formulation of the proposed approach for the determination of H(t)/H*(t) at epoch t is expressed as follows:
H(t) = H(t0) + ∆HM(t)
H*(t) = H*(t0) + ∆H*M(t)
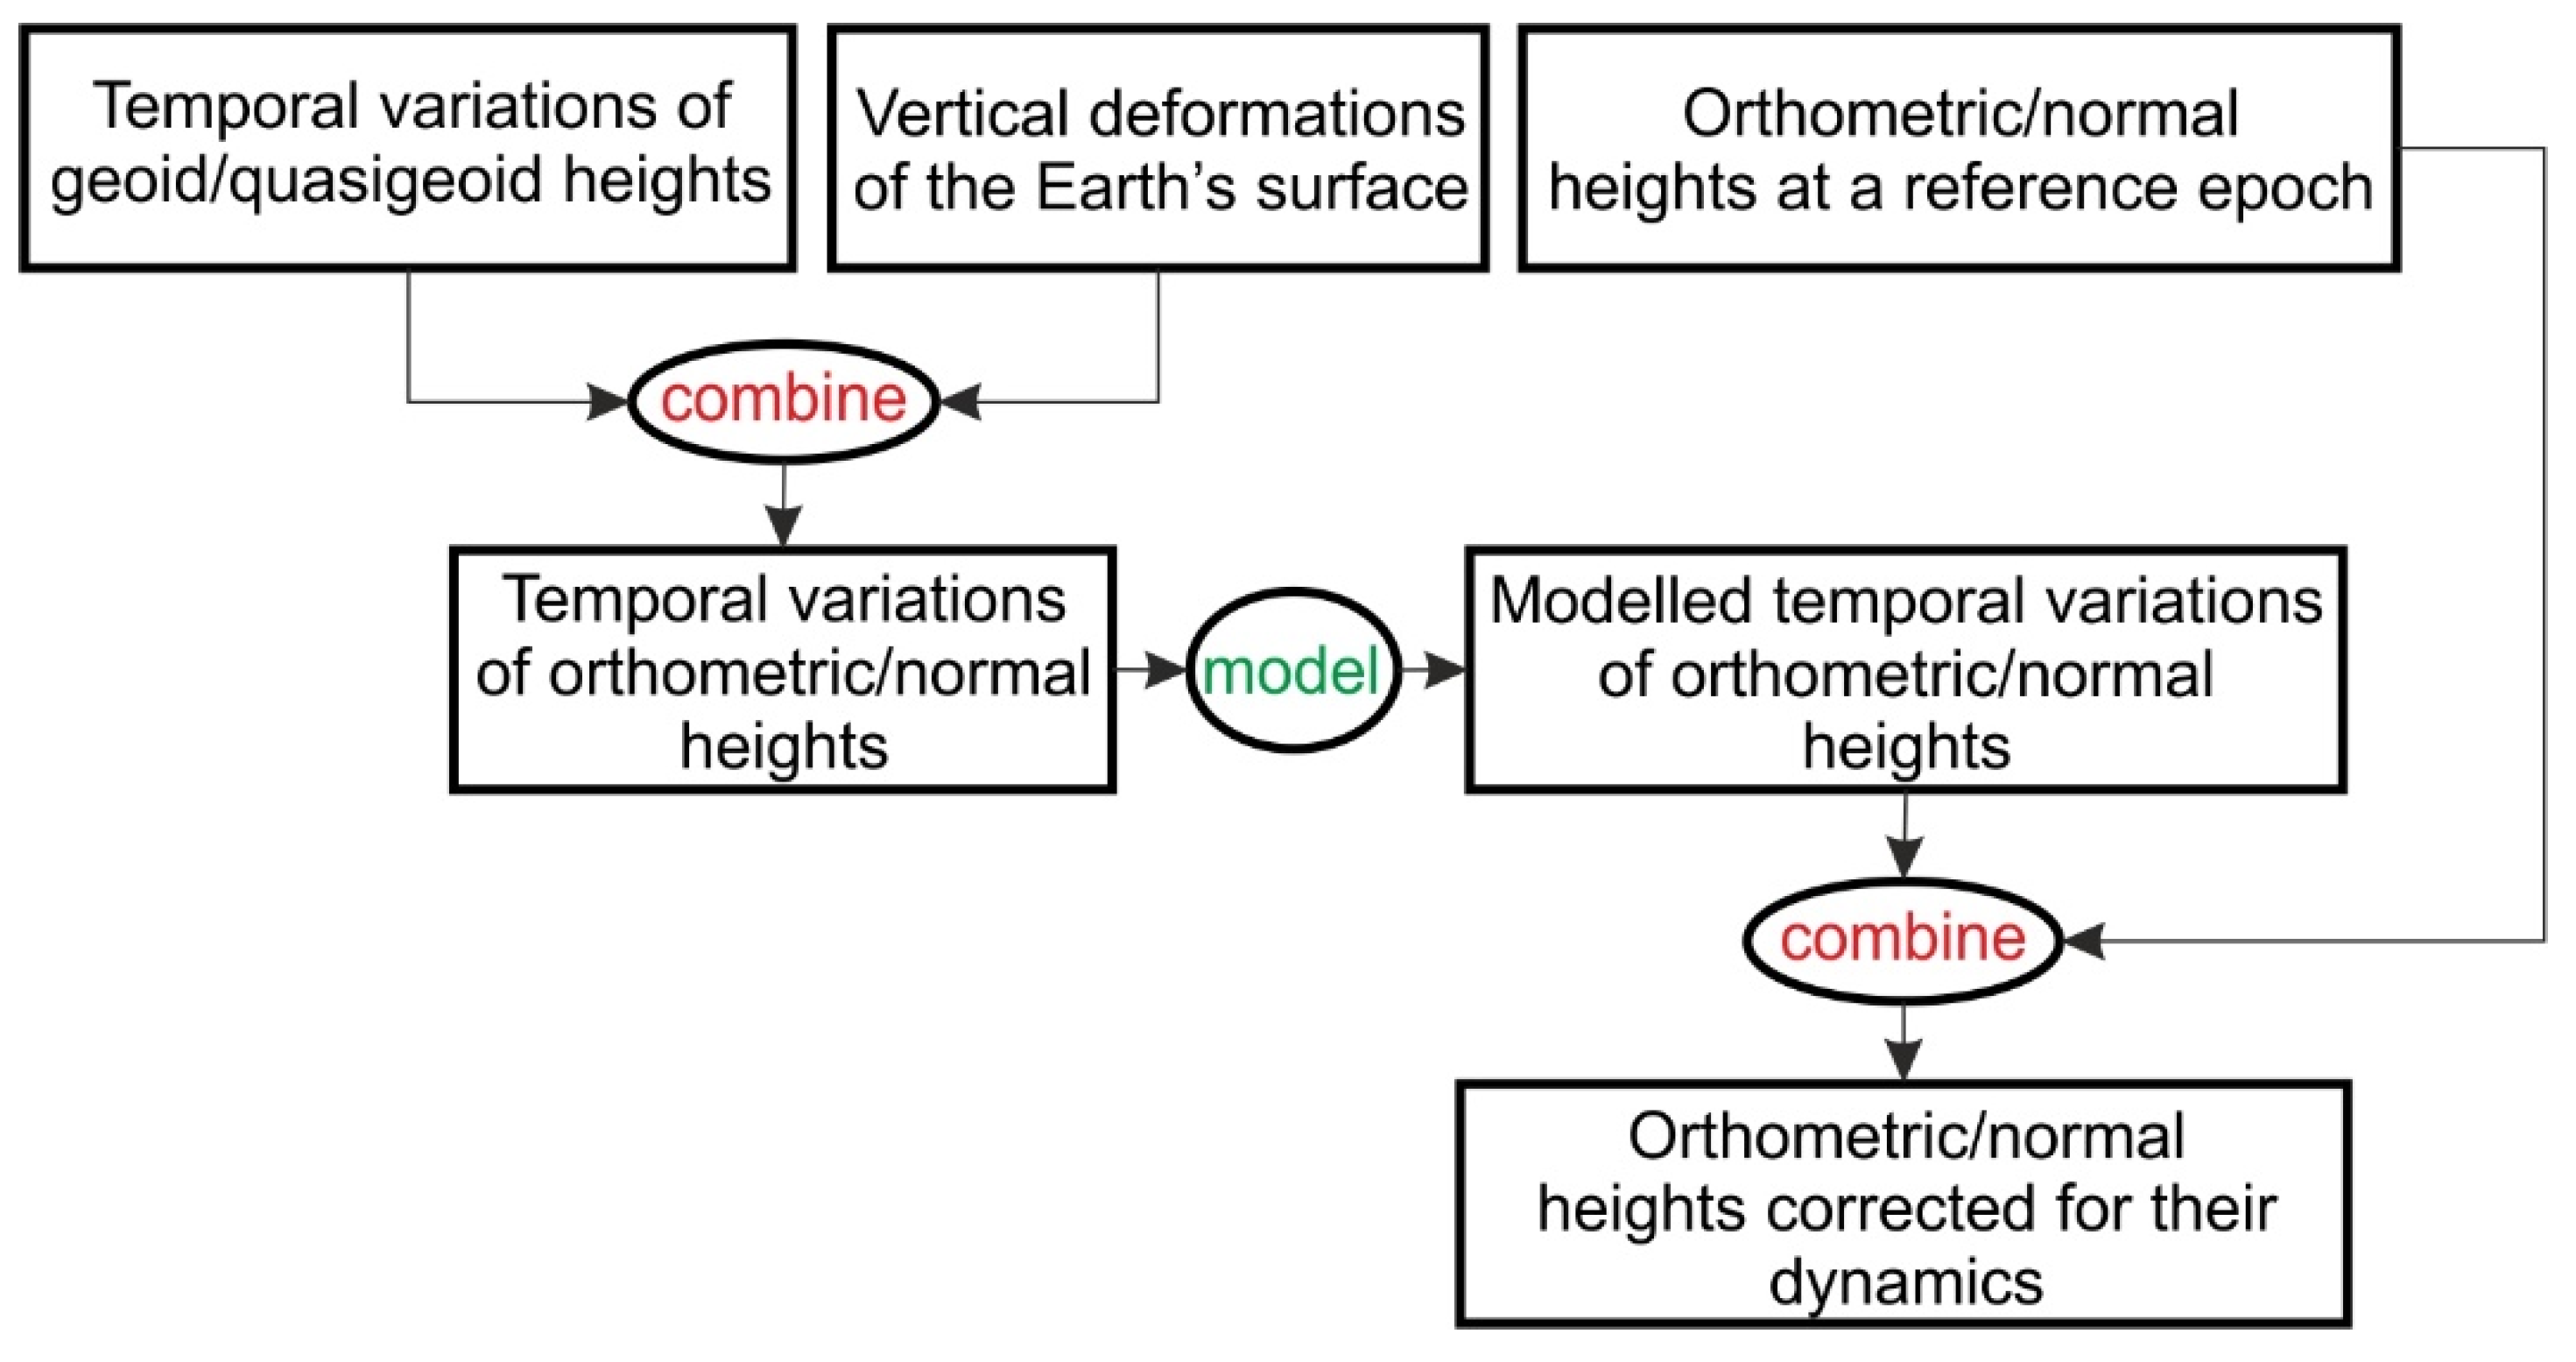
where ∆HM(t)/∆H*M(t) are values of ∆H/∆H* at time t calculated from the ∆H/∆H* model. This approach is described as follows (cf. Figure 2):
(1)
Determination of H(t0)/H*(t0).
(2)
Estimation of ∆H/∆H* over the time interval including t0 and if possible, t, by combining ∆N/∆ζ and ∆h. Then, developing the model of ∆H/H* and calculating ∆HM(t)/∆H*M(t) from this model.
(3)
Determination of H(t)/H*(t) at t as a sum of H(t0)/H*(t0) and ∆HM(t)/∆H*M(t) obtained from step 2.
Precise levelling networks, i.e., first order levelling networks, on a national as well as a regional scale, were commonly established by levelling measurement campaigns conducted over a long-time span in different epochs. Thus, a proper reduction of those levelling measurements to a common epoch is applied to determine H(t0)/H*(t0) at the reference epoch t0. Moreover, H(t0)/H*(t0) are, nowadays, determined by combining the ellipsoidal height of high accuracy obtained from GNSS measurements with geoid/quasigeoid height obtained from a precise geoid/quasigeoid model developed with the use of high-quality gravity data. It should be noted that establishing/re-measuring a national precise levelling network usually takes many years. Thus, secular (i.e., linear trend) variations of orthometric/normal heights that occurred during these years must be considered for the establishment of the 1st order levelling network referenced to a specific epoch such as t0. Although ∆H(t)/∆H*(t) can theoretically be obtained with the use of geometric data, e.g., spirit levelling, in practice, it is not possible to repeat levelling campaigns sufficiently frequently to provide as frequent as monthly solutions for heights [9]. Thus, monthly variations of orthometric/normal heights can practically be estimated using data from dedicated gravity satellite missions, in particular the GRACE/GRACE–FO missions, combined with longer time series data such as repeated levelling, glacial isostatic adjustment (GIA), GNSS time series, and tide gauge records, that also contain variations of physical heights signal. In this study, ∆H(t)/∆H*(t) are estimated as follows
Δ H ( t i G ) = T Δ H ( t i G ) + ( Δ h ( t i G ) Δ N ( t i G ) T ( t i G ) ) for   orthometric   heights Δ H * ( t i G ) = T * Δ H * ( t i G ) + ( Δ h ( t i G ) Δ ζ ( t i G ) T * ( t i G ) ) for   normal   heights }
where t i G (i = 1, 2, …, n) is the epoch of the ith (of n considered) monthly GRACE/GRACE–FO global geopotential models (GGMs), T ( t i G ) / T * ( t i G ) present the linear trend of ∆H(t)/∆H*(t) obtained from GRACE/GRACE–FO data, and T Δ H ( t i G ) / T * Δ H * ( t i G ) denote the linear trend (i.e., secular variation) of ∆H(t)/∆H*(t), estimated with the use of data from repeated levelling, GIA, GNSS, or tide gauges. It should be noted that when the epoch t0, to which orthometric/normal heights of the levelling network are referenced does not correspond to one of the epochs t i G , a proper transformation of H(t0)/H*(t0) to the closest t i G epoch would be required.
The Δ N ( t i G ) , Δ ζ ( t i G ) and Δ h ( t i G ) can be estimated from GRACE/GRACE–FO–based GGMs as follows [33,39]:
Δ N ( t i G ) = Δ ζ ( t i G ) = N ( t i G ) N ( t 0 ) = ζ ( t i G ) ζ ( t 0 )
ζ ( t i G ) = G M r γ l = 2 l max ( a r ) l m = 0 l ( C l m T ( t i G ) cos m λ + S l m T ( t i G ) sin m λ ) P l m ( sin φ )
ζ ( t 0 ) = G M r γ l = 2 l max ( a r ) l m = 0 l ( C l m T ( t 0 ) cos m λ + S l m T ( t 0 ) sin m λ ) P l m ( sin φ )
Δ h ( t i G ) = h ( t i G ) h ( t 0 )
h ( t i G ) = 3 a ρ w ρ a v g l = 0 l max m = 0 l P l m ( sin φ ) h l 2 l + 1 ( C l m σ ( t i G ) cos m λ + S l m σ ( t i G ) sin m λ )
h ( t 0 ) = 3 a ρ w ρ a v g l = 0 l max m = 0 l P l m ( sin φ ) h l 2 l + 1 ( C l m σ ( t 0 ) cos m λ + S l m σ ( t 0 ) sin m λ )
with
C l m T ( t i G ) = C l m W ( t i G ) C l m U ,   S l m T ( t i G ) = S l m W ( t i G ) S l m U
C l m T ( t 0 ) = C l m W ( t 0 ) C l m U ,   S l m T ( t 0 ) = S l m W ( t 0 ) S l m U
and surface density coefficients C l m σ ( t i G ) , C l m σ ( t 0 ) , S l m σ ( t i G ) and S l m σ ( t 0 ) defined as
{ C l m σ ( t i G ) S l m σ ( t i G ) } = ρ a v g 3 ρ w 2 l + 1 1 + k l { C l m T ( t i G ) S l m T ( t i G ) } ,
{ C l m σ ( t 0 ) S l m σ ( t 0 ) } = ρ a v g 3 ρ w 2 l + 1 1 + k l { C l m T ( t 0 ) S l m T ( t 0 ) }
where φ, λ, r are the latitude, longitude, and the geocentric radius of the computation point Q on the physical surface of the Earth, a is the semi-major axis of the reference ellipsoid, GM is the product of the Newtonian gravitational constant and the Earth’s mass, C l m U and S l m U are spherical harmonic coefficients of the normal gravity field, C l m W and S l m W are fully normalized spherical harmonics from GRACE/GRACE–FO–based GGMs, γ denotes the normal gravity at Q, P l m is a fully normalized Legendre function of degree l and order m, lmax is the maximum degree applied, ρ a v g is the Earth’s average density, ρ w is the water density, and hl and kl are the load Love numbers (LLN) of degree l.
Geoid heights N ( t i G ) and N(t0) are obtained using Equations (5) and (6), respectively, considering the reduction of the potential induced by topographic masses, i.e., the topographic bias [40], and assuming r = R and γ = γ0, where R is the mean radius of the Earth and γ0 is the normal gravity at Q0 on the ellipsoid, i.e., the corresponding point of Q projected along the plumb line onto the ellipsoid. The Δ N ( t i G ) can be considered equal to Δ ζ ( t i G ) [35].
The ∆H/∆H* can be modelled using a suitable method such as the seasonal decomposition (SD) method [41] and the principle component analysis/empirical orthogonal function (PCA/EOF) method [42]. In this research, the SD method, following the algorithm and computation steps described in detail in [29], was applied to model ∆H/∆H*. The ∆Hc(t)/∆H*c(t) time series is obtained by centering the ∆H(t)/∆H*(t) time series to zero. Then, the ∆Hc(t)/∆H*c(t) is decomposed into a seasonal component S(t)/S*(t), a long-term component LT(t)/LT*(t), and an unmodelled residual component ε(t)/ε*(t). The model of temporal variations of orthometric/normal heights ∆HSD(t)/∆H*SD(t) is obtained as a sum of long-term and seasonal components.
H*c(t)/∆H*c(t) = LT(t)/LT*(t) + S(t)/S*(t) + ε(t)*(t)
HSD(t)/∆H*SD(t) = LT(t)/LT*(t) + S(t)/S*(t)
The ∆HM(t)/∆H*M(t) were determined by referring the ∆HSD(t)/∆H*SD(t) to the reference epoch t0. Then, ∆HM(t)/∆H*M(t) values were interpolated/extrapolated at the height datum benchmarks investigated. The H(t)/H*(t) were calculated by combining these interpolated/extrapolated values with H(t0)/H*(t0) at those sites.
In order to mitigate the effect of the gaps in data from the GRACE/GRACE–FO satellite missions and the latency of GRACE/GRACE–FO products, prediction of the ∆HM/∆H*M values for months where these products are unavailable, would be required. Within this study, the prediction of ∆HM/∆H*M values were investigated using the empirical approach proposed in Godah et al. [29] based on the results obtained from the SD method. The predicted values of ∆HM/∆H*M were calculated as a sum of the S(t)/S*(t) component and the ∆H/∆H* values obtained from an appropriate mathematical model fitted to LT(t)/LT*(t) component.

4. A Case Study

The area of Poland, as a unique one covered with high-quality terrestrial gravity datasets, GNSS/levelling data, and gravimetric geoid/quasigeoid models, has been chosen as a study area. The accuracy of quasigeoid heights obtained from the recent gravimetric quasigeoid model and GNSS/levelling data as well as combined GGMs, e.g., the EGM2008 (Earth Gravitational Model 2008; [43]), over this area is estimated at the level of 1 cm [44]. Over this area, ∆N/∆ζ were reliably determined, analyzed, and modelled using GRACE satellite mission data [29], and ∆h were detected at the ASG-EUPOS (Polish Active Geodetic European Position Determination System; http://www.asgeupos.pl/, accessed on 1 August 2022) network sites using GNSS data [21,22].

4.1. Orthometric/Normal Heights at Reference Epoch

In this study, H(t0)/H*(t0) from the ASG-EUPOS network sites were utilized. The values of normal heights referred to the Kronstadt86 vertical datum for the territory of Poland (PL-KRON86-NH) are accessible via the ASG-EUPOS website (http://www.asgeupos.pl/index.php accessed on 1 August 2022). These normal heights were transformed into the PL-EVRF2007-NH (European Vertical Reference Frame 2007 recently applied for the area of Poland). The reference epoch t0 of PL-EVRF2007-NH is 1 January 2008, which corresponds to its realization epoch [45]. The PL-EVRF2007-NH is based on results of the adjustment of the 4th levelling campaign in Poland (1998–2012), EUVN (European Vertical Reference Network), and EUVN-DA (European Vertical Reference Network-Densification Action) solutions as well as solutions for the benchmarks of eccentric points of permanent GNSS stations of the ASG-EUPOS network. Heights are given in the zero tidal system. The accuracy of levelling measurements was estimated as 0.74 mm/km. Based on the adjustment of the levelling network, the estimated accuracy of a single benchmark is 3.5 mm [46].
The orthometric heights at the ASG-EUPOS sites at the reference epoch t0 were determined using the well-known basic relation for the geoid–quasigeoid separation [47]:
H * H Δ g B γ ¯ H
where ∆gB is the Bouguer gravity anomaly and γ ¯ is the mean normal gravity along the normal plumb line between the ellipsoid and the telluroid.
The H and H* of ASG-EUPOS sites referred to the PL-EVRF2007-NH at the reference epoch t0 are shown in Figure 3. It should be noted that the differences between orthometric and normal heights over the area of Poland do not exceed a couple of decimeters [44].

4.2. Temporal Variations of Orthometric/Normal Heights

Temporal variations of orthometric/normal heights ∆H(t)/∆H*(t) over Poland induced by TMVES were considered. In Section 4.2.1, temporal variations of an equivalent water thickness ∆EWT(t) and ∆H(t)/∆H*(t) over the area investigated were estimated, and the relation between ∆EWT(t) and ∆H(t)/∆H*(t) was discussed. Section 4.2.2 demonstrates the development of the ∆H(t)/∆H*(t) model and computing ∆HM(t)/∆H*M(t) values from this model. Section 4.2.3 discusses the possibility for predicting ∆HM(t)/∆H*M(t).

4.2.1. The Estimation of ∆H/H*

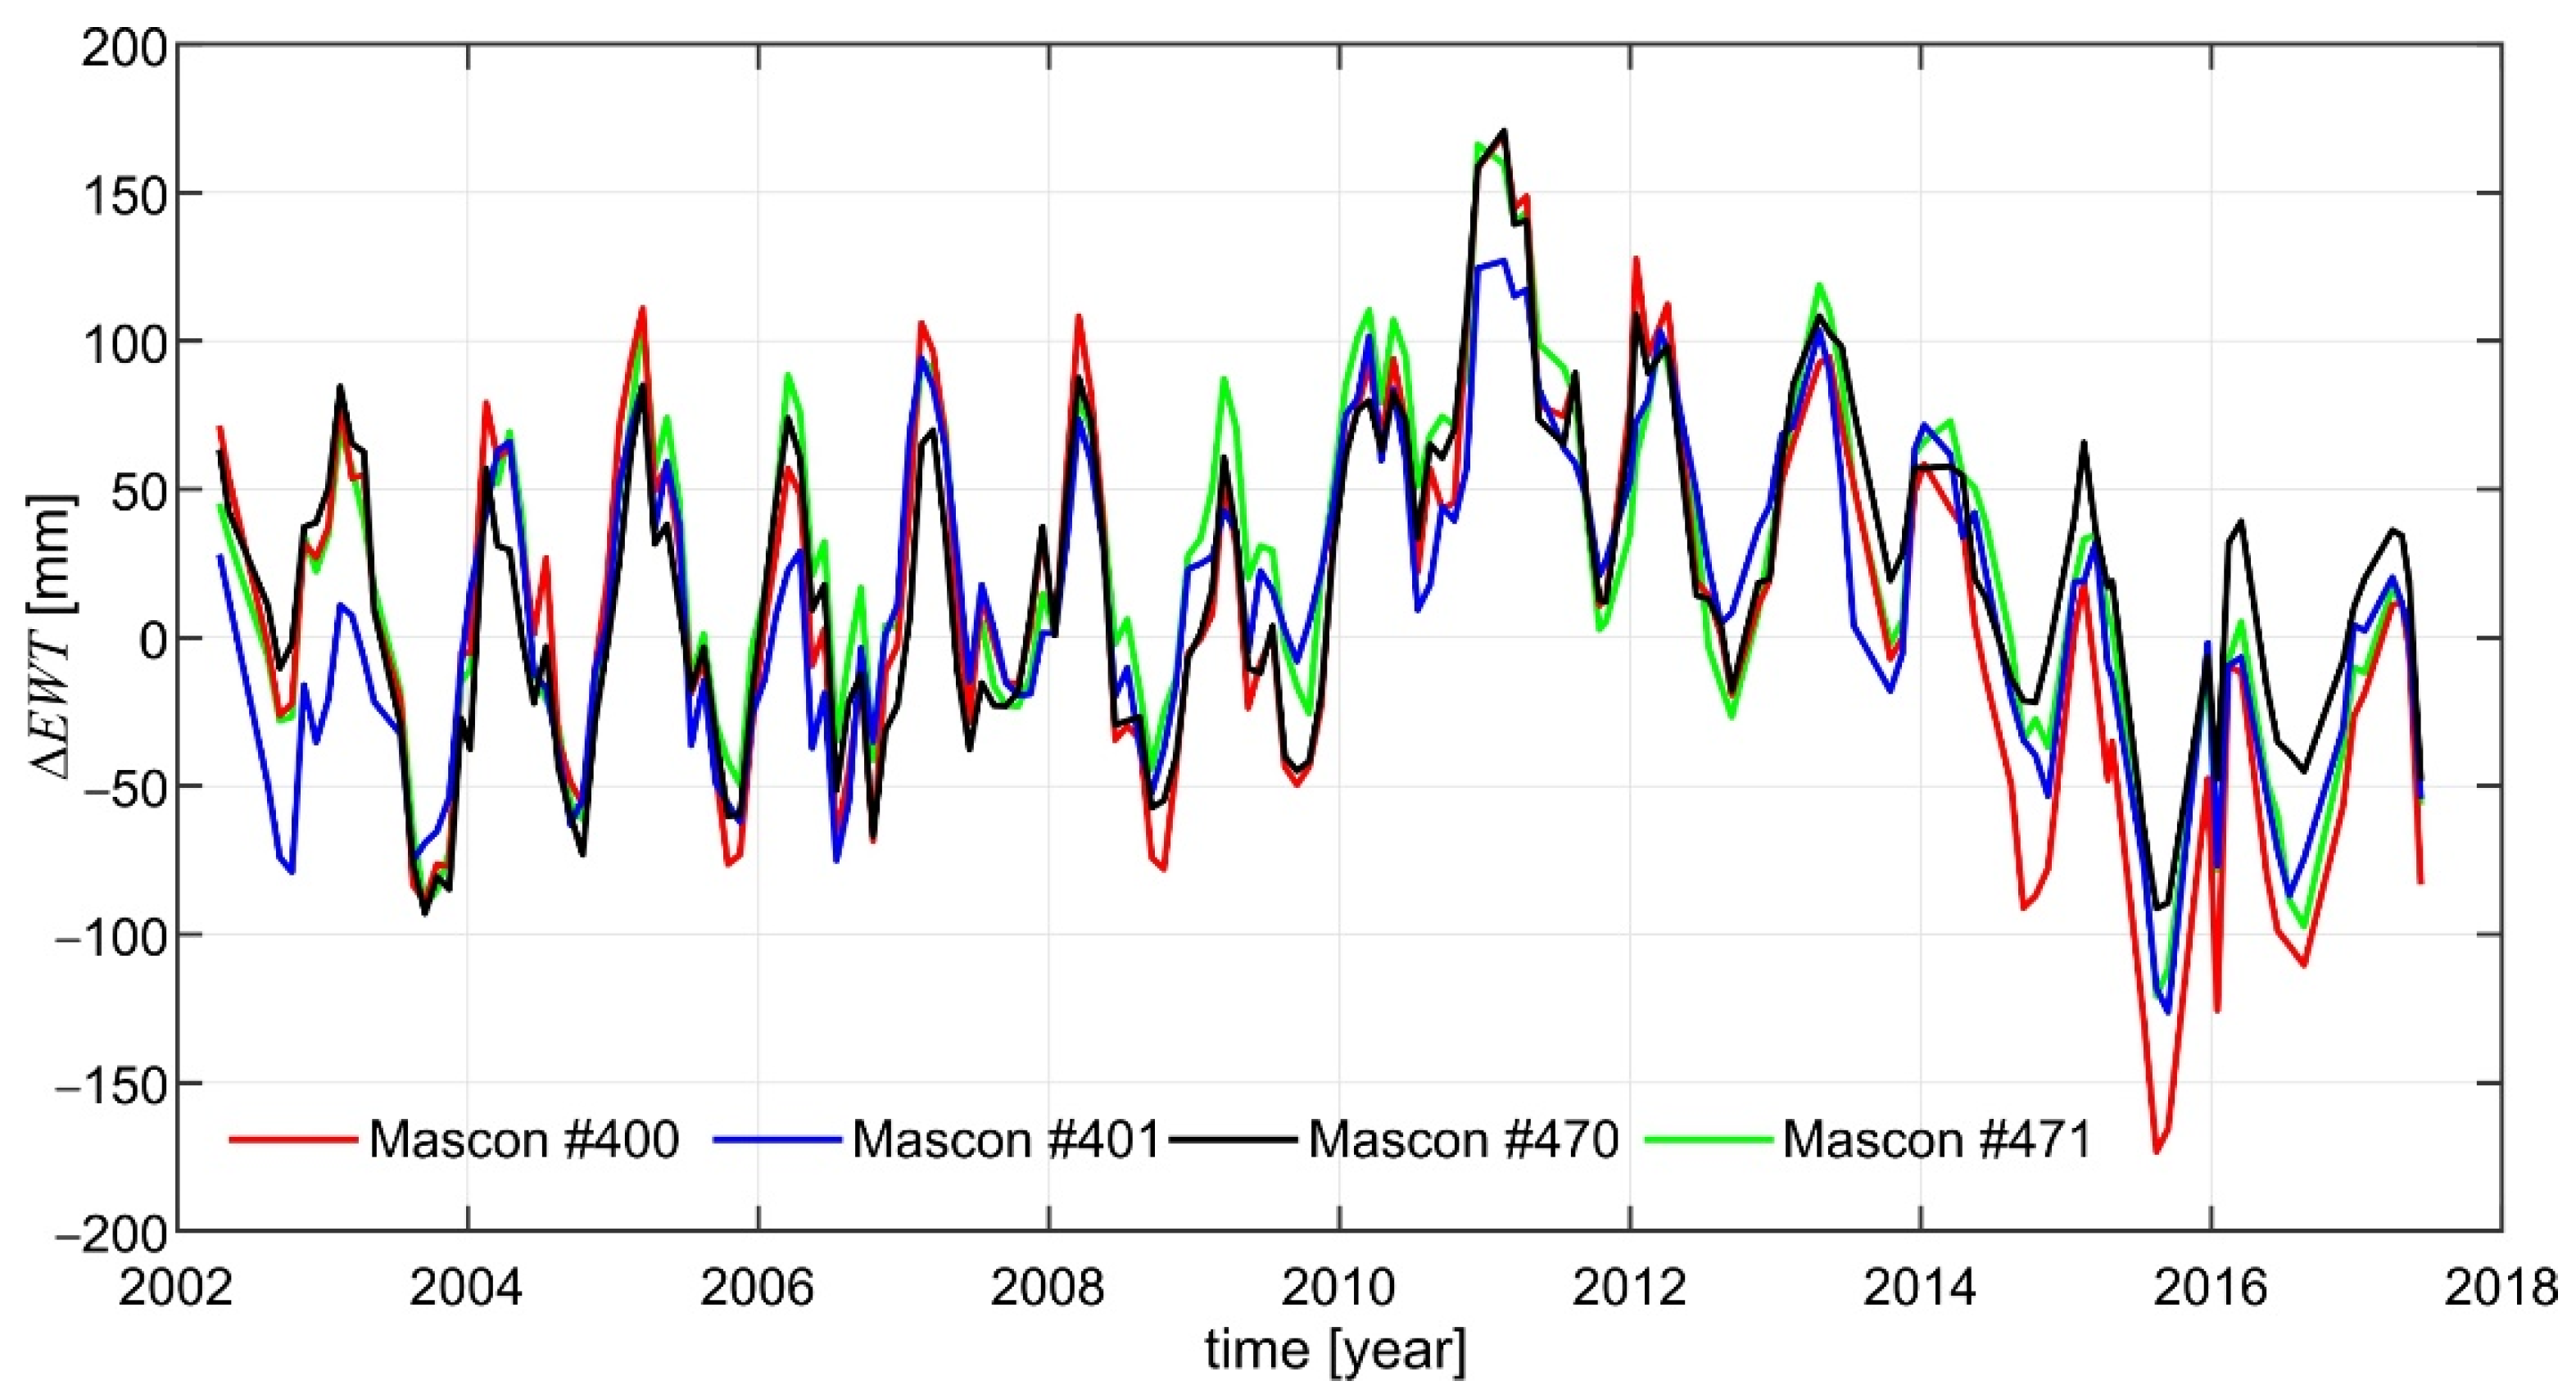
The territory of Poland was divided into equal area blocks of a size equivalent to the spatial resolution of GRACE data, i.e., ~334 × 334 km2 or 3° × 3° on the equator. Those equal area blocks are localized in the same configuration as the Jet Propulsion Laboratory (JPL) mascons (mass concentrations), global 3° × 3° equal area spherical cap mascon solutions. Figure 4 shows the area investigated, including the location of four mascons used. The main TMVES over this area can be ascribed to temporal hydrological mass variations [28]. Temporal variations of equivalent water thickness Δ E W T ( t i G ) over t i G t0 at the location of those mascons obtained from monthly release 06 (RL06) JPL GRACE mascon solutions using the mascon visualization tool (cf. https://ccar.colorado.edu/grace/index.html, accessed on 1 August 2022) are depicted in Figure 5.
The results presented in Figure 5 indicate a distinctive pattern of seasonal water mass variations with minimum and maximum values in July–September and March, respectively. This seasonal variations pattern agrees well with the corresponding one documented in Krynski et al. [28]. It reveals that the decrease/increase in water masses over Poland results from intensive water evaporation during dry months in the summer season and the accumulation of snow/water in the winter season.
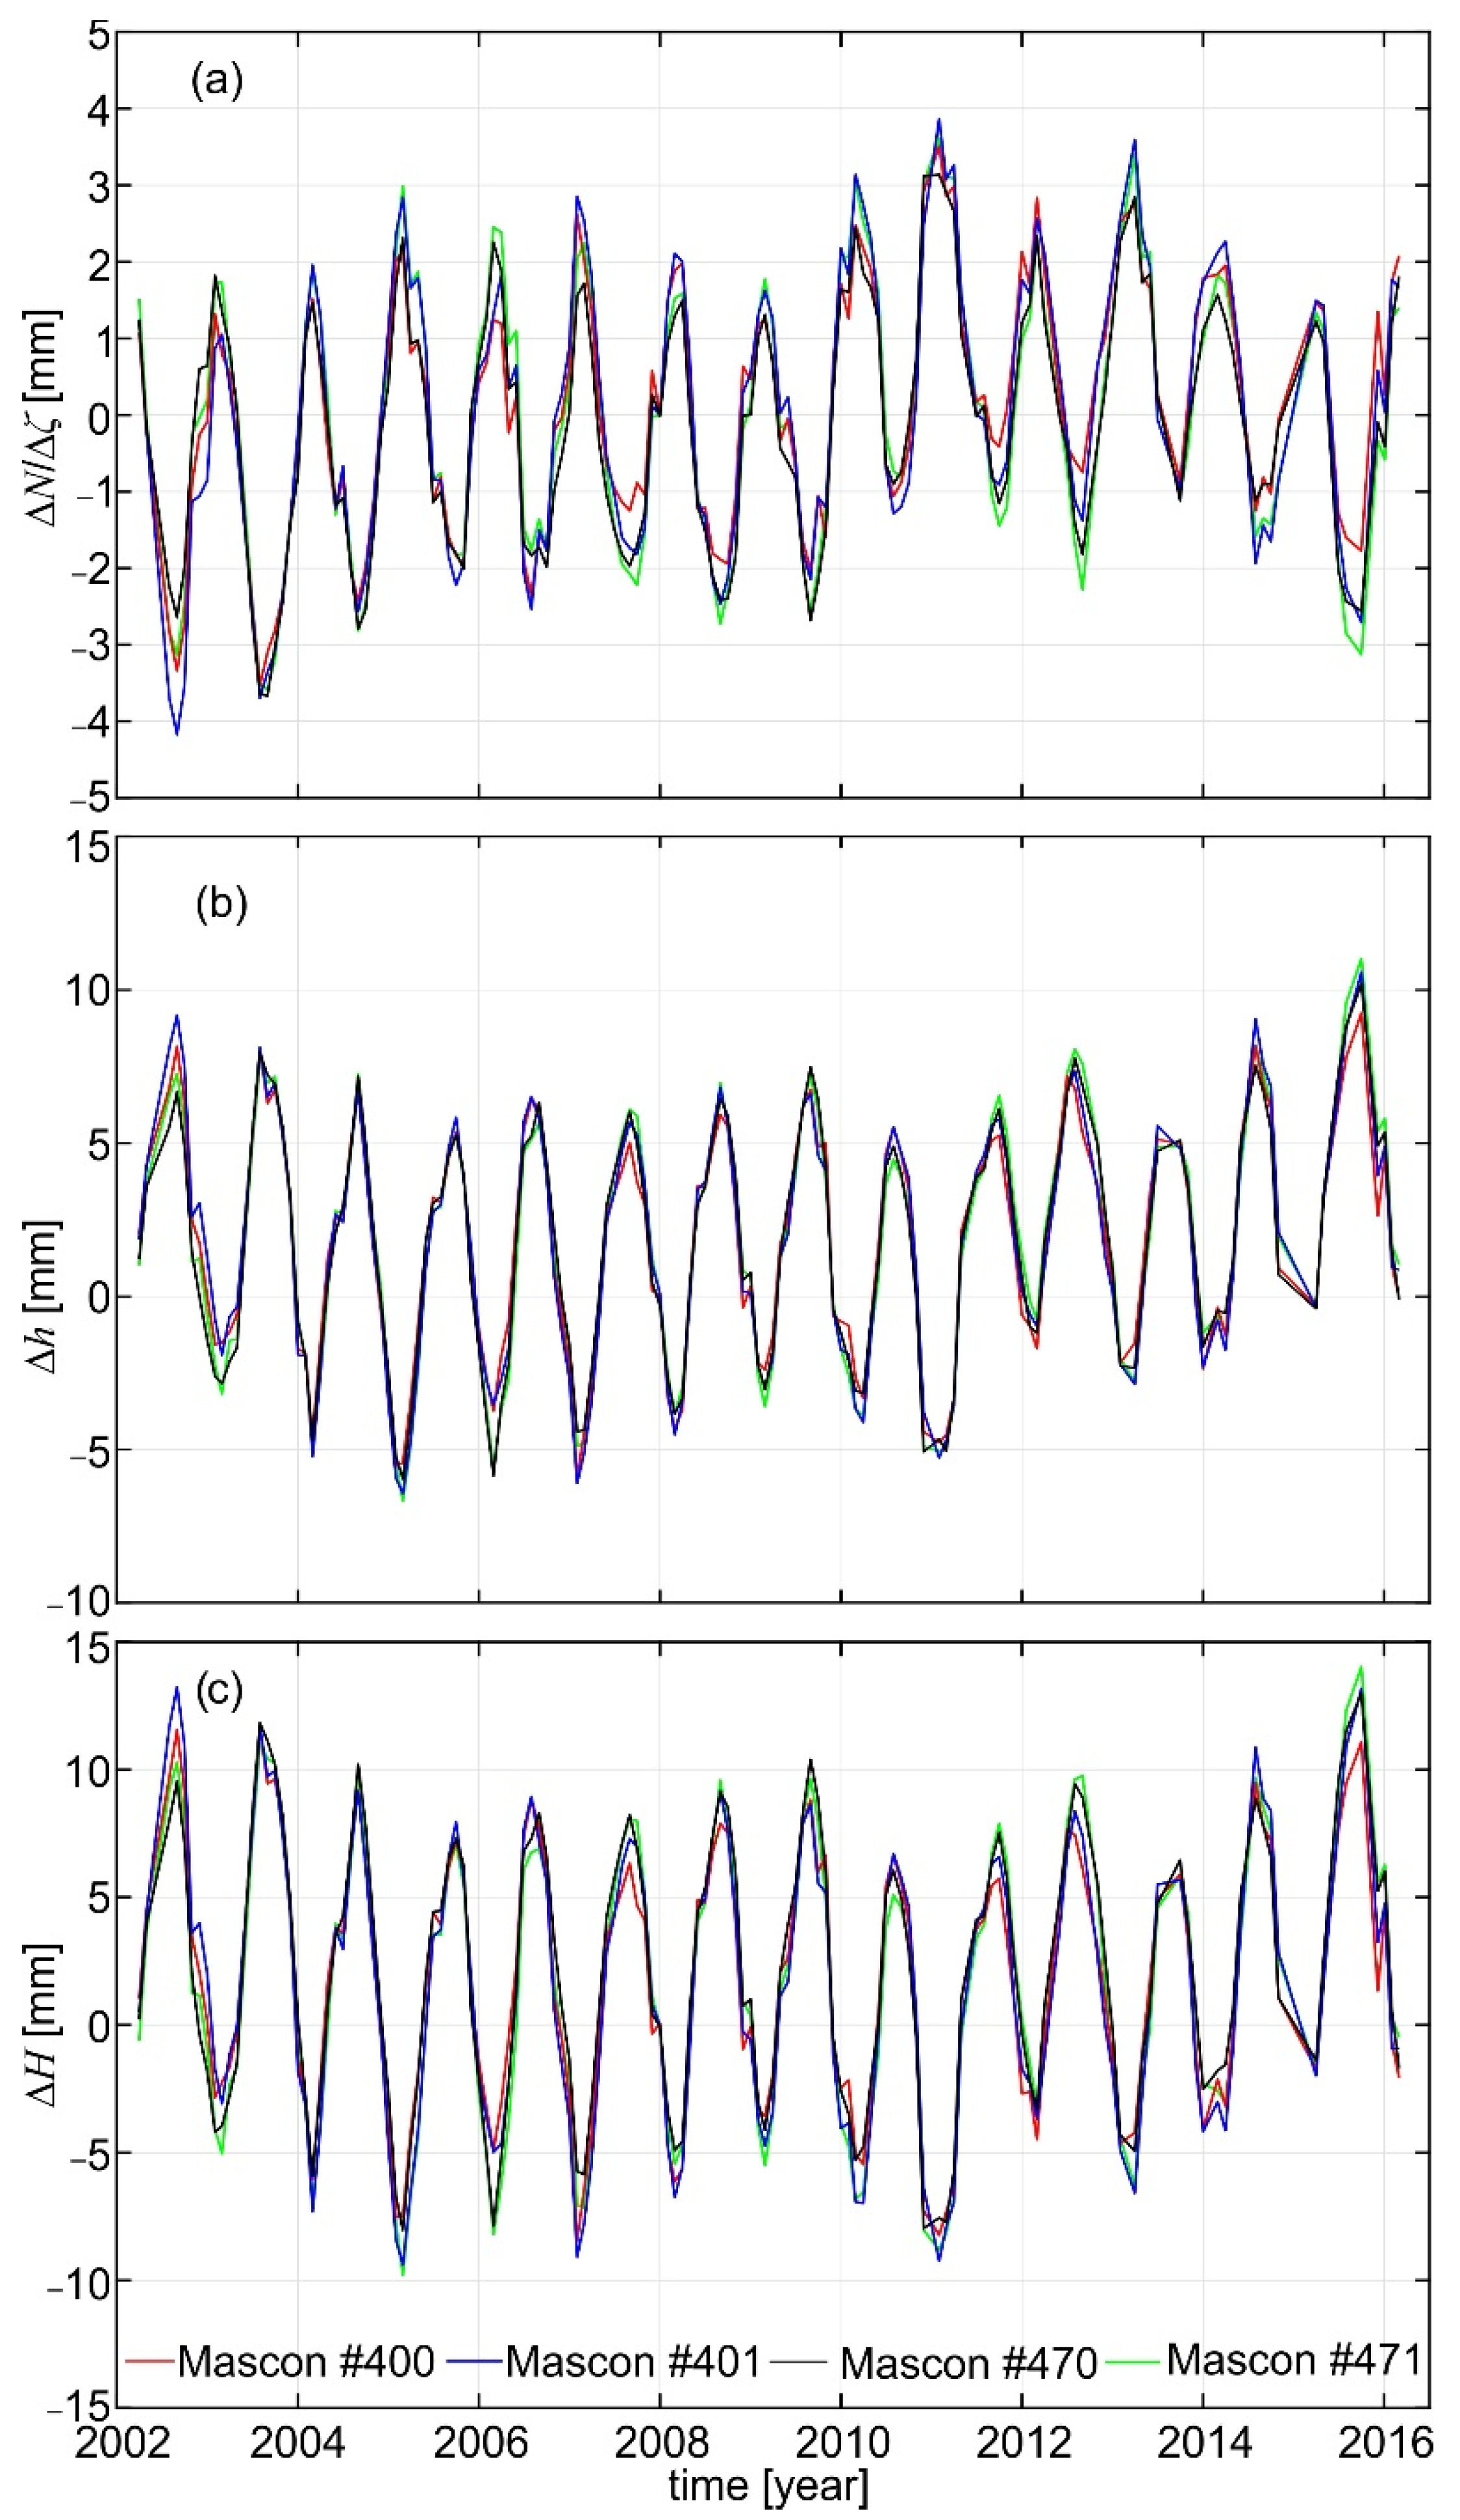
The Δ N ( t i G ) / Δ ζ ( t i G ) , as well as Δ h ( t i G ) , were estimated at the location of mascons (cf. Figure 4) using monthly CSR (Computation Centre of the University of Texas Center of Space Research) RL06 GRACE-based GGMs [48], LLN calculated using the preliminary reference Earth model (PREM; [49]), and the IGiK–TVGMF (Instytut Geodezji i Kartografii–Temporal Variations of Gravity/Mass Functionals; [50]) software. The degree-1 and degree-2 harmonic coefficients from the solution described in Swenson et al. [51] and the corresponding ones obtained from satellite laser ranging (SLR) [52], respectively, replaced those of CSR RL06 GRACE-based GGMs. In order to reduce the noise included in CSR RL06 GRACE-based GGMs, the decorrelation filter DDK3 [53] was utilized. This filter was chosen as it compromises between reducing the noise and keeping the signal over the area investigated [29]. Moreover, those GGMs were truncated at d/o 60 that corresponds to the spatial resolution of the mascon grid (Figure 4) and the DDK3 filter. Then, Δ H ( t i G ) / Δ H * ( t i G ) were estimated as a sum of detrended Δ N ( t i G ) / Δ ζ ( t i G ) , detrended Δ h ( t i G ) , and the linear trend (i.e., secular variations) of H/H* obtained from the NKG2016LU model [54]. The resulting Δ N ( t i G ) / Δ ζ ( t i G ) , Δ h ( t i G ) , and Δ H ( t i G ) / Δ H * ( t i G ) for the period April 2002–August 2016 are depicted in Figure 6.
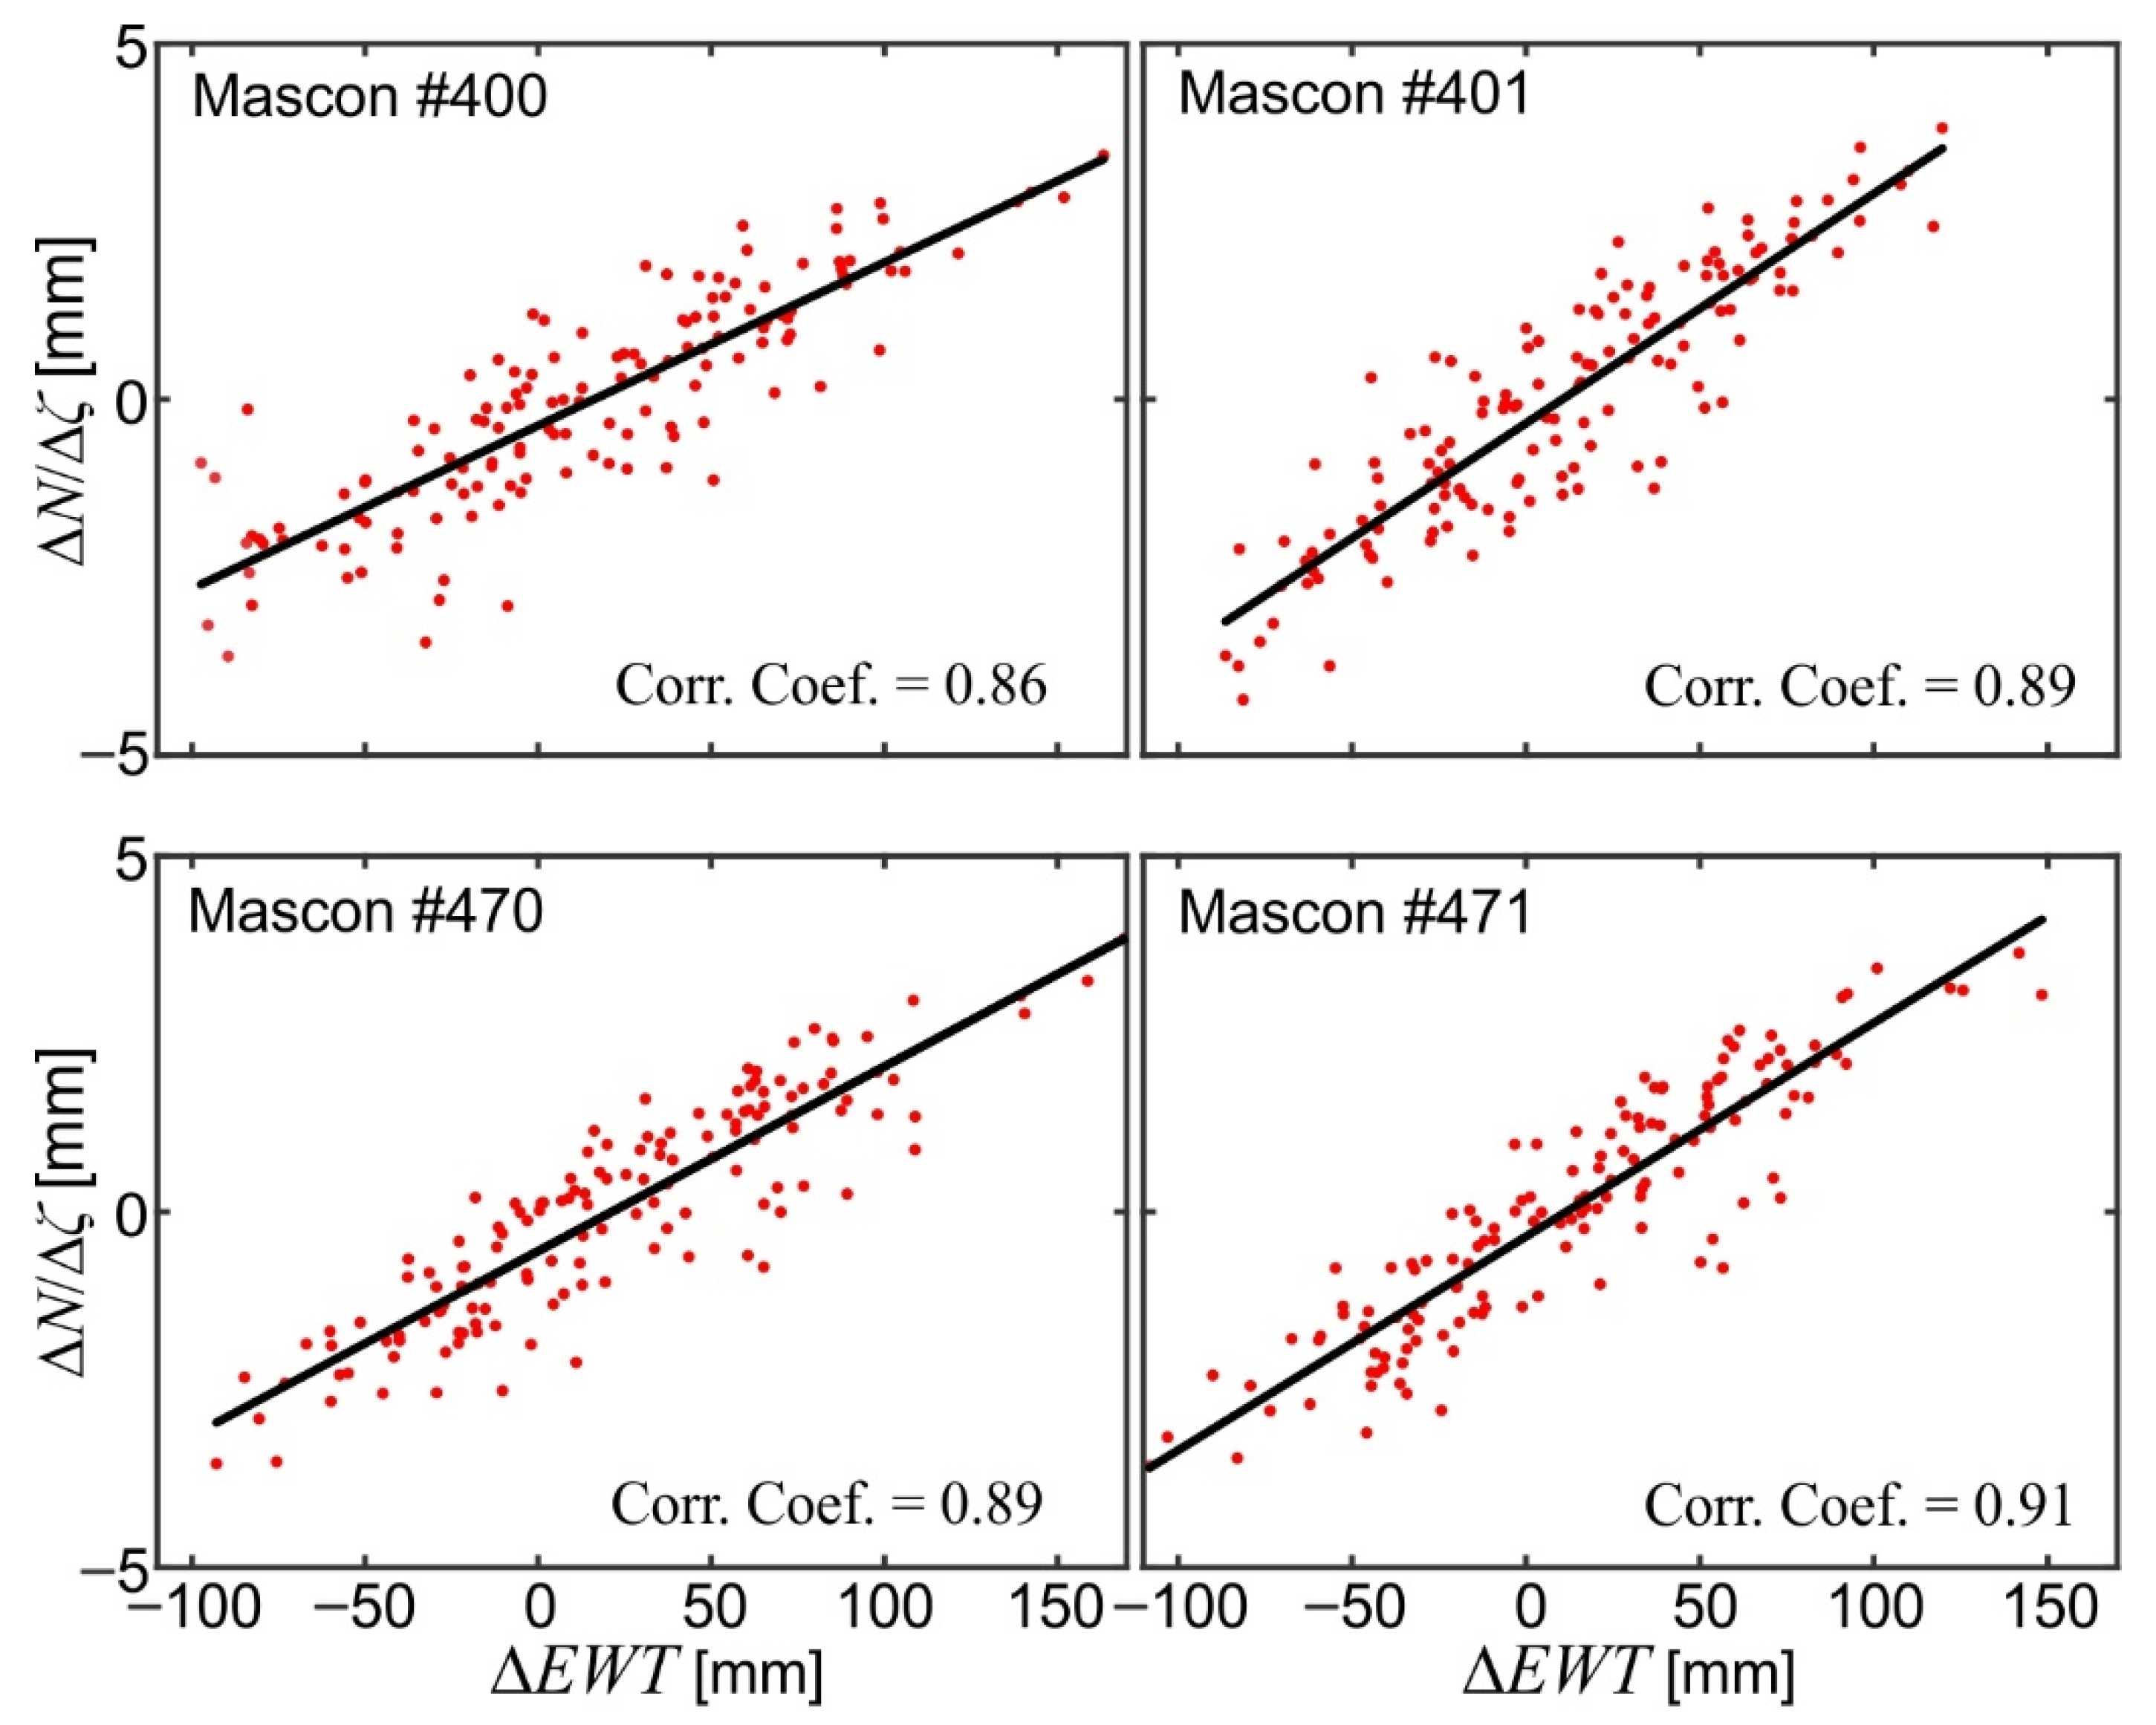
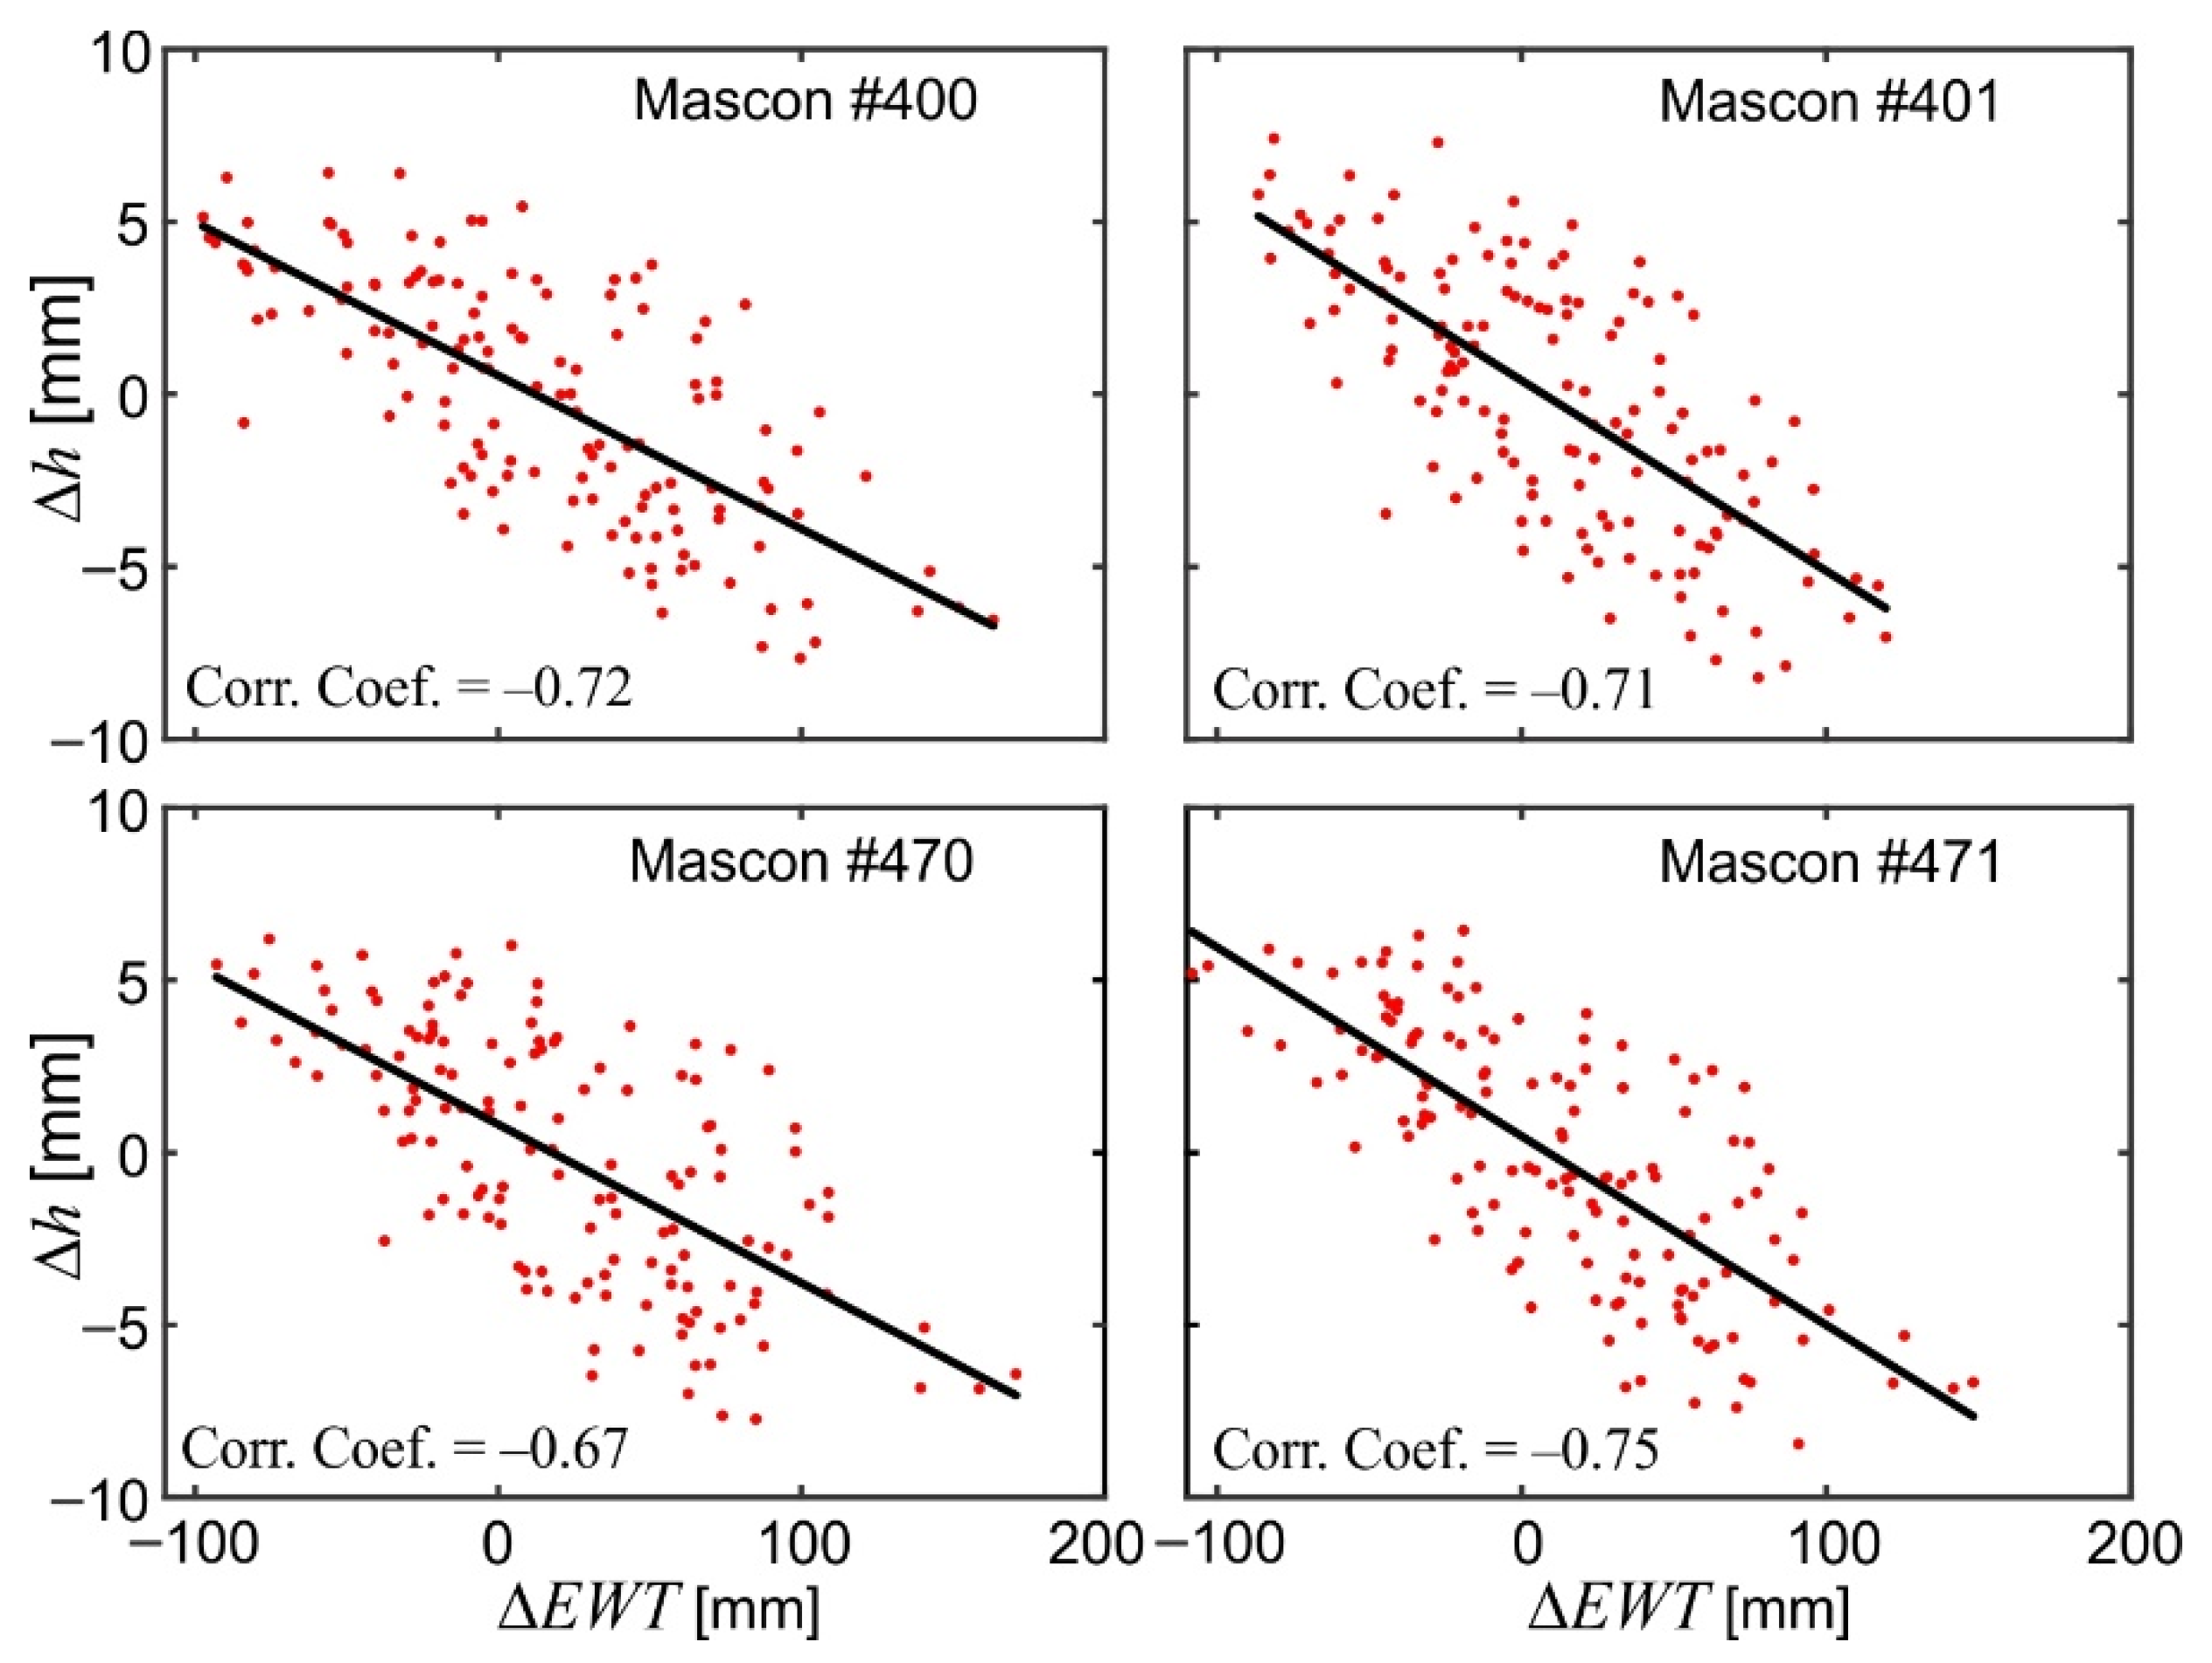
Figure 6 exhibits a clear seasonal pattern of Δ N ( t i G ) / Δ ζ ( t i G ) , Δ h ( t i G ) , and Δ H ( t i G ) / Δ H * ( t i G ) . The maximum values of Δ N ( t i G ) / Δ ζ ( t i G ) were obtained at the beginning of spring (in February–April) and minimum values at the end of summer/beginning of autumn (in August–October); they are consistent with the corresponding ones estimated by Krynski et al. [28] and Godah et al. [29,30,32]. For Δ h ( t i G ) , maximum values were obtained in August–October and minimum values in February–April, which correspond to minima and maxima of Δ N ( t i G ) / Δ ζ ( t i G ) , respectively. For a subarea, the dispersions of Δ N ( t i G ) / Δ ζ ( t i G ) and Δ h ( t i G ) reach 8 mm and 17 mm, respectively. Minimum and maximum values of Δ H ( t i G ) / Δ H * ( t i G ) , obtained as the combination of Δ N ( t i G ) / Δ ζ ( t i G ) and Δ h ( t i G ) , were observed in February–April and in August–October, respectively. The Δ H ( t i G ) / Δ H * ( t i G ) for the same subarea reach up to 23 mm, and 4 mm from one subarea to another at the same epoch. The results presented in Figure 6 also indicate that approximately 66% of the Δ H ( t i G ) / Δ H * ( t i G ) signal is due to Δh, while the remaining part of this signal is induced from ΔNζ. The coefficients of correlation between Δ E W T ( t i G ) (cf. Figure 5) and Δ N ( t i G ) / Δ ζ ( t i G ) , Δ h ( t i G ) , and Δ H ( t i G ) / Δ H * ( t i G ) are presented in Figure 7, Figure 8 and Figure 9, respectively, showing strong correlations between water mass changes and ΔNζ as well as Δh. The correlations between Δ E W T ( t i G ) and Δ N ( t i G ) / Δ ζ ( t i G ) are slightly stronger (correlation coefficients of 0.89 ± 0.02) compared to those between Δ E W T ( t i G ) and Δ h ( t i G ) , characterized by correlation coefficients of −0.71 ± 0.04. This might be due to the fact that N/ζ is basically associated with the disturbing potential generated from the Earth’s mass distribution, while the vertical deformations of the Earth’s surface may depend on other factors, e.g., the elasticity of the Earth’s crust. Overall, the results obtained reveal that the resulting ΔHH* are strongly correlated with ΔEWT (correlation coeffiecients of −0.80 ± 0.04).

4.2.2. The Analysis and Modelling of ΔH/ΔH* and Determining ΔHM/ΔH*M

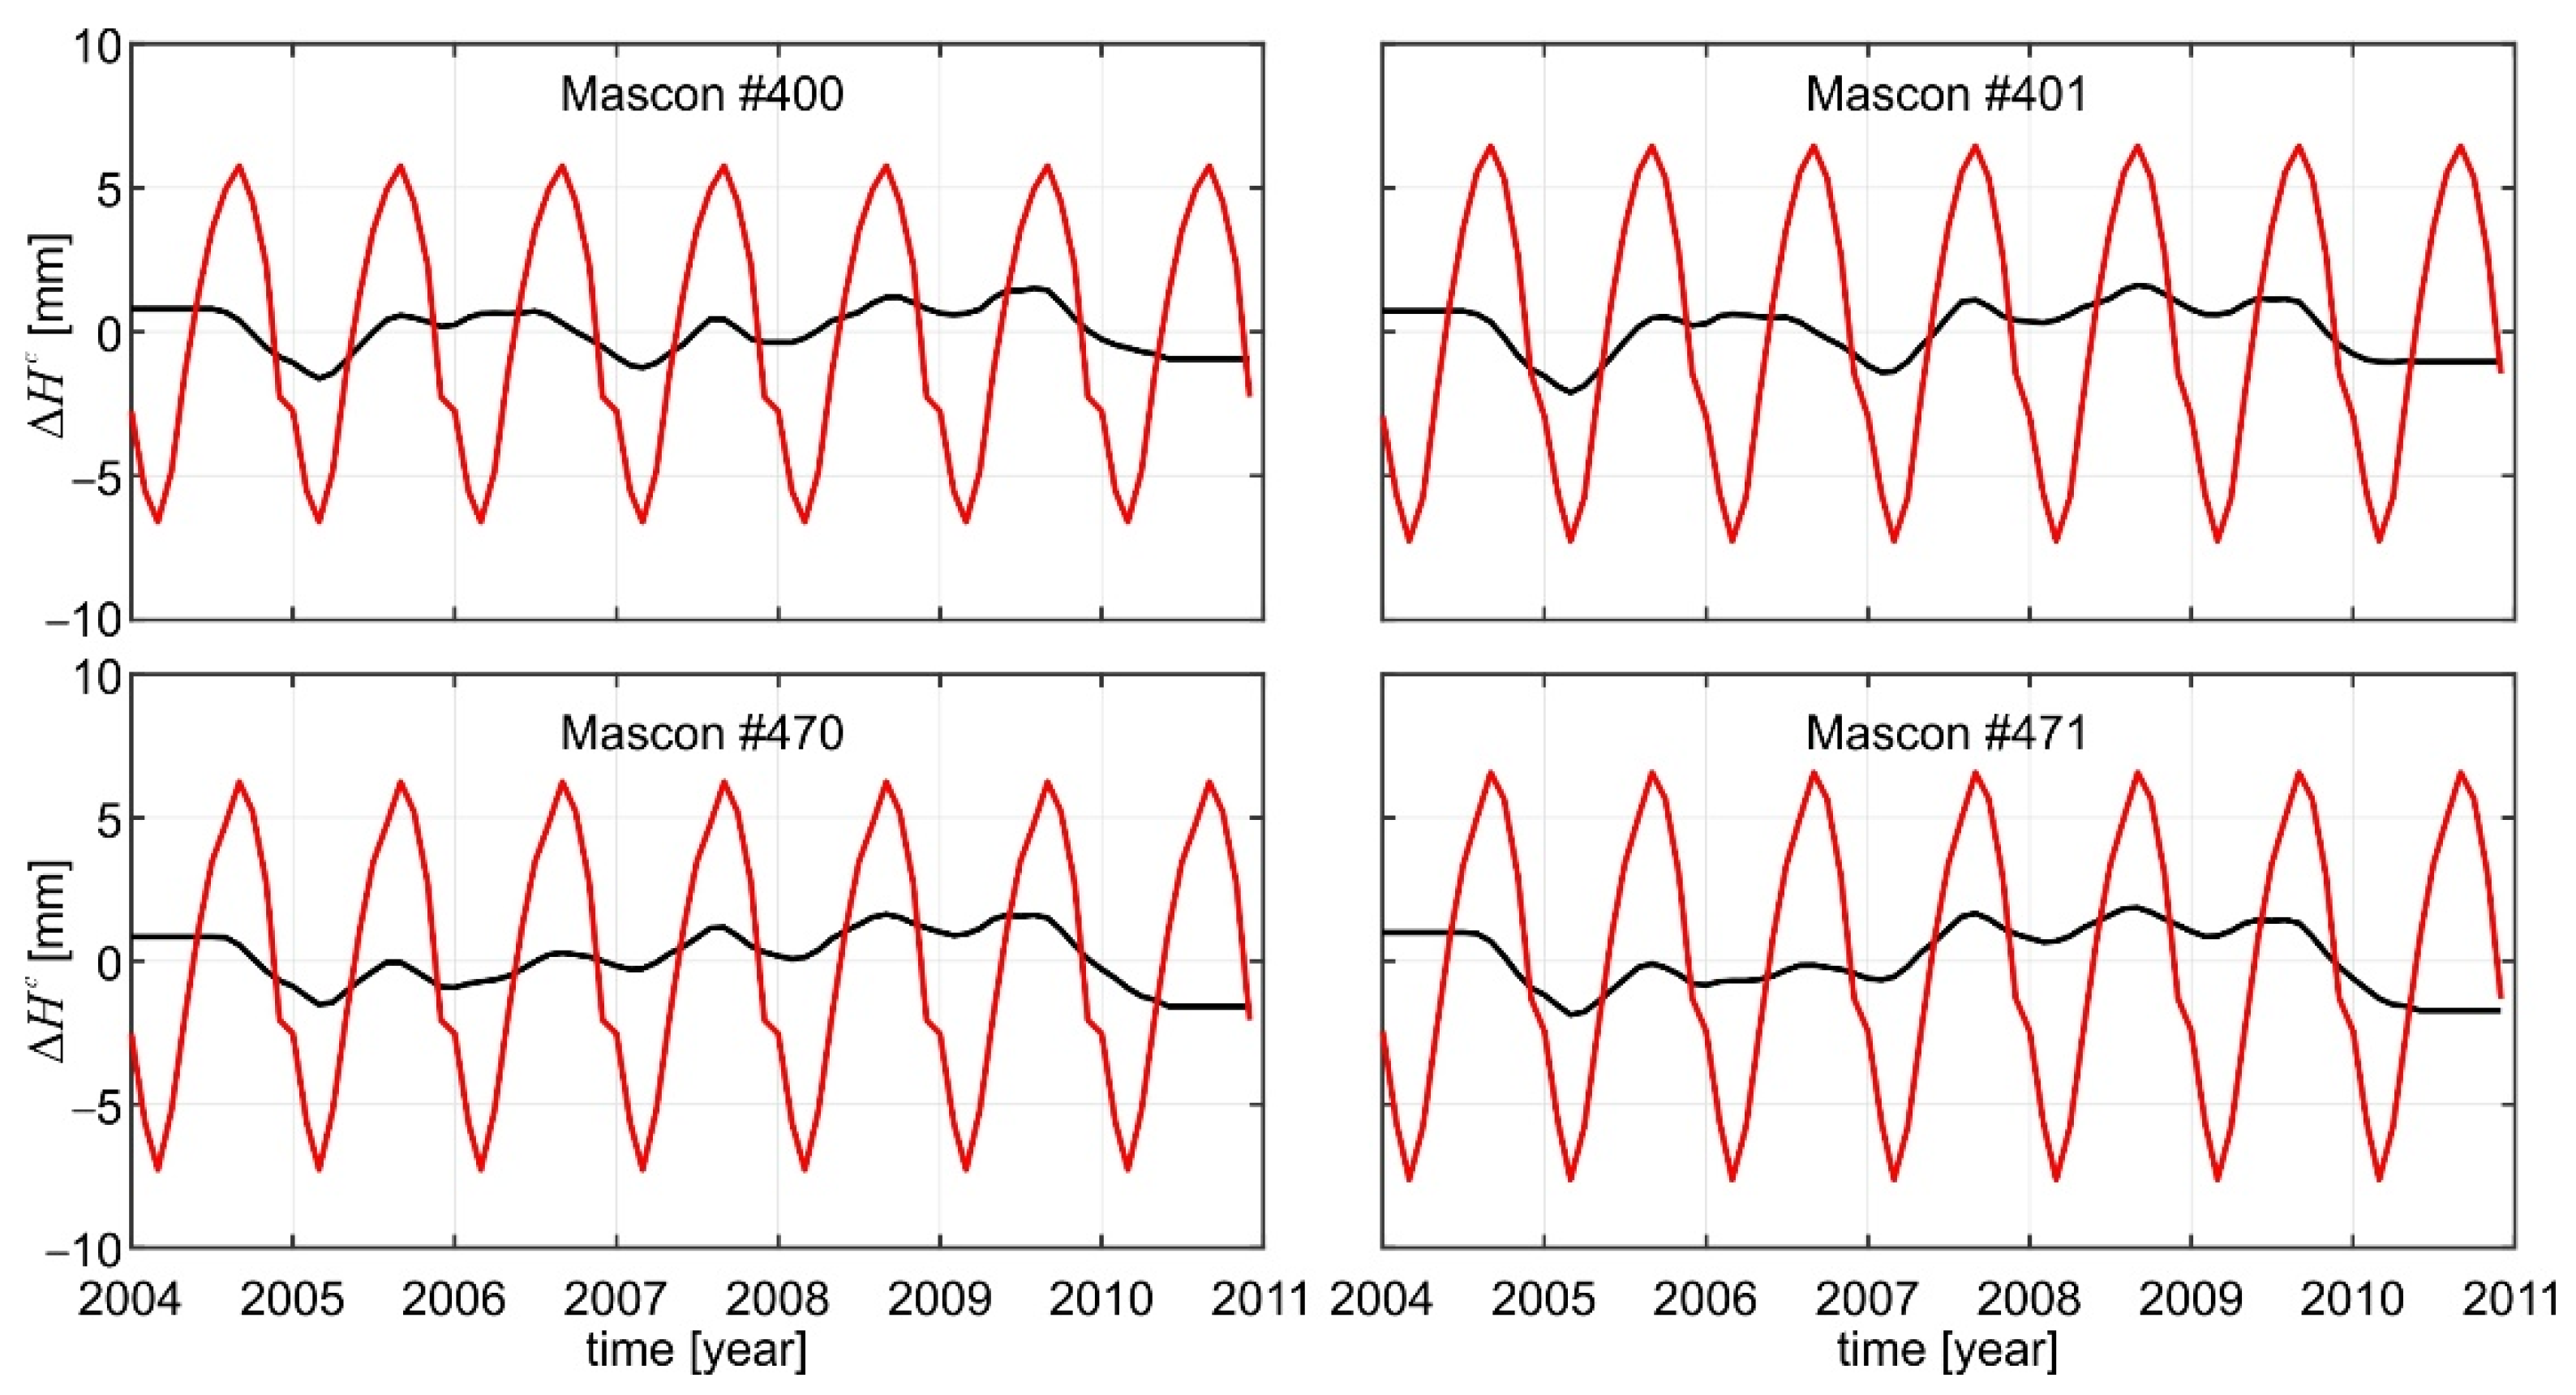
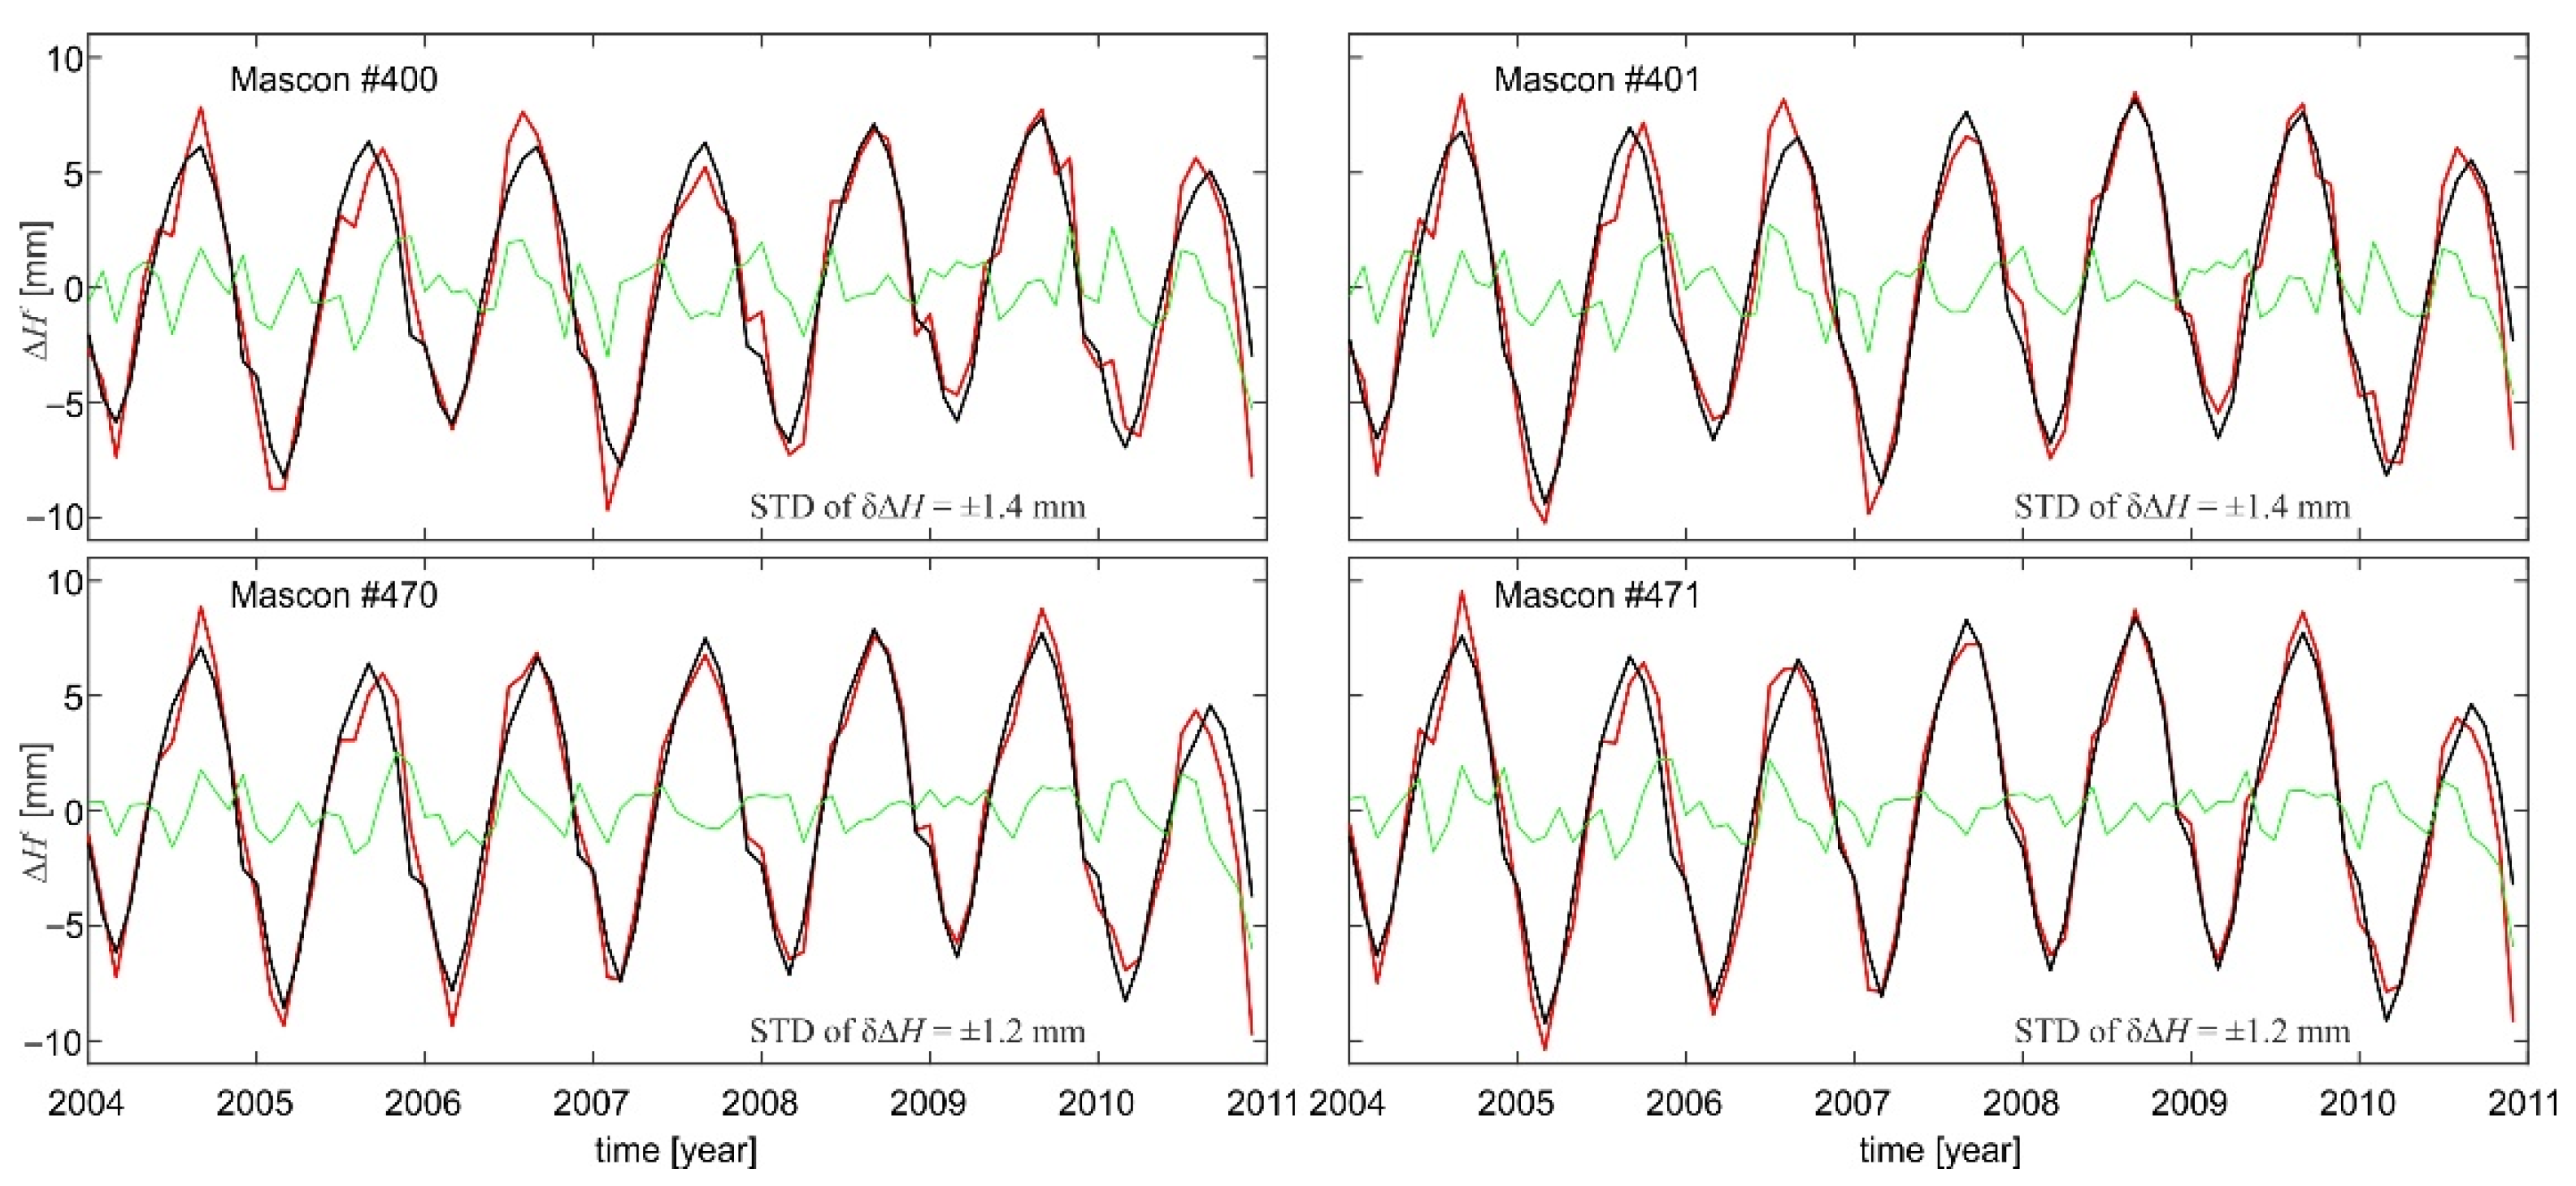
The seasonal decomposition (SD) method was used for the analysis and modelling of the ΔHH* determined. The Δ H c ( t i G ) / Δ H * c ( t i G ) time series, obtained by centering the Δ H ( t i G ) / Δ H * ( t i G ) time series to zero for the period between January 2004 and December 2010 exhibiting no gaps in monthly CSR RL06 GRACE-based GGMs, was applied. The long-term and seasonal components of Δ H S D ( t i G ) / Δ H * S D ( t i G ) , depicted in Figure 10, were used in Equation (15) for modelling ΔHH*. Figure 11 shows Δ H c ( t i G ) / Δ H * c ( t i G ) and Δ H S D ( t ) / Δ H * S D ( t ) models developed using the SD method (see Equation (15)). It also illustrates the differences δ∆H/δ∆H* between Δ H c ( t i G ) / Δ H * c ( t i G ) and their models Δ H S D ( t ) / Δ H * S D ( t ) .
Figure 10 indicates that the dominant signal of temporal variations of orthometric/normal heights comes from seasonal components of Δ H c ( t i G ) / Δ H * c ( t i G ) . The amplitudes of these seasonal components reach the level of 6.5 ± 0.5 mm. The long-term components of Δ H c ( t i G ) / Δ H * c ( t i G ) for the area and time period investigated exhibit a non-linear changing pattern. They fluctuate within the range of ±2 mm. The results presented in Figure 11 indicate a good agreement between Δ H S D ( t ) / Δ H * S D ( t ) models and Δ H c ( t i G ) / Δ H * c ( t i G ) data. The coefficients of correlation between Δ H S D ( t ) / Δ H * S D ( t ) and the respective Δ H c ( t i G ) / Δ H * c ( t i G ) are at the level of 0.97. The standard deviations of δ∆H/δ∆H* are in the range of 1.3 ± 0.1 mm.
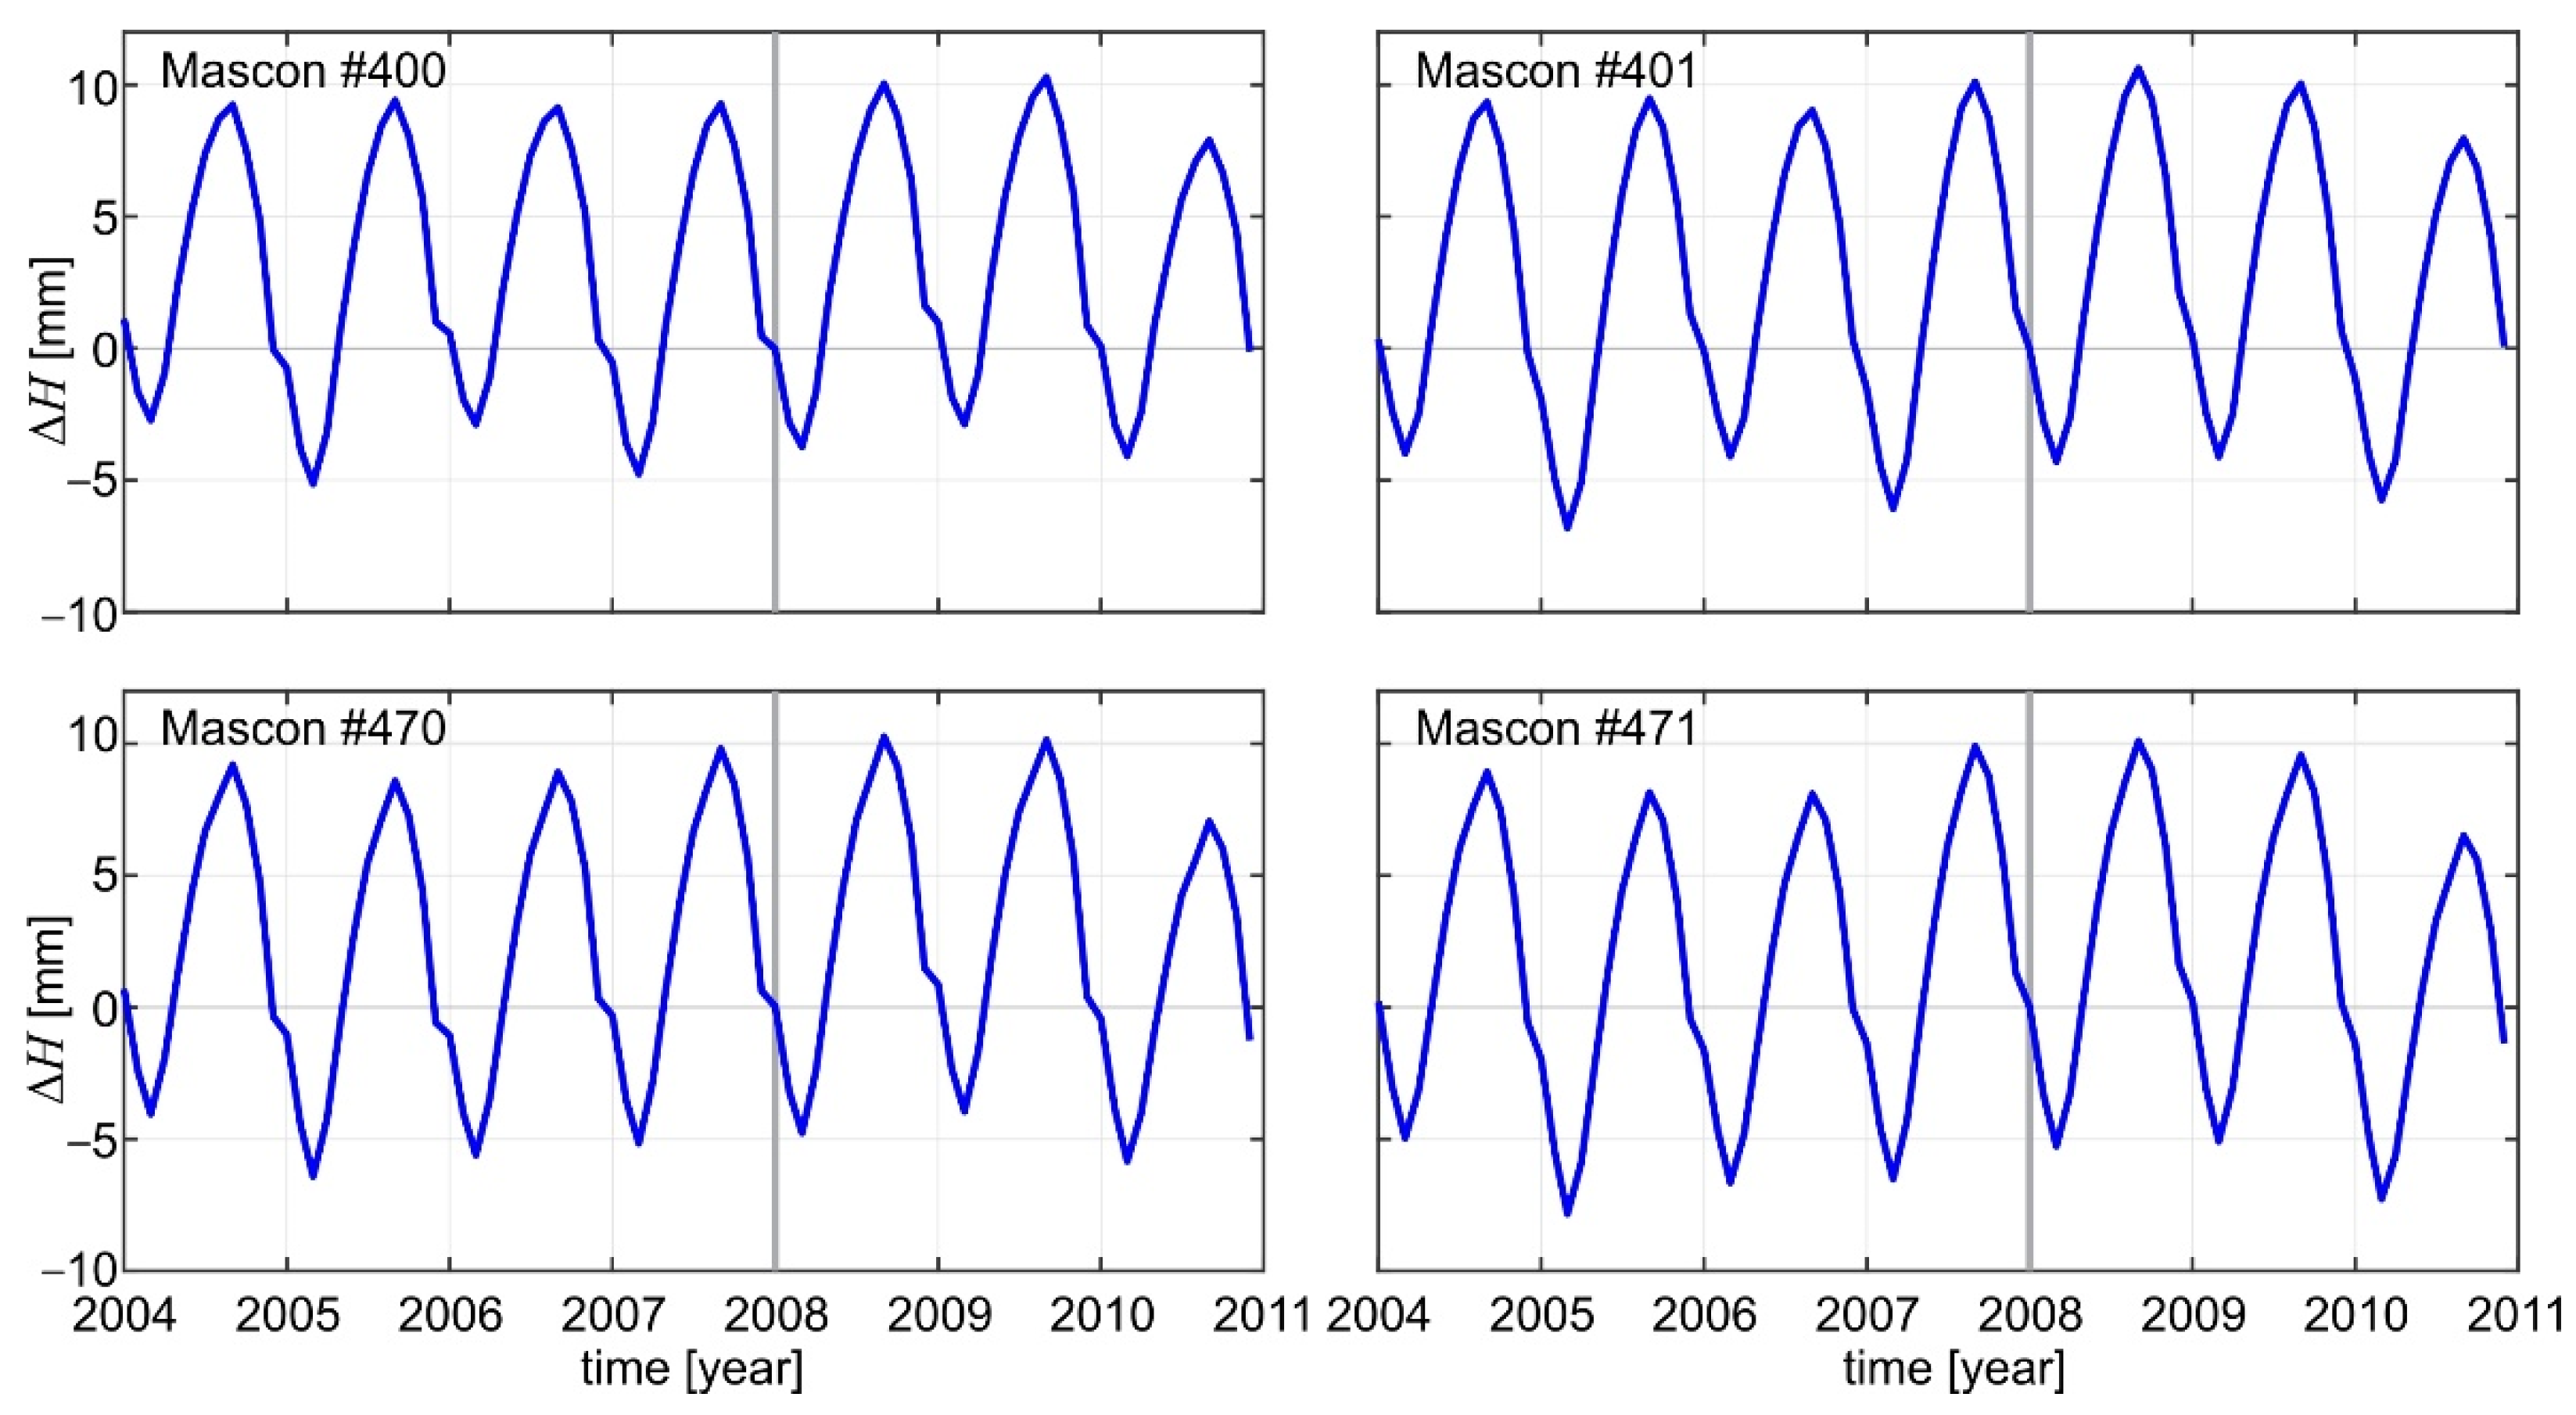
The ∆HSD(t)/∆H*SD(t) models are centered to zero (see Figure 11). Thus, in order to determine ∆HM(t)/∆H*M(t), the ∆HSD(t)/∆H*SD(t) had to be referred to the reference epoch t0, i.e., 1 January 2008, that has been used as the realization epoch of orthometric/normal heights. In this study, ∆HM(t)/∆H*M (t) were determined by shifting those ∆HSD(t)/∆H*SD(t) considering the offset (τ) that is equal to: 1.9 mm, 1.9 mm, 2.6 mm, and 2.0 mm for the mascons #400, #401, #470, and #471, respectively (see Figure 12).

4.2.3. The Prediction of ΔHM/ΔH*M

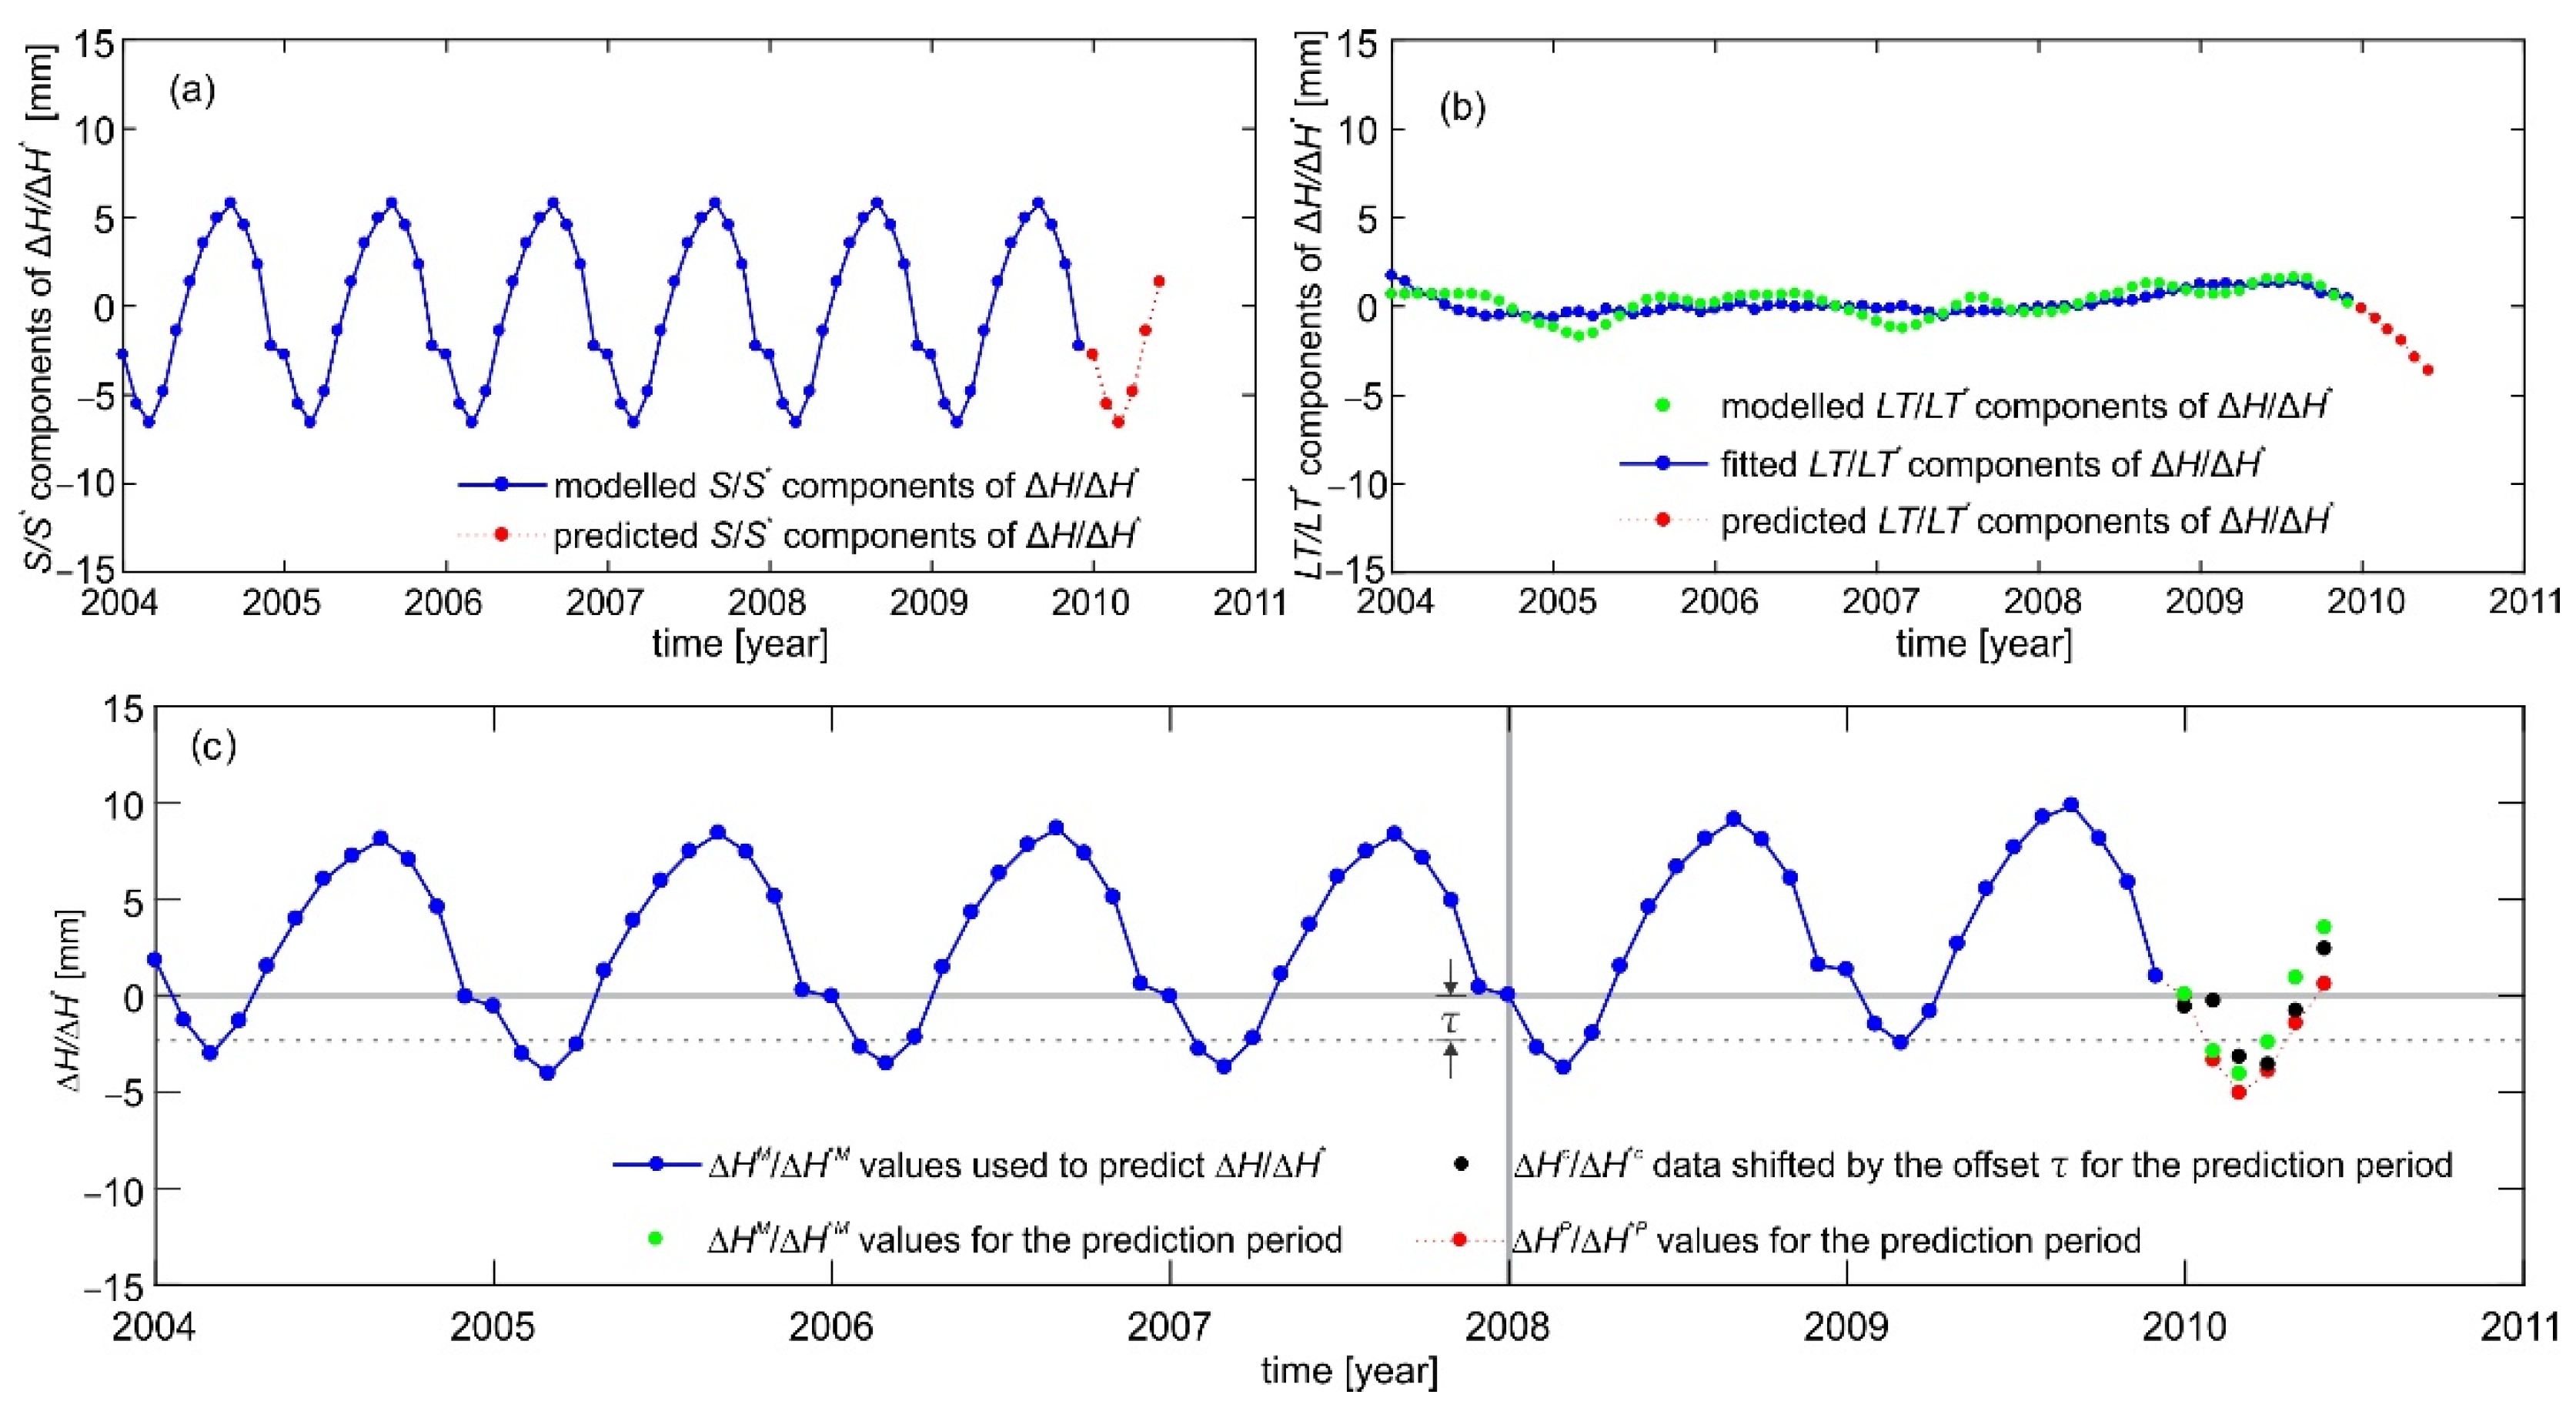
The GRACE/GRACE–FO level 2 products, i.e., GGMs or mascon solutions, are generally available with a latency of a couple of months from taking measurements by the GRACE/GRACE–FO satellites. Thus, ∆HM/∆H*M obtained from these products for the present time should be predicted. With the use of ΔHcH*c data from 6 years preceding the prediction period, S/S* and LT/LT* components of ∆H/∆H* were determined with the SD method. Several mathematical models, e.g., exponential models, Fourier series, Gaussian models, polynomial models, and sum of sines models, were investigated for their fit to the LT/LT* component of ∆H/∆H* using Matlab [55]. The 7th degree polynomial model was chosen as the best fitted one. The predicted values of ∆HM/∆H*M were determined by combing (1) S/S* component of ∆H/∆H*, (2) values of ∆H/∆H* resulted from the 7th degree polynomial model fitted to LT/LT* component of ∆H/∆H*, and (3) the offset (τ).
Figure 13 depicts the example of ΔHMH*M together with their predicted values ΔHPH*P as well as S/S* and LT/LT* components of ΔHH*. It also illustrates the LT/LT* component of ΔHH* obtained using the 7th degree polynomial model. The ΔHPH*P variations presented in Figure 13 were computed for the period of January 2010–June 2010 using ΔHcH*c from January 2004 to December 2009. The ΔHcH*c shifted by τ and ΔHPH*P, as well as the predicted values of S/S* and LT/LT* for this prediction period, were also shown in Figure 13. To obtain ΔHPH*P in different periods of the year, this procedure was repeated seven times, shifting the beginning of the time series by 1 month. Each time, ΔHPH*P were predicted for six epochs coinciding with the respective 6 months (Figure 14). The differences
δ P 1 = Δ H P ( t ) / Δ H * P ( t ) Δ H S D ( t ) / Δ H * S D ( t )
as well as the differences
δ P 2 = Δ H P ( t ) / Δ H * P ( t ) [ Δ H c ( t ) / Δ H * c ( t ) + τ ]
were obtained. The statistic of the differences δP1 and δP2 for the predicted six months are given in Table 1.
The results given in Table 1 and presented in Figure 13 and Figure 14 reveal uneven differences between the predicted ΔHMH*M and their corresponding ΔHcH*c data shifted by the offset τ for all investigated cases. Differences δP2 for the first 3 months range from −3.1 to 1.4 mm, when predicting the values of ΔHMH*M for 6 months from January 2010 to June 2010 using ΔHcH*c data from January 2004 to December 2009; they range from −2.9 to 0.0 mm, when predicting the values of ΔHMH*M for the period from March 2010 to August 2010 using ΔHcH*c data from March 2004 to February 2010. This may indicate that the fit of the predicted values of ΔHMH*M to ΔHcH*c data shifted by the offset τ strongly depends on the magnitude and the character of ΔHH* within the predicted period. The statistics given in Table 1 indicate that the prediction accuracy in terms of the standard deviations of δP1 and δP2 ranges from 0.2 to 1.2 mm, and from 1.2 to 2.3 mm, respectively. It shows that the prediction accuracy of ΔHH* in the case of δP1 is higher compared to the case of δP2. This might be ascribed to the fact that differences δP2 include not only the error of the predicting procedure, such as δP1, but also the error resulting from the modelling procedure.

4.3. The Determination of H(t)/H*(t)

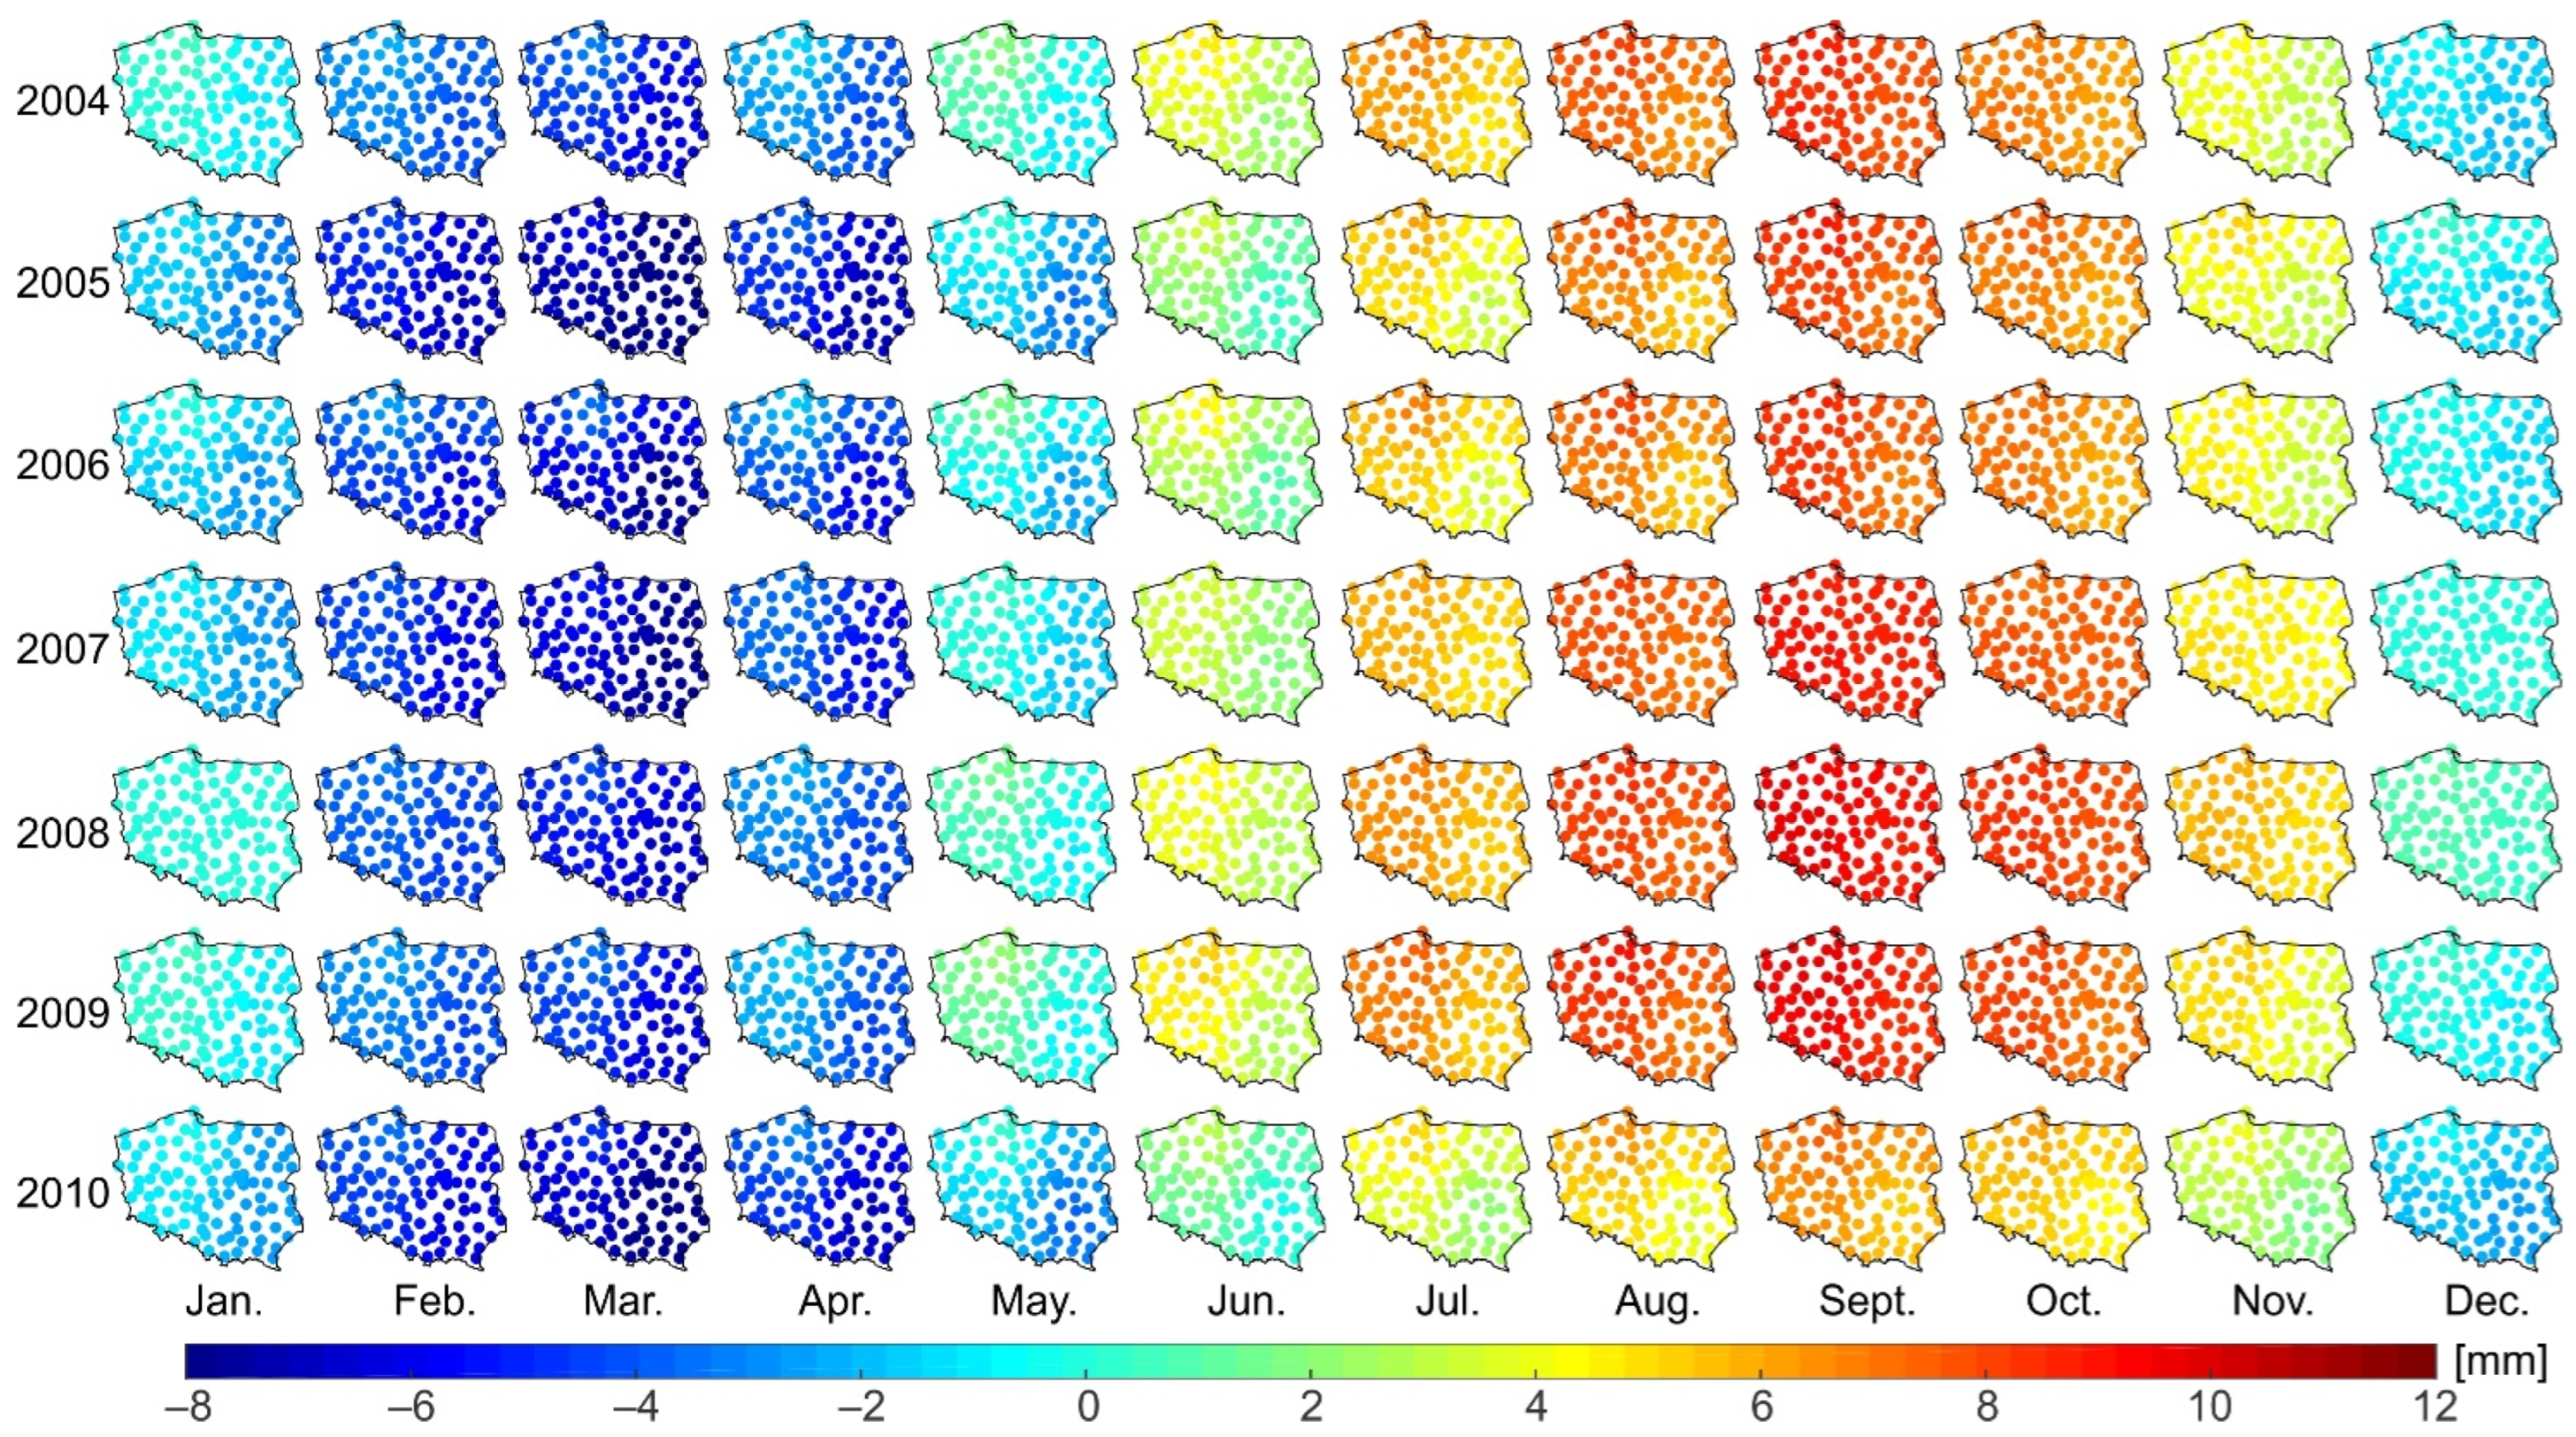
The inverse distance to a power interpolation method was used to interpolate/extrapolate the ∆HM(t)/∆H*M(t) referred to the epoch of 1 January 2008 at the sites of the ASG-EUPOS network (see Figure 3). Figure 15, showing these changes, exhibits clear variability of H/H* at the ASG-EUPOS sites in both time and space domains. This variability can reach 20 mm from March to September. Figure 15 also illustrates that in the space domain, the variability of H/H* over Poland at the same epoch can reach ~2 mm. The H(t)/H*(t) for the period of 2004–2011 over the area investigated can be obtained by adding the interpolated/extrapolated values of ∆HM(t)/∆H*M(t) referred to the epoch 01.01.2008 to the H(t0)/H*(t0) described in Section 4.1.

5. Conclusions

The paper discusses the determination of orthometric/normal heights H/H* considering their dynamics of both secular and seasonal character. An approach based on the GRACE satellite mission data are proposed to determine such heights. The results obtained from the implementation of this approach over the area of Poland that was chosen as a case study indicated that:
  • Temporal variations of orthometric/normal heights ΔH/ΔH* for the period from April 2002 to August 2016, obtained as a combination of temporal variations of geoid/quasigeoid heights ΔNζ and vertical deformations of the Earth’s surface Δh reach up to 23 mm.
  • The major part of the signal, i.e., ca. 66%, of ΔH/ΔH* results from Δh, while its remaining part is due to ΔNζ.
  • The ΔH/ΔH* are strongly correlated with ΔEWT (correlation coefficients of −0.79 ± 0.03).
  • The use of the seasonal decomposition method makes possible modelling ΔH/ΔH* with one millimetre accuracy at the confidence level of 97%; it also makes possible predicting them for the next six months with the accuracy of ca. 1–2 mm.
Overall, the research conducted within the course of the paper emphasizes the need for the H/H* to be corrected for their dynamics. Such heights will be required for fulfilling the contemporary geodetic scientific purposes and high-precision applications associated with the physical heights. For example, ΔH/ΔH* can particularly be significant to mitigate artifacts and aliasing of repeated levelling measurements. Let us assume that two repeated levelling campaigns were conducted in different epochs over the area of Poland, the first campaign in winter/spring seasons (February–April) and the second campaign in summer/autumn seasons (i.e., August–October). In order to merge and integrate H/H* determined from these levelling campaigns, ΔH/ΔH* should be considered, otherwise, all levelling measurements associated with the first campaign will be biased by ca. 2 cm with respect to those from the second campaign. Furthermore, H/H* are nowadays, more and more frequently determined by combining ellipsoidal heights from GNSS data with geoid/quasigeoid heights obtained from highly accurate gravimetric geoid/quasigeoid model. Taking into the consideration ΔNζ and Δh in Poland, the dynamics of orthometric/normal heights will essentially be needed for the determination of H/H* in Poland when using GNSS solutions combined with a precise geoid/quasigeoid model.
The gravity-dedicated satellite missions, e.g., GRACE, provide valuable information for the determination of H/H* corrected for their dynamics. In particular, they provide unique information concerning long-wavelength components of physical height changes. Since the spatial resolution of ΔH/ΔH* obtained from GRACE satellite mission data is limited to 3° × 3° at the equator, complementary data of high spatial resolution from other sources, e.g., high-resolution hydrological models, would be required to gain more information about short–medium wavelength components, i.e., beyond d/o 60, of ΔH/ΔH*.

Author Contributions

Conceptualization, M.S., W.G. and J.K.; methodology, M.S. and W.G.; software, W.G.; formal analysis, M.S. and W.G.; data acquisition, M.S. and W.G.; writing—original draft preparation, M.S. and W.G.; writing—review and editing, J.K.; visualization, M.S. and W.G.; supervision, J.K.; project administration, W.G.; funding acquisition, W.G. and M.S. All authors have read and agreed to the published version of the manuscript.

Funding

This research was funded by the National Science Center, Poland, grant number: 2021/42/E/ST10/00218.

Data Availability Statement

Not applicable.

Conflicts of Interest

The authors declare no conflict of interest.

References

  1. Farahani, H.H.; Klees, R.; Slobbe, C. Data requirements for a 5-mm quasi-geoid in the Netherlands. Stud. Geophys. Geod. 2017, 61, 675–702. [Google Scholar] [CrossRef]
  2. Foroughi, I.; Vaníček, P.; Kingdon, R.W.; Sheng, M.; Afrasteh, Y.; Novák, P.; Santos, M.C. Sub-centimetre geoid. J. Geod. 2018, 93, 849–868. [Google Scholar] [CrossRef]
  3. Ellmann, A.; Märdla, S.; Oja, T. The 5 mm geoid model for Estonia computed by the least squares modified Stokes’s formula. Surv. Rev. 2019, 52, 352–372. [Google Scholar] [CrossRef]
  4. Drewes, H.; Kuglitsch, F.; Adám, J.; Rózsa, S. The Geodesist’s handbook 2016. J. Geod. 2016, 90, 907–1205. [Google Scholar] [CrossRef]
  5. Dach, R.; Lutz, S.; Walser, P.; Fridez, P. Bernese GNSS Software Version 5.2. User Manual; Astronomical Institute, University of Bern, Bern Open Publishing: Bern, Switzerland, 2015; ISBN 978-3-906813-05-9. [Google Scholar] [CrossRef]
  6. Mäkinen, J.; Saaranen, V. Determination of post-glacial land uplift from the three precise levellings in Finland. J. Geod. 1998, 72, 516–529. [Google Scholar] [CrossRef]
  7. Fotopoulos, G. An Analysis on the Optimal Combination of Geoid, Orthometric and Ellipsoidal Height Data. Ph.D. Thesis, UCGE Reports No. 20185. Department of Geomatics Engineering, University of Calgary, Calgary, AB, Canada, 2003. [Google Scholar]
  8. Fuhrmann, T.; Westerhaus, M.; Zippelt, K.; Heck, B. Vertical displacement rates in the Upper Rhine Graben area derived from precise levelling. J. Geod. 2014, 88, 773–787. [Google Scholar] [CrossRef]
  9. Lyon, T.J.; Filmer, M.S.; Featherstone, W.E. On the use of repeat leveling for the determination of vertical land motion: Artifacts, aliasing, and extrapolation errors. J. Geophys. Res. Solid Earth 2018, 123, 7021–7039. [Google Scholar] [CrossRef]
  10. Blewitt, G.; Lavallée, D.; Clarke, P.; Nurutdinov, K. A new global mode of Earth deformation: Seasonal cycle detected. Science 2001, 294, 2342–2345. [Google Scholar] [CrossRef]
  11. Bevis, M.; Alsdorf, D.; Kendrick, E.; Fortes, L.P.; Forsberg, B.; Smalley, R., Jr.; Becker, J. Seasonal fluctuations in the mass of the Amazon River system and Earth’s elastic response. Geophys. Res. Lett. 2005, 32, L16308. [Google Scholar] [CrossRef] [Green Version]
  12. van Dam, T.; Wahr, J.; Lavallée, D. A comparison of annual vertical crustal displacements from GPS and Gravity Recovery and Climate Experiment (GRACE) over Europe. J. Geophys Res. 2007, 112, B03404. [Google Scholar] [CrossRef]
  13. Heki, K. Dense GPS array as a new sensor of seasonal changes of surface loads. In The State of the Planet: Frontiers and Challenges in Geophysics; Geophysical Monograph Series; Sparks, R.S.J., Hawkesworth, C.J., Eds.; AGU: Washington, DC, USA, 2004; Volume 150, pp. 177–196. [Google Scholar]
  14. Davis, J.L.; Elósegui, P.; Mitrovica, J.X.; Tamisiea, M.E. Climate-driven deformation of the solid earth from GRACE and GPS. Geophys. Res. Lett. 2004, 31, L24605. [Google Scholar] [CrossRef]
  15. Steckler, M.S.; Nooner, S.L.; Akhter, S.H.; Chowdhury, S.K.; Bettadpur, S.; Seeber, L.; Kogan, M.G. Modeling Earth deformation from monsoonal flooding in Bangladesh using hydrographic, GPS, and Gravity Recovery and Climate Experiment (GRACE) data. J. Geophys. Res. Solid Earth 2010, 115, B08407. [Google Scholar] [CrossRef]
  16. Nahmani, S.; Bock, O.; Bouin, M.N.; Santamaría-Gómez, A.; Boy, J.P.; Collilieux, X.; Métivier, L.; Panet, I.; Genthon, P.; De Linage, C.; et al. Hydrological deformation induced by the West African Monsoon: Comparison of GPS, GRACE and loading models. J. Geophys. Res. Solid Earth 2012, 117, B05409. [Google Scholar] [CrossRef]
  17. Fu, Y.; Freymueller, J.T.; Jensen, T. Seasonal hydrological loading in southern Alaska observed by GPS and GRACE. Geophys. Res. Lett. 2012, 39, L15310. [Google Scholar] [CrossRef]
  18. Liu, R.L.; Li, J.; Fok, H.S.; Shum, C.K.; Li, Z. Earth surface deformation in the North China plain detected by joint analysis of GRACE and GPS data. Sensors 2014, 14, 19861–19876. [Google Scholar] [CrossRef]
  19. Pan, Y.; Shen, W.B.; Hwang, C.; Liao, C.; Zhang, T.; Zhang, G. Seasonal Mass Changes and Crustal Vertical Deformations Constrained by GPS and GRACE in Northeastern Tibet. Sensors 2016, 16, 1211. [Google Scholar] [CrossRef]
  20. Rajner, M.; Liwosz, T. Studies of crustal deformation due to hydrological loading on GPS height estimates. Geod. Cartogr. 2011, 60, 135–144. [Google Scholar] [CrossRef]
  21. Godah, W.; Ray, J.D.; Szelachowska, M.; Krynski, J. The Use of National CORS Networks for Determining Temporal Mass Variations within the Earth’s System and for Improving GRACE/GRACE–FO Solutions. Remote Sens. 2020, 12, 3359. [Google Scholar] [CrossRef]
  22. Godah, W.; Szelachowska, M.; Ray, J.D.; Krynski, J. Comparison of vertical deformation of the Earth’s surface obtained using GRACE-based GGMS and GNNS data—A case study of South-Eastern Poland. Acta Geodyn. Geomater. 2020, 17, 169–176. [Google Scholar] [CrossRef]
  23. Birhanu, Y.; Bendick, R. Monsoonal loading in Ethiopia and Eritrea from vertical GPS displacement time series. J. Geophys. Res. Solid Earth 2015, 120, 7231–7238. [Google Scholar] [CrossRef]
  24. Tapley, B.D.; Bettadpur, S.; Watkins, M.; Reigber, C. The gravity recovery and climate experiment: Mission overview and early results. Geophys Res. Lett. 2004, 31, L09607. [Google Scholar] [CrossRef]
  25. Rangelova, E. A Dynamic Geoid Model for Canada, Report No. 20261. Ph.D. Thesis, Department of Geomatics Engineering, University of Calgary, Calgary, AB, Canada, 2007. [Google Scholar]
  26. Rangelova, E.; Fotopoulos, G.; Sideris, M.G. Implementing a dynamic geoid as a vertical datum for orthometric heights in Canada. In Gravity, Geoid and Earth Observation. International Association of Geodesy Symposia; Mertikas, S.P.P., Ed.; Springer: Berlin/Heidelberg, Germany, 2010; Volume 135, pp. 295–302. [Google Scholar] [CrossRef]
  27. Rangelova, E.; Sideris, M.G. Contributions of terrestrial and GRACE data to the study of the secular geoid changes in North America. J. Geodyn. 2008, 46, 131–143. [Google Scholar] [CrossRef]
  28. Krynski, J.; Kloch-Główka, G.; Szelachowska, M. Analysis of time variations of the gravity field over Europe obtained from GRACE data in terms of geoid height and mass variations. In Earth on the Edge: Science for a Sustainable Planet. International Association of Geodesy Symposia; Rizos, C., Willis, P., Eds.; Springer: Berlin/Heidelberg, Germany, 2014; Volume 139, pp. 365–370. [Google Scholar] [CrossRef]
  29. Godah, W.; Szelachowska, M.; Krynski, J. On the analysis of temporal geoid height variations obtained from GRACE-based GGMs over the area of Poland. Acta Geophys. 2017, 65, 713–725. [Google Scholar] [CrossRef]
  30. Godah, W.; Szelachowska, M.; Krynski, J. Investigation of geoid height variations and vertical displacements of the Earth surface in the context of the realization of the modern vertical reference system—A case study for Poland, In International Symposium on Gravity, Geoid and Height Systems 2016, International Association of Geodesy Symposia; Vergos, G., Pail, R., Barzaghi, R., Eds.; Springer: Cham, Switzerland, 2017; Volume 148, pp. 135–141. [Google Scholar] [CrossRef]
  31. Godah, W.; Szelachowska, M.; Krynski, J. On the estimation of physical height changes using GRACE satellite mission data—A case study of Central Europe. Geod. Cartogr. 2017, 66, 211–226. [Google Scholar] [CrossRef]
  32. Godah, W.; Szelachowska, M.; Krynski, J. Application of the PCA/EOF method for the analysis and modelling of temporal variations of geoid heights over Poland. Acta Geod. Et Geophys. 2018, 53, 93–105. [Google Scholar] [CrossRef]
  33. Zhang, X.; Jin, S.; Lu, X. Global Surface Mass Variations from Continuous GPS Observations and Satellite Altimetry Data. Remote Sens. 2017, 9, 1000. [Google Scholar] [CrossRef] [Green Version]
  34. Öztürk, Z.E.; Godah, W.; Abbak, R.A. Estimation of physical height changes from GRACE satellite mission data and WGHM over Turkey. Acta Geod. Geophys. 2020, 55, 301–317. [Google Scholar] [CrossRef]
  35. Godah, W.; Szelachowska, M.; Krynski, J.; Ray, J.D. Assessment of Temporal Variations of Orthometric/Normal Heights Induced by Hydrological Mass Variations over Large River Basins Using GRACE Mission Data. Remote Sens. 2020, 12, 3070. [Google Scholar] [CrossRef]
  36. Sanchez, L.; Sideris, M.G. Vertical datum unification for the International Height Reference System (IHRS). Geophys. J. Int. 2017, 209, 570–586. [Google Scholar] [CrossRef]
  37. Purkhauser, A.F.; Pail, R. Next generation gravity missions: Near-real time gravity field retrieval strategy. Geophys. J. Int. 2019, 217, 1314–1333. [Google Scholar] [CrossRef]
  38. Mehlstäubler, T.E.; Grosche, G.; Lisdat, C.; Schmidt, P.O.; Denker, H. Atomic clocks for geodesy. Rep. Prog. Phys. 2018, 81, 064401. [Google Scholar] [CrossRef] [PubMed]
  39. Torge, W.; Müller, J. Geodesy, 4th ed.; Walter de Gruyter: Berlin, Germany; Boston, MA, USA, 2012. [Google Scholar]
  40. Barthelmes, F. Definition of Functionals of the Geopotential and Their Calculation from Spherical Harmonic Models: Theory and Formulas Used by the Calculation Service of the International Centre for Global Earth Models (ICGEM). In GFZ German Research Centre for Geosciences; Helmholtz-Zentrum Potsdam: Potsdam, Germany, 2013; p. 32. Available online: http://icgem.gfzpotsdam.de (accessed on 4 August 2022).
  41. Makridakis, S.; Wheelwright, S.C.; Hyndman, R.J. Forecasting: Methods and Applications, 3rd ed.; Wiley: New York, NY, USA, 1998; ISBN 978-0-471-53233-0. [Google Scholar]
  42. Jolliffe, I. Principal Component Analysis; Springer: New York, NY, USA, 2002. [Google Scholar]
  43. Pavlis, N.K.; Holmes, S.A.; Kenyon, S.C.; Factor, J.K. The development and evaluation of the earth gravitational model 2008 (EGM2008). J. Geophys. Res. 2012, 117, B04406. [Google Scholar] [CrossRef]
  44. Szelachowska, M.; Krynski, J. GDQM-PL13—The new gravimetric quasigeoid model for Poland. Geoinf. Issues 2014, 6, 5–19. [Google Scholar] [CrossRef]
  45. Dziennik Ustaw Rzeczypospolitej Polskiej. The Regulation of the Council of Ministers Concerning the National Spatial Reference System. 2012. Available online: https://isap.sejm.gov.pl/isap.nsf/download.xsp/WDU20120001247/O/D20121247.pdf (accessed on 1 August 2022).
  46. Krynski, J.; Rogowski, J.B. National Report of Poland to EUREF 2014. In Proceedings of the Symposium of the IAG Subcommission for Europe (EUREF), Vilnius, Lithuania, 4–6 June 2014; Available online: http://www.euref-iag.net/symposia/2014Vilnius/05-20-p-Poland.pdf (accessed on 4 August 2022).
  47. Heiskanen, W.A.; Moritz, H. Physical Geodesy; W.H. Freeman and Company: San Francisco, CA, USA, 1967. [Google Scholar]
  48. Bettadpur, S. Gravity Recovery and Climate Experiment Level-2 Gravity Field Product User Handbook; Center for Space Research at The University of Texas at Austin: Austin, TX, USA, 2018; Available online: https://podaac-tools.jpl.nasa.gov/drive/files/allData/grace/docs/L2-UserHandbook_v4.0.pdf (accessed on 1 August 2022).
  49. Dziewonski, A.M.; Anderson, D.L. Preliminary reference Earth model. Phys. Earth Planet. Inter. 1981, 25, 297–356. [Google Scholar] [CrossRef]
  50. Godah, W. IGiK–TVGMF: A MATLAB package for computing and analysing temporal variations of gravity/mass functionals from GRACE satellite based global geopotential models. Comput. Geosci. 2019, 123, 47–58. [Google Scholar] [CrossRef]
  51. Swenson, S.; Chambers, D.; Wahr, J. Estimating geocenter variations from a combination of GRACE and ocean model output. J. Geophys. Res. Solid Earth 2008, 113, B08410. [Google Scholar] [CrossRef] [Green Version]
  52. Cheng, M.K.; Tapley, B.D.; Ries, J.C. Deceleration in the Earth’s oblateness. J. Geophys. Res. 2013, 118, 740–747. [Google Scholar] [CrossRef]
  53. Kusche, J.; Schmidt, R.; Petrovic, S.; Rietbroek, R. Decorrelated GRACE time-variable gravity solutions by GFZ, and their validation using a hydrological model. J. Geod. 2009, 83, 903–913. [Google Scholar] [CrossRef]
  54. Vestøl, O.; Ågren, J.; Steffen, H.; Tarasov, L. NKG2016LU: A new land uplift model for Fennoscandia and the Baltic Region. J. Geod. 2019, 93, 1759–1779. [Google Scholar] [CrossRef] [Green Version]
  55. MATLAB; Version 8.6 (Matlab R2015b); The MathWorks Inc.: Natick, MA, USA, 2015.
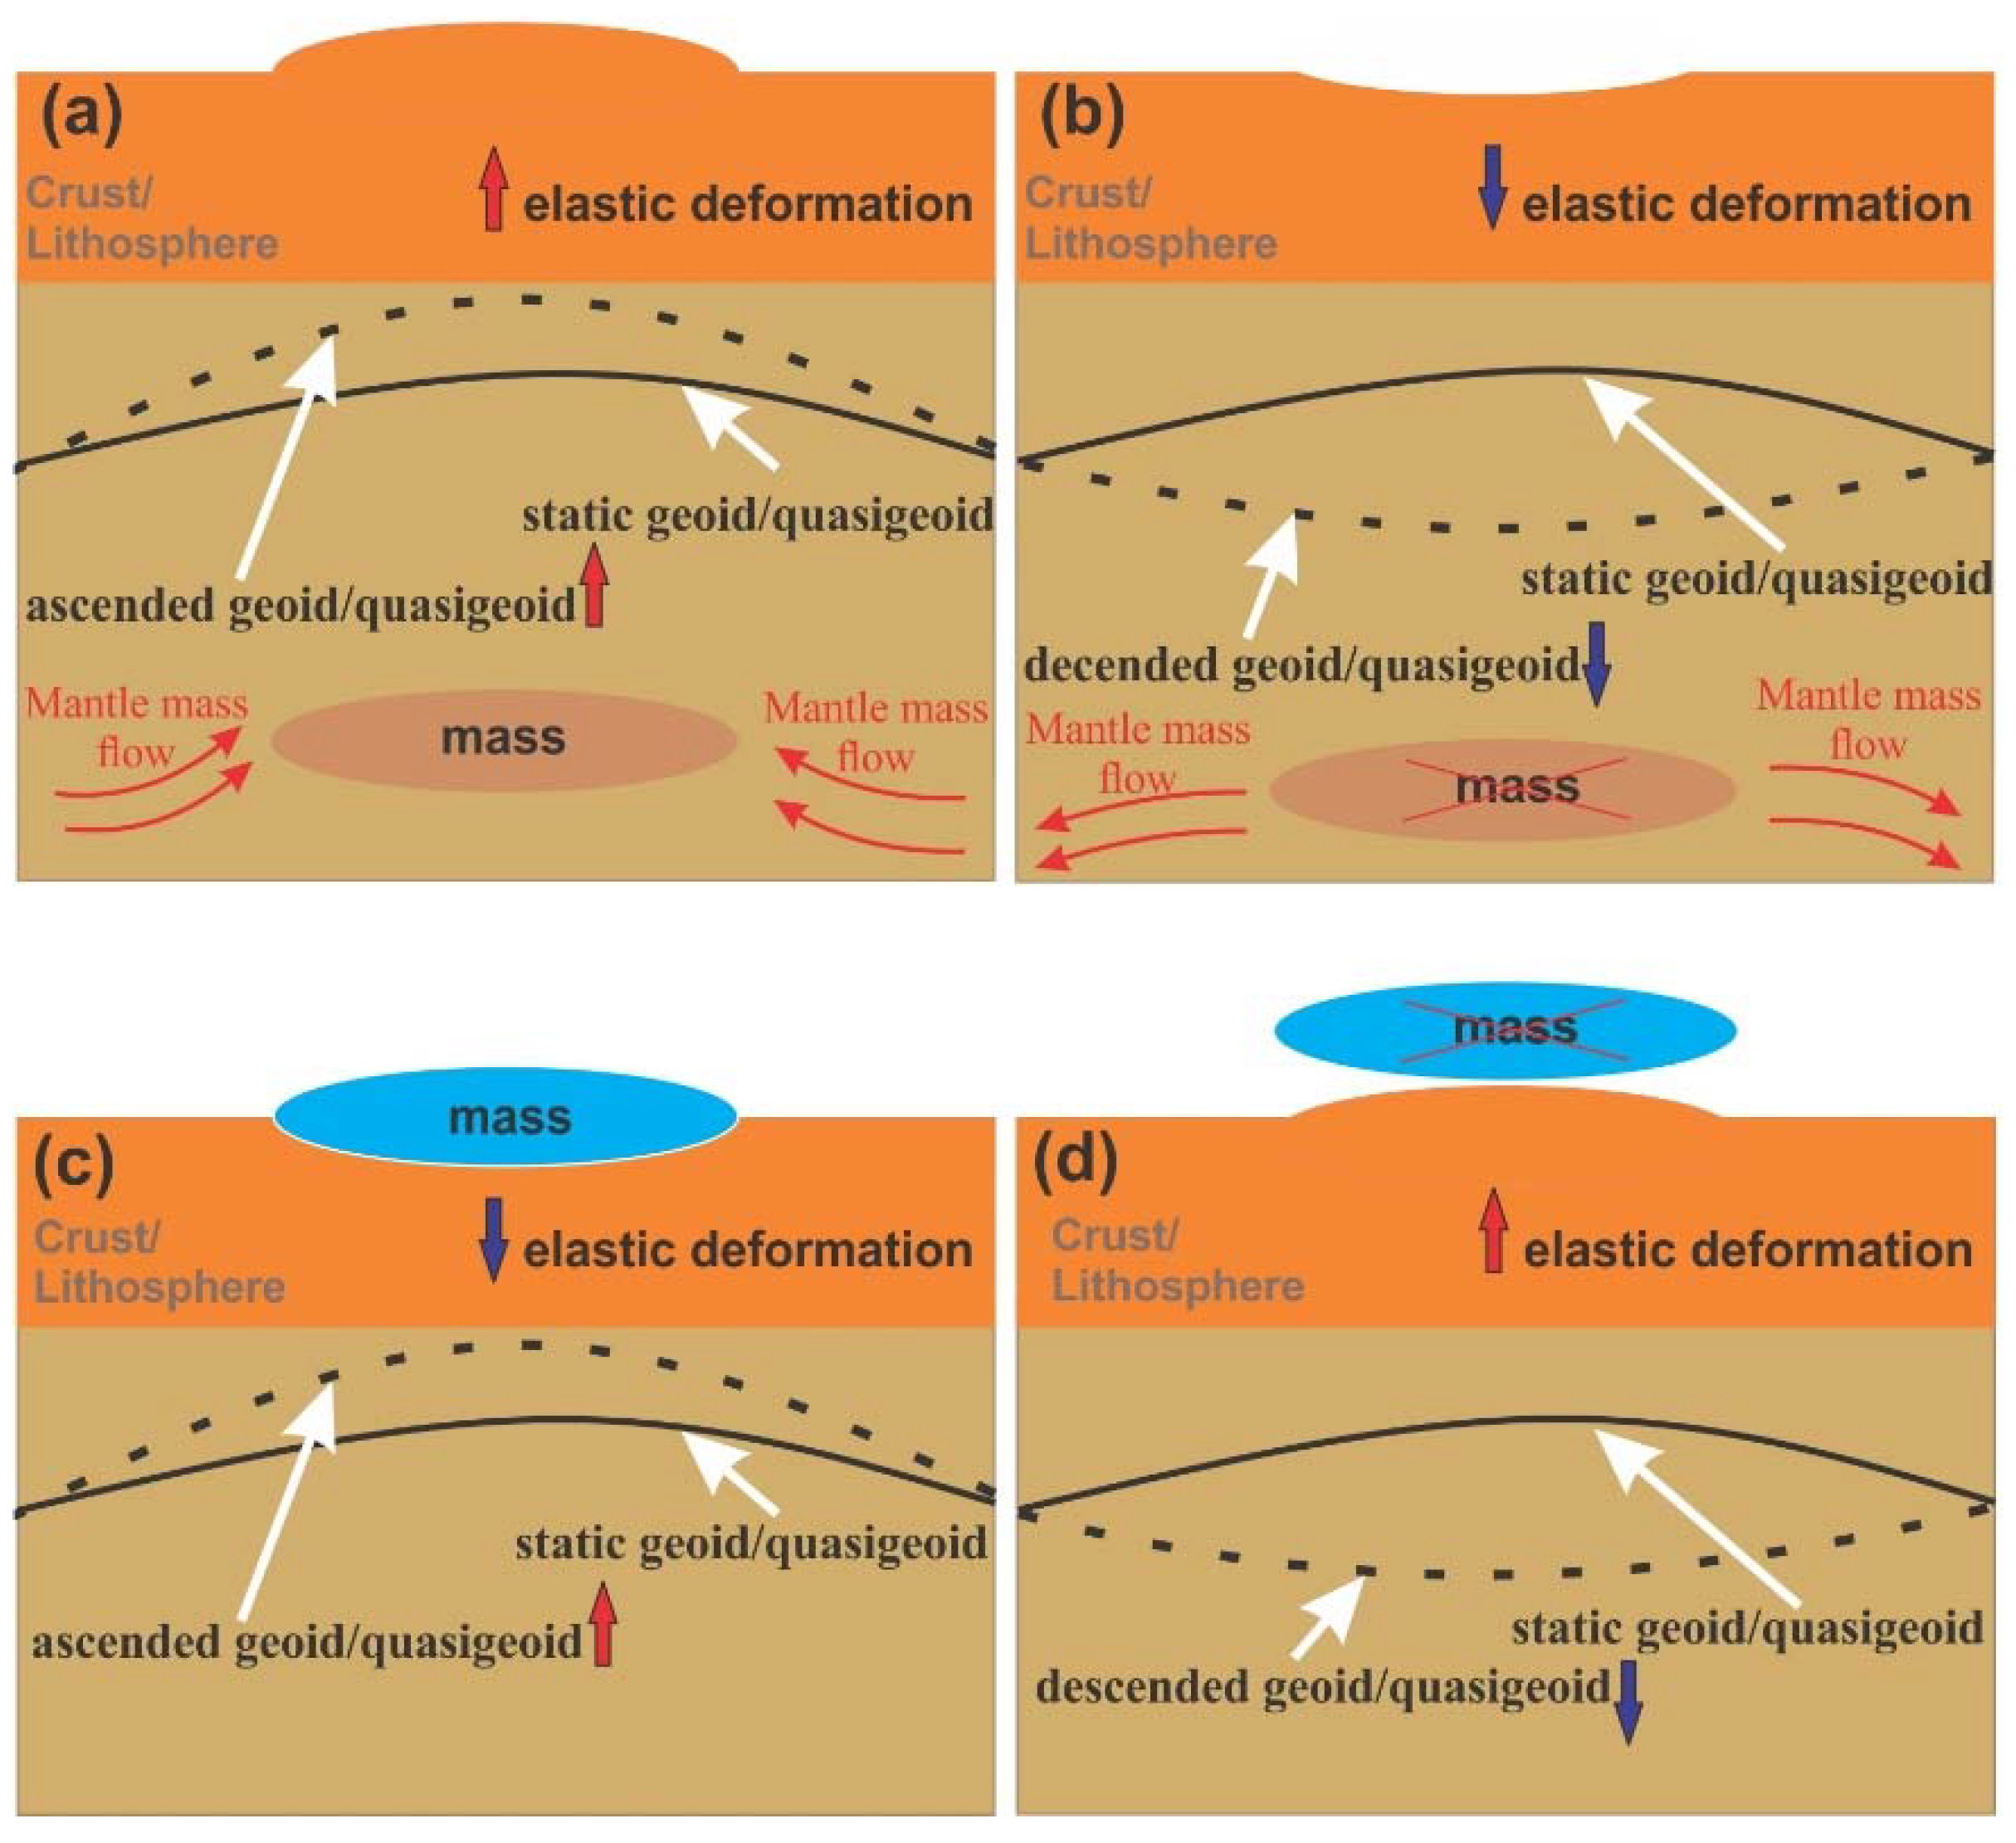
Figure 1. The relation between temporal mass variations within the Earth’s system (TMVES), geoid/quasigeoid height changes, and the elastic deformation of the Earth’s surface in the up component. (a) the mass under the geoid/quasigeoid surface increases, (b) the mass under the geoid/quasigeoid surface decreases, (c) the mass on the Earth’s surface increases, and (d) the mass on the Earth’s surface decreases.
Remotesensing 14 04271 g001
Figure 2. Flowchart describing the general steps to determine orthometric/normal heights corrected for their dynamics.
Remotesensing 14 04271 g002
Figure 3. Orthometric/normal heights of ASG-EUPOS sites referred to the PL-EVRF2007-NH at the reference epoch 1 January 2008.
Remotesensing 14 04271 g003
Figure 4. The locations of mascons over Poland.
Remotesensing 14 04271 g004
Figure 5. Temporal variations of equivalent water thickness (ΔEWT) over Poland.
Remotesensing 14 04271 g005
Figure 6. Time series of (a) geoid/quasigeoid changes (ΔNζ), (b) vertical deformations of the Earth’s surface (Δh), and (c) temporal variations of orthometric/normal heights (ΔHH*) over Poland estimated using GRACE-based GGMs.
Remotesensing 14 04271 g006
Figure 7. Correlations between temporal variations of equivalent water thickness (ΔEWT) and geoid/quasigeoid changes (ΔNζ) over Poland.
Remotesensing 14 04271 g007
Figure 8. Correlations between temporal variations of equivalent water thickness (ΔEWT) and vertical deformations of the Earth’s surface (Δh) over Poland.
Remotesensing 14 04271 g008
Figure 9. Correlations between temporal variations of equivalent water thickness (ΔEWT) and temporal variations of orthometric/normal heights (ΔHH*) over Poland.
Remotesensing 14 04271 g009
Figure 10. Seasonal (red line) and long term (black line) components of Δ H c ( t i G ) / Δ H * c ( t i G ) over Poland.
Remotesensing 14 04271 g010
Figure 11. Time series of Δ H c ( t i G ) / Δ H * c ( t i G )  (black line) and Δ H S D ( t ) / Δ H * S D ( t ) models obtained using the SD method (red line), and differences between Δ H c ( t i G ) / Δ H * c ( t i G ) and their corresponding Δ H S D ( t ) / Δ H * S D ( t ) models (green line).
Remotesensing 14 04271 g011
Figure 12. Models of temporal variations of orthometric/normal heights (∆HM/∆H*M) referred to the reference epoch t0, i.e., 01.01.2008.
Remotesensing 14 04271 g012
Figure 13. Example of (a) seasonal components (S/S*) of ΔHH* and their predicted values, (b) long-term components (LT/LT*) of ΔHH* and their fitted values resulted from the 7th degree polynomial model, and (c) ΔHMH*M model used to predict ΔHH* together with ΔHcH*c data shifted by the offset τ, ΔHMH*M values and ΔHPH*P values for the prediction period.
Remotesensing 14 04271 g013
Figure 14. The ΔHcH*c data shifted by the offset τ, ΔHMH*M obtained from a model of ΔHH* developed using the seasonal decomposition method and ΔHPH*P. The investigated prediction period (a) from January to June 2010, (b) from February to July 2010, (c) from March to August 2010, (d) from April to September 2010, (e) from May to October 2010, (f) from June to November 2010, and (g) from July to December 2010.
Remotesensing 14 04271 g014
Figure 15. Temporal variations of orthometric/normal heights estimated at the ASG–EPOS network sites.
Remotesensing 14 04271 g015
Table 1. Statistics of differences δP1 between ΔHPH*P and ΔHMH*M as well as differences δP2 between ΔHPH*P and ΔHcH*c data shifted by the offset τ (mm).
MasconMonthδP1δP2
MinMaxMeanStdMinMaxMeanStd
#4001st0.2−1.6−0.70.61.8−2.2−0.91.6
2nd0.7−1.3−0.70.82.3−2.6−0.52.0
3rd1.1−1.4−0.41.12.5−2.9−0.42.4
4th0.6−2.1−0.91.11.4−3.7−1.12.3
5th2.5−0.90.71.22.3−2.60.52.0
6th2.4−1.10.71.21.9−2.20.31.5
#4011st0.6−1.1−0.40.61.3−2.3−0.71.2
2nd0.9−1.1−0.50.82.6−2.1−0.41.8
3rd1.1−1.3−0.31.02.5−2.2−0.32.1
4th0.7−1.5−0.40.91.9−2.5−0.52.0
5th2.1−1.00.61.12.4−2.30.61.9
6th2.2−0.51.01.02.3−1.50.91.4
#4701st−1.1−2.9−1.90.70.1−4.0−2.01.6
2nd−1.0−2.6−1.90.60.1−3.6−1.41.5
3rd−1.0−2.1−1.60.30.3−3.1−1.21.4
4th−1.0−1.7−1.30.30.5−2.8−1.31.4
5th−0.4−1.3−0.80.31.1−3.0−1.21.7
6th0.5−0.9−0.10.51.4−2.9−1.01.8
#4711st−1.4−3.1−2.20.7−0.5−4.2−2.31.5
2nd−1.7−3.3−2.60.7−0.6−4.4−2.31.5
3rd−1.7−2.7−2.30.4−0.4−3.8−2.01.2
4th−1.9−2.3−2.10.2−0.6−3.4−2.11.2
5th−1.2−1.7−1.40.20.0−2.9−1.81.3
6th−0.5−1.1−0.70.20.7−2.9−1.31.5
Publisher’s Note: MDPI stays neutral with regard to jurisdictional claims in published maps and institutional affiliations.