Article

Impact of Saline-Alkali Land Greening on the Local Surface Temperature—A Multiscale Assessment Based on Remote Sensing

1
School of Earth Sciences, Yangtze University, Wuhan 430100, China
2
Remote Sensing and Geographic Information Research Center, Northeast Institute of Geography and Agroecology, Chinese Academy of Sciences, Changchun 130102, China
3
Remote Sensing and Geographic Information Research Center, Changchun Jingyuetan Remote Sensing Observation Station, Chinese Academy of Sciences, Changchun 130102, China
4
College of Geography Science, Changchun Normal University, Changchun 130031, China
*
Author to whom correspondence should be addressed.
Remote Sens. 2022, 14(17), 4246; https://doi.org/10.3390/rs14174246
Submission received: 16 June 2022 / Revised: 12 August 2022 / Accepted: 24 August 2022 / Published: 28 August 2022
(This article belongs to the Special Issue Remote Sensing for Advancing Nature-Based Climate Solutions)

Abstract

:
In recent years, the conversion of saline-alkali land to rice fields has become the most dominant land use change feature in western Jilin, leading to significant surface greening. Saline–alkali land and paddy fields have distinct surface biophysical properties; however, there is a lack of systematic assessment of the moderating effect of planting rice on saline–alkali land on regional climate by changing surface properties. In this paper, multiscale data on the surface temperature of saline–alkali land and paddy fields were obtained using 1 km MODIS product, 30 m Landsat 8 satellite imagery and centimeter-scale UAV imagery in Da’an City, western Jilin as the study area, and the various characteristics of the surface temperature of saline-alkali land and paddy fields in different months of the year and at different times of the day were analyzed. Furthermore, the effect of rice cultivation in saline–alkali land on the local surface temperature was assessed using a space-for-time approach. The results based on satellite observations including both MODIS and Landsat showed that the surface temperature of saline–alkali land was significantly higher than that of paddy fields during the crop growing season, especially in July and August. The high temporal resolution MODIS LST data also indicated the paddy fields cool the daytime surface temperature, while warming the nighttime surface temperature, which was in contrast for saline–alkali land during the growing season. High-resolution UAV observations in July confirmed that the cooling effect of paddy fields was most significant at the middle of day. From the biophysical perspective, the reclamation of saline–alkali land into paddy fields leads to an increase in leaf area index, followed by a significant increase in evapotranspiration. Meanwhile, rice cultivation in saline–alkali land reduces surface albedo and increases surface net radiation. The trade-off relationship between the two determines the seasonal difference in the surface temperature response of saline–alkali land for rice cultivation. At the same time, the daily cycle of crop evapotranspiration and the thermal insulation effect of paddy fields at night are the main reasons for the intraday difference in surface temperature between saline–alkali land and paddy field. Based on the multiscale assessment of the impact of rice cultivation in saline-alkali land on surface temperature, this study provides a scientific basis for predicting future regional climate change and comprehensively understanding the ecological and environmental benefits of saline–alkali land development.

Graphical Abstract

1. Introduction

According to the latest data published by the Food and Agriculture Organization of the United Nations (FAO) in 2015, about 831 million ha of land around the world has salinization problems of varying degrees, accounting for 6.5% of the world’s total land area, and the global economic loss due to salinization is up to USD 1.2 billion per year [1]. Saline–alkali land is widely distributed in western Jilin, with an area of about 1.6 million ha [2]. It is an important land reserve resource for Jilin Province to increase the country’s ability to produce 100 billion catties of grain. The arid climate environment is an important prerequisite for the formation of saline–alkali land in western Jilin [2]. Against the background of global change, the climate of western Jilin has shown a warming and drying trend in recent decades, i.e., higher temperatures and lower precipitation, which has directly exacerbated the deterioration of the ecological environment in the region. As an artificial wetland, paddy fields have a significant “cold and wet effect”, which can effectively reduce the temperature locally and around the area, increase air humidity and regulate precipitation [3]. At present, with the maturation of rice cultivation technology in saline–alkali land and the support of national and local policies, large areas of saline–alkali land are being transformed into paddy fields [4].
Comprehensive domestic and foreign studies have shown that land use change can affect the climate environment at a global, regional and local scale by changing the interaction between the surface and the atmosphere [5,6,7]. The latest satellite data indicate that the global surface is showing a large-scale greening trend, in East Asia especially in China and India [7,8]. In recent years, research on the climate effect of the greening of the earth’s vegetation has been widely carried out on a global and regional scale. Peng et al. analyzed the impact of afforestation on land surface temperature in China based on remote sensing data and spatial statistical methods, and the results showed that afforestation can significantly reduce land surface temperature [9]. Huang et al. believed that there were significant differences between the effects of afforestation on the regional temperature in different climate zones [10]. Zeng et al. used a global climate model to evaluate the impact of global vegetation changes on air temperature and the water cycle. The results show that vegetation greening can alleviate the trend of global warming and that vegetation greening will intensify the surface–atmosphere water cycle [11,12]. Li et al. used the Earth System Model to evaluate the impact of vegetation greening on regional temperature and precipitation in China. The results show that vegetation greening in China can significantly reduce spring temperatures, but has no significant effect on precipitation [13,14]. Yu et al. used a high-resolution regional climate model to evaluate the impact of vegetation changes on the summer climate in eastern China. The results show that vegetation greening can significantly reduce summer temperatures [15], and change the precipitation pattern of southern floods and northern droughts in China.
The widespread implementation of China’s afforestation policy is the main reason for the greening of China’s vegetation, but the greening of vegetation is also significant in the Northeast Plain, China’s main commercial grain-producing region [8,15], where the improvement of the saline–alkali lands is the main driver of the greening of vegetation, especially in western Jilin. However, current research mostly focuses on the impact of changes in vegetation parameters on the climate system. The improvement of saline–alkali land directly changes the biophysical properties of the underlying surface and changes the land use attributes of the surface. Therefore, more in-depth research on the effect of rice cultivation in saline–alkali land on the surface temperature needs to be carried out.
The combination of satellite remote sensing and unmanned aerial observation is an effective means of solving this problem. The effective combination of the two can provide a more scientific and rational assessment of the impact of saline–alkali land rice cultivation on surface temperature, and thus provide a scientific basis for predicting future regional climate change and a comprehensive understanding of the ecological and environmental effects of saline–alkali land development.

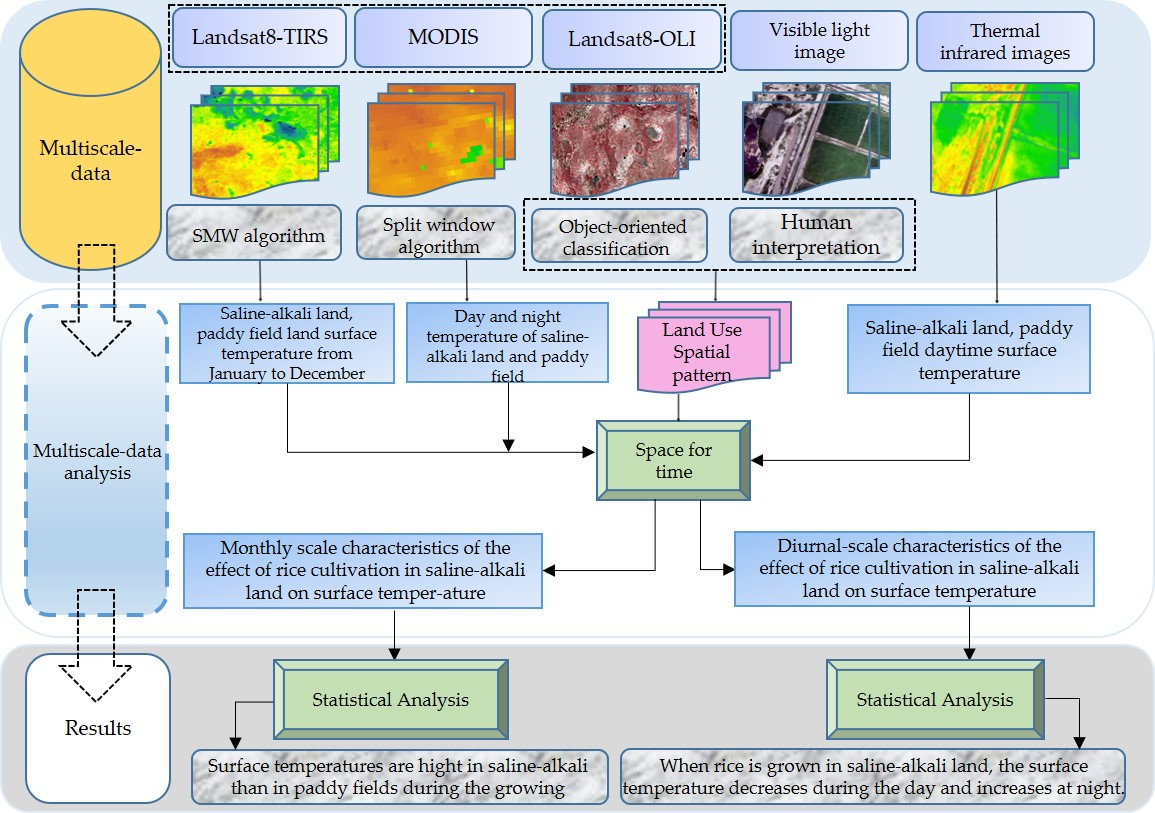
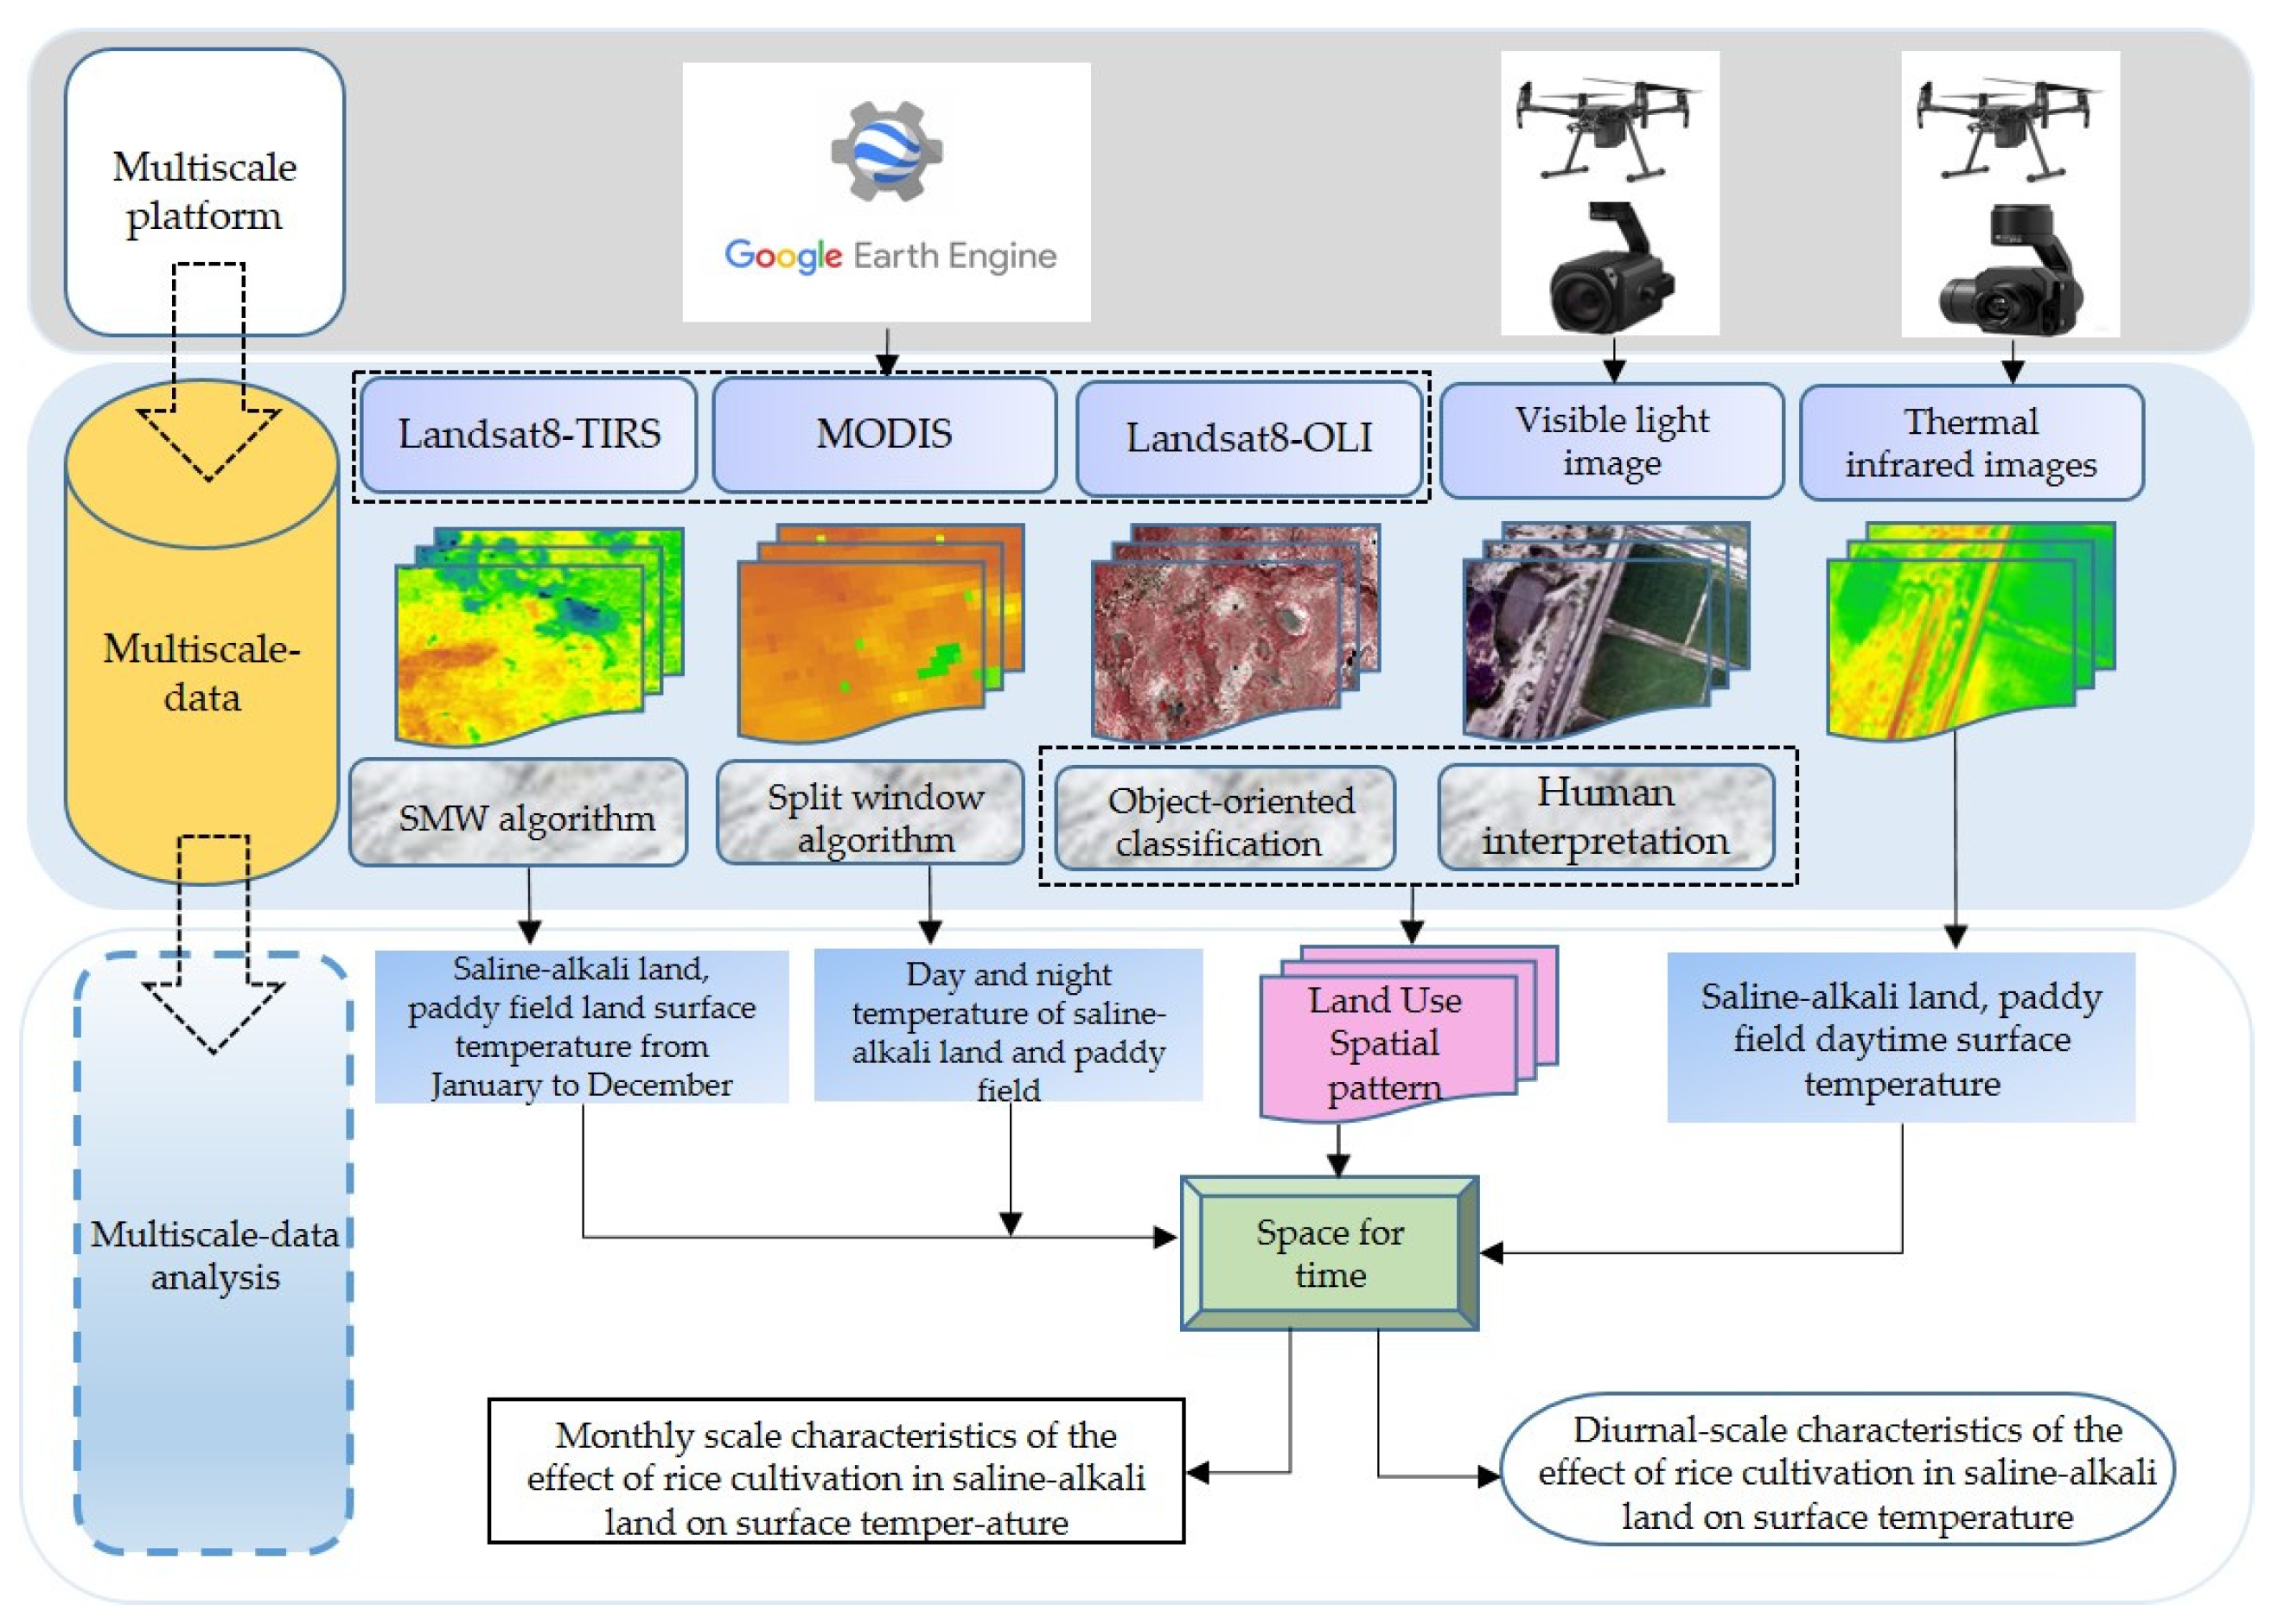
2. Materials and Methods

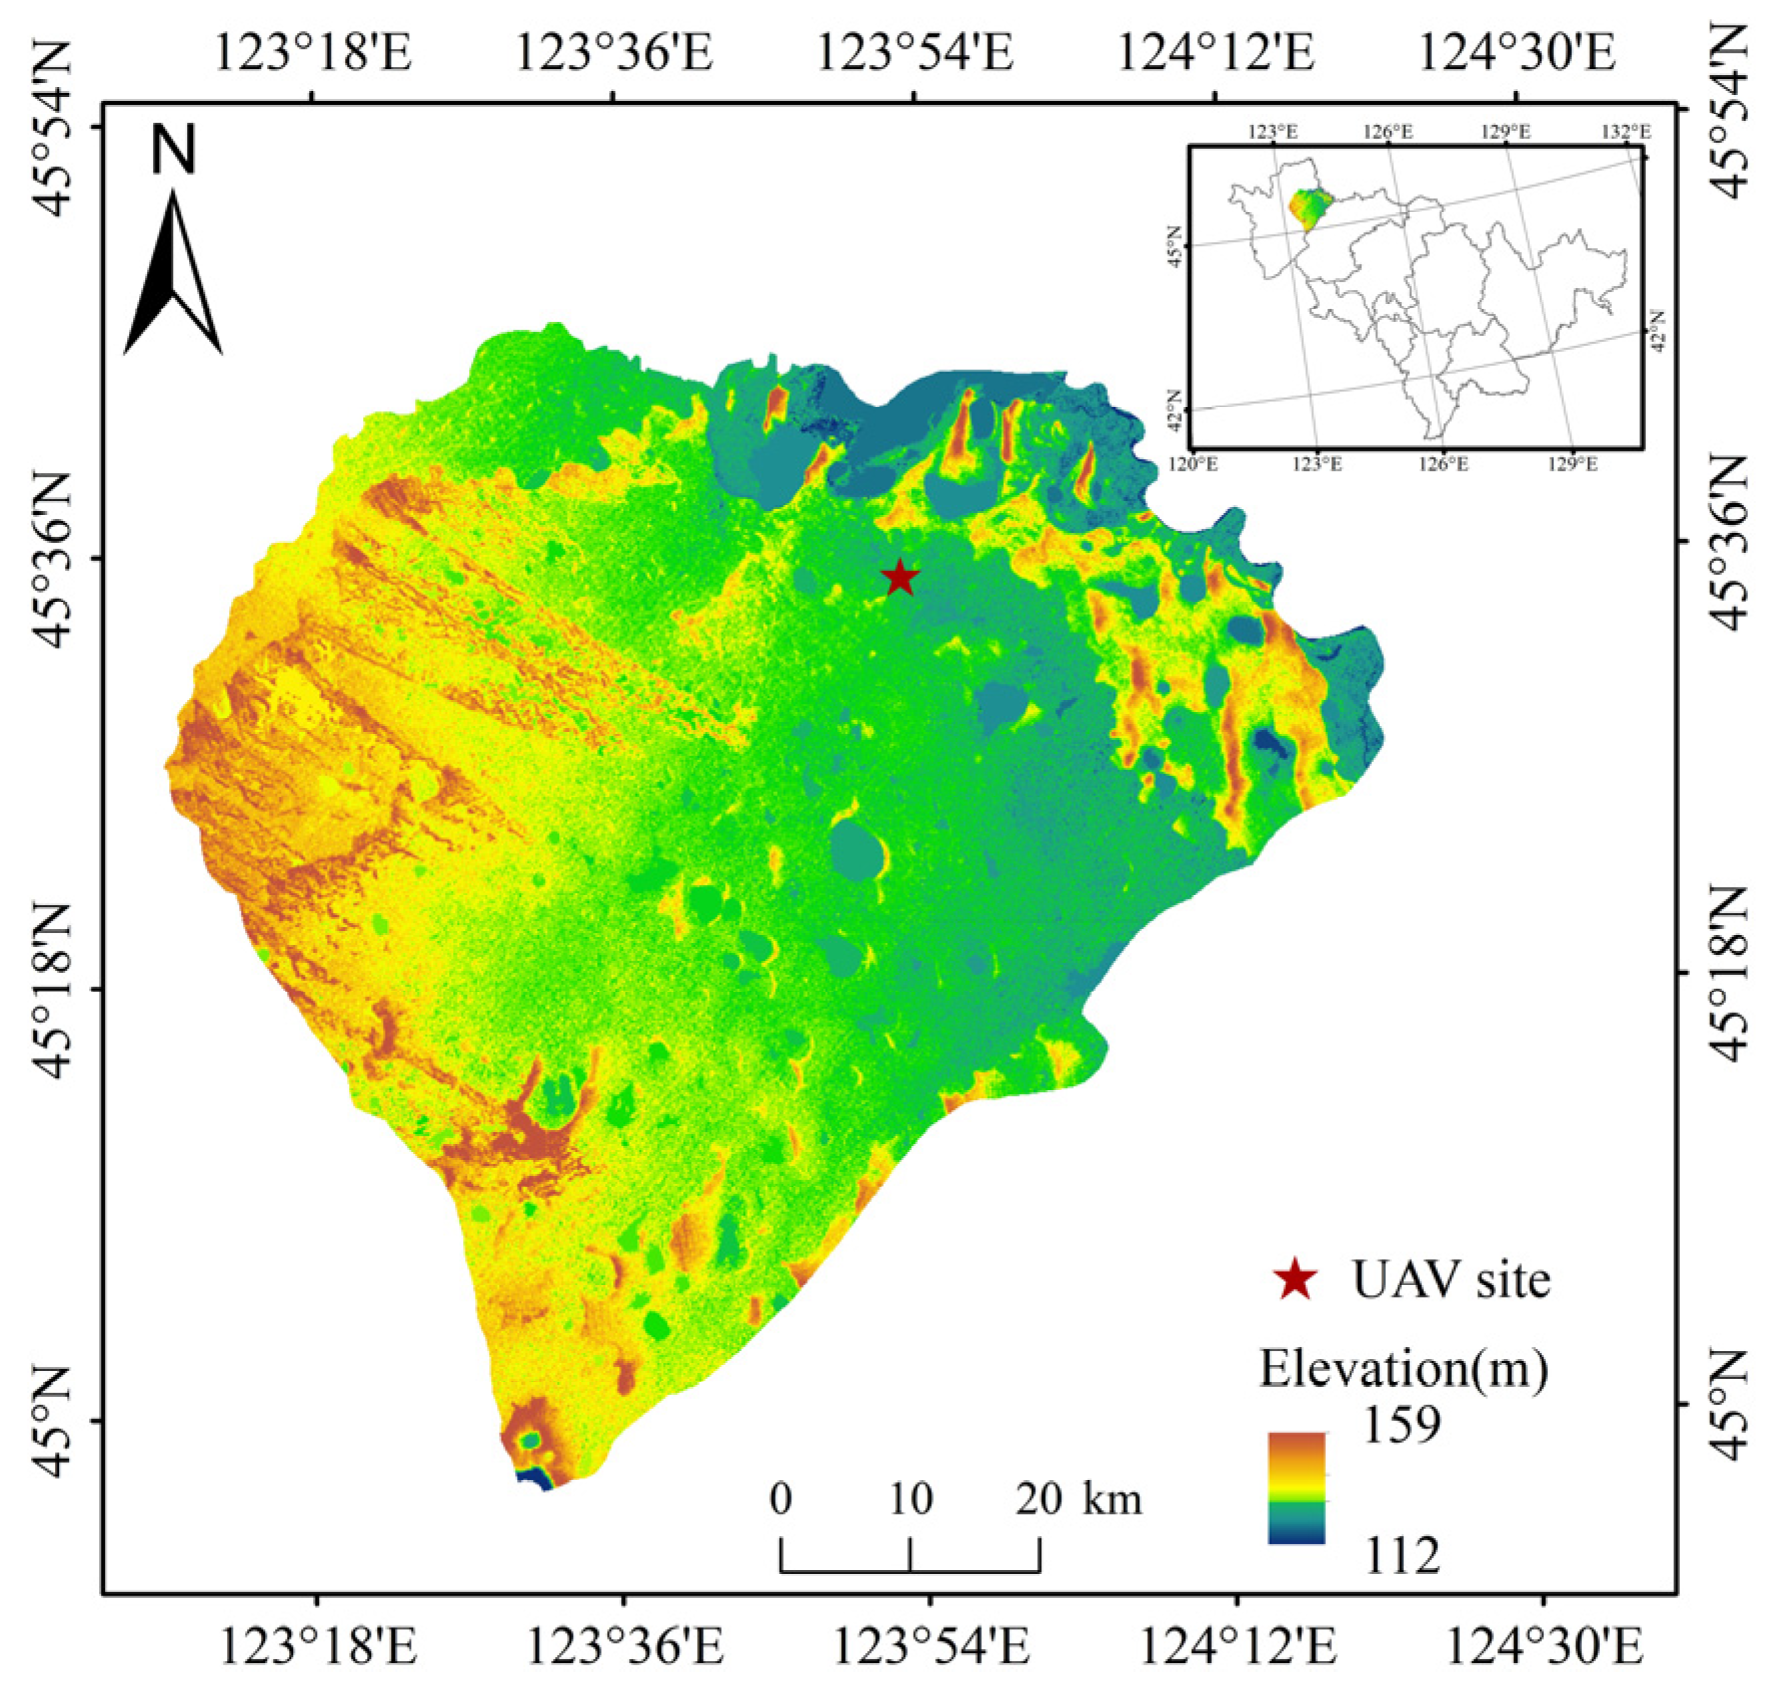
2.1. Overview of the Study Area

Da’an City in the west of Jilin Province was selected as the study area, and a multiscale assessment of the impact of rice cultivation in saline–alkali land on surface temperature was carried out. Da’an City belongs to Baicheng City, and is located in the northwestern part of Jilin Province, between 123°08′~124°21′E and 44°57′~45°45′N (Figure 1), east of Zhaoyuan County, Heilongjiang Province across the Nengjiang River; bordering Taonan County and Tongyu County of Baicheng City to the west; bordering Songyuan City to the south; and bounded to the north by the Tao’er River with Zhenlai County. The city covers 95 km from east to west, and 90 km from north to south, with a total area of about 4878.59 km2, and has 10 towns and 8 townships under its jurisdiction. Da’an City is located in the southwest of Songnen Plain. The whole terrain is flat and open, with small undulations. It is a saddle shape with slightly higher eastern and western ends and a lower middle. The terrain in the south is relatively flat. It has a predominantly temperate continental climate, with obvious seasonal changes; winters are cold and long, with an average minimum temperature in January lower than −18.2 °C, while the average temperature in July is 23.5 °C. The annual precipitation is 413.7 mm, which is mostly concentrated in summer, accounting for 82.8% of the annual precipitation. There are many lakes and marshes in Da’an City, through which a river flows (the mainstream of the Nenjiang River), and two rivers (the Taoer River and the Huolin River), and the soil is mainly light chernozem and meadow soil [16].
Since the 1950s, agricultural intensification and other environmental causes have led to serious land degradation, and more and more land in Da’an City has degraded into saline–alkali land, resulting in an increasingly fragile ecological environment [17]. The use of saline–alkali land improvement technology to promote rice cultivation on unused saline–alkali land has become a new feature of regional land use change. Therefore, Da’an City in western Jilin has become an ideal area for multiscale assessment of the impact of rice cultivation in saline–alkali land on local surface temperature.

2.2. Data Sources

The remote sensing data sources used in this study include different temporal–spatial resolution remote sensing images captured by moderate-resolution imaging spectroradiometer (MODIS), high-resolution Landsat 8 Operational Land Imager (OLI)/Thermal Infrared Sensor (TIRS) [18], and centimeter-level UAV thermal infrared and visible-light observation data. We used the 8-day composite daytime and nighttime LST data during 2015–2021 from both MODIS Terra (MOD11A1, local time 10:30 a.m. and 22:30 p.m.) and Aqua (MYD11A1, local time 13:30 p.m. and 01:30 a.m.) to investigate the diurnal LST impact of saline–alkali land greening. The MODIS LST was derived by using a split window algorithm and the absolute bias of LST is generally less than 1 K [19]. The Landsat 8 coverage time is 10:30 a.m., the coverage of each image is 185 km × 185 km. The images were mainly used for the extraction of land use type (OLI) and surface temperature (TIRS) in the study area. We selected spring, cloud-free images (see underlined images in Table 1) to extract the land use distribution pattern of the study area in 2015 and 2021; the Landsat 8-TIRS data from 2013 to 2021 were screened scene by scene to obtain the highest quality images to extract monthly LST (Table 1). Due to the span of years, this study assumes that the same months have similar climatic characteristics within the study time range, and that the thermal environment characteristics of different months are significantly different. Both MODIS LST products and the Landsat 8 OLI/TIRS image data are downloaded from the Google Earth Engine.
The centimeter resolution of UAV measurements can express the land surface characteristics more finely, and can effectively solve the problem of mixed image elements in satellite remote sensing images; at the same time, multisortie observation in a single day provides an effective means to study the daily variation of surface temperature characteristics. This study used the DJI M210 UAV to conduct three visible-light and thermal infrared observations on typical demonstration plots of the “Saline–Alkaline Land Ecological Management and Efficient Utilization of Da’an Demonstration Area”, a strategic science and technology project of the Chinese Academy of Sciences. The observation date and time are as follows: at 10:54 a.m. and 18:29 p.m. on 17 July 2021, and at 7:52 a.m. on 18 July 2021, true color image maps and thermal infrared image data of typical research areas were obtained.

2.3. Method

At the regional scale of Da’an City, this paper pre-processed the Landsat 8-OLI images in June 2015 and May 2021, such as geometric mosaicking, color adjustment and de-overlapping, and stitched them into images covering the study area. The land use distribution in the study area in 2015 and 2021 was extracted by a combination of object-oriented classification and manual interpretation, and on this basis, the transformation characteristics of paddy fields and saline–alkali land in the study area from 2015 to 2021 were analyzed. By using the statistical mono-window (SMW) algorithm to invert the surface temperature of the study area from the best quality Landsat 8-TIR image data of each month, the monthly surface temperature of the study area from January to December was extracted. At the scale of typical plots, the distribution range of saline–alkali land and paddy fields in 2021 was obtained by manual interpretation (Figure A1). Statistical analysis was carried out of the surface temperature of the saline–alkali land and paddy fields that were stable (without land use transition) from 2015 to 2021, to obtain the intra-annual variation and diurnal characteristics of the surface temperature of the saline–alkali land and paddy fields. The UAV thermal infrared image data and the spatial distribution of saline–alkali land and paddy fields were superimposed and analyzed to obtain the daytime variation characteristics of the surface temperature of the two. On this basis, the method of space-for-time was used to extract the effect of rice cultivation in saline–alkali land on the surface temperature. The study framework is shown in Figure 2.

2.3.1. Object-Oriented Classification

Object-oriented classification algorithms use the spectral features of ground objects and the spatial, texture and spectral information of multispectral data to generate high-precision classification results [20,21]. The object-oriented approach to land cover classification starts with the segmentation of the image to obtain the object, and then uses fuzzy classification methods to classify and extract information based on the spectral features, texture features, shape features and layout features of the object. Object classification-oriented multiscale image segmentation is based on merging image elements from bottom to top, region by region to minimize the heterogeneity of the segmented objects. The main parameters include segmentation scale, spectral heterogeneity and shape heterogeneity, where shape heterogeneity is described by smoothness and tightness. The heterogeneity F is defined as [22]
F = ω   ×   h c o l o r + ( 1     ω )   ×   h s h a p e  
h s h a p e = ω c o m p a c t   ×   h c o m p a c t + ( 1     ω c o m p a c t )   ×   h s h a p e  
where ω is the spectral information weight; h c o l o r is the spectral heterogeneity; h s h a p e is the shape heterogeneity; h c o m p a c t is the tightness; ω c o m p a c t is the tightness weight; and h s m o o t h is the smoothness.
In this study, eCognition software was used as the operating platform, and the estimation of scale parameter (ESP) was used to determine the optimal segmentation scale for images in Da’an City, west of Jilin Province. Feature classification is performed by selecting various feature information such as luminance value, the gray value of each band, aspect ratio and shape index. Using the classification algorithm, Da’an City is divided into 8 categories: paddy field, saline–alkali land, dry land, forest land, grassland, waters, urban and built-up, and unused land. On this basis, through human–computer interpretation and post correction, the land use distribution pattern in the study area in 2015 and 2021 was obtained.

2.3.2. Land Surface Temperature (LST) Extraction

In this study, a SMW algorithm was established to compute LST. The algorithm was developed by CM-SAF to derive LST data records from the Meteosat First and Second Generation (MFG and MSG) series of satellites. The approach adopts simple linear regression to express the empirical relationship between TOA brightness temperatures in a single TIR channel and LST [23,24,25,26]. The model is based on the radiative transfer equation, and directly retrieves the surface temperature without atmospheric correction. The radiative transfer equation is as follows [27]:
L S T = A i T b ε + B i 1 ε + C i
where T b is the TOA brightness temperature of the TIR channel and ε is the surface emissivity of the same channel. Algorithm coefficients A i , B i and C i were determined from linear regressions of 10 classes of total column water vapor (TCWV) (I = 1, …, 10), which were determined from linear regressions of radiative transfer simulations performed from 0 to 6 cm in steps of 0.6 cm, with TCWV values above 6 cm being grouped into the last category.

3. Results

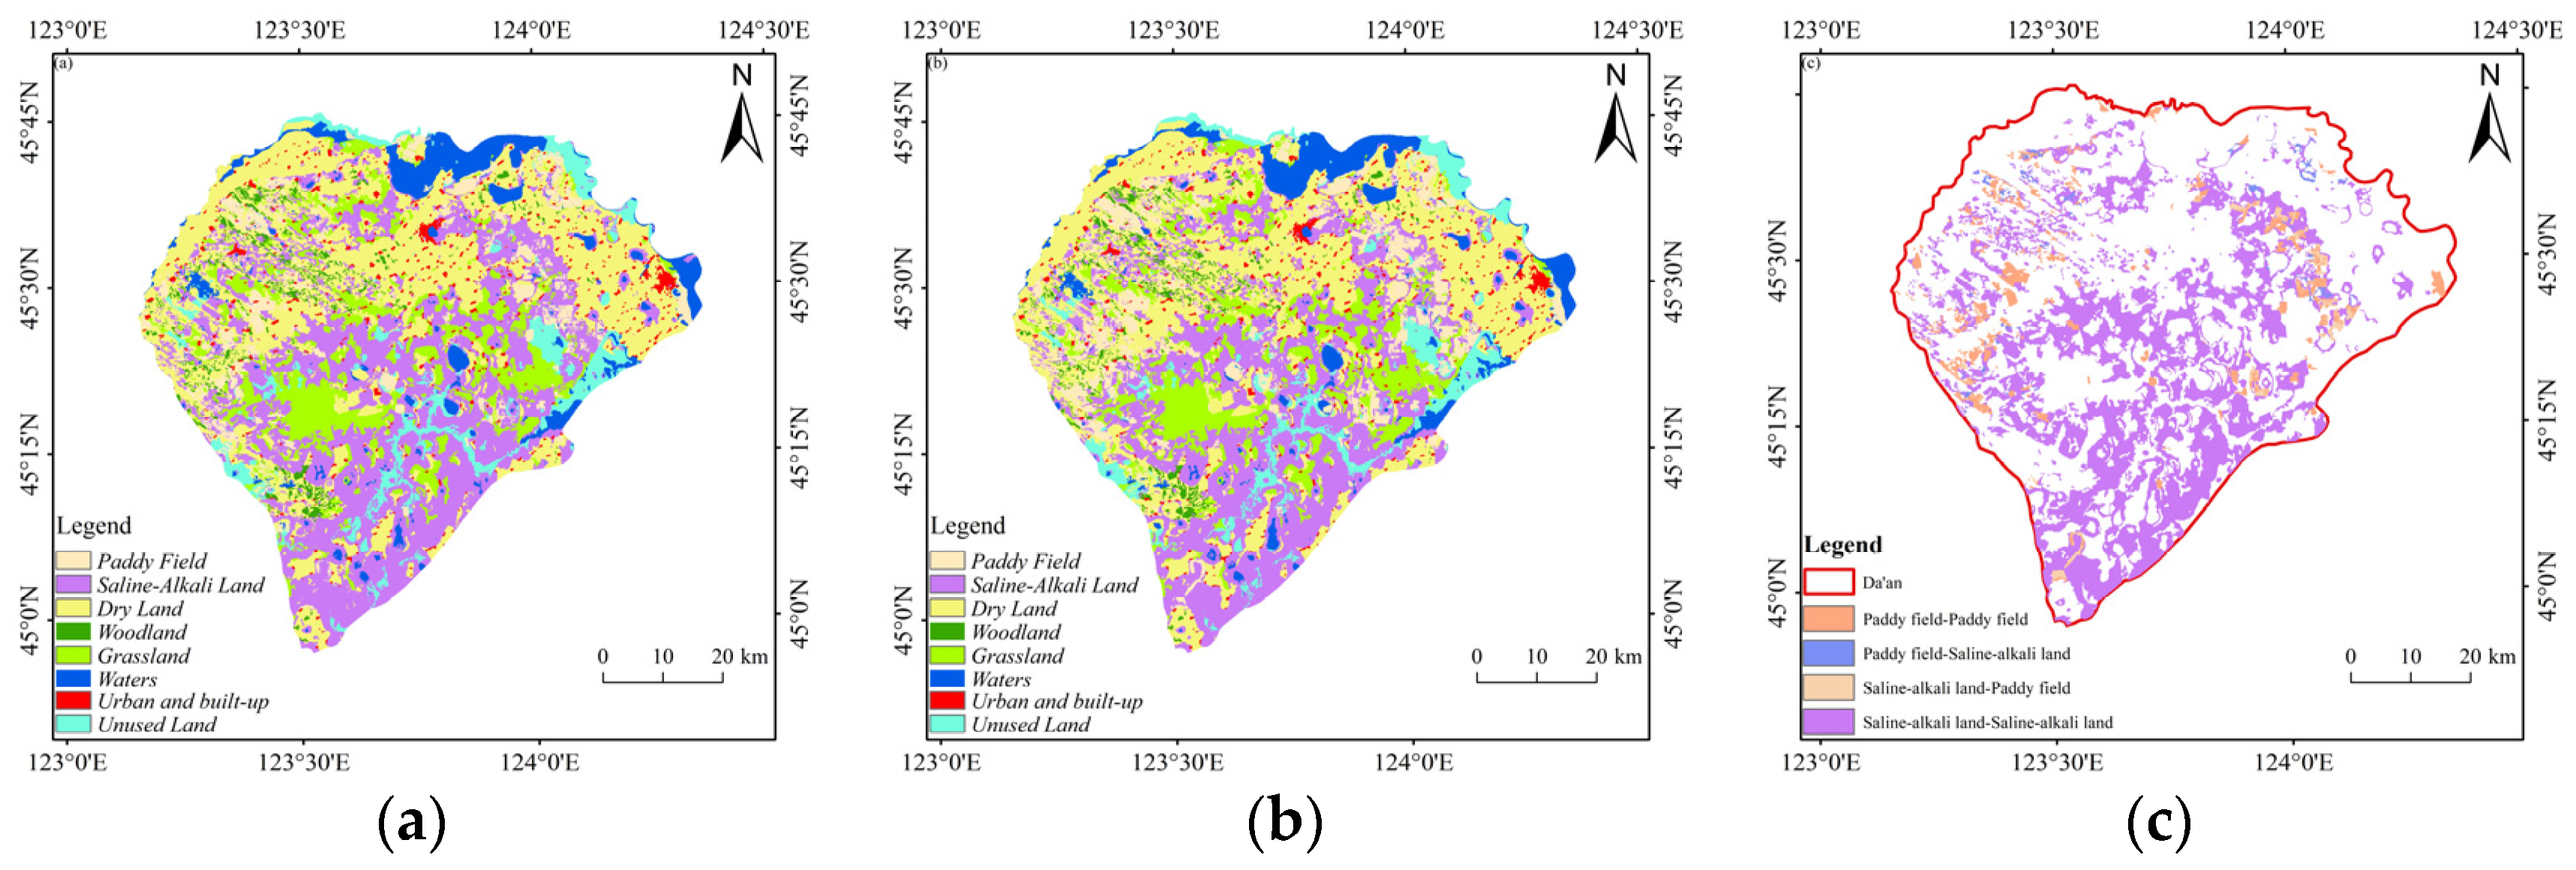
3.1. Characteristics of Land Use Change from 2015 to 2021

Dryland, grassland and saline–alkali land are the three main land use types in western Da’an City, accounting for about 75% to 78% of the total area. From 2015 to 2021, due to changes in human activities and the natural environment, the saline–alkali land and paddy fields in Da’an City have undergone significant changes (Figure 3). Using time-series and spatial overlay analysis of land-use datasets, this paper assesses changes in saline–alkali land and paddy fields from 2015 to 2021. In 2015, the saline–alkali land area was 1588.94 km2, and the paddy field area was 312.12 km2. With the maturing technology of rice cultivation in saline–alkali land and the support of national local policies, in recent years, large areas of saline–alkali land in western Jilin have been transformed into paddy fields. In 2021, the area of saline–alkali land was 1430.77 km2, and the area of paddy fields was 474.78 km2; compared with 2015, the overall area of saline–alkali land has decreased by 158.17 km2, and the overall area of paddy fields has increased by 162.66 km2. Among them, 46.76% of the new paddy fields were converted from saline–alkali land. From the analysis of the land use change of saline–alkali land and paddy fields, it can be seen that the overall area of saline–alkali land is decreasing, and the overall area of paddy fields is expanding. Therefore, the reclamation of saline–alkali land has become the principal means of expanding paddy fields, and the degraded saline–alkali land has become an important reserve of arable land resource in these areas.

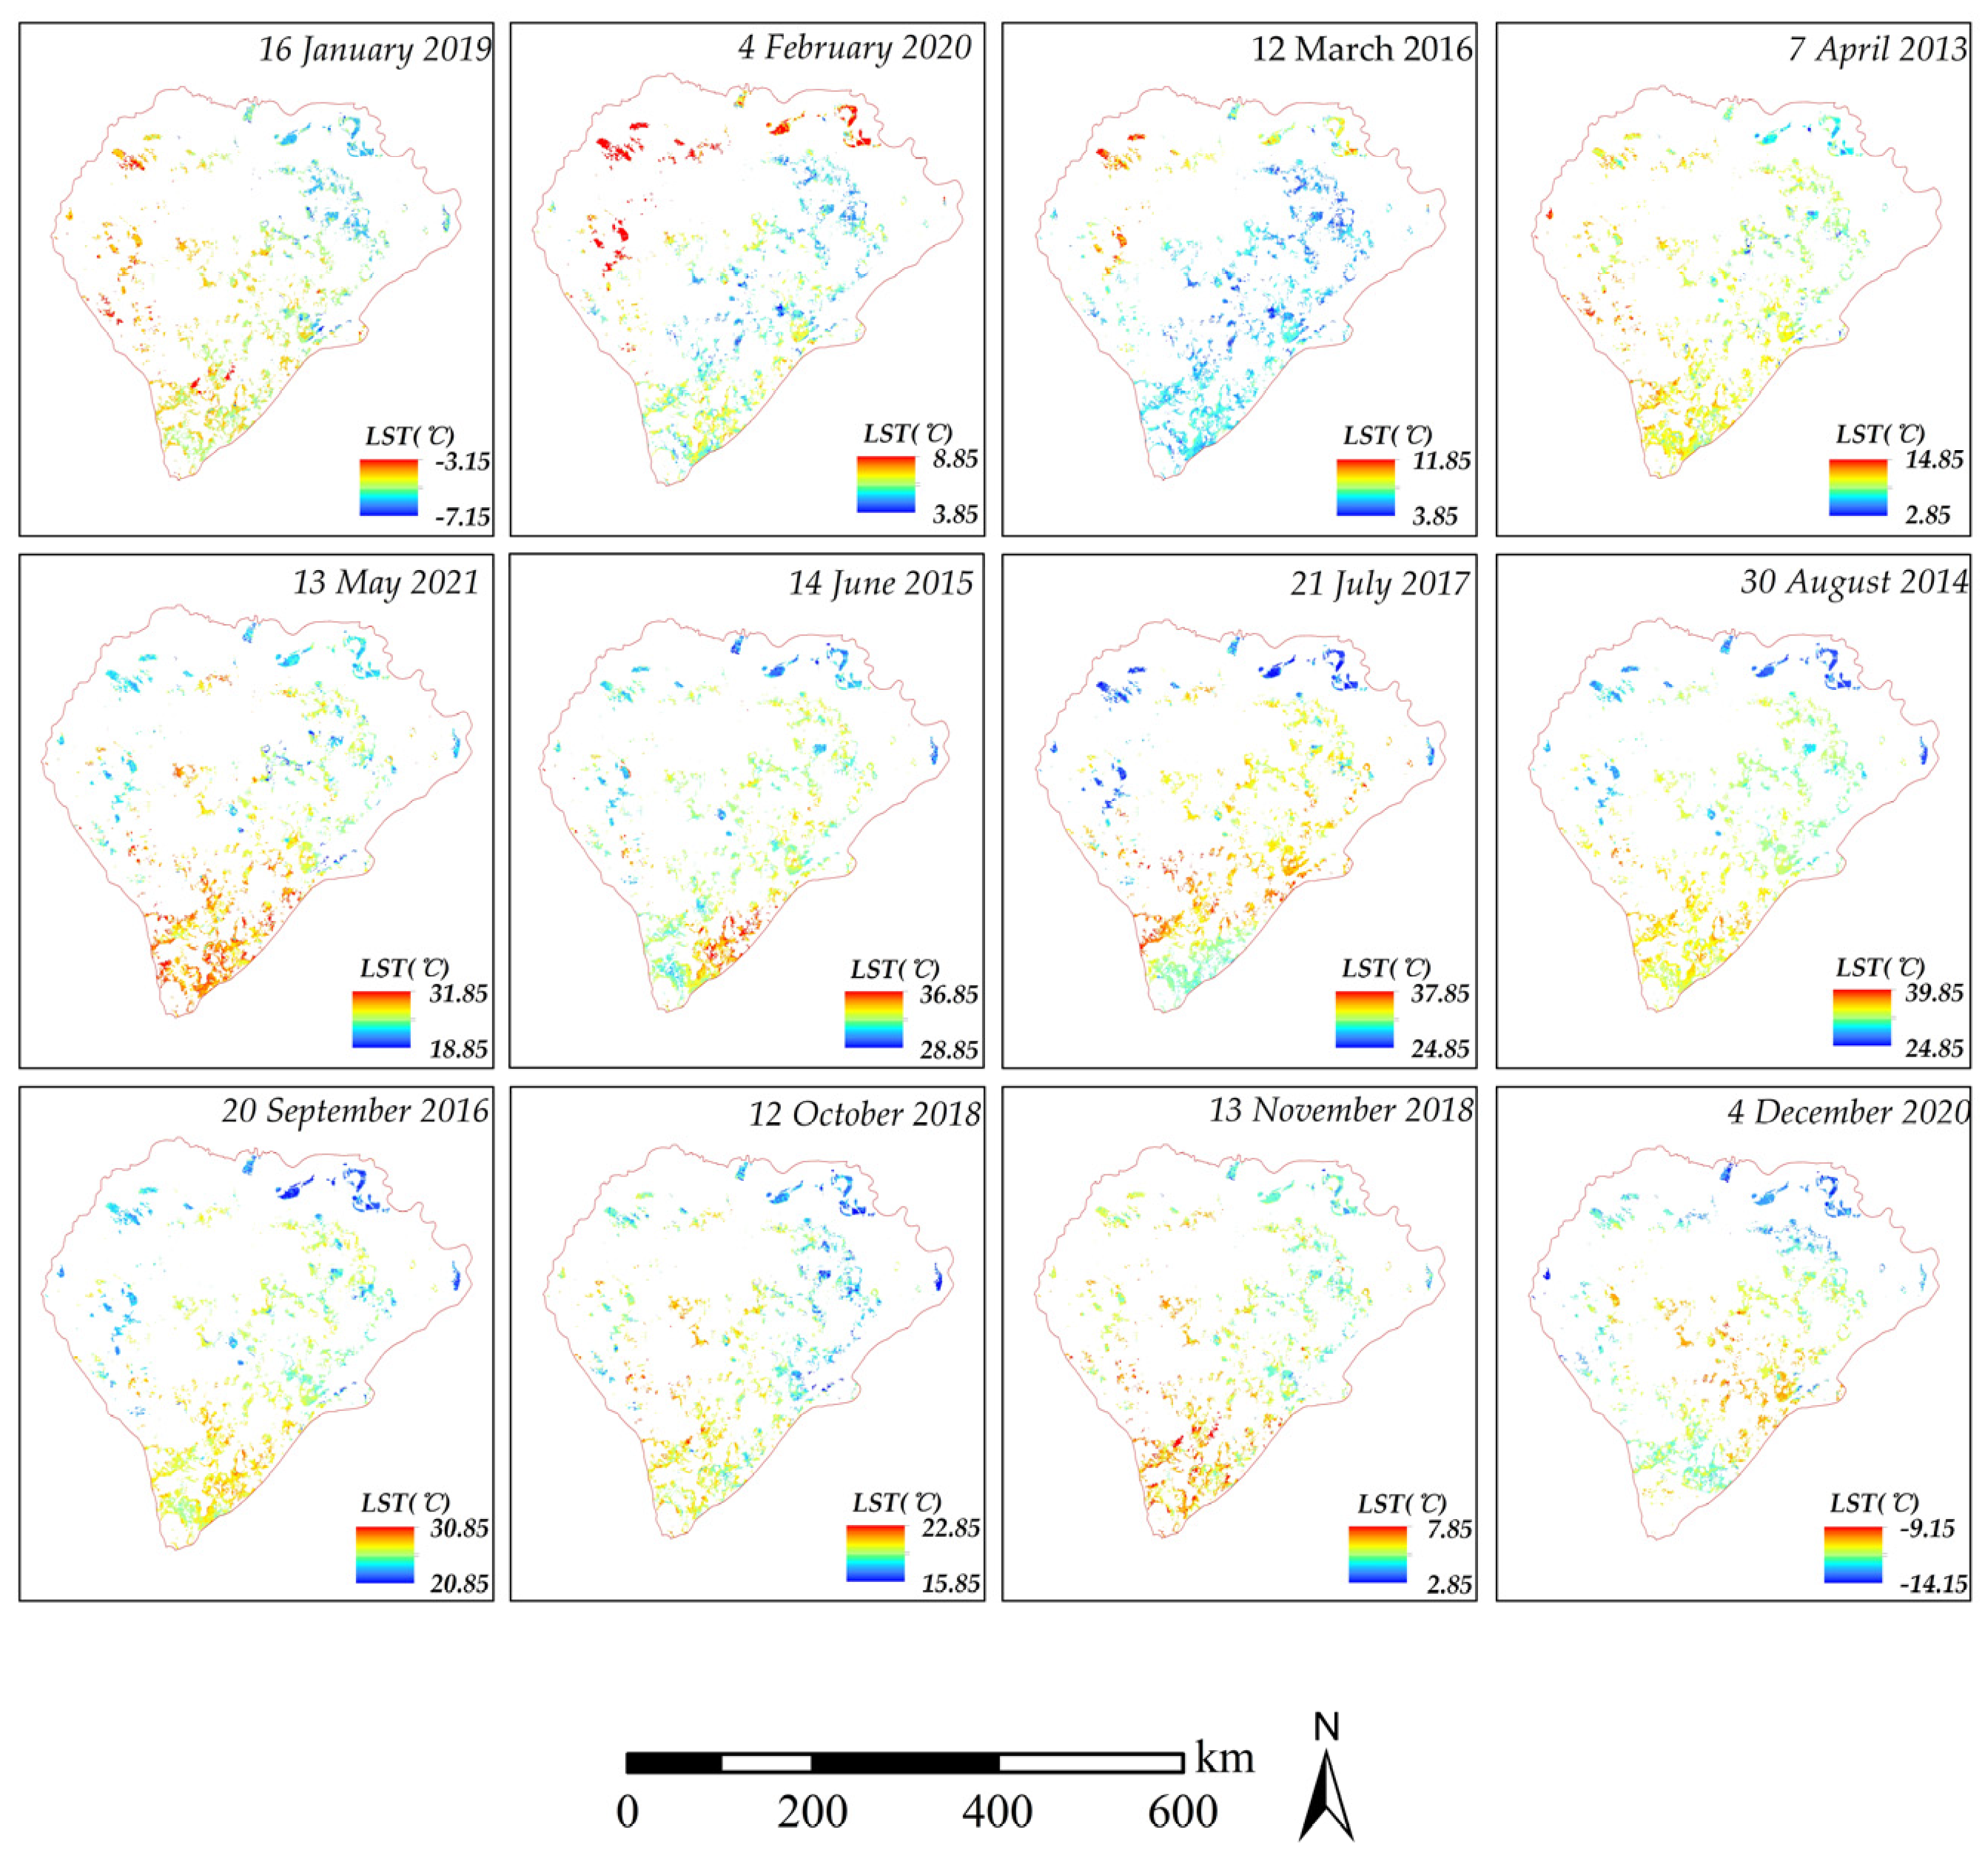
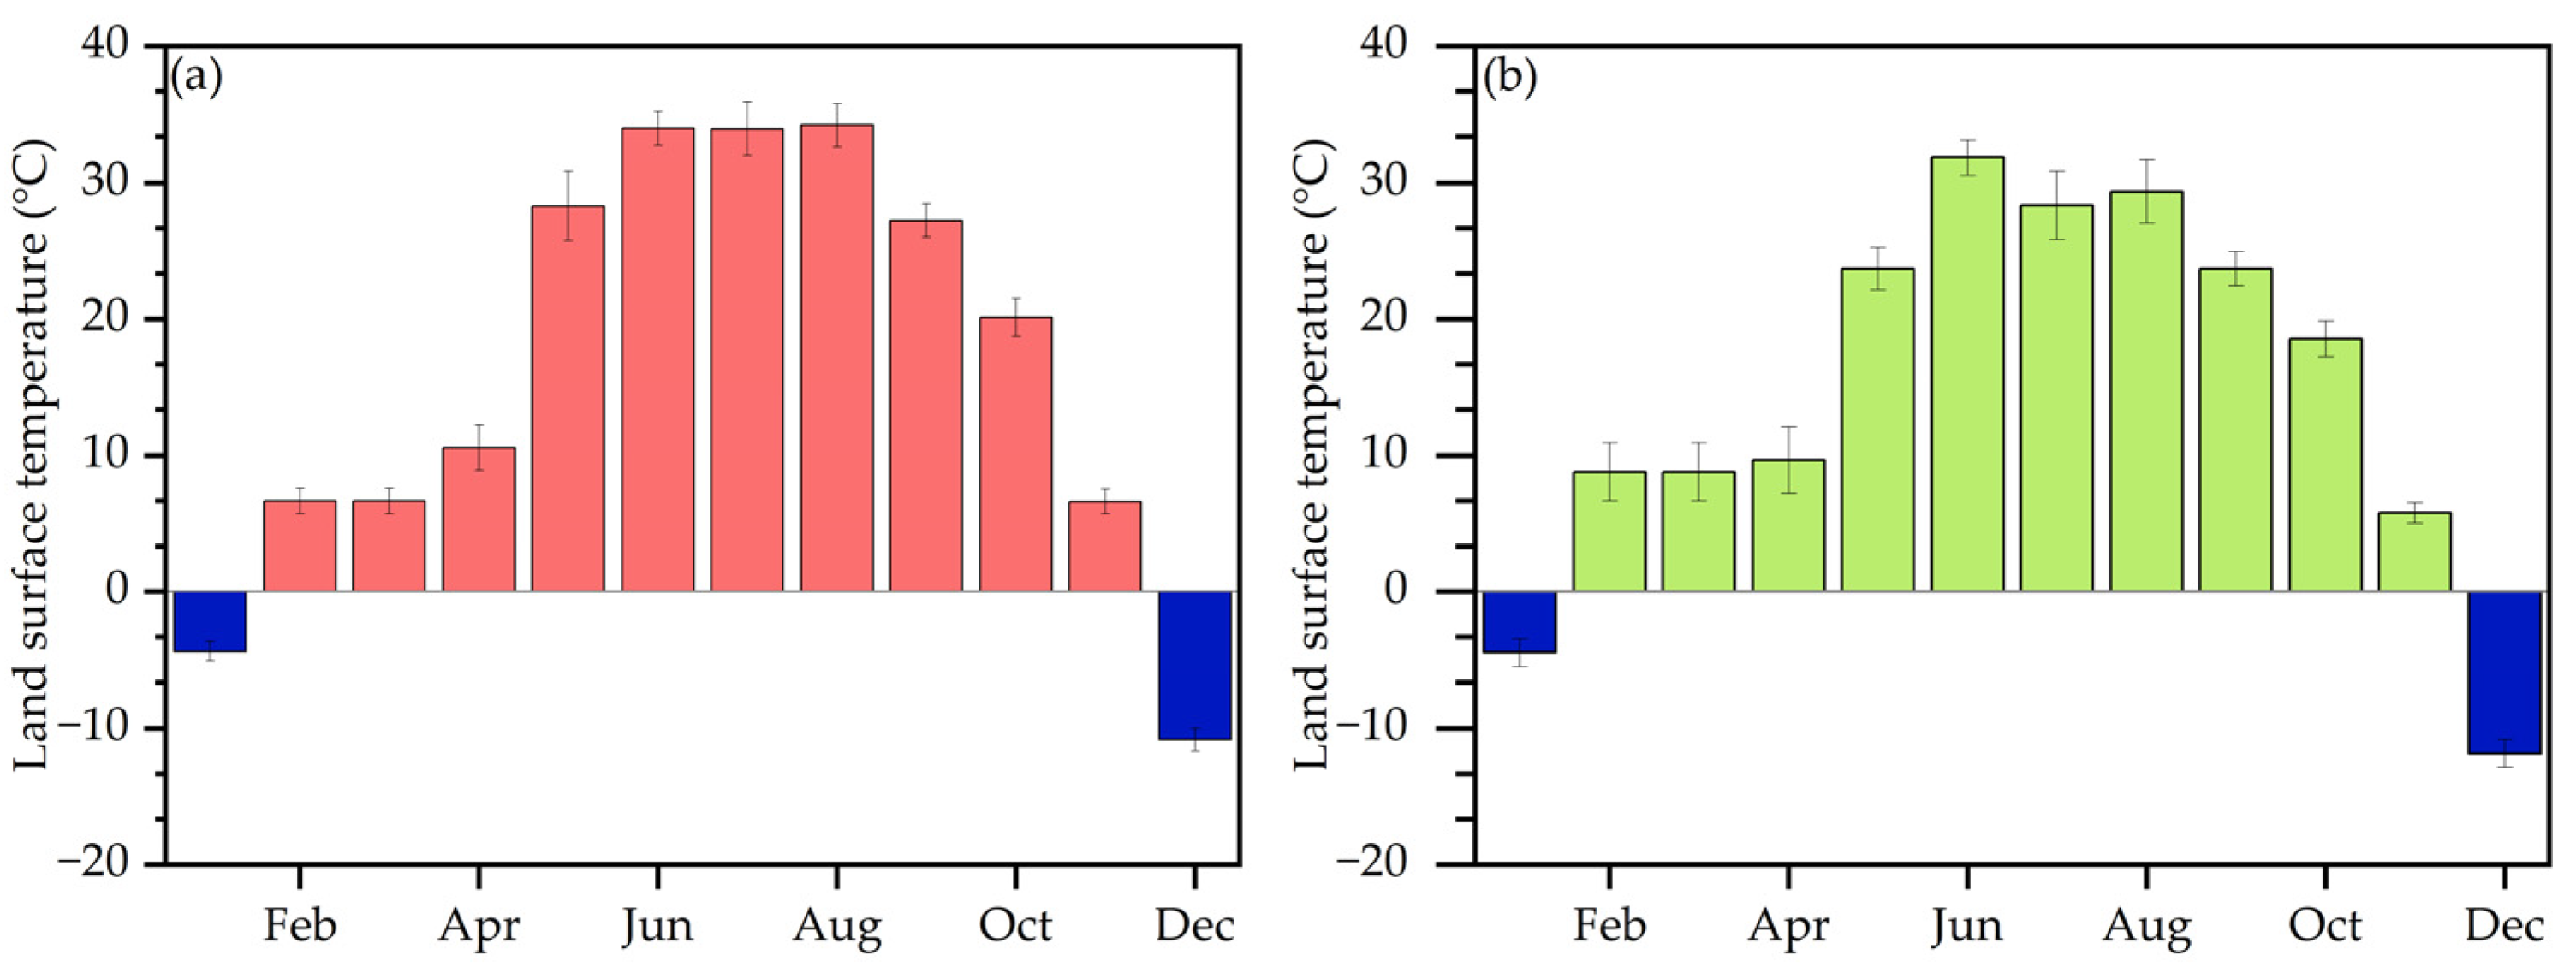
3.2. Monthly Scale Characteristics of the Effect of Rice Cultivation in Saline–Alkali Land on Surface Temperature

The distribution of surface temperature of saline–alkali land and paddy fields between different months of the year in Da’an City showed obvious spatial heterogeneity (Figure 3). According to the spatial characteristics of saline–alkali land and paddy fields, the overall surface temperature of saline–alkali land in the growing season (May–October) is significantly higher than that of paddy fields. From the spatial pattern of the thermal environment represented in Figure 4, the growing season can be divided into one category. This category is characterized by the higher overall value of the surface temperature of the saline–alkali land, the overall low-temperature distribution of the surface temperature of the paddy field, and the obvious difference between the surface temperature of the saline–alkali land and the paddy fields. February to March can be classified into one category, which is characterized by relatively high surface temperatures in some areas of paddy fields, relatively low surface temperatures in some areas of saline–alkali land and higher surface temperatures in some areas of paddy fields than in certain areas of saline–alkali land. January, November and December can be classified into one category. This category is characterized by the difference in surface temperature between saline–alkali land and paddy fields not being obvious, possibly due to snow cover.
The regional statistics on the monthly average surface temperature of saline–alkali land and paddy fields (Figure 5) indicate that the surface temperature of saline–alkali land showed a trend of first rising and then decreasing from May to October. It started to increase in May, when the surface temperature was 28.30 ± 2.56 °C, and the peak value appeared in August, when the surface temperature was 34.22 ± 1.98 °C. The changes in surface temperature in saline–alkali land and paddy fields during the growing season are not synchronized. The surface temperature of the paddy fields began to increase in May, and the surface temperature was only 23.71 ± 1.56 °C, while the peak value appeared in June, when the surface temperature was 31.83 ± 1.31 °C. The improvement of saline–alkali land into paddy fields results in a drop in surface temperature of 4.59 °C and 2.15 °C, respectively, from May to June at the beginning of the growing season (Table 2). With the growth of rice, the surface temperature decreased the most in July (tillering) at 5.60 °C (Table 2), 4.86 °C in August (tilling), and 3.55 °C and 1.61 °C in September and October, respectively (fruiting). The difference in surface temperature between saline–alkali land and paddy fields provides an important reference for the study of the effect of improved rice cultivation in saline–alkali land on surface temperature.

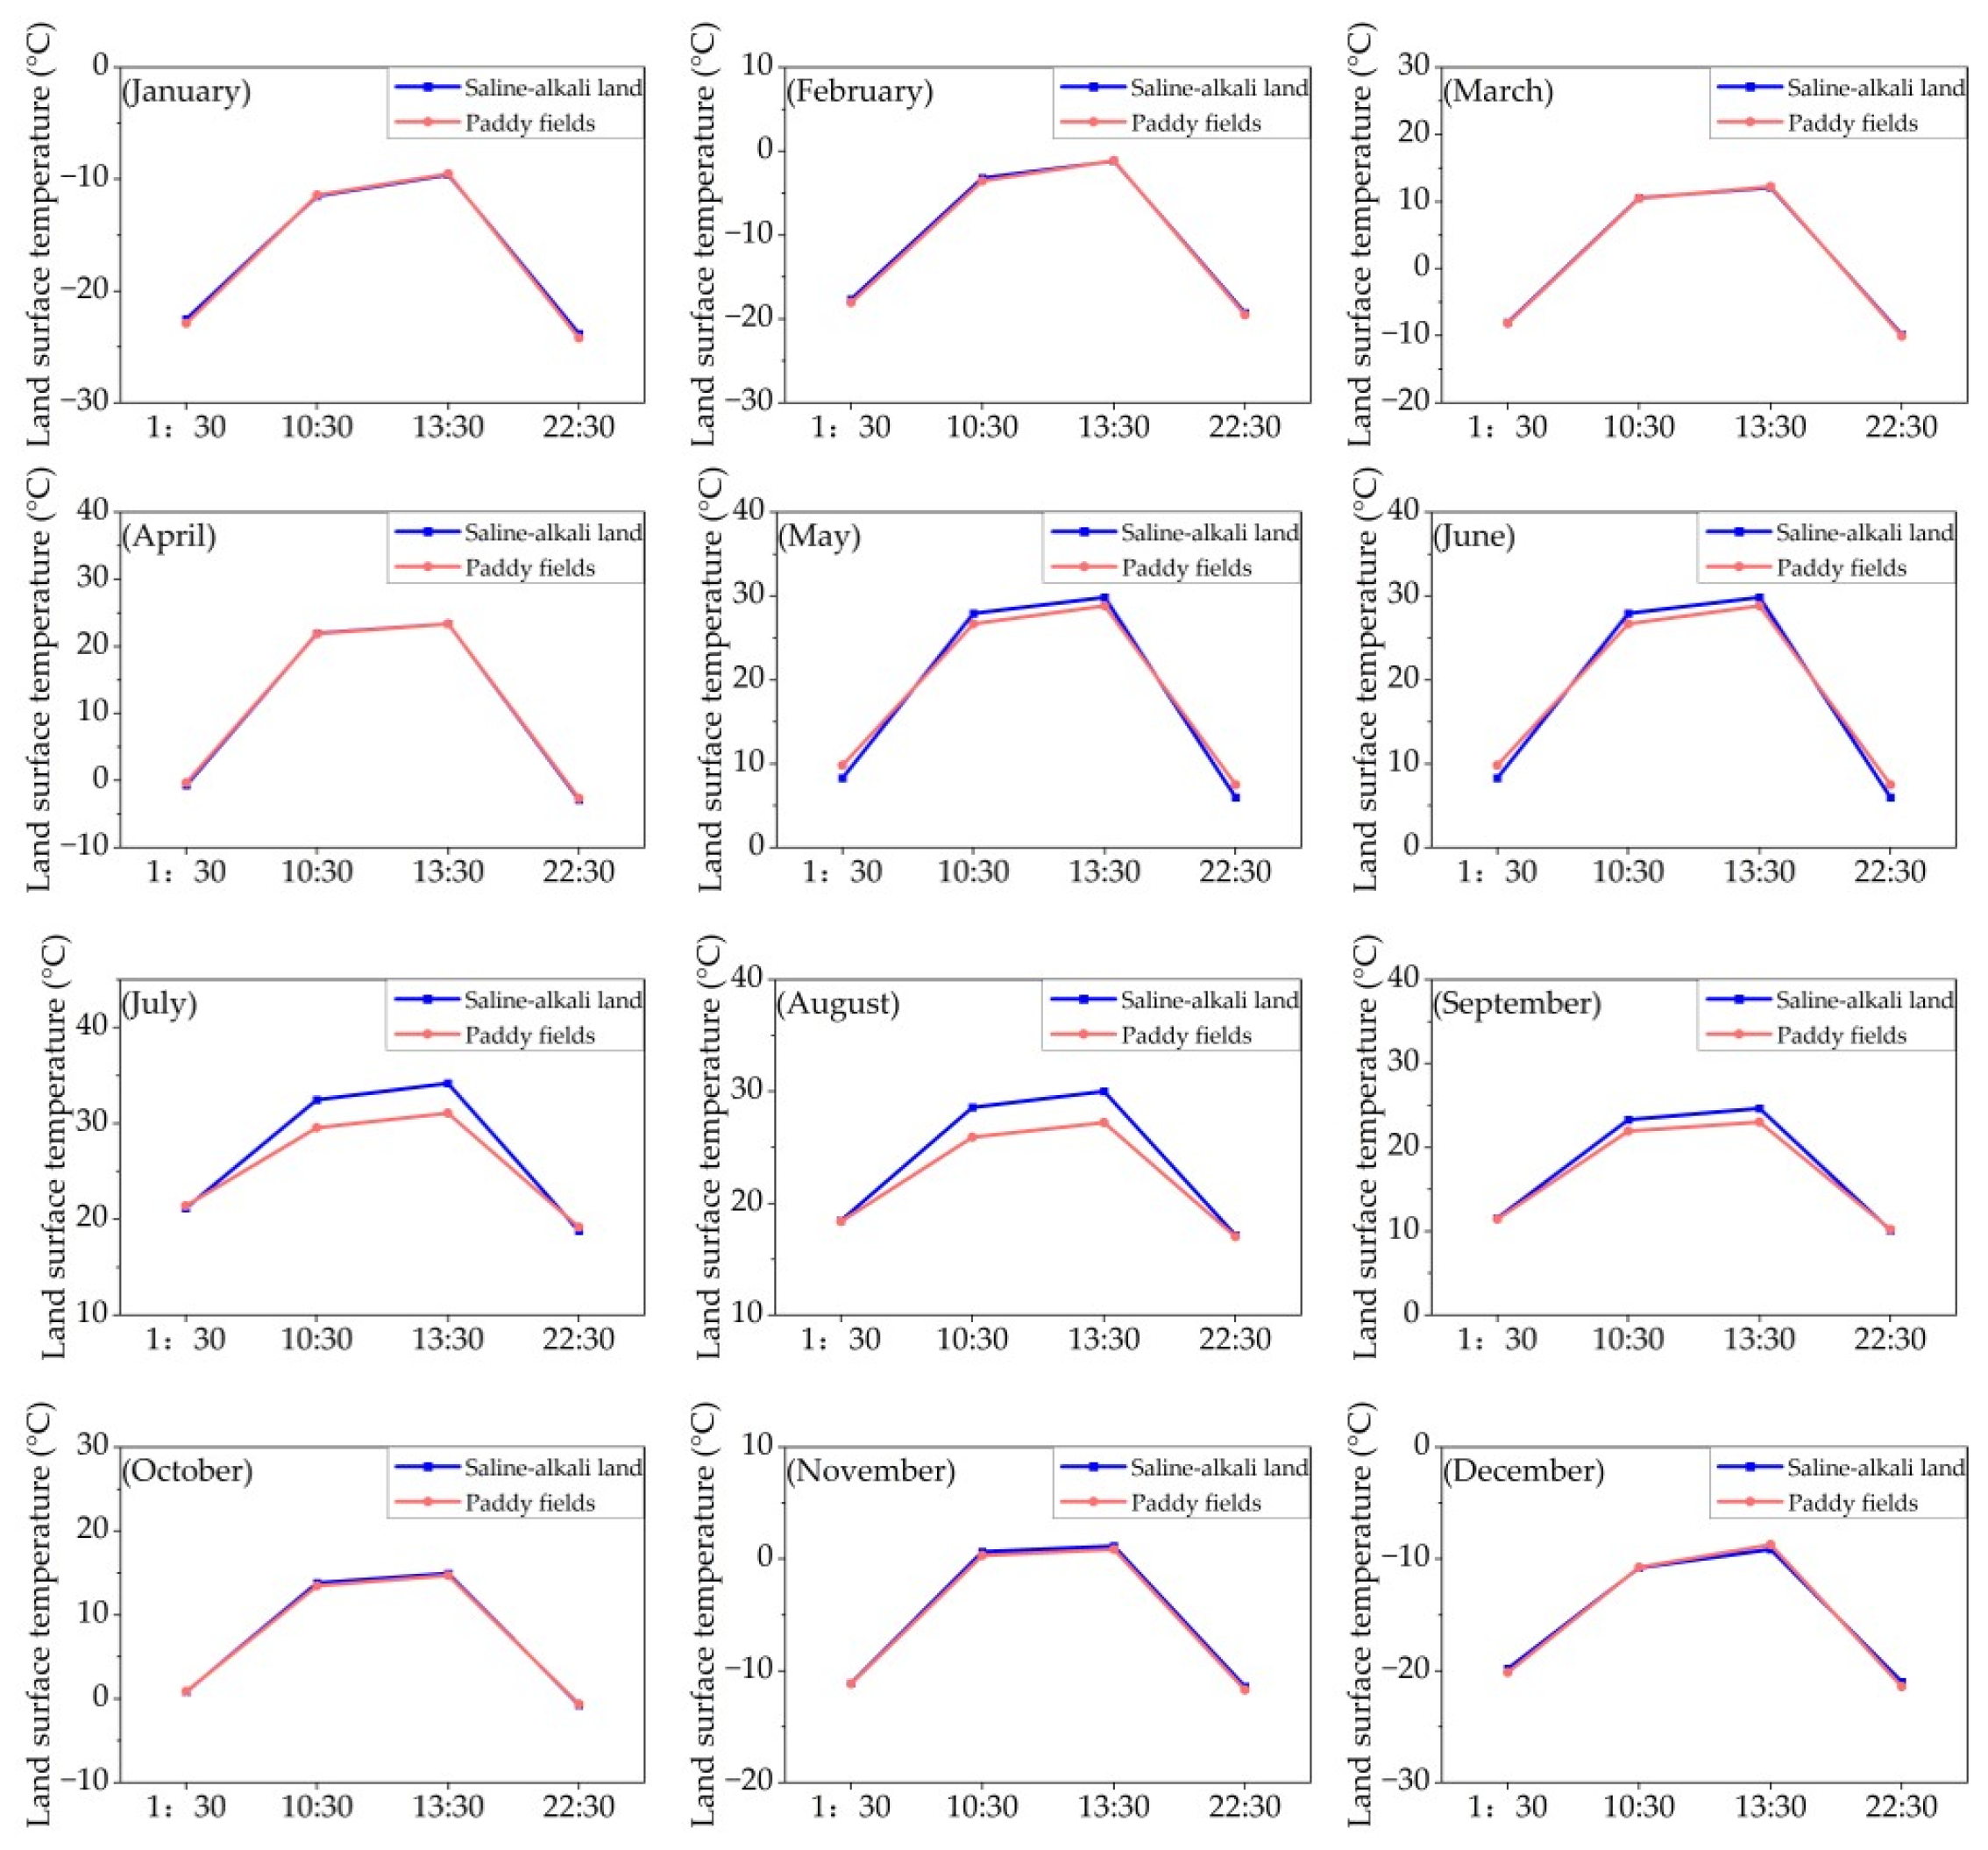
3.3. Diurnal-Scale Characteristics of the Effect of Rice Planting in Saline–Alkali Land on Surface Temperature

The diurnal surface temperature for both saline–alkali land and paddy fields was illustrated in Figure 6, Table 3. Based on the 2015–2021 monthly daytime and nighttime LST averages from Terra and Aqua, we found the saline–alkali land generally shared a higher LST during daytime, and lower LST during nighttime. The annual LST differences between saline–alkali land and paddy fields is 0.88 °C at daytime, which is −0.18 °C at nighttime, indicating the saline–alkali greening induced by paddy fields can cool the daytime LST by 0.88 °C, while warming the nighttime LST by 0.18 °C, as a result decreasing the daily LST by 0.35 °C. The LST impact due to saline–alkali land greening during the growing season was much more significant, with a decrease in daytime LST of 1.75 °C, and an increase in nighttime LST of 0.55 °C, reducing the daily LST by 0.60 °C. The largest daytime LST difference appeared in July (3.00 °C), indicating the saline–alkali greening caused by paddy fields development can cool the LST by 3.00 °C during the daytime. The greatest nighttime LST difference appeared in May (−1.52 °C), suggesting that the conversion from saline–alkali land to paddy field may warm the nighttime surface by 1.52 °C. As a result of daytime cooling and nighttime warming, the diurnal surface temperature range declined by 1.06 °C and 2.30 °C for the annual mean and growing season mean, respectively.
Specifically, the LST at 10:30 a.m. for saline–alkali land is higher than that of paddy fields from February to November. At 13:30 p.m., from May to November, the surface temperature of the saline–alkali land is higher than that of the paddy fields, and the temperature difference between the two is 0 °C in April; the surface temperature of the saline–alkali land is lower than that of the paddy fields in January, February, March and December. During the 1:30 a.m. period, the surface temperature of the saline–alkali fields was lower than the surface temperature of the paddy fields from April to July and in October, and the surface temperature of the saline–alkali land was higher than the surface temperature of the paddy fields from January to March, and in November and December. At 10:30 p.m., the surface temperature of the saline–alkali land was lower than that of the paddy fields from April to July and September and October, and the surface temperature of the saline–alkali land was higher than that of the paddy fields in the remaining months. Furthermore, during the growing season, the surface temperature difference between saline–alkali land and paddy fields peaked in July, with a temperature difference of 3.09 °C at 13:30 p.m. in July.

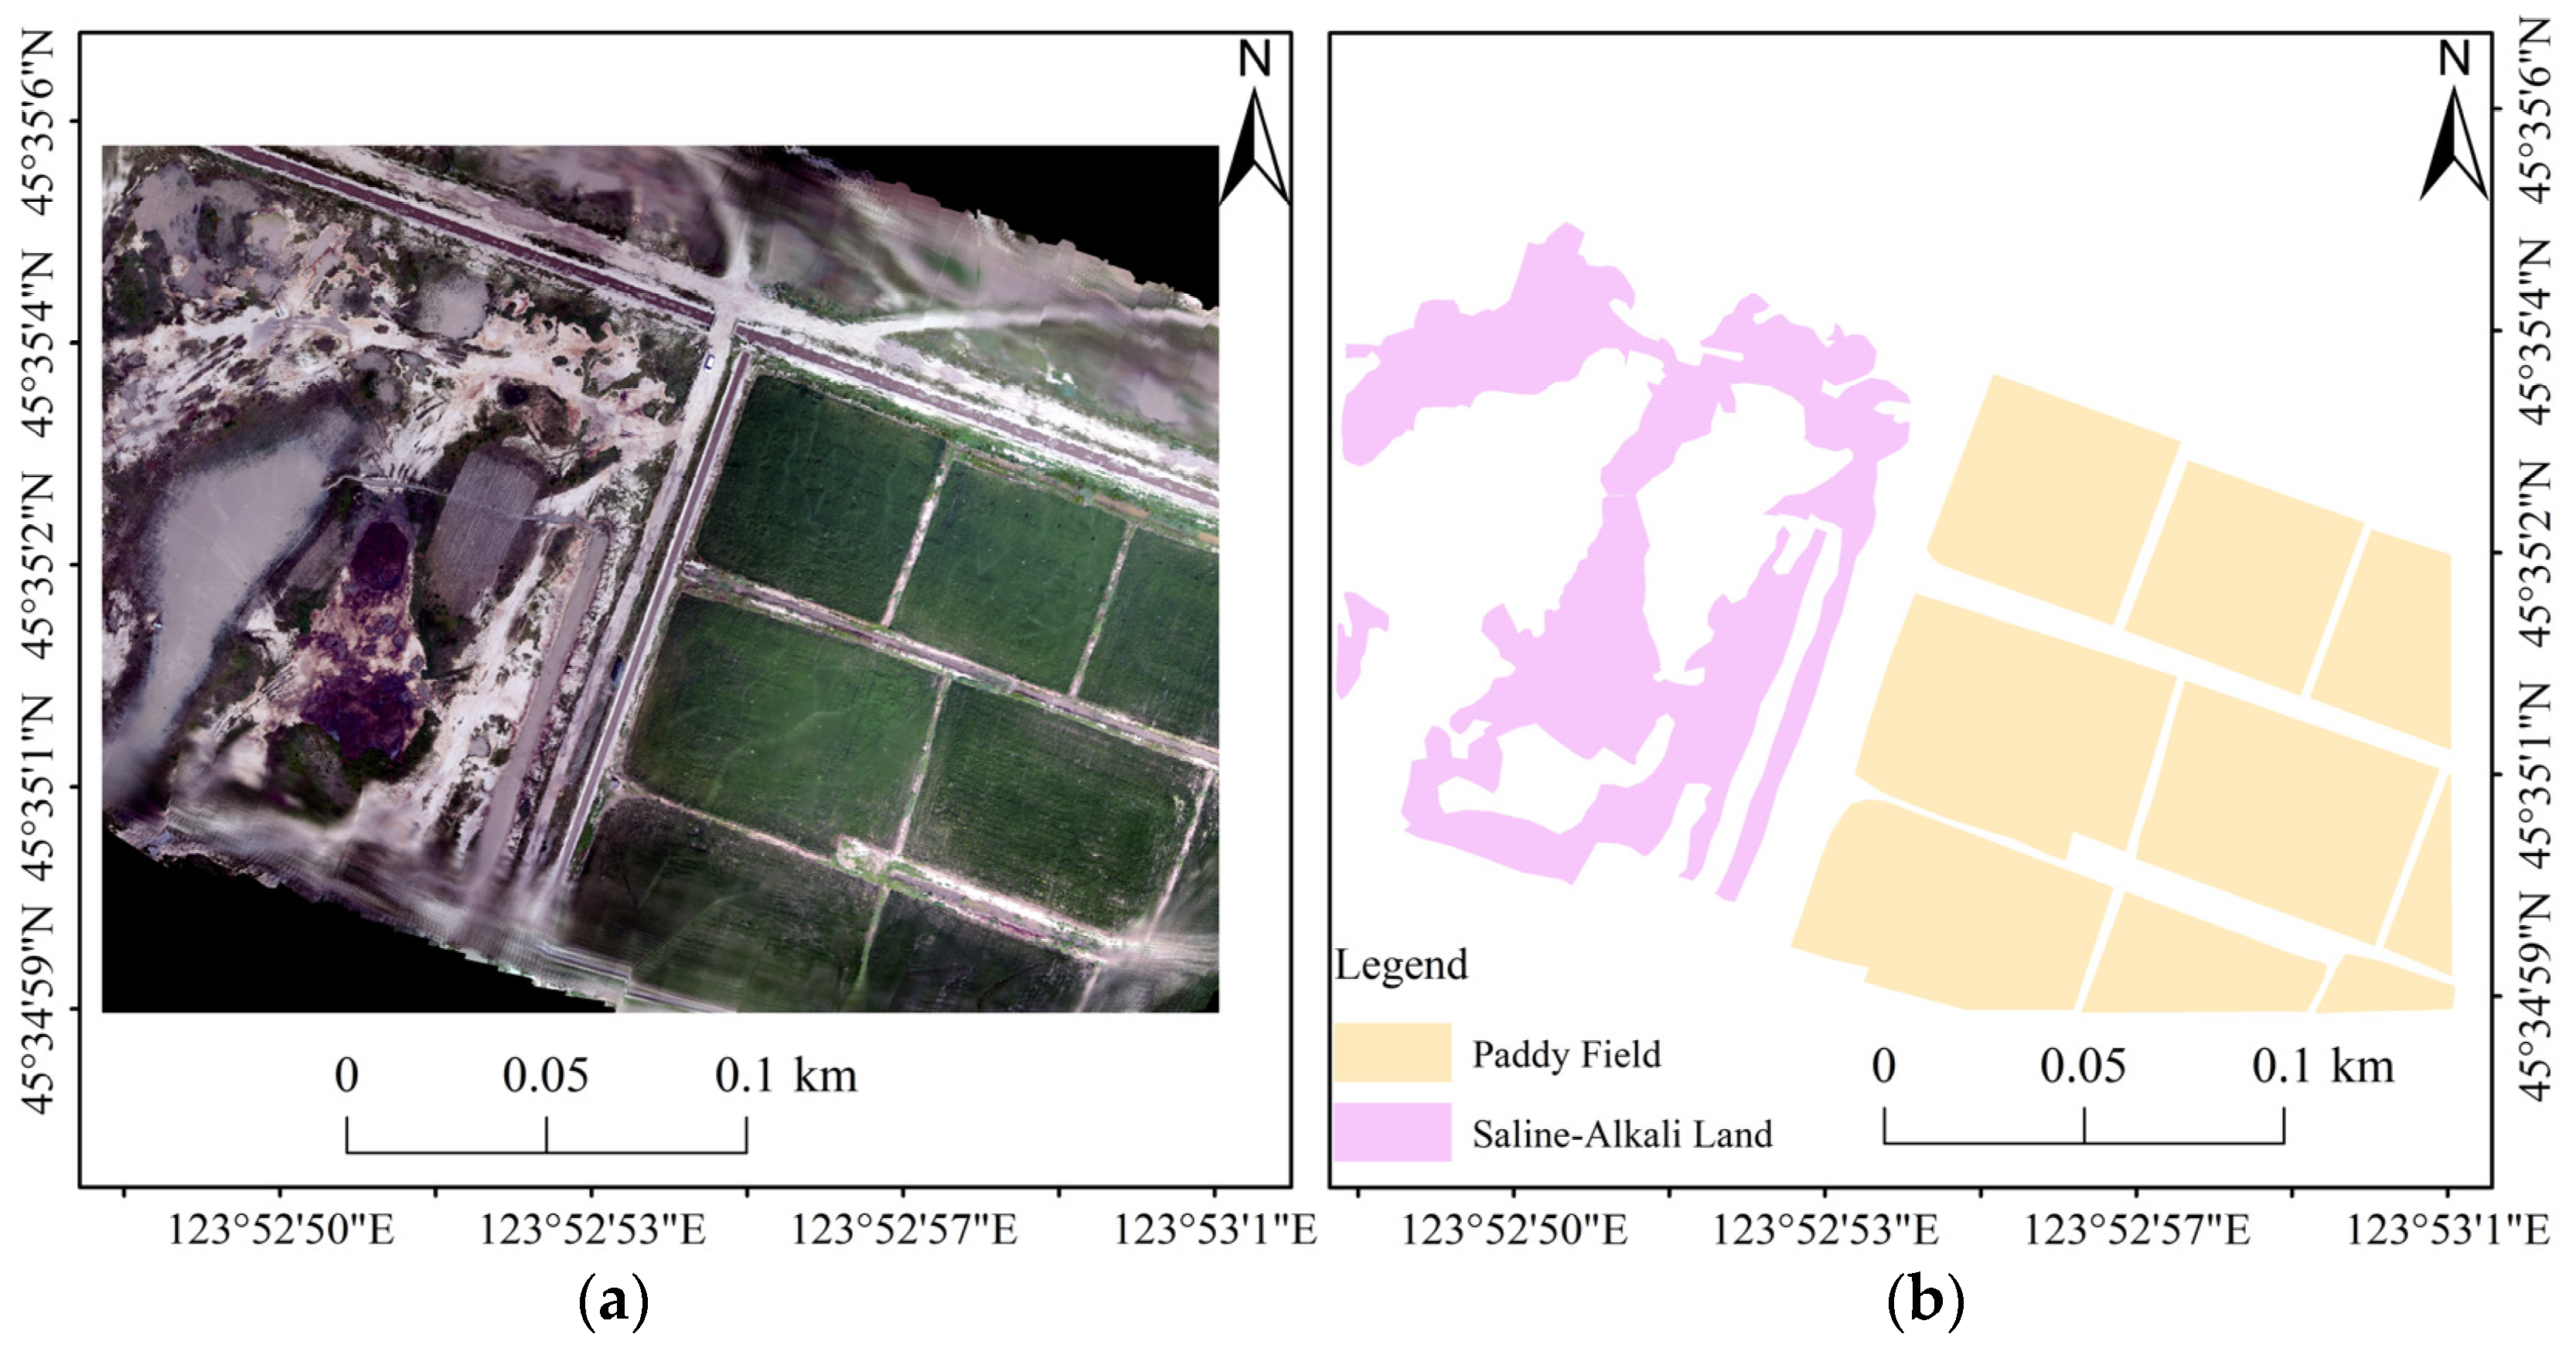
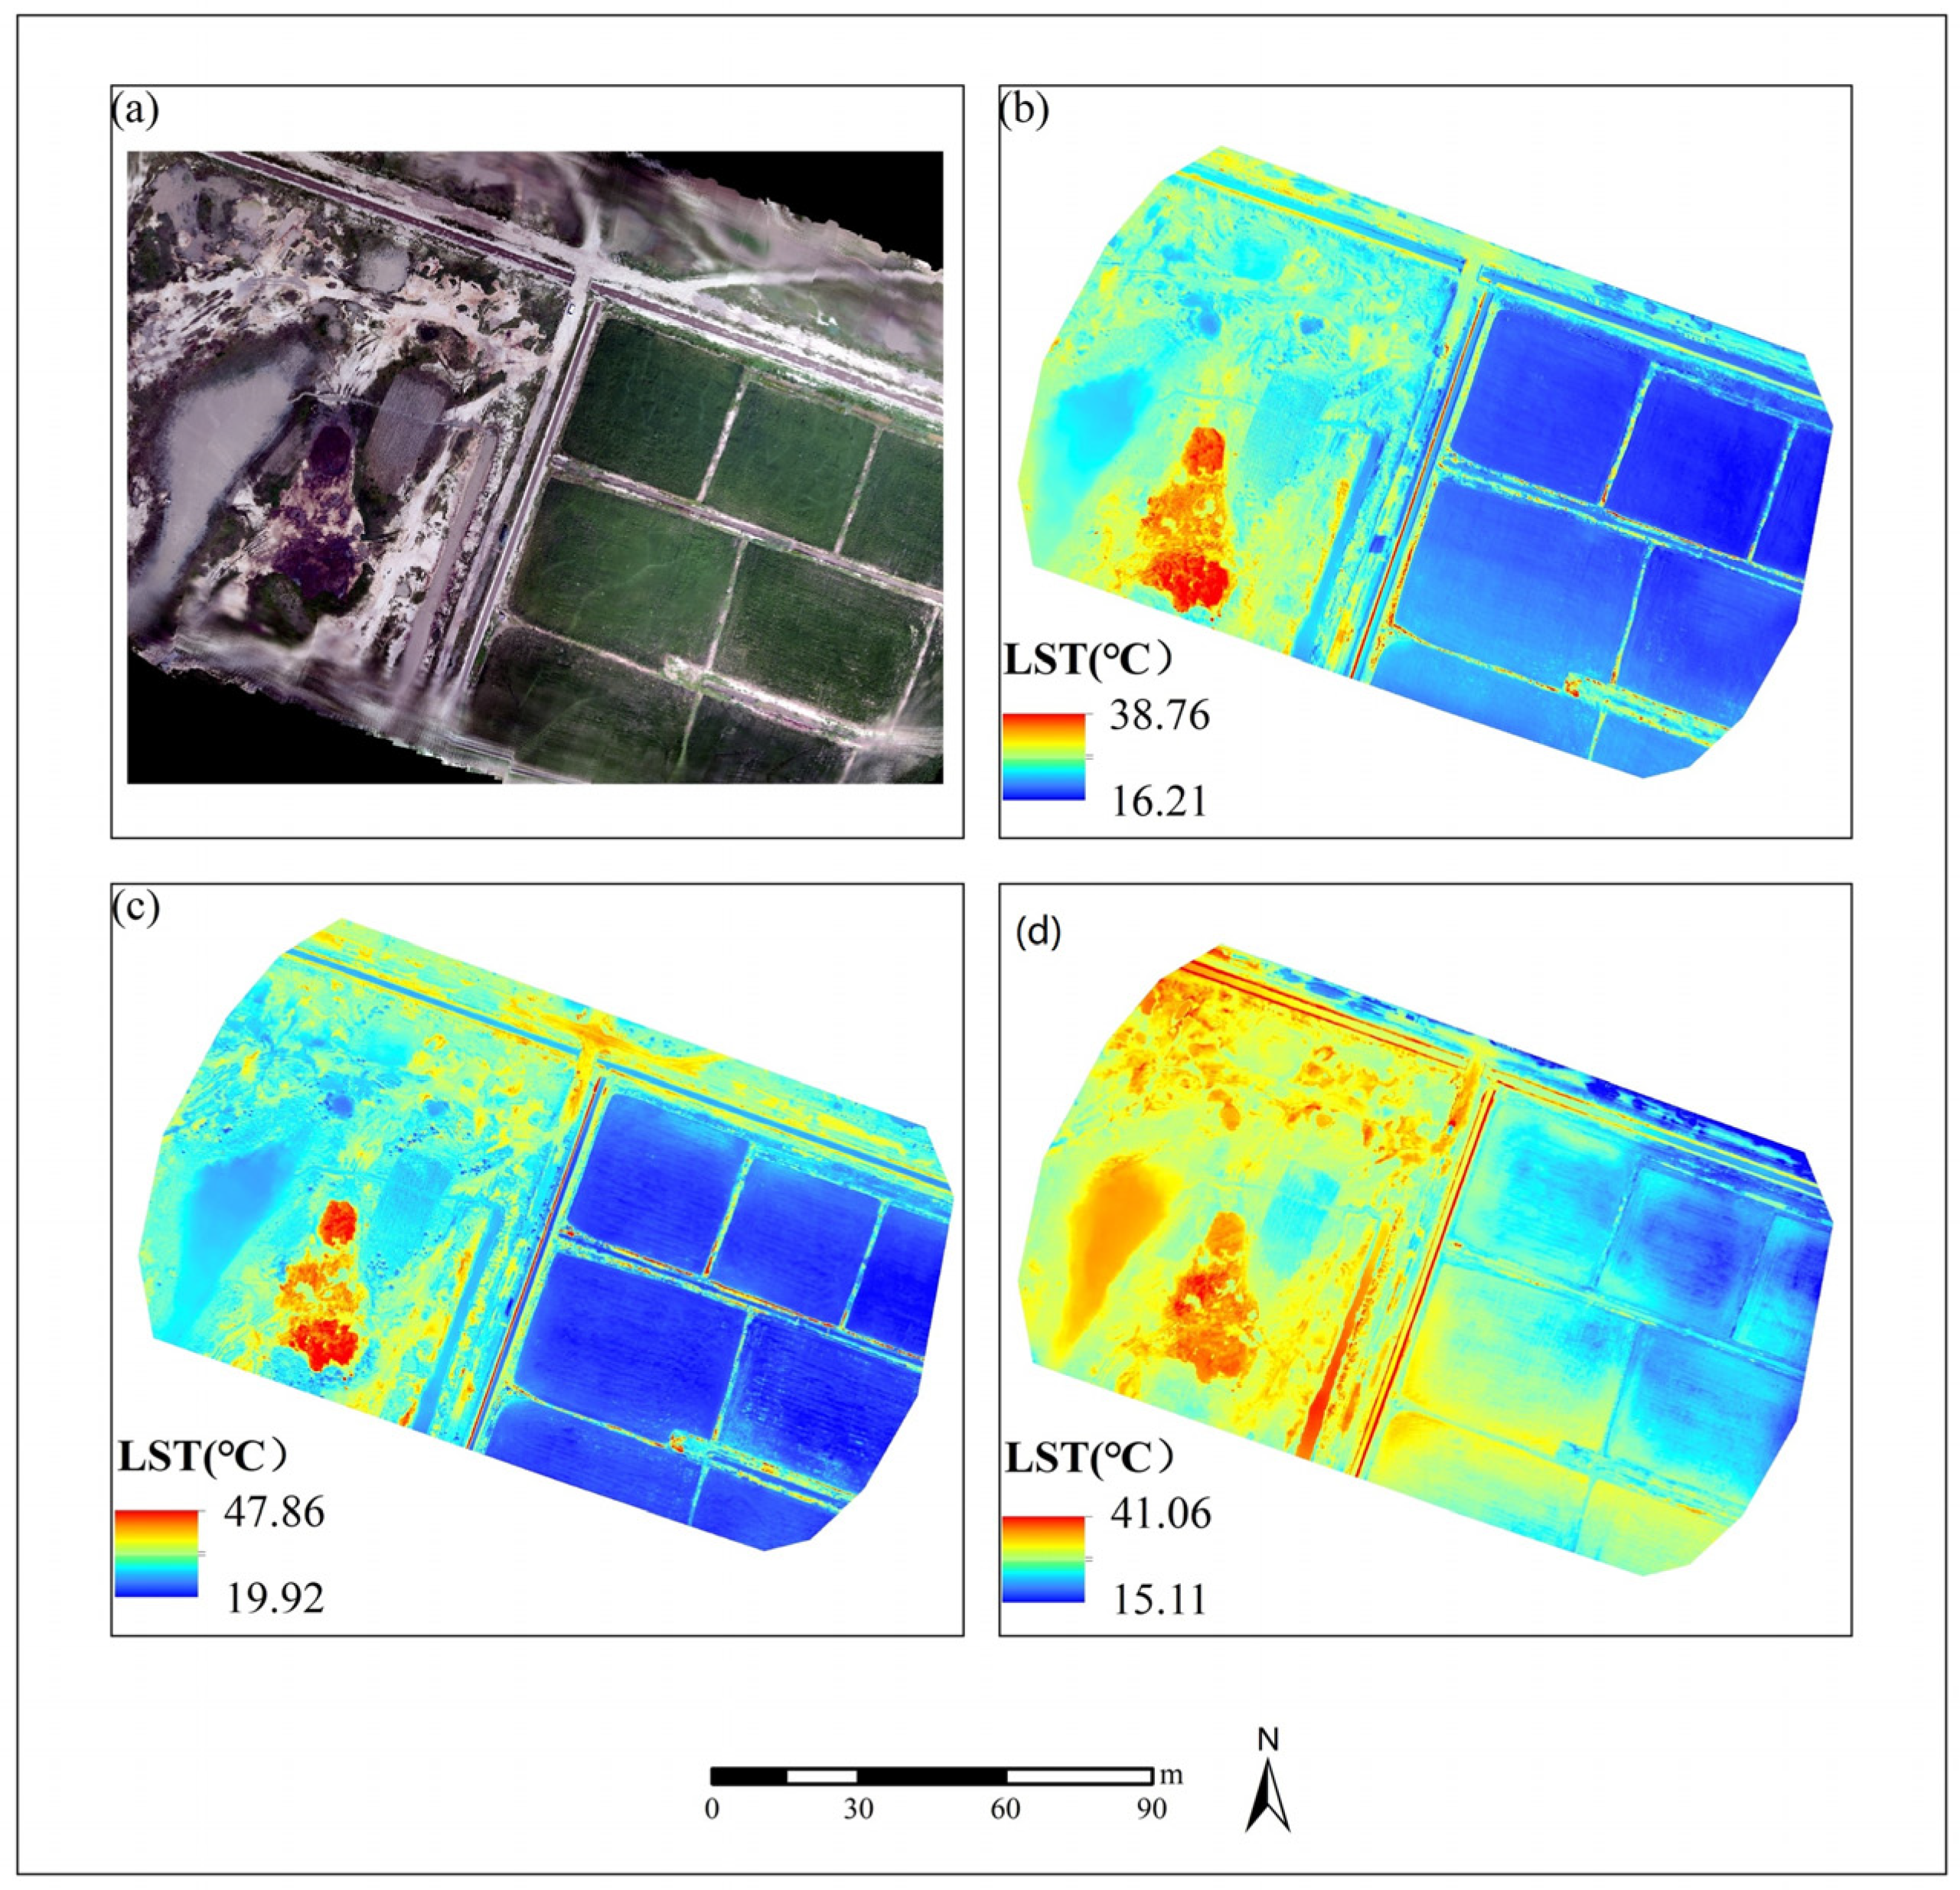
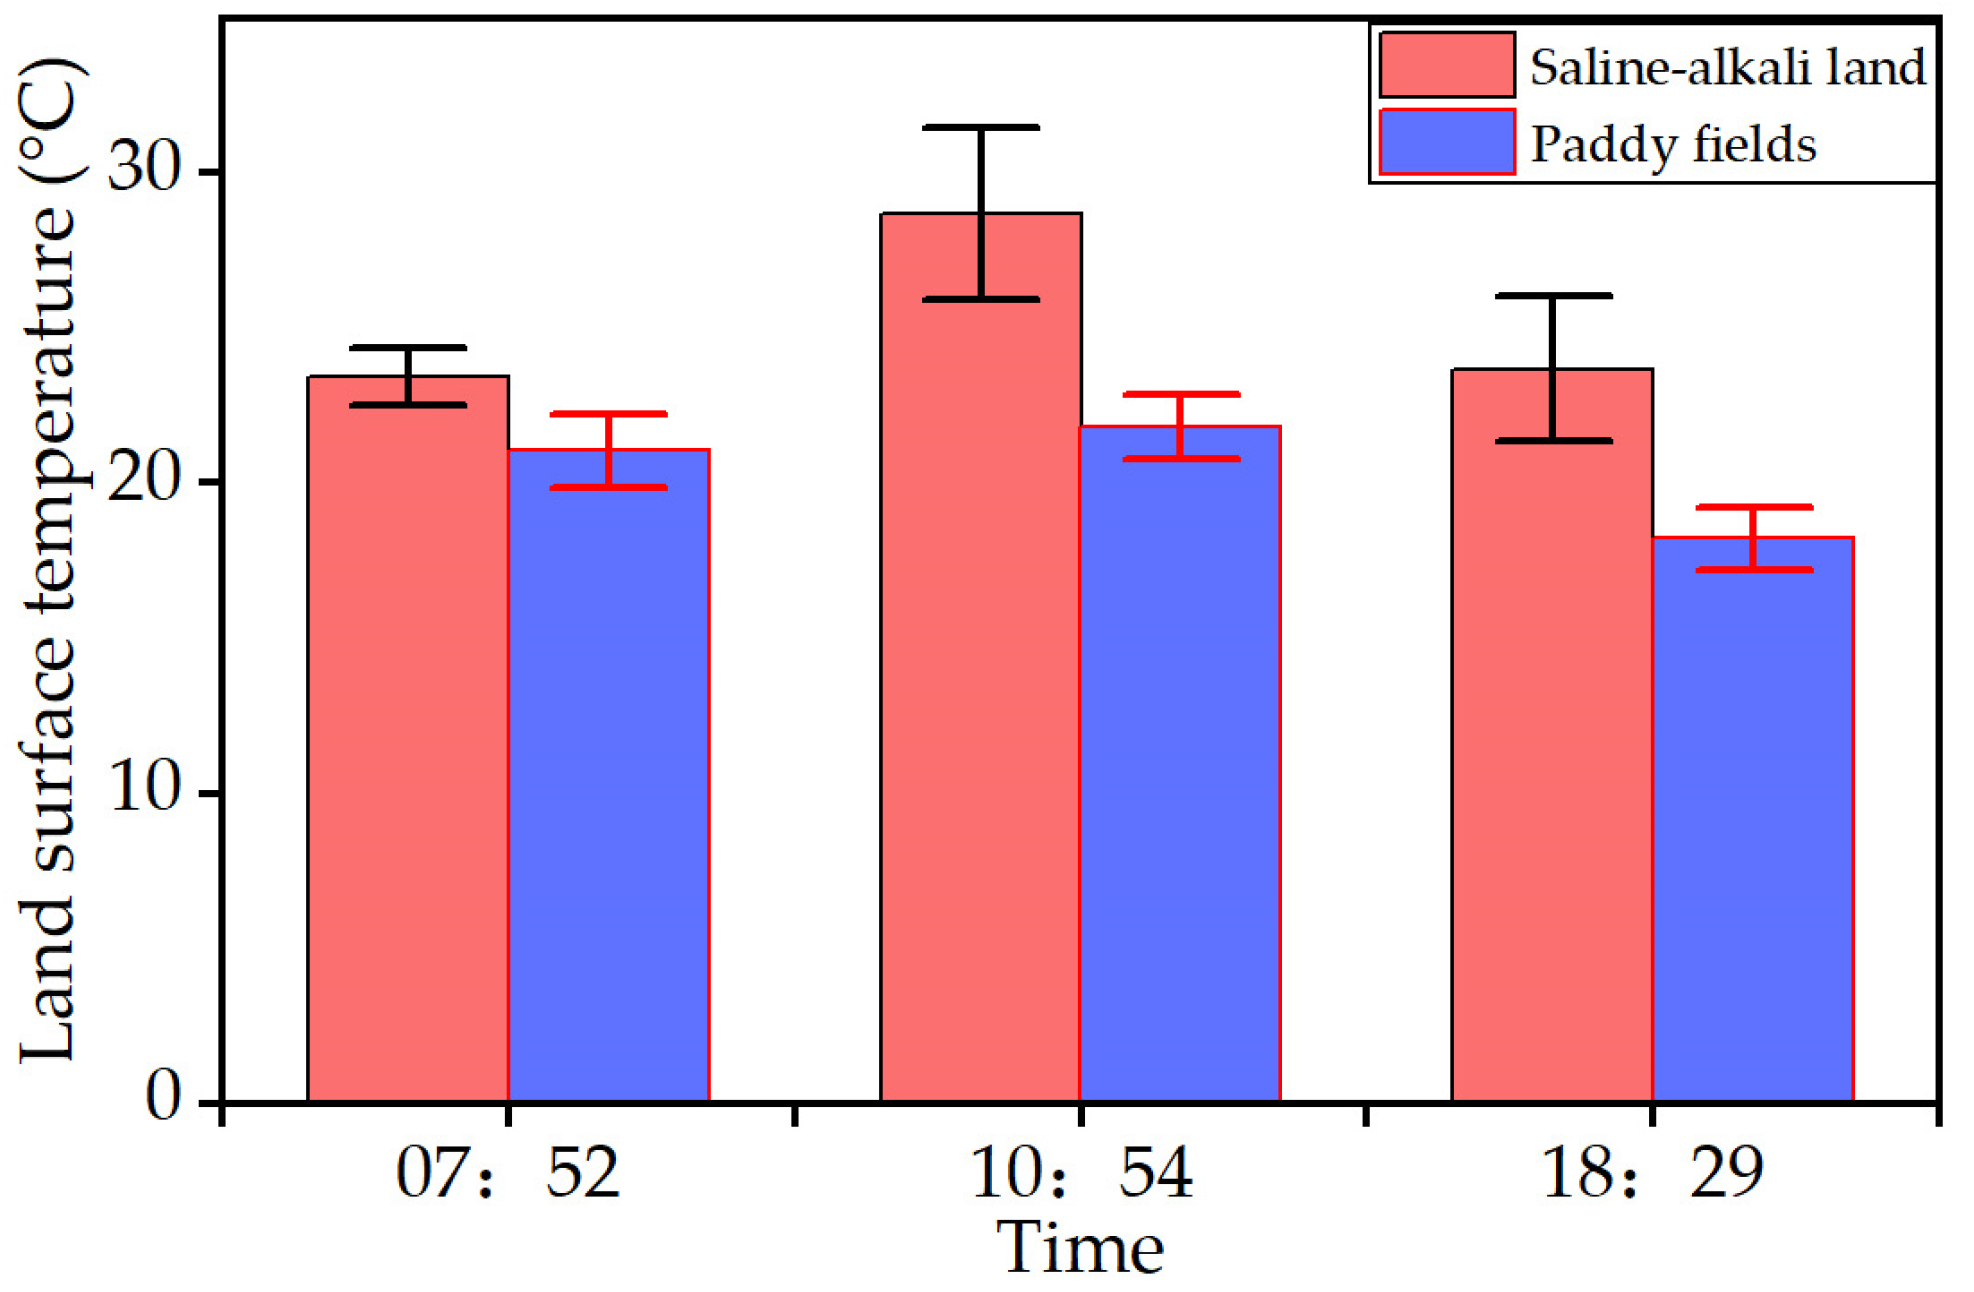
3.4. Daytime LST Observations from UAVs

We used the UAV observation image data to obtain the intraday surface temperature of the study area, aiming to explore the variation rule of the saline–alkali land and paddy fields on the intraday time scale of the surface temperature at the local scale. UAV visible-light images can clearly distinguish saline–alkali land and paddy fields (Figure 7a and Figure A1). From the spatial distribution pattern of surface temperature observed by UAV thermal infrared, it can be seen that there is significant spatial heterogeneity of surface temperature in typical areas (Figure 6). Based on the spatial overlay analysis of land use types and surface temperature data, it was found that the surface temperature of saline–alkali land is higher than that of paddy fields in the early, middle and late periods. Moreover, the surface temperature in the paddy fields is more homogeneous, and the surface temperature heterogeneity in the saline–alkali land is stronger, which is related to the degree of salinization of the saline–alkali land, and the distance from the paddy field.
It can be seen from Figure 8 that the surface temperature of saline–alkali land gradually increased, and the peak appeared at noon when the surface temperature was 28.68 ± 2.78 °C. In the afternoon, the surface temperature gradually decreased, and the surface temperature of saline–alkali land dropped to 23.68 ± 2.33 °C at night. The overall diurnal changes in surface temperature in the paddy fields are consistent with that in surface temperature in the saline–alkali land, with the surface temperature in the paddy fields being 21.04 ± 1.16 °C in the morning, gradually rising toward midday, when the surface temperature in the paddy fields peaks at 21.81 ± 1.04 °C, and dropping to 18.22 ± 1.02 °C in the evening. The surface temperature changes and differences between saline–alkali land and paddy fields indicated that improved rice cultivation in saline–alkali land would have a significant cooling effect on daytime the surface temperature. From the statistical results in Table 4, it can be seen that the cooling effect of rice cultivation in saline–alkali land on the surface temperature is strongest at noon, which will reduce the surface temperature by 6.88 °C, followed by a 5.45 °C cooling in the evening and a 2.37 °C cooling in the morning.

4. Discussions

4.1. Effects and Mechanism of Rice Cultivation in Saline–Alkali Land on Surface Temperature

Numerous studies have shown that vegetation greening or vegetation growth in China will bring about significant surface cooling [13,28]. Zhang et al. found that the increase in farmland greenness in spring contributed to the cooling and wetting effects, while the decrease in crop greenness in summer led to warming and drought effects in the North China Plain [29]. Saline–alkali land development affects regional climate mainly by altering the surface biogeophysical parameters, and thus the surface energy balance and heat distribution, thereby affecting local surface temperature and humidity. Our previous studies have documented that saline–alkali improvements can cool the air temperature during the growing season in western Jilin, by using a high-resolution regional climate model [4]. Land surface temperature is the most direct way showing the climate impact from land cover changes, which can be well captured by the remote sensing observations [30,31,32]. Through a multiscale evaluation of the effect of rice cultivation in saline–alkali land on surface temperature, we found that rice cultivation in saline–alkali land can significantly reduce the surface temperature in the growing season, which is consistent with previous research results [4]. On the one hand, rice cultivation in saline–alkali land will reduce the surface albedo, which will produce a warming effect by reducing reflected solar radiation, and absorb more solar radiation, which will increase the surface temperature. On the other hand, rice cultivation in saline–alkali land significantly increased leaf area index (LAI), vegetation coverage and soil moisture, which enhanced surface evapotranspiration, resulting in a cooling effect [33,34,35,36]. At the same time, the changes in surface vegetation and soil moisture by rice cultivation in saline–alkali land were different at different stages of the growing season, which led to different surface temperature responses across months. At the beginning of the growing season, the albedo of paddy fields was low due to the influence of irrigation at the beginning of rice planting; this partially offset the cooling effect caused by the increase in evapotranspiration due to rice cultivation in saline–alkali land, and as a result, the cooling effect of surface temperature in June was the weakest. With the increase of vegetation coverage, vegetation greening and leaf area index reach their peaks in July and August in the middle of the growing season, when the evapotranspiration is the strongest, so that more surface heat is released in the form of latent heat, leading to a significant drop in surface temperature. On a daily scale, the crop photosynthesis and plant transpiration are vigorous when the air temperature is higher at midday, when most of the energy was redistributed into latent heat rather than sensible heat, bringing significant cooling effects. The heat partitioning between latent heat and sensible heat determined daytime LST responses variations to land cover changes. At night, the high heat capacity of water from paddy fields retained the heat and warmed the surface. These two processes explained the diurnal surface temperature responses to saline–alkali greening, which was consistent with Yu et al. [37].

4.2. Uncertainty Analysis of Remote-Sensing Multiscale Assessment of the Impact of Rice Cultivation in Saline–Alkali Land on Surface Temperature

At the regional scale, this study uses MDOIS and Landsat 8-TIR satellite imagery as the main data source to extract the surface temperature of saline–alkali land and paddy fields, and analyze the effect of rice cultivation in saline–alkali land on the surface temperature. Considering the characteristics of climate change throughout the year and the availability of data, satellite image data are beneficial in obtaining long-term series of surface temperatures [38]. With a high spatial resolution, Landsat8-TIR remote sensing image data has a long revisit cycle, limiting its capacity and application in describing the diurnal surface temperature cycles. It is difficult to explore the surface temperature on a fine time scale, e.g., day by day. However, although with coarse resolution, the MODIS has a higher revisit frequency, and can visit the same place for four times in one day, being able to capture the daytime and nighttime LST properties. Furthermore, the emergence of UAV technology can solve the problems of satellite remote sensing in terms of image resolution, revisit period, cloud cover and high cost. At the same time, it has the advantages of low cost and fast image-acquisition speed, and it can rapidly obtain super-high resolution remote-sensing images in a certain key research area [39], which provides more possibilities for studying the intraday variation of surface temperature [40].
However, there are still some uncertainties. For example, the overpass time of the Landsat satellite in the study area is about 10:30. The average surface temperature difference between saline–alkali land and paddy fields in July from Landsat is 5.6 °C; at the same time, the surface temperature difference between the saline–alkali land and the paddy fields from MODIS was 2.67 °C. At 10:52 in July, the surface temperature difference between saline–alkali land and paddy fields derived from a drone is 6.88 °C. All these results confirmed the cooling effects of saline–alkali greening. The mixed pixel from the coarse resolution of satellite images, different LST deriving approaches, emissivity and inconsistent observation time can contribute to the LST impact differences. Specifically, the MODIS products use a split-window algorithm to extract the surface temperature, which uses the emissivity from band 31 and band 32. The SMW algorithm used to derive the Landsat LST uses the ASTER emissivity modified by a vegetation adjustment suggested by Carlson and Ripley (1997) [41]. Meanwhile, for UAVs, a radiometric thermal camera measures the temperature of a surface by interpreting the intensity of an infrared signal reaching the camera, with the emissivity ranges from 0.92 to 0.98.
Taking into account the inconsistency of the above conditions, future research will require the development of an integrated satellite–UAV field monitoring system to monitor surface temperature variations between different land cover types. The cross evaluation between satellite, UAV and field measurements are also required. In addition, the surface temperature has diurnal variation characteristics, and it is not comprehensive enough to represent the daily average or monthly average surface temperature only based on the surface temperature of the Landsat (UAV) overpass time. Therefore, in future research, it is necessary to increase ground observation experiments. Only by calibrating satellite and UAV observations to corresponding time scales can the impact of land use change on surface temperature be more accurately assessed.

5. Conclusions

In this study, the time-series remote-sensing data and UAV observation data were used as data sources, and the space-for-time approach was used to evaluate the impact of saline–alkali land greening on surface temperature at different temporal and spatial scales. From the annual surface temperature patterns across saline–alkali land and paddy fields, we found that the surface temperature of saline–alkali land in the crop growing season is significantly higher than that of paddy fields, especially in July and August in the middle of the growing season, followed by May–June in the early growing season and September at the end of the growing season. Our results also highlighted that saline–alkali greening can cool the surface temperature mainly through decreasing daytime rather than nighttime surface temperature, especially for the growing season. By using drones to observe the surface temperature across saline–alkali land and paddy fields during three time periods within a day, we found that the surface temperature of saline–alkali land in the three time periods was higher than that of the paddy fields. Rice cultivation in saline–alkali land will reduce the surface albedo and increase the surface net radiation, and the trade-off relationship between the two determines the seasonal difference of surface temperature response in saline-–alkali land. At the same time, the daily cycle of crop evapotranspiration and the thermal insulation effect of paddy fields at night are the main reasons for the intraday difference in surface temperature between saline–alkali land and paddy fields. Based on the multiscale evaluation of the impact of rice cultivation in saline–alkali land on surface temperature, this study would provide support for decision-making in mitigating climate change and ensuring food security for the policy makers.

Author Contributions

Conceptualization, L.Y.; Investigation, B.X.; methodology, T.L.; software, T.L.; Visualization, G.L.; validation, B.X. and Y.J.; writing—original draft preparation, B.X.; writing—review and editing, L.Y., T.L. and Y.J.; Resources, S.Z. and Z.L.; project administration, L.Y. All authors have read and agreed to the published version of the manuscript.

Funding

This study was supported by the National Natural Science Foundation of China (42071025), the Science and Technology Project for Black Soil Granary (XDA28080500), Innovation Team Project of Northeast Institute of Geography and Agroecology, Chinese Academy of Science (2022CXTD02).

Data Availability Statement

Land use types and surface temperatures from Landsat 8 Land Imager (OLI) and Thermal Infrared Sensor (TIRS), downloaded from Remote Sensing Cloud Leveling (https://code.earthengine.google.com/). (accessed on 5 March 2022). Surface temperature extraction code from (https://code.earthengine.google.com/?accept_repo=users/sofiaermida/landsat_smw_lst).

Conflicts of Interest

The authors declare no conflict of interest.

Appendix A

Figure A1. UAV visible light image in the typical area (a) and spatial distribution of saline–alkali land and paddy fields (b).
Remotesensing 14 04246 g0a1

References

  1. FAO. Available online: http://www.fao.org/soils-portal/soil-management (accessed on 5 March 2022).
  2. Wang, Z. Problems of developing rice in the saline-alkali area of songnen plain. Territ. Nat. Resour. Study 1999, 51–52, 237–241. [Google Scholar] [CrossRef]
  3. Liu, T.; Yu, L.; Zhang, S. Land Surface Temperature Response to Irrigated Paddy Field Expansion: A Case Study of Semi-arid Western Jilin Province, China. Sci. Rep. 2019, 9, 5278. [Google Scholar] [CrossRef]
  4. Yu, L.X.; Yang, J.C.; Bu, K.; Liu, T.X.; Jiao, Y.; Li, G.S.; Pu, L.M.; Zhang, S.W. Impacts of Saline-Alkali Land Improvement on Regional Climate: Process, Mechanisms, and Implications. Remote Sens. 2021, 13, 3407. [Google Scholar] [CrossRef]
  5. Cramer, W.; Bondeau, A.; Woodward, F.I.; Prentice, I.C.; Betts, R.A.; Brovkin, V.; Cox, P.M.; Fisher, V.; Foley, J.A.; Friend, A.D.; et al. Global response of terrestrial ecosystem structure and function to CO2 and climate change: Results from six dynamic global vegetation models. Glob. Chang. Biol. 2001, 7, 357–373. [Google Scholar] [CrossRef]
  6. Pielke Sr, R.A.; Marland, G.; Betts, R.A.; Chase, T.N.; Eastman, J.L.; Niles, J.O.; Niyogi, D.D.S.; Running, S.W. The influence of land-use change and landscape dynamics on the climate system: Relevance to climate-change policy beyond the radiative effect of greenhouse gases. Philos. Trans. R. Soc. Lond. Ser. A Math. Phys. 2002, 360, 1705–1719. [Google Scholar] [CrossRef] [PubMed]
  7. Feddema, J.J.; Oleson, K.W.; Bonan, G.B.; Mearns, L.O.; Buja, L.E.; Meehl, G.A.; Washington, W.M.J.S. The importance of land-cover change in simulatingfutureclimates. Science 2005, 310, 1674–1678. [Google Scholar] [CrossRef]
  8. Chen, C.; Park, T.; Wang, X.H.; Piao, S.L.; Xu, B.D.; Chaturvedi, R.K.; Fuchs, R.; Brovkin, V.; Ciais, P.; Fensholt, R.; et al. China and India lead in greening of the world through land-use management. Nat. Sustain. 2019, 2, 122–129. [Google Scholar] [CrossRef]
  9. Peng, S.S.; Piao, S.; Zeng, Z.; Ciais, P.; Zhou, L.; Li, L.Z.; Myneni, R.B.; Yin, Y.; Zeng, H. Afforestation in China cools local land surface temperature. Proc. Natl. Acad. Sci. USA 2014, 111, 2915–2919. [Google Scholar] [CrossRef]
  10. Huang, L.; Zhai, J.; Liu, J.; Sun, C. The moderating or amplifying biophysical effects of afforestation on CO2-induced cooling depend on the local background climate regimes in China. Agric. For. Meteorol. 2018, 260, 193–203. [Google Scholar] [CrossRef]
  11. Zeng, Z.Z.; Piao, S.L.; Li, L.Z.X.; Wang, T.; Ciais, P.; Lian, X.; Yang, Y.T.; Mao, J.F.; Shi, X.Y.; Myneni, R.B. Impact of Earth Greening on the Terrestrial Water Cycle. J. Clim. 2018, 31, 2633–2650. [Google Scholar] [CrossRef]
  12. Zeng, Z.; Piao, S.; Li, L.Z.; Zhou, L.; Ciais, P.; Wang, T.; Li, Y.; Lian, X.; Wood, E.F.; Friedlingstein, P. Climate mitigation from vegetation biophysical feedbacks during the past three decades. Nat. Clim. Chang. 2017, 7, 432–436. [Google Scholar] [CrossRef]
  13. Li, Y.; Piao, S.; Chen, A.; Ciais, P.; Li, L.Z. Local and teleconnected temperature effects of afforestation and vegetation greening in China. Natl. Sci. Rev. 2020, 7, 897–912. [Google Scholar] [CrossRef] [PubMed]
  14. Li, Y.; Piao, S.; Li, L.Z.X.; Chen, A.; Wang, X.; Ciais, P.; Huang, L.; Lian, X.; Peng, S.; Zeng, Z.; et al. Divergent hydrological response to large-scale afforestation and vegetation greening in China. Sci. Adv. 2018, 4, eaar4182. [Google Scholar] [CrossRef]
  15. Yu, L.X.; Xue, Y.K.; Diallo, I. Vegetation greening in China and its effect on summer regional climate. Sci. Bull. 2021, 66, 13–17. [Google Scholar] [CrossRef]
  16. Zhang, Q.; Li, M.Y. Analysis of Dynamic Changes of Saline Alkali Land in Da’an CityBased on GIS and Remote Sensing. Geomat. Spat. Info Rmation Technol. 2019, 42, 65–68+72. [Google Scholar] [CrossRef]
  17. Li, X.Y.; Zhang, S.W. Tempo-Spatial Dynamics and Driving Factors of Saline-Alkali Land in Daan City of Jilin Province. Resour. Sci. 2005, 27, 92–97. [Google Scholar] [CrossRef]
  18. Xiang, Y.B.; Zhang, C.P.; Wu, Z.G.; Fu, C.D. Inversion Study on Chlorophyll a ofShahu Lake Based on Landsat 8 Data. Territ. Nat. Resour. Study 2022, 1, 88–91. [Google Scholar] [CrossRef]
  19. Wan, Z. New refinements and validation of the MODIS land-surface temperature/emissivity products. Remote Sens. Environ. 2008, 112, 59–74. [Google Scholar] [CrossRef]
  20. Cao, B.; Qin, Q.M.; Ma, H.J.; Qiu, Y.F. Research on Spatial Variability of Water Quality Parameter and Their Adequate Sampling Amountin Meiliang Bayouof TaihuLake. Geogr. Geo. Inf. Sci. 2006, 2, 50–54. [Google Scholar] [CrossRef]
  21. Ma, Y.G.; Li, H.; Xia, L. The Model for Extracting Information of Land Use/Land Cover Change; Xinjiang Remote Sensing Center: Urumqi, China, 2006; Volume 5, pp. 50–51+76. [Google Scholar] [CrossRef]
  22. Lu, C.Y.; Wang, Z.M.; Jia, M.M.; Zhang, J.; Man, W.D.; Mao, D.H. Peatland Extraction Based on ENVISAT ASAR, Landsat TM and DEM Data. Geomat. Inf. Sci. Wuhan Univ. 2016, 42, 48. [Google Scholar] [CrossRef]
  23. Duguay-Tetzlaff, A.; Bento, V.A.; Göttsche, F.M.; Stöckli, R.; Martins, J.; Trigo, I.; Olesen, F.; Bojanowski, J.S.; Da Camara, C.; Kunz, H. Meteosat land surface temperature climate data record: Achievable accuracy and potential uncertainties. Remote Sens. 2015, 7, 13139–13156. [Google Scholar] [CrossRef]
  24. Sun, D.; Pinker, R.T.; Basara, J.B. Land surface temperature estimation from the next generation of Geostationary Operational Environmental Satellites: GOES M–Q. J. Appl. Meteorol. Climatol. 2004, 43, 363–372. [Google Scholar] [CrossRef]
  25. Freitas, S.C.; Trigo, I.F.; Macedo, J.; Barroso, C.; Silva, R.; Perdigão, R. Land surface temperature from multiple geostationary satellites. Int. J. Remote Sens. 2013, 34, 3051–3068. [Google Scholar] [CrossRef]
  26. Li, Z.-L.; Tang, B.-H.; Wu, H.; Ren, H.; Yan, G.; Wan, Z.; Trigo, I.F.; Sobrino, J.A. Satellite-derived land surface temperature: Current status and perspectives. Remote Sens. Environ. 2013, 131, 14–37. [Google Scholar] [CrossRef]
  27. Ermida, S.L.; Soares, P.; Mantas, V.; Gottsche, F.M.; Trigo, I.E. Google Earth Engine Open-Source Code for Land Surface Temperature Estimation from the Landsat Series. Remote Sens. 2020, 12, 1471. [Google Scholar] [CrossRef]
  28. Yu, L.X.; Liu, Y.; Liu, T.X.; Yan, F.Q. Impact of recent vegetation greening on temperature and precipitation over China. Agric. For. Meteorol. 2020, 295, 108197. [Google Scholar] [CrossRef]
  29. Zhang, X.; Tang, Q.; Zheng, J.; Ge, Q. Warming/cooling effects of cropland greenness changes during 1982–2006 in the North China Plain. Environ. Res. Lett. 2013, 8, 024038. [Google Scholar] [CrossRef]
  30. Liu, T.X.; Yu, L.X.; Bu, K.; Yang, J.C.; Yan, F.Q.; Zhang, S.W.; Li, G.S.; Jiao, Y.; Liu, S.Z. Thermal and moisture response to land surface changes across different ecosystems over Heilong-Amur River Basin. Sci. Total Environ. 2022, 818, 151799. [Google Scholar] [CrossRef]
  31. Novick, K.A.; Katul, G.G. The duality of reforestation impacts on surface and air temperature. J. Geophys. Res. Biogeosci. 2020, 125, e2019JG005543. [Google Scholar] [CrossRef]
  32. Kelly Turner, V.; Rogers, M.L.; Zhang, Y.; Middel, A.; Schneider, F.A.; Ocón, J.P.; Seeley, M.; Dialesandro, J. More than surface temperature: Mitigating thermal exposure in hyper-local land system. J. Land Use Sci. 2022, 17, 79–99. [Google Scholar] [CrossRef]
  33. Cooley, H.S.; Riley, W.J.; Torn, M.S.; He, Y. Impact of agricultural practice on regional climate in a coupled land surface mesoscale model. J. Geophys. Res. Atmos. 2005, 110, D3. [Google Scholar] [CrossRef]
  34. Yu, L.X.; Liu, T.X.; Zhang, S.W. Temporal and Spatial Changes in Snow Cover and the Corresponding Radiative Forcing Analysis in Siberia from the 1970s to the 2010s. Adv. Meteorol. 2017, 2017, 9517427. [Google Scholar] [CrossRef]
  35. Friedlingstein, P.; Jones, M.; O’Sullivan, M.; Andrew, R.; Hauck, J.; Peters, G.; Peters, W.; Pongratz, J.; Sitch, S.; Le Quéré, C. Global Carbon Budget 2019. Earth Syst. Sci. Data 2019, 11, 1783–1838. [Google Scholar] [CrossRef]
  36. Shen, M.; Piao, S.; Jeong, S.J.; Zhou, L.; Zeng, Z.; Ciais, P.; Chen, D.; Huang, M.; Jin, C.S.; Li, L.Z.; et al. Evaporative cooling over the Tibetan Plateau induced by vegetation growth. Proc. Natl. Acad. Sci. USA 2015, 112, 9299–9304. [Google Scholar] [CrossRef]
  37. Yu, L.X.; Liu, Y.; Yang, J.C.; Liu, T.X.; Bu, K.; Li, G.S.; Jiao, Y.; Zhang, S.W. Asymmetric daytime and nighttime surface temperature feedback induced by crop greening across Northeast China. Agric. Forest Meteorol. 2022, 325, 109136. [Google Scholar] [CrossRef]
  38. Yang, C.B. The Effect of the Urban Spatial Structure on the Spatio-Temperal Patterns of the Urban Thermal Environment. Ph.D. Thesis, Northeast Institute of Geography and Agroecology Chinese Academy of Sciences, Changchun, China, 2018. [Google Scholar]
  39. Kuai, Y.; Wang, B.; Wu, Y.L.; Chen, X.D.; Xue, W.B. Urban Vegetation Classification based on Multi-scale Feature Perception Network forUAV Images. J. Geo-Inf. Sci. 2022, 24, 962–980. [Google Scholar] [CrossRef]
  40. Tian, H.H.; Feng, L.; Zhao, M.M.; Guo, S.; Dong, J. Analysis of Meticulous Features of Urban Surban Surban Surface Temperaturebased on UAV Thermal Thermography. Remote Sens. Technol. Appl. 2019, 34, 553–563. [Google Scholar] [CrossRef]
  41. Carlson, T.N.; Ripley, D.A. On the relation between NDVI, fractional vegetation cover, and leaf area index. Remote Sens. Environ. 1997, 62, 241–252. [Google Scholar] [CrossRef]
Figure 1. Geographical location of Da’an City in western Jilin Province (The red star represents the location where the UAV field survey was conducted).
Remotesensing 14 04246 g001
Figure 2. The study framework for investigating the multisource surface temperature impact due to saline–alkali land greening.
Remotesensing 14 04246 g002
Figure 3. 2015 (a) and 2021 (b) land use map of Da’an City, 2015 to 2021 (c) land use change pattern map.
Remotesensing 14 04246 g003
Figure 4. Spatial distribution of surface temperature in saline–alkali land and paddy fields in Da’an City, western Jilin Province.
Remotesensing 14 04246 g004
Figure 5. Seasonal variation of surface temperature (°C) in saline–alkali land (a) and paddy fields (b) in Da’an City, western Jilin. The error bars in the figure represent the standard deviation.
Remotesensing 14 04246 g005
Figure 6. Diurnal variation of monthly mean surface temperature (°C) for saline–alkali land and paddy fields in Da’an City, western Jilin Province from 2015 to 2021.
Remotesensing 14 04246 g006
Figure 7. UAV visible-light images of saline–alkali land and paddy fields in the experiment field of Da’an City, western Jilin Province: (a) the spatial distribution of UAV surface temperature at morning, (b) noon (c) and evening (d).
Remotesensing 14 04246 g007
Figure 8. Statistical analysis of average surface temperature in saline–alkali land and paddy fields during the day. The error bars in the figure represent the standard deviation.
Remotesensing 14 04246 g008
Table 1. The Landsat 8 images required for the study area and the overpass time for the acquired images.
SensorLandsat 8 OLI/TIR
Track NumberOverpass Time
120/028
(029)
7 April 2013, 30 August 2014, 14 June 2015, 12 March 2016, 20 September 2016, 21 July 2017,
12 October 2018, 13 November 2018, 16 January 2019, 4 February 2020, 4 December 2020, 13 May 2021
Note: The images underlined in the table are also used for the extraction of land use data.
Table 2. Seasonal surface temperature difference (°C) between saline–alkali land and paddy fields in the growing season.
NameMayJuneJulyAugustSeptemberOctober
Saline–Alkali Land LST28.3033.9733.9534.2227.2420.15
Paddy Field LST23.7131.8328.3529.3623.6918.54
temperature difference 4.592.155.604.863.551.61
Table 3. Day-and-night surface temperature difference (°C) between saline–alkali land and paddy fields in the growing season.
TIMEJanuaryFebruaryMarchAprilMayJuneJulyAugustSeptemberOctoberNovemberDecemberThe Annual AverageGrowing Season Average
Surface temperature difference between saline–alkali land and paddy fields (°C)
10:30 a.m.−0.070.300.040.061.251.962.912.671.350.340.36−0.050.931.75
13:30 p.m.−0.11−0.08−0.170.000.991.833.092.761.640.250.26−0.430.841.76
1:30 a.m.0.380.440.15−0.37−1.54−1.33−0.270.080.10−0.070.030.36−0.17−0.51
22:30 p.m.0.380.220.24−0.23−1.50−1.54−0.410.13−0.10−0.160.290.42−0.19−0.60
Average temperature difference during the day−0.090.11−0.060.031.121.893.002.721.490.300.31−0.240.881.75
Average temperature difference at night0.380.330.19−0.30−1.52−1.43−0.340.100.00−0.110.160.39−0.18−0.55
Average daily temperature difference0.140.220.06−0.14−0.200.231.331.410.750.090.240.070.350.60
Table 4. The daytime surface temperature difference (°C) between saline–alkali land and paddy fields.
Name07:5210:5418:29
Saline–alkali land LST23.4128.6823.68
Paddy field LST21.0421.8118.22
Temperature difference2.376.885.45
Publisher’s Note: MDPI stays neutral with regard to jurisdictional claims in published maps and institutional affiliations.

