Communication

Analysis of Regional and Residual Gravity Disturbance of Major Fault Belts in the Tarim Basin, Western China

1
Key Laboratory of Geological Survey and Evaluation of Ministry of Education, China University of Geosciences, Wuhan 430071, China
2
School of Geography and Information Engineering, China University of Geosciences, Wuhan 430071, China
3
State Key Laboratory of Information Engineering in Surveying, Mapping and Remote Sensing, Wuhan University, Wuhan 430071, China
4
Institute of Geomechanics, Chinese Academy of Geological Sciences, Beijing 100081, China
5
Key Laboratory of Paleomagnetism and Tectonic Reconstruction, The Ministry of Land and Resources, Beijing 100081, China
*
Author to whom correspondence should be addressed.
Remote Sens. 2022, 14(16), 3948; https://doi.org/10.3390/rs14163948
Submission received: 13 July 2022 / Revised: 10 August 2022 / Accepted: 11 August 2022 / Published: 14 August 2022

Abstract

:
Large fault belts often influence the paleo-geomorphic changes in basins and control hydrocarbon accumulation and distribution in basins. Based on the gravity field model European Improved Gravity model of the Earth via New techniques (EIGEN)-6C4, this study calculated the residual Bouguer gravity disturbance of the Tarim Basin by using the minimum curvature method and analyzed gravitational characteristics of major fault belts of the Tarim Basin. The residual Bouguer disturbance exhibits linear residual Bouguer disturbance zones in the Tianshan Mountains, West Kunlun, and the Altyn region, which is consistent with the spatial distribution of their related fault belts. The regional Bouguer disturbance is related to crust–mantle boundary depth, which can be used to roughly estimate crust thickness. Thus, we suggest that the crust–mantle boundary depth order of major faults from deep to shallow is the Altyn region, West Kunlun, and Tianshan Mountains. There is a discontinuity in the residual Bouguer disturbance of West Kunlun, which compares well with the fault belt of West Kunlun. Furthermore, the residual Bouguer disturbance of the Tarim Basin has a series of elliptical areas with a central positive disturbance located within the Bachu uplift and other uplift structures. The residual Bouguer disturbance also reflects the position and distribution of the major fault belts and the boundary of the Tarim Basin, which can provide guidance for dynamic evolution analysis of large basins.

1. Introduction

The Tarim Basin is the largest basin in China. Its large-scale fault belts can affect the changes in uplift and depression patterns of the basin and control migration and accumulation of oil and gas in the basin [1,2,3]. Most fault belts of the Tarim Basin are related to multiple stages of tectonic deformation. The collision of the Indian plate and Eurasian plate caused a large-scale intercontinental deformation [4], particularly in Central Asia and Southeast Asia where continuous convergence and tectonic escape occurred [5,6,7]. Spatially, the Tarim Basin is regarded as a stable block placed between two conjugate Coulomb faults, one is the north dextral Tianshan fault, and another is the south sinistral Altyn fault [8,9,10]. These faults have undergone a long orogenic evolution, as basin tectonic activity rates [11,12], distribution characteristics of large fault belts [13,14,15], and simulation of geodynamic processes in the Tarim Basin [16,17,18] are dependent on basin structural analysis based on seismic data [17,19,20,21,22]. However, only limited attention has been paid to studying the geological tectonics of the Tarim Basin using gravity data [23,24].
Because of the space limitations of traditional seismic observations and ground gravity observations, previous studies were unable to conduct fault structural analysis of the Tarim Basin. Satellite gravity measurement can cover a wider and more complete range compared with traditional ground observation methods, and it can derive gravity data and models to cover the entire Tarim Basin. Faults may destroy structural continuities of a geological body, thereby causing a lateral difference in density, which provides a possibility for using gravity data to identify major faults in the Tarim Basin. In this study, we used the recent gravity field model EIGEN-6C4 [25] to study the gravity disturbance of the Tarim Basin.
Observed gravity data are a superposition of gravity anomalies generated by density bodies at different depths. Gravity separation methods are a key technique to separate gravity fields (e.g., [26,27,28]) and improve gravity interpretation. At present, the commonly used separation methods include the minimum curvature method [28,29], wavelet transform, and spectrum analysis [26,27,30]. This study adopts the minimum curvature method proposed by Briggs [31]. This method has the advantages of smooth separation and small error [28], and it is suitable for the identification of basin structures [29]. The algorithm has already shown practical applications for identifying the extent and boundary of basins and distributions of large-scale faults [29,32,33,34].
In this study, we analyzed gravity characteristics of major faults of the Tarim Basin and combine plate movement to further understand the faults and structural divisions of the Tarim Basin. We arranged the paper in this way: In Section 2, we introduce a geological overview of the Tarim Basin including the study area and major fault distribution, gravitational data process, and gravity separation method. In Section 3, we analyze and explain the distribution features of residual and regional gravity disturbance of the Tarim Basin produced by using the gravity separation method. Furthermore, in Section 4, we analyze the residual gravity fields of major fault belts and terrain uplifts of the Tarim Basin in an effort to explain their geological background and formation mode by combining fault distribution and plate movement in this area. Finally, we draw a conclusion in Section 5.

2. Data and Method

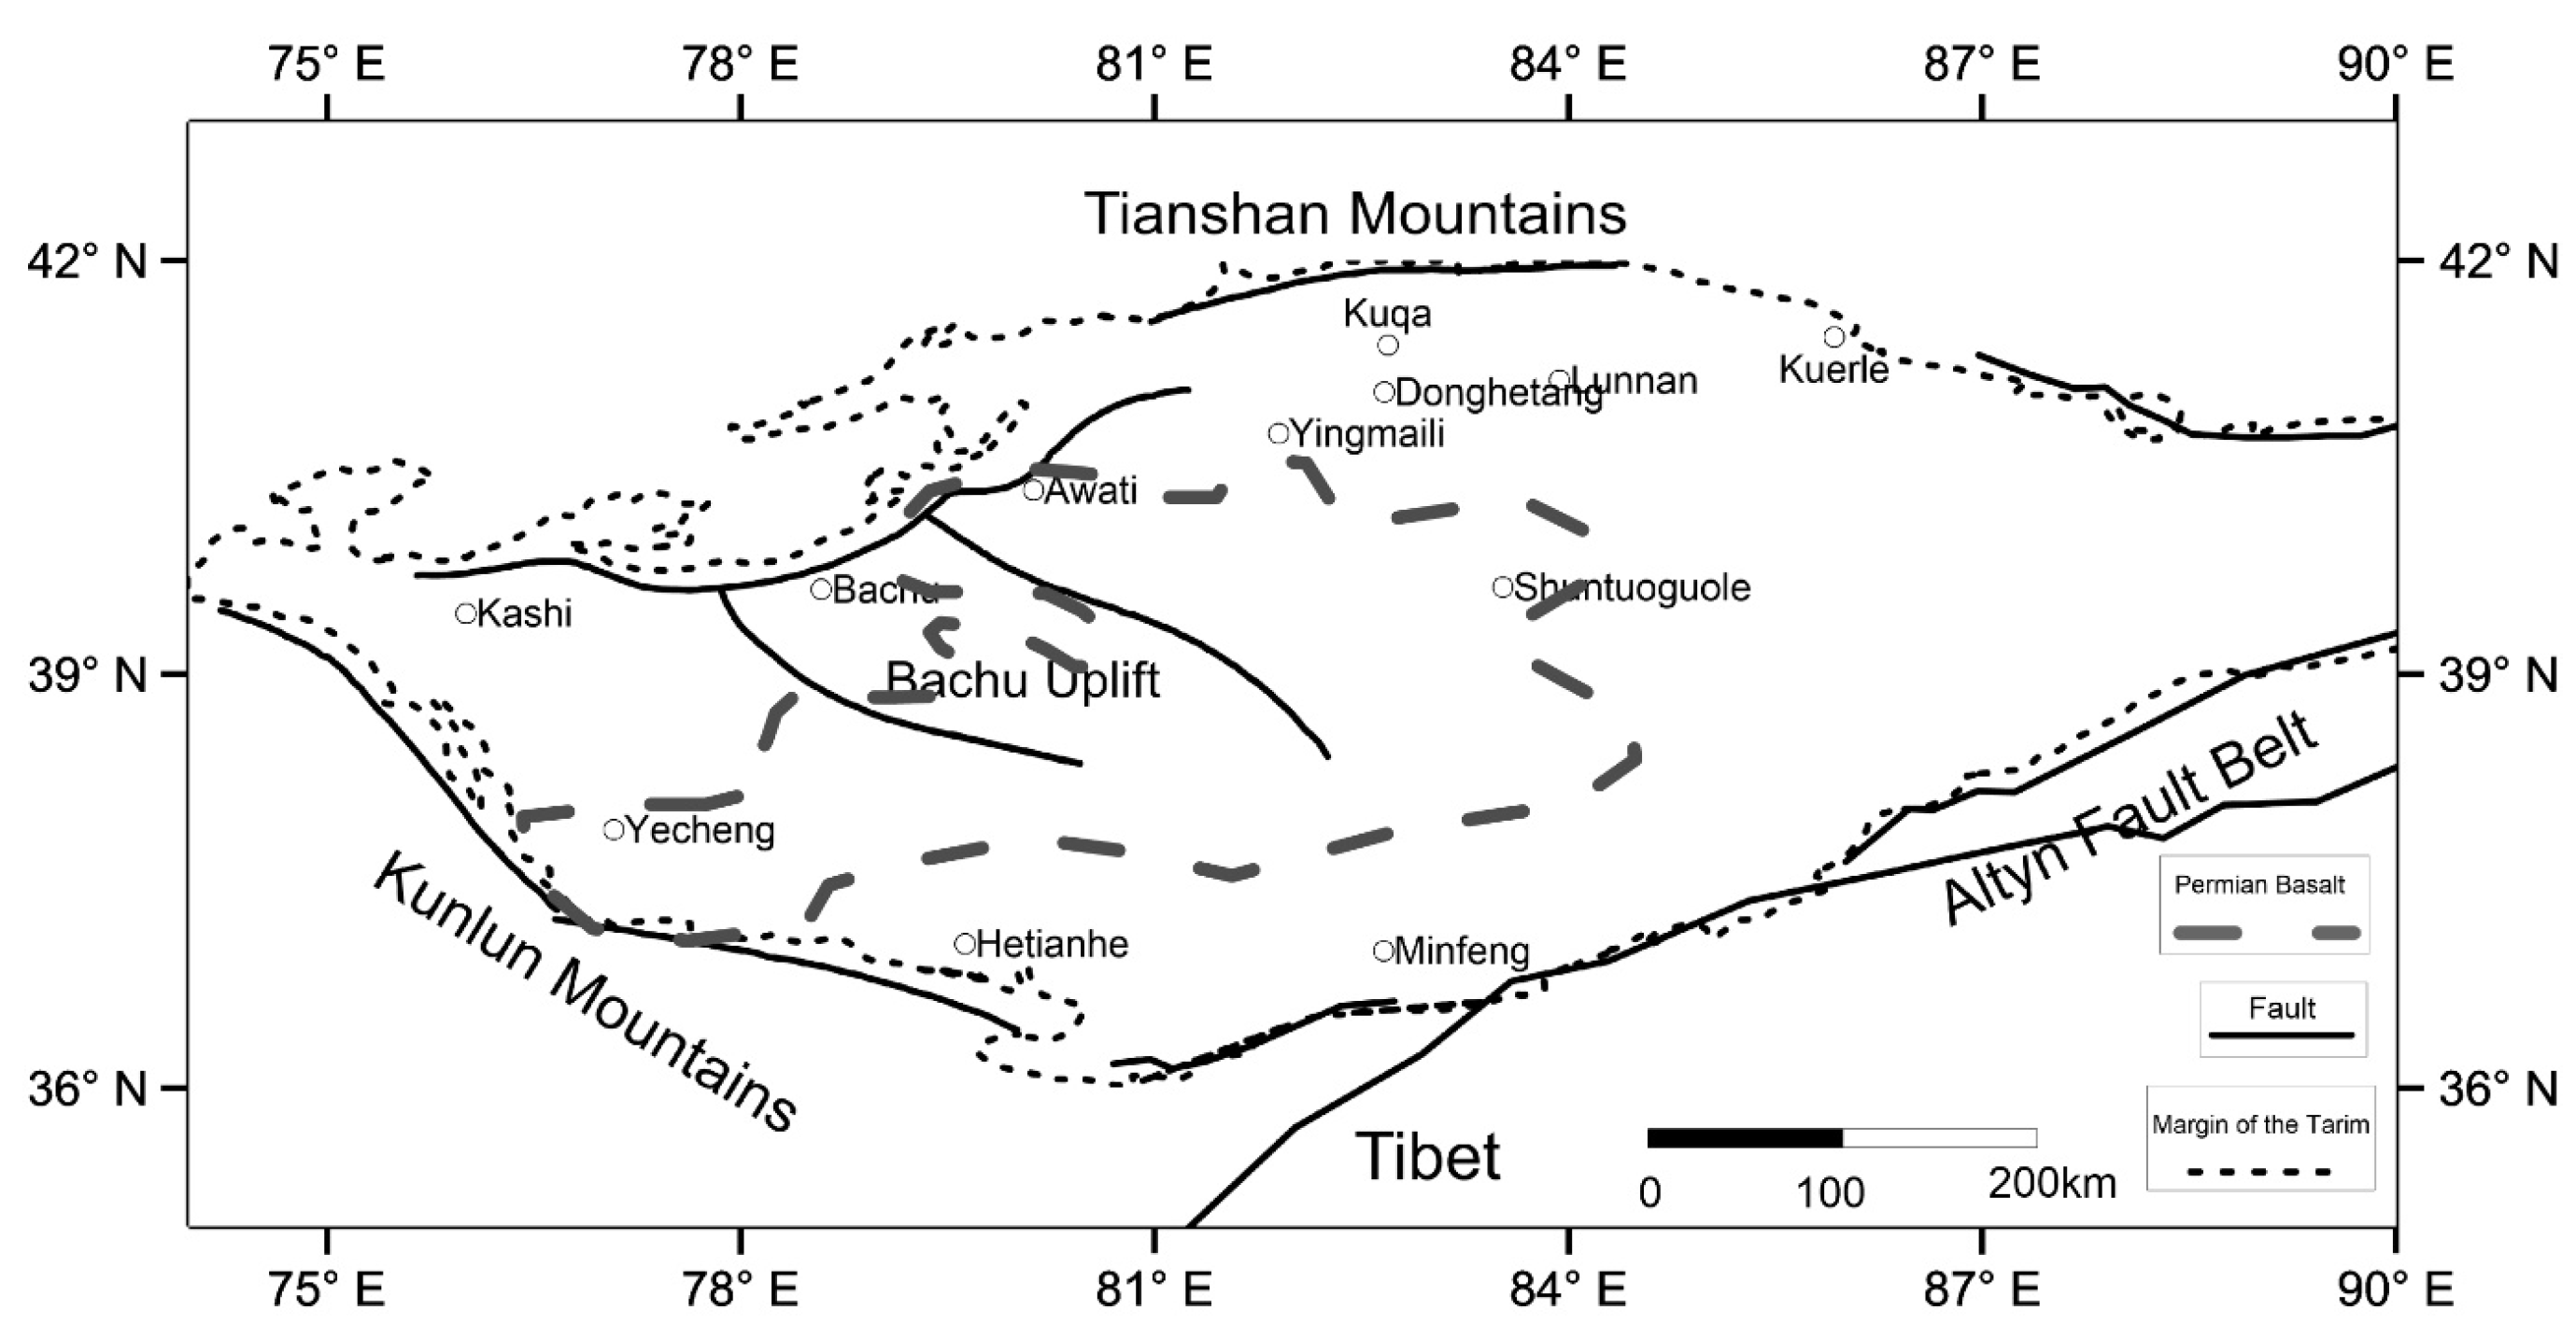
2.1. Geological Overview of the Tarim Basin

The Tarim Basin is located in northwestern China (37°–42°N), with an altitude range of approximately 800–1300 m and an area of nearly 560,000 km2 (Figure 1). The basin is in a rhombus shape, surrounded by the Tianshan orogenic belt in the north and west, the Kunlun orogenic belt in the southwest, and the Altyn orogenic belt in the southeast. It is a typical superimposed basin and the largest basin in China. The Tarim Basin has a typical double-layer structure consisting of a Precambrian basement (pre-Neoproterozoic) and a Late Neoproterozoic to Cambrian overburden [35], and it is suggested as a fragment of the Rodinian supercontinent [36]. Currently, the main body of the Tarim Basin is covered by the Taklamakan Desert, with outcrops of formations from the Precambrian, Paleozoic, Mesozoic, and Cenozoic eras at its margins [16].
The multiple tectonic activities in the peripheral orogenic belt have caused some fault belts related to the South Tianshan, West Kunlun, and Altyn orogenic belts in the Tarim Basin [14]. The crusts on both sides of these faults are subducted under upper orogenic belts due to structural compression, causing many orogenic belts to uplift rapidly. The changes in uplift and depression patterns of the basin have undergone some multi-phase activity, superimposed transformation, and large-scale fault belt transformation [1,2,3,37,38,39]. These faults control the basin’s subsidence and deposition, uplift and denudation, and formation of local structures, which cause crustal density redistribution and likely reflect in gravity disturbance. A Late Mesozoic–Cenozoic alkali basalt layer extends from Kyrgyzstan and the southwestern Tianshan Mountains [40] to northwest Tarim [41]. There is one largest uplift, Bachu uplift, in the northwestern Tarim Basin. The current Bachu uplift is a large backthrust structure, bounded by thrust faults and strike-slip faults on both sides [39,42]. The gravity disturbance of this uplift structure is usually high due to the bulge of mantle material.

2.2. Data

The gravity data of the Tarim Basin used in this study were extracted from the gravity model EIGEN-6C4. The EIGEN-6C4 combines the Gravity Recovery And Climate Experiment (GRACE), Gravity field, and steady-state Ocean Circulation Explorer (GOCE) satellite data, ground data, Danish Technical University 10 (DTU10) [43], and Earth Gravitational Model 2008 (EGM2008) [44] available up to degree and order of 2190 [25]. The data were downloaded from the ICGEM website at a resolution of 0.2° and a height of 50 km above the GRS80 ellipsoid. Figure 2 shows the gravity disturbance distribution in the Tarim area.
First, the gravity disturbance (Figure 2a) is a result of removing the scalar gravity of the ellipsoidal reference earth (normal earth) from the original gravity data. However, the Bouguer effect and terrain effect remain in the gravity disturbance. Etopo1 data as shown in Figure 2b (Amante and Eakins, 2009) was used to calculate these effects using a density of 2670 kg/m3 for the continental crust and a radius of 160 km for topography integration. By subtracting the topography effect (Figure 2c) from the gravity disturbance, the Bouguer disturbance can be obtained (Figure 2d). The gravity disturbance and Bouguer disturbance derived from EIGEN-6C4 and ETOPO1 data are available at http://icgem.gfz-potsdam.de/home (accessed on 13 July 2002). The total gravity effect of the sediments (Figure 2e) is removed from the Bouguer disturbance to produce the Bouguer disturbance corrected from sediments (Figure 2f).
A large-scale sedimentary basin needs to eliminate gravity effect from sediments. Because the density of the sedimentary layer in the study area is less than crust average density, that causes overcompensation in Bouguer correction. In response to this problem, the CRUST1.0 sediment model [46] was employed to calculate the gravity effect of sedimentary layers at different depths (Figure 2e). The Bouguer disturbance shown in Figure 2f is a result of the Bouguer disturbance of the Tarim Basin minus the gravity effect of the sedimentary layer.

2.3. Method

Over the years, researchers have developed different potential field separation methods for basin structural analysis. This study adopts the minimum curvature method proposed by Briggs [31]. This method has the advantages of smooth separation and small error, and it is suitable for the identification of basin structures. Mickus et al. [29] used the minimum curvature algorithm to separate Bouguer gravity data in the Virginia area of the eastern United States and effectively identified the extent of the Richmond Basin (Mickus et al. [29]). Since then, some researchers have used the minimum curvature algorithm to investigate basin boundary division and structural unit feature [32,33,34], further verifying that the method can effectively identify fault feature distributions and basin tectonics. This study adopts the basic difference iteration formula of the 2D minimum curvature method [28] as follows:
u ( s , t ) = α 0 { [ u ( s + 2 , t ) + u ( s 2 , t ) ] + α 1 [ u ( s , t + 2 ) + u ( s , t 2 ) ] + α 2 [ u ( s + 1 , t + 1 ) + u ( s + 1 , t 1 ) + u ( s 1 , t + 1 ) + u ( s 1 , t 1 ) ] + α 3 [ u ( s + 1 , t ) + u ( s 1 , t ) ] + α 4 [ u ( s , t + 1 ) + u ( s , t 1 ) ] }
s = 1 ,   2 ,   ,   M ;   t = 1 ,   2 ,   ,   N
α = Δ x Δ y ,   α 0 = 1 2 ( 3 + 4 α 2 + 3 α 4 ) ,   α 1 = α 4 ,   α 2 = 2 α 2 ,   α 3 = 4 ( 1 + α 2 ) ,   α 4 = 4 ( 1 + α 2 ) α 2
where Δ x and Δ y are the node distances in the x and y directions, respectively; M and N are the number of nodes in the x and y directions, respectively; s and t are the serial numbers in the x and y directions, respectively; and u ( s , t ) is the potential field value of the t-th node on the s-th column.
If l x = l × Δ x and l y = l × Δ y are used to represent the iteration step size, and the average of all iteration results from the iteration step size of 1 to L are used as the smoothing result, then there are:
u ( k ) ( s Δ x , t Δ y ) = 1 L l = 1 L u ( l ) ( k ) ( s Δ x , t Δ y ) = α 0 L l = 1 L { [ u ( l ) ( k 1 ) ( s Δ x + 2 l x , t Δ y ) + u ( l ) ( k 1 ) ( s Δ x 2 l x , t Δ y ) ] + α 1 [ u ( l ) ( k 1 ) ( s Δ x , t Δ y + 2 l y ) + u ( l ) ( k 1 ) ( s Δ x , t Δ y 2 l y ) ] + α 2 [ u ( l ) ( k 1 ) ( s Δ x + l x , t Δ y + l y ) + u ( l ) ( k 1 ) ( s Δ x + l x , t Δ y l y ) + u ( l ) ( k 1 ) ( s Δ x l x , t Δ y + l y ) + u ( l ) ( k 1 ) ( s Δ x l x , t Δ y l y ) ] + α 3 [ u ( l ) ( k 1 ) ( s Δ x + l x , t Δ y ) + u ( l ) ( k 1 ) ( s Δ x l x , t Δ y ) ] + α 4 [ u ( l ) ( k 1 ) ( s Δ x , t Δ y + l y ) + u ( l ) ( k 1 ) ( s Δ x , t Δ y l y ) ] }
Equation (2) is called an iteration format with an iteration step length of L (the maximum iteration step length). Among them, u ( k ) ( s Δ x , t Δ y ) and u ( k 1 ) ( s Δ x , t Δ y ) , represent the step size as l x = l × Δ x and l y = l × Δ y in the kth and k-1th iteration results, respectively. Then, the non-in situ iteration format uses the k-1th iteration value u ( k 1 ) ( s Δ x , t Δ y ) to calculate the kth iteration value u ( k ) ( s Δ x , t Δ y ) .
We designed a test model to validate the function of the minimum curvature algorithm in the Annex. This test model is a forward mesh model that can roughly simulate the subsurface structure of the Tarim Basin by considering similar gravity data resolution and crust–mantle boundary depth. The detailed parameters and test process of the model are discussed in the Annex. We examined the residual gravity field and regional gravity field of the test model in an effort to determine their mode of formation. Our test results indicated density difference in the margin of a lithosphere scale near-70 km depth density body can produce two linear residual gravity anomalies (5–9 mGal) while a small-scale near-surface density body can produce an elliptic residual gravity anomaly (over 10 mGal). However, residual anomalies generated by different density bodies can superimpose and interfere with each other. The residual gravity anomalies generated from a shallow density body can make a small bias in anomaly distribution of the margin of a deep density body. Even so, we can still evaluate subsurface density structure through the trend of linear residual anomaly zones.

3. Results

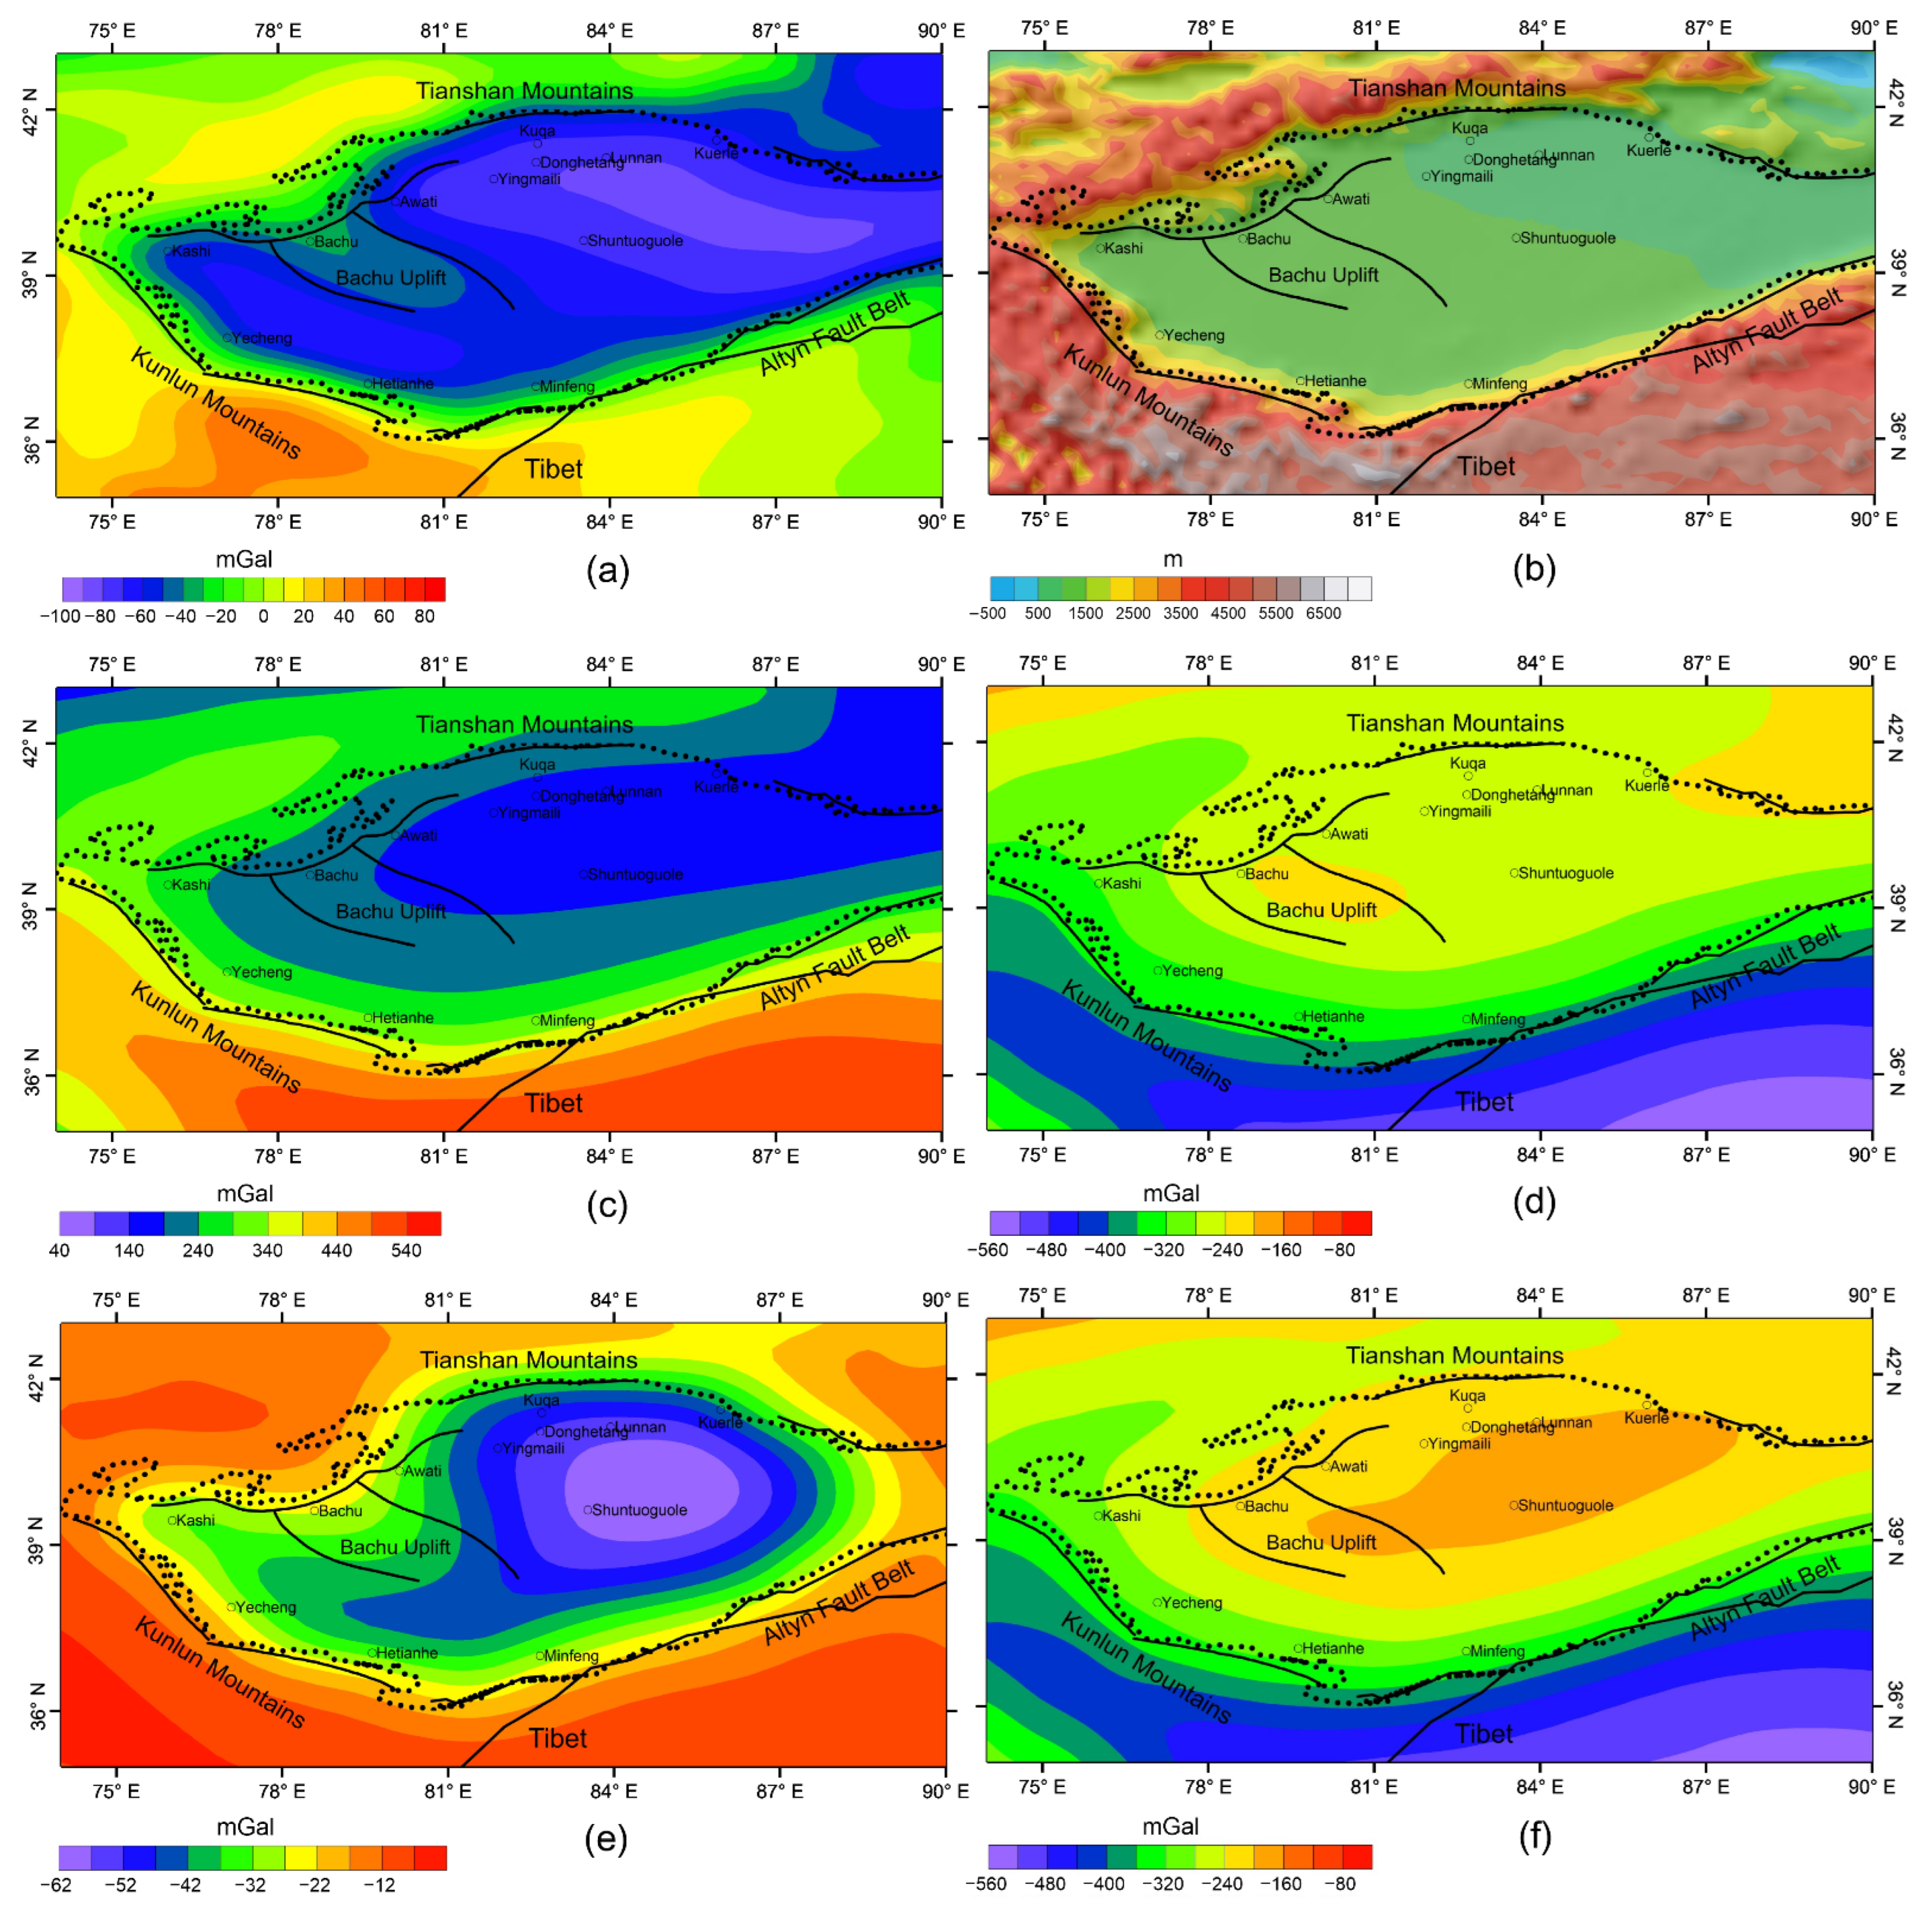
3.1. Bouguer Disturbance after Separation

In order to analyze basin structure, we separated the Bouguer disturbance of the Tarim Basin (Figure 2d) to obtain regional disturbance and residual disturbance (Figure 3) by using the minimum curvature algorithm. This separation process is calculated in a spherical coordinate system. After subtracting the smooth field value (the regional Bouguer gravity field) from the initial Bouguer gravity field, we obtained the residual Bouguer gravity field. In general, the regional disturbances are produced from a deep structure with large scale, and residual disturbances are produced from a shallow structure and are of small scale. These phenomena can be used to explain the regional disturbance and residual disturbance in the Tarim Basin.
Firstly, the regional disturbance in the Tarim Basin and the Bouguer disturbance have small numerical differences, and both are negative, with a disturbance range from −400 to −200 mGal (Figure 3). The regional disturbance is an elliptical shape, and its long axis direction is ENE. The regional disturbance of the Tarim Basin appears as a relatively high value in the middle and low value in the margin. The overall appearance of the regional disturbance is a wide and gentle disturbance zone, but it appears as a continuous tight gradient zone near the Kunlun orogenic belt and Altyn fault zone. In addition, an elliptical area with a high disturbance value appears in the Bachu uplift area.
Secondly, the Bouguer residual disturbance in the Tarim Basin shows more complex anomalous characteristics. There are two obvious linear positive and negative disturbance zones along the Kunlun Mountains and the Altyn fault zone, both of which are consistent with the outline of these faults. However, in the Tianshan Mountains, there are no obvious linear disturbance zones. An obvious high-value area from the residual disturbance in the basin is located in the Bachu uplift area, which is an elliptical shape, and its long axis direction is WNW.

3.2. Bouguer Disturbance Corrected from Sediment after Separation

The sediment thickness in the basin is more than 10 km, and the excessive compensation caused by low-density sediments cannot be ignored. The minimum curvature algorithm was used to separate the Bouguer disturbance corrected from sediment (Figure 2f), and the regional disturbance and residual disturbance corrected from sediment were obtained (Figure 4). By comparing the separation results before and after correction, we can observe and identify their differences.
As shown in Figure 4, in the Tarim Basin, the corrected regional disturbance increased significantly. Some changes have also taken place in the residual disturbance corrected from sediment. The two linear residual disturbance zones on both sides of the Tianshan Mountains fault belt changed from discontinuous in pre-correction to continuous in post-correction, while the residual disturbance of the Kunlun Mountains and Altyn fault have no obvious changes. The Bachu uplift still shows a high residual disturbance in the basin. Except for the Bachu uplift, other uplifts, including the Tanan, Tabei, Tadong, and Kuluketage uplifts also have a positive high residual disturbance.

4. Discussion

4.1. Tianshan Orogen

The ETOPO1 map (Figure 2b) shows that elevation decreases rapidly from several kilometers of the Tianshan Mountains to several hundred meters of the Tarim Basin. The related regional gravity disturbance (Figure 3a and Figure 4a) appears a wide and gentle gravity gradient zone of 20 mGal/degree, on which there is no mirror image relationship between the Bouguer gravity disturbance and the terrain. The Tianshan Mountains appear a large negative value (−320–−200 mGal) of Bouguer gravity disturbance, which is attributable to a lack of subsurface mass. Contrary to the Tianshan Mountains, the gravity disturbances of the West Kunlun and Altyn Mountains have greater negative values (−440–−320 mGal), indicating that the low-density crust is thicker in the West Kunlun and Altyn Mountains and the crust–mantle boundary is shallower in the Tianshan Mountains [23].
The regional Bouguer disturbance of the Tianshan Mountains is 40 mGal lower than that in the Tarim Block and its surrounding areas, indicating the crust of the Tianshan Mountains is thicker than the surrounding area [47]. As indicated from our model test (Annex), a 10 km thickness density body placed at 70 km depth with 0.45 kg/m3 of density (0.45 kg/m3 is an assumptive density difference between crust and mantle) can produce over 100 mGal regional Bouguer disturbance. This implies that 40 mGal of disturbance difference is resulted by the crust–mantle boundary of the Tianshan Mountains having a smaller relief than 10 km or its depth being deeper than 70 km. A tectonic-structural model derived by seismic precise measurement proved that the crust–mantle boundary of the Tianshan Mountains has a near 7 km high relief [17]. The evolution of the regional gravity field of the Tianshan Mountains is related to the northward drift and rotation of the Tarim Block, especially occurring in the active earthquake belts of the block [48]. Previous seismological evidence shows that a part of the Tarim lithosphere is subducted under the Paleozoic Tianshan Mountains [17,47], and the Tianshan Mountains suffer different stress at the northern margin of the Tarim Block [14,18].
The Tianshan Mountains extend from eastern Xinjiang to Uzbekistan via Kyrgyzstan and extend from east to west with a maximum altitude of 7439 m and an extension of more than 2500 km. Some research on the timescale, event sequence, active lithospheric structural geometry, and intracontinental orogeny of this mountain range in geological and geophysical surveys shows that Tianshan has a complex tectonic composition and evolution [49,50,51,52], which has possibly caused its gravity disturbance to undergo multiperiod evolution.
A subduction dynamics mechanism shows that the Tarim crust is subducted under the Tianshan Mountains [17]. The increase in the thickness of the crust at the northern margin of the Tarim Block may be related to this process. The lack of mass (concave-downward crust–mantle boundary) manifests itself as a large-scale negative regional Bouguer gravity disturbance. In addition, the Tianshan Mountains are in an environment of compression and subsidence of mantle convection. The asymmetry of north–south stress may be superimposed by the thrust of the northward movement of the Qinghai–Tibet Plateau. This stress distribution feature favorably supports the view that the lithosphere of the Tarim Block subducts below the Tianshan Mountains [17]. The view explains the generation of multiple reverse faults in the Tianshan area and the Late Paleozoic thrust belt [53,54].
The residual Bouguer disturbances of the Tianshan Mountains (Figure 3b and Figure 4b) appear as linear negative and positive residual Bouguer disturbance zones on both sides of the faults of the Tianshan Mountains along the northern margin of Tarim. These linear zones reach 10 mGal of residual Bouguer disturbance, which is similar to that produced by the margin of the near-70 km depth density body in the Annex, implying the forming of the linear disturbance zones is in large part attributable to the density difference on the margin of Tarim Block. These linear disturbance zones may be inherent geophysical characteristics of some new-born orogenic belts formed by compression stress. The crust blocks on both sides of Tianshan were squeezed and subducted under the Tianshan orogenic belt, resulting in many brittle deformations between the northern margin of Tarim and the Tianshan orogenic belt [17]. Then, these brittle deformations formed the fault belt in front of the Tianshan Mountain while undergoing differential movements. It is speculated that the Tianshan orogen is weakened due to squeezing by its surrounding blocks, and then the isostatic adjustment uplifts the orogenic belt and the whole piedmont area [17]. The fault belt in the Tianshan region is enclosed between the positive and negative linear narrow residual disturbance zones. However, the linear residual disturbance zones are incomplete before the correction from sediment (Figure 3b), indicating that the gravity effect produced by the sedimentary layer has an influence on residual disturbance due to the loose low-density sediment.

4.2. West Kunlun Orogen

The Kunlun Mountains are located above an active upper mantle, which is similar to the Tianshan Mountains [23]. The regional Bouguer disturbance of the West Kunlun has a larger negative value of −320–−400 mGal compared with the Tianshan Mountains (see Figure 4a), which is a result of the lack of high-density materials, which largely depends on the depth of the crust–mantle boundary. The larger negative value of the West Kunlun implies a more than 45 km deep crust–mantle boundary than that in Tianshan Mountains [17], which is proved by the previous gravitational estimation that the depth of the crust–mantle boundary of the Kunlun Mountains is 56–58 km [24]. The regional disturbance decreases rapidly from the southwestern edge of the Tarim Basin towards the Kunlun orogenic belt. The gravity gradient of the West Kunlun can reach near 50 mGal/degree, indicating that the high-density mantle layer is sinking sharply. The thickened crust is in large part caused by the flexural deformation of the rigid Tarim slab under the northward squeeze of the Qinghai–Tibet Plateau and at the same time, the Tarim slab can subduct toward the Kunlun Mountains and Tianshan orogenic belts, then forming a thrust belt from southwest to northeast [55,56]. As indicated from previous seismic reflection data [17], the lithosphere on the northwestern edge of the Qinghai–Tibet Plateau and the Tarim Block had a collision beneath the Kunlun Mountains, which supports the phenomenon of the Tarim Block subducting towards the northwestern edge of the Qinghai–Tibet Plateau on a lithospheric scale. In addition to the conjugate fault belt in the northwest and southeast of the Tarim Basin, the polarity of the Cenozoic thrust belt in the West Kunlun might have played a key role in preventing the edge of related deformation from spreading downward into the Tarim Block [57].
The residual Bouguer gravity map (Figure 4b) shows that the West Kunlun fault belt is distributed along the long axis of a linear positive disturbance zone. The positive disturbance zone near 10 mGal is larger than the residual disturbance of 6 mGal of the Tianshan Mountains, implying the crust–mantle boundary of the West Kunlun has an over 7 km high relief in the West Kunlun. An observable discontinuity divides the linear positive disturbance zone of the West Kunlun into two parts, the northwest part, and the southeast part. The northwest part of the disturbance zone extends along the NW direction, and the southeast part of the disturbance zone is along the NWW direction. The spatial stretching direction of the disturbance zone is consistent with the stretching direction of the West Kunlun Mountains, and the discontinuity of the positive disturbance zone also matches the observable discontinuity of the West Kunlun fault belt.

4.3. Altyn Fault Zone
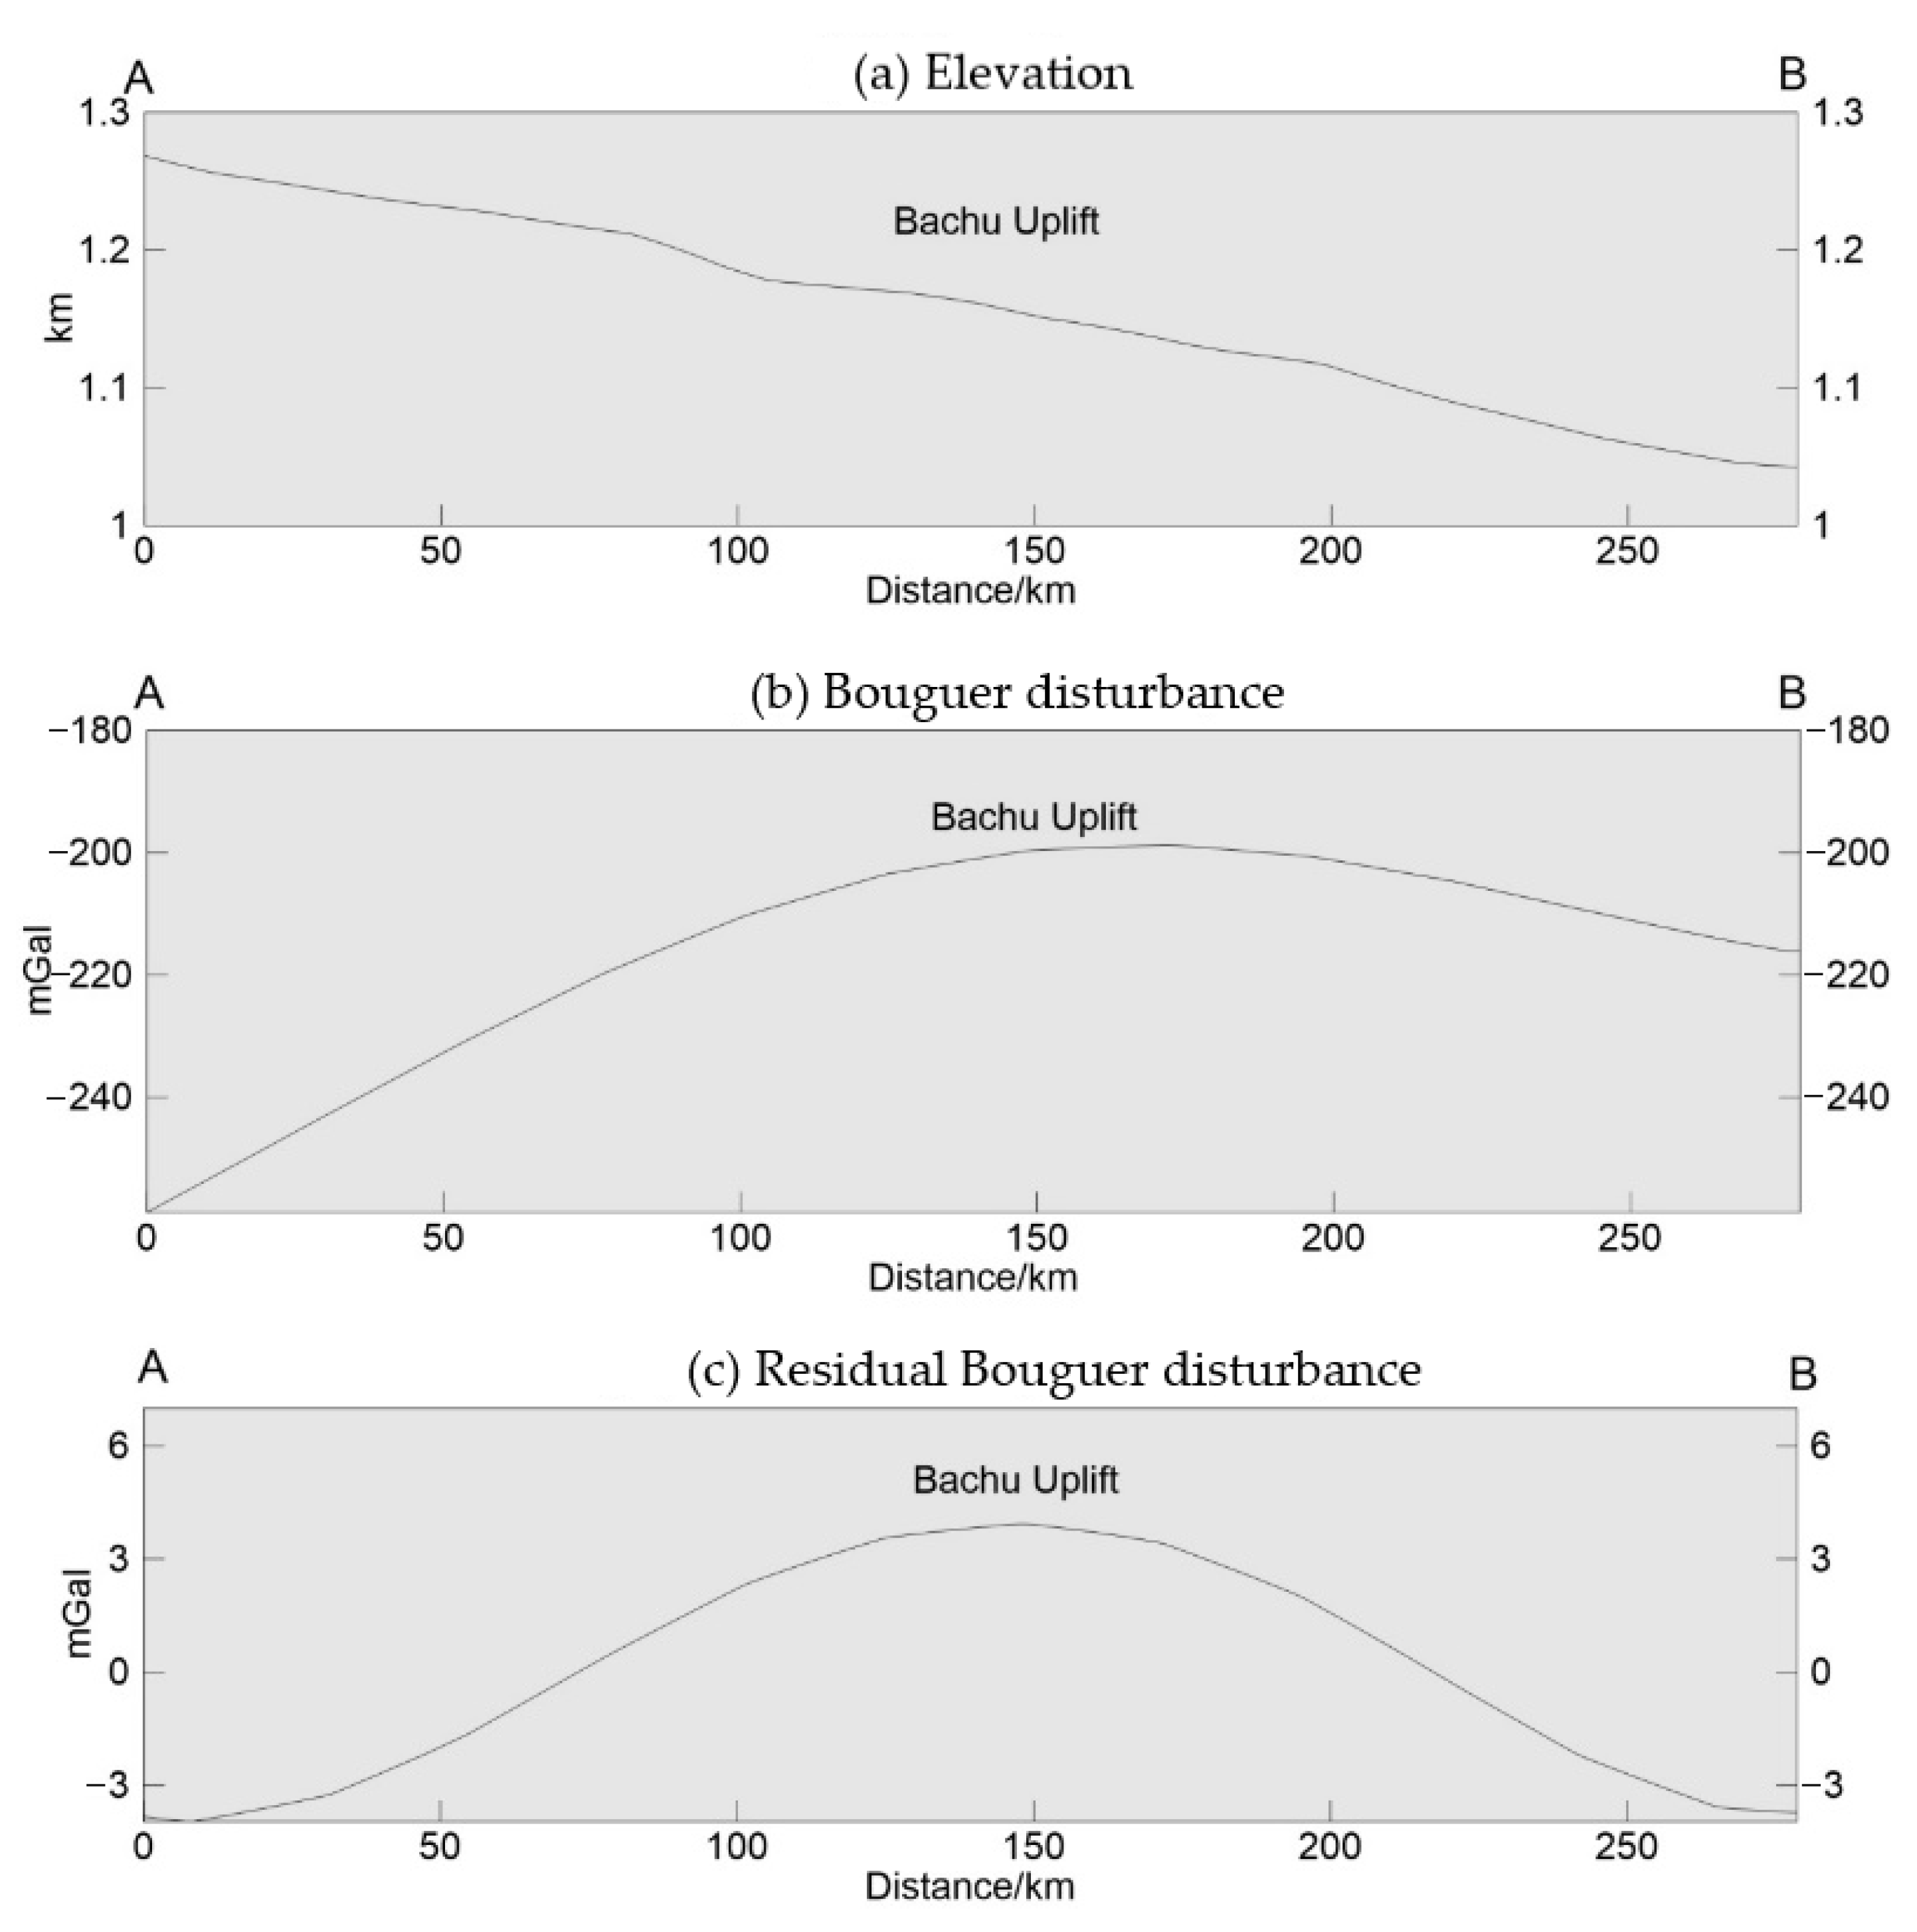
The regional Bouguer disturbance of the Altyn region also appears as a large negative value of −300–−450 mGal and a gravity gradient of near 60 mGal/degree (Figure 4a). From the southeastern margin of the Tarim Basin, through the Altyn orogenic belt and then to the Qinghai–Tibet Plateau, the terrain rises rapidly while the regional Bouguer gravity decreases sharply, indicating there is a thick mountain root in the Altyn region. The Altyn is 50 mGal smaller Bouguer disturbance than the West Kunlun, implying the crust–mantle boundary of the Altyn is deeper than the West Kunlun by 56–58 km. As indicated by previous seismic imaging data, the Tarim Block, corresponding to an old, cold, rigid high-speed block, is regarded as a high-speed wedge inserting downward into the Altyn region about 75 km depth along the southeast direction with an apparent inclination angle of about 60° [58]. Due to the compression stress by the India–Tibet collision, the rigid Tarim Block becomes bent and deformed and then subducts down towards the Altyn orogenic belt. In the Mesozoic and Cenozoic eras, especially at the end of the Eocene, the Eurasian and Indian plates began to collide and collage, and then continued to move northward, causing the paleo-collision orogens such as the Altyn Mountains to uplift rapidly [59]. Therefore, some deep and large faults were formed in the Altyn orogenic belt and the piedmont area. The brittle deformation of the shallow layer may have led to a decrease in the density and the lack of high-density mantle material caused the formation of a negative regional Bouguer gravity disturbance zone.
The Altyn fault belt is located at the southeastern edge of the basin and the north-western edge of the Qinghai–Tibet Plateau, trending along the ENE direction. The residual disturbance of the Altyn region appears as two linear disturbance zones on both sides of the Altyn fault (Figure 4b), a positive linear disturbance zone on the north side of the Altyn fault, and a negative linear disturbance zone on its south side. The two linear disturbance zones both extend along the northeastern direction, which is consistent with the whole distribution trend of the Altyn fault. As Indicated by our subsurface 3D density model test (see the Annex), the two near-10 mGal linear disturbance zones are in large part produced by density difference in the boundary of deep density body and thus the mantle plume, implying the boundary of the southeastern margin of the Tarim Block can be well-identified by the linear residual disturbance zones.

4.4. Bachu Uplift

Intriguingly, there is a prominent elliptical area in the Bachu uplift characterized by a positive value embedded within two negative values of residual disturbance (see Figure 4b), indicating a crystalline basement may uplift in this area. The positive-value area is elliptical and possesses a long axis trending toward the northwest direction. Furthermore, the faults on either side of Bachu uplift nearly extend along the 2 mGal of the contour line of residual Bouguer disturbance, which cannot be observed visibly in the Bouguer disturbance. As indicated by the study in stratigraphic and geological evolution, the Bachu uplift is a large back thrust structure, and it is bounded by thrust faults and thrust strike-slip faults on both sides [39,42]. In addition, there is a Permian basalt over the Bachu uplift (see Figure 1) produced by the underlying mantle plume [16,60], which may enhance the central positive value of residual Bouguer disturbance of Bachu uplift.
From the scrutiny of the topographic profile (Figure 5a) along the line AB crossing the Bachu uplift, the southwest point (point A) of the Bachu uplift is a high elevation and has an elevation difference of just 200 m compared with its northeast point (point B), implying the Bachu uplift is a flat plain. The Bouguer disturbance profile (Figure 5b) shows there is an increase of 20–30 mGal in the center of the Bachu uplift, which is in large part because of the slight uplift of the crust–mantle boundary and the high-density Permian basalt [23]. The residual Bouguer disturbance profile of the Bachu uplift (Figure 5c) appears an approximate symmetry along the central axis of the Bachu uplift, and the highest point of the residual disturbance compares well with the center of the Bachu uplift.
In addition to the Bachu uplift, there are some other uplifts formed in the Tarim Basin, including the Tabei uplift, Tanan uplift, Tadong uplift, and Kuluketage uplift. The Tabei uplift, located on the northern edge of the basin, is about 400 km long and 80 km wide. The Tabei uplift started to develop in the Early Paleozoic era, and it had an active stage during a period from the Paleozoic to the Cenozoic. The Tanan uplift, Tabei uplift, Tadong uplift, and Kuluketage uplift are all characterized by a central positive residual Bouguer disturbance (can see Figure 4b), indicating that the residual Bouguer disturbance can be used to estimate the position and the boundary of these uplift structures.

5. Conclusions

We calculated the regional Bouguer disturbance and the residual Bouguer disturbance of the Tarim Basin by using the minimum curvature separation method. The major results are:
(1)
The residual disturbance shows two linear disturbance zones, positive and negative disturbance zones, on both sides of the Altyn fault and the Tianshan fault belt respectively. The linear residual disturbance zones of the Tianshan Mountains trend toward the ENE direction and the linear residual disturbance zones of the Altyn trend toward the NE direction, which is consistent with the stretching direction of their related fault belts;
(2)
The linear positive residual disturbance zone in the West Kunlun Mountains appears an observable discontinuity, which coincides with the spatial distribution of the fault belt of the West Kunlun. The discontinuity divides the linear residual disturbance into two parts, the northwest part trending in the NW direction and the southeast part trending in the WNW direction;
(3)
The regional Bouguer disturbance is related to the depth of the crust–mantle boundary. Although regional disturbance cannot precisely identify the depth of the crust–mantle boundary, it can roughly estimate the crust thickness. The regional Bouguer disturbance suggests the depth order of crust–mantle boundary from deep to shallow is the Altyn region, the West Kunlun, and Tianshan Mountains, which is proved by the previous seismic study by seismic precise measurement;
(4)
The residual disturbance can estimate the position and boundary of the Bachu, Tanan, Tabei, Tadong, and Kuluketage uplifts by exhibiting central positive disturbance with an elliptical shape.
Overall, the residual gravity disturbance obtained using gravity separation shows a visible lateral difference, which is related to the boundary of the Tarim Block and the major fault belts in the Tarim Basin, indicating the relief of the crust–mantle boundary has a large effect on the surface Bouguer disturbance, which is related with the collision and deformation of the continental plates. However, some constraints exist in the gravity separation method. Near-surface density bodies cause a small bias for distribution and amplitude of linear residual gravity zones generated by the crust–mantle relief. Moreover, some residual gravity anomalies produced by near-surface density bodies are easy to be covered by deeper density sources due to their relatively small amplitude caused by their small rock density or relatively deep density sources. We expect to improve the separation method or add more constraints by combining extra data in the future.

Author Contributions

Conceptualization, Y.W. and J.Y.; methodology, Y.W. and F.L.; software, F.L.; validation, J.Y., J.P. and Y.Z.; formal analysis, Y.W. and F.L.; data curation, Y.W.; writing—original draft preparation, Y.W. and F.L.; writing—review and editing, Y.W., F.L., J.Y., J.P. and Y.Z.; visualization, F.L.; supervision, J.Y.; project administration, J.Y.; funding acquisition, Y.W. and J.Y. All authors have read and agreed to the published version of the manuscript.

Funding

This research was funded by the National Natural Science Foundation of China (41974096, 41931074). Opening Fund of Key Laboratory of Geological Survey and Evaluation of Ministry of Education (Grant No. GLAB2022ZR07) and the Fundamental Research Funds for the Central Universities.

Data Availability Statement

The EIGEN-6C4 global gravity model data are available from http://icgem.gfz-potsdam.de/home (accessed on 13 July 2020).

Acknowledgments

Thanks for the use of the gravity data provided by the Centre for Global Earth Models (ICGEM, http://icgem.gfz-potsdam.de/home, accessed on 13 July 2020) service.

Conflicts of Interest

The authors declare no conflict of interest.

References

  1. Carroll, A.; Graham, S.; Hendrix, M.; Ying, D.; Zhou, D. Late Paleozoic tectonic amalgamation of northwestern China: Sedimentary record of the northern Tarim, northwestern Turpan, and southern Junggar basins. Geol. Soc. Am. Bull. 1995, 107, 571–594. [Google Scholar] [CrossRef]
  2. Clark, M.K.; Royden, L.H. Topographic ooze: Building the eastern margin of Tibet by lower crustal flow. Geology 2000, 28, 703–706. [Google Scholar] [CrossRef]
  3. Braitenberg, C.; Wang, Y.; Fang, J.; Hsu, H. Spatial variations of flexure parameters over the Tibet-Quinghai plateau. Earth Planet. Sci. Lett. 2003, 205, 211–224. [Google Scholar] [CrossRef]
  4. Zhang, P.Z.; Deng, Q.D.; Yang, X.P. Late Cenozoic tectonic deformation and mechanism along the Tianshan Mountain, Northwestern China. Earthq. Res. China 1996, 12, 127–140. [Google Scholar]
  5. Molnar, P.; Tapponnier, P. Cenozoic tectonics of Asia: Effects of a continental collision. Science 1975, 189, 419–426. [Google Scholar] [CrossRef]
  6. Tapponnier, P.; Molnar, P. Active faulting and tectonics in China. J. Geophys. Res. 1977, 82, 2905–2930. [Google Scholar] [CrossRef]
  7. Tapponnier, P.; Peltzer, G.; Armijo, R. On the mechanics of the collision between India and Asia. Geol. Soc. Lond. Spec. Publ. 1986, 19, 113–157. [Google Scholar] [CrossRef]
  8. Yin, A.; Nie, S. 20 A Phanerozoic palinspastic reconstruction of China and its neighboring regions. In The Tectonic Evolution of Asia; Cambridge University: New York, NY, USA, 1996. [Google Scholar]
  9. Neil, E.A.; Houseman, G.A. Geodynamics of the Tarim Basin and the Tian Shan in central Asia. Tectonics 1997, 16, 571–584. [Google Scholar] [CrossRef]
  10. Kaban, M.K.; Yuanda, T.R. Density structure, isostatic balance and tectonic models of the Central Tien Shan. Surv. Geophys. 2014, 35, 1375–1391. [Google Scholar] [CrossRef]
  11. Huang, B.; Piper, J.D.; Peng, S.; Liu, T.; Li, Z.; Wang, Q.; Zhu, R. Magnetostratigraphic study of the Kuche Depression, Tarim Basin, and Cenozoic uplift of the Tian Shan range, western China. Earth Planet. Sci. Lett. 2006, 251, 346–364. [Google Scholar] [CrossRef]
  12. Lin, C.; Yang, H.; Liu, J.; Rui, Z.; Cai, Z.; Zhu, Y. Distribution and erosion of the Paleozoic tectonic unconformities in the Tarim Basin, Northwest China: Significance for the evolution of paleo-uplifts and tectonic geography during deformation. J. Asian Earth Sci. 2012, 46, 1–19. [Google Scholar] [CrossRef]
  13. Jia, C.; Yao, H.; Wei, G.; Wei, L.; Jia, C.; Yao, H.; Wei, G.; Wei, L. Plate tectonic evolution and characteristics of major tectonic units of the Tarim basin. Tarim Basin 1991, 3, 207–225. (In Chinese) [Google Scholar]
  14. Ren, J.; Zhang, J.; Yang, H.; Hu, D.; Li, P.; Zhang, Y. Analysis of fault systems in the Central uplift, Tarim Basin. Acta Petrol. Sin. 2011, 27, 219–230. [Google Scholar]
  15. Guo, J.; Li, W.; Chang, X.; Zhu, G.; Liu, X.; Guo, B. Terrestrial water storage changes over Xinjiang extracted by combining Gaussian filter and multichannel singular spectrum analysis from GRACE. Geophys. J. Int. 2018, 213, 397–407. [Google Scholar] [CrossRef]
  16. Zhang, C.-L.; Zou, H.-B.; Li, H.-K.; Wang, H.-Y. Tectonic framework and evolution of the Tarim Block in NW China. Gondwana Res. 2013, 23, 1306–1315. [Google Scholar] [CrossRef]
  17. Gao, R.; Hou, H.; Cai, X.; Knapp, J.H.; He, R.; Liu, J.; Xiong, X.; Guan, Y.; Li, W.; Zeng, L. Fine crustal structure beneath the junction of the southwest Tian Shan and Tarim Basin, NW China. Lithosphere 2013, 5, 382–392. [Google Scholar] [CrossRef]
  18. Guo, Z.-J.; Yin, A.; Robinson, A.; Jia, C.-Z. Geochronology and geochemistry of deep-drill-core samples from the basement of the central Tarim basin. J. Asian Earth Sci. 2005, 25, 45–56. [Google Scholar] [CrossRef]
  19. Mi, N.; Wang, L.; Li, H.; Xu, M.; Chen, Y.; Li, C.; Zhang, Y.; Yu, D. Velocity structure of the crust and uppermost mantle in the boundary area of the Tianshan Mountains and the Tarim Basin. Chin. Sci. Bull. 2005, 50, 270–275. [Google Scholar] [CrossRef]
  20. Zhao, J.; Cheng, H.; Pei, S.; Liu, H.; Zhang, J.; Liu, B. Deep structure at northern margin of Tarim Basin. Chin. Sci. Bull. 2008, 53, 1544–1554. [Google Scholar] [CrossRef]
  21. Lin, C.; Liu, J.; Eriksson, K.; Yang, H.; Cai, Z.; Li, H.; Yang, Z.; Rui, Z. Late Ordovician, deep-water gravity-flow deposits, palaeogeography and tectonic setting, Tarim Basin, Northwest China. Basin Res. 2014, 26, 297–319. [Google Scholar] [CrossRef]
  22. Gao, Z.; Wang, L.; Tian, W.; Gong, M. 3-D Seismology Interpretation and Structure Analysis of Early Permian Flood Basalt Volcanic Edifices in Tarim Basin. Beijing Da Xue Xue Bao 2018, 54, 555–562. [Google Scholar]
  23. Deng, Y.; Levandowski, W.; Kusky, T. Lithospheric density structure beneath the Tarim basin and surroundings, northwestern China, from the joint inversion of gravity and topography. Earth Planet. Sci. Lett. 2017, 460, 244–254. [Google Scholar] [CrossRef]
  24. Xu, M.-J.; Liang, S.W.; Kai, Z.; De-Zhao, H.; Hua, L.; Xu, Z.H. Features of gravitational and magnetic fields in the Tarim basin and basement structure analysis. Geol. J. China Univ. 2005, 11, 585. [Google Scholar]
  25. Förste, C.; Bruinsma, S.; Abrikosov, O.; Lemoine, J.-M.; Marty, J.C.; Flechtner, F.; Balmino, G.; Barthelmes, F.; Biancale, R. EIGEN-6C4: The latest combined global gravity field model including GOCE data up to degree and order 2190 of GFZ Potsdam and GRGS Toulouse. GFZ Data Serv. 2014, 16, 2014–3707. [Google Scholar]
  26. Xu, Y.; Hao, T.; Li, Z.; Duan, Q.; Zhang, L. Regional gravity anomaly separation using wavelet transform and spectrum analysis. J. Geophys. Eng. 2009, 6, 279–287. [Google Scholar] [CrossRef]
  27. Li, Y.; Braitenberg, C.; Yang, Y. Interpretation of gravity data by the continuous wavelet transform: The case of the Chad lineament (North-Central Africa). J. Appl. Geophys. 2013, 90, 62–70. [Google Scholar] [CrossRef]
  28. Wang, W.; Qiu, Z.; Liu, J.; Huang, Y.; Yu, C.; Li, H. The research to the extending edge and interpolation based on the minimum curvature method in potential field data processing. Prog. Geophys. 2009, 19, 298–304. [Google Scholar]
  29. Mickus, K.L.; Aiken, C.L.; Kennedy, W. Regional-residual gravity anomaly separation using the minimum-curvature technique. Geophysics 1991, 56, 279–283. [Google Scholar] [CrossRef]
  30. Ghaderpour, E.; Ince, E.S.; Pagiatakis, S.D. Least-squares cross-wavelet analysis and its applications in geophysical time series. J. Geod. 2018, 92, 1223–1236. [Google Scholar] [CrossRef]
  31. Briggs, I.C. Machine contouring using minimum curvature. Geophysics 1974, 39, 39–48. [Google Scholar] [CrossRef]
  32. Yang, M.; Wang, W.-Y.; Du, X.-D.; Fang, Y.; Zhang, K. Tectonic districts by satellite gravity data of the Bone basin, Sulawesi, Indonesia. Prog. Geophys. 2016, 31, 999–1009. [Google Scholar]
  33. Ma, J.; Wang, W.; Ji, X.; Amp, G.; University, C. Tectonic Characteristics of Cesar Basin and Its Adjacent Areas According to Gravity Field. Geol. Sci. Technol. Inf. 2019, 38, 285–294. [Google Scholar] [CrossRef]
  34. Zhou, H.; Zhou, Z.; Luo, Z. A new hybrid processing strategy to improve temporal gravity field solution. J. Geophys. Res. Solid Earth 2019, 124, 9415–9432. [Google Scholar] [CrossRef]
  35. Feng, B.; Zhou, Y.; Chi, S.; Yang, T.; Zhong, C.; Ye, S. Pre-Sinian Geology and Noble Metals, Colored Metals Mineralization in Quruqtagh, Xinjiang; Geological Publishing House: Beijing, China, 1995. [Google Scholar]
  36. Lu, S.; Li, H.; Zhang, C.; Niu, G. Geological and geochronological evidence for the Precambrian evolution of the Tarim Craton and surrounding continental fragments. Precambrian Res. 2008, 160, 94–107. [Google Scholar] [CrossRef]
  37. Tang, L.J. Evolution and Tectonic Patterns of Tarim Basin. Earth Sci. J. China Univ. Geosci. 1994, 19, 742–754. [Google Scholar]
  38. He, D.; Zhou, X.; Zhang, C.; Yang, W.; Shi, X. Characteristics of geologic framework of multicycle superimposed basin in Tarim Basin. China Pet. Explor. 2006, 11, 31–41. [Google Scholar]
  39. Li, Z.; Roecker, S.; Zhihai, L.; Bin, W.; Haitao, W.; Schelochkov, G.; Bragin, V. Tomographic image of the crust and upper mantle beneath the western Tien Shan from the MANAS broadband deployment: Possible evidence for lithospheric delamination. Tectonophysics 2009, 477, 49–57. [Google Scholar]
  40. Sobel, E.R.; Arnaud, N. Cretaceous–Paleogene basaltic rocks of the Tuyon basin, NW China and the Kyrgyz Tian Shan: The trace of a small plume. Lithos 2000, 50, 191–215. [Google Scholar] [CrossRef]
  41. Zou, T.; Cao, Y.; Xu, J.; Yu, X.; Xia, F.; Chen, W. Geology and geochemistry of the Cenozoic alkaline basalt on the northern margin of the Tarim basin, Xinjiang, China. Geol. Rev. 1999, 45, 1072–1077. [Google Scholar]
  42. Ding, W.; Lin, C.; Qi, L.; Huang, T.; Yu, T. Structural framework and evolution of Bachu uplift in Tarim basin. Earth Sci. Front. 2008, 15, 242–252. [Google Scholar]
  43. Andersen, O.B.; Knudsen, P.; Berry, P.A. The DNSC08GRA global marine gravity field from double retracked satellite altimetry. J. Geod. 2010, 84, 191–199. [Google Scholar] [CrossRef]
  44. Pavlis, N.K.; Holmes, S.A.; Kenyon, S.C.; Factor, J.K. The development and evaluation of the Earth Gravitational Model 2008 (EGM2008). J. Geophys. Res. Solid Earth 2012, 117. [Google Scholar] [CrossRef]
  45. Laske, G. A global digital map of sediment thickness. Eos Trans. AGU 1997, 78, F483. [Google Scholar]
  46. Laske, G.; Masters, G.; Ma, Z.; Pasyanos, M. CRUST1. 0: An updated global model of Earth’s crust. Geophys. Res. Abs. 2012, 14, 743. [Google Scholar]
  47. Bao, X.; Song, X.; Li, J. High-resolution lithospheric structure beneath Mainland China from ambient noise and earthquake surface-wave tomography. Earth Planet. Sci. Lett. 2015, 417, 132–141. [Google Scholar] [CrossRef]
  48. Huang, T.; Chi-Shun, J.; Chih-Meng, J.C.F.C.; Zhi-Qin, X. An outline of the tectonic characteristics of China. Acta Geol. Sin. 1977, 36, 288–303. [Google Scholar]
  49. Sobel, E.R.; Dumitru, T.A. Thrusting and exhumation around the margins of the western Tarim basin during the India-Asia collision. J. Geophys. Res. Solid Earth 1997, 102, 5043–5063. [Google Scholar] [CrossRef]
  50. Thompson, S.C.; Weldon, R.J.; Rubin, C.M.; Abdrakhmatov, K.; Molnar, P.; Berger, G.W. Late Quaternary slip rates across the central Tien Shan, Kyrgyzstan, central Asia. J. Geophys. Res. Solid Earth 2002, 107, ETG 7-1–ETG 7-32.
  51. Sobel, E.R.; Chen, J.; Heermance, R.V. Late Oligocene–Early Miocene initiation of shortening in the Southwestern Chinese Tian Shan: Implications for Neogene shortening rate variations. Earth Planet. Sci. Lett. 2006, 247, 70–81. [Google Scholar] [CrossRef]
  52. Lei, J. Seismic tomographic imaging of the crust and upper mantle under the central and western Tien Shan orogenic belt. J. Geophys. Res. Solid Earth 2011, 116. [Google Scholar] [CrossRef]
  53. Allen, M.B.; Vincent, S.J.; Wheeler, P.J. Late Cenozoic tectonics of the Kepingtage thrust zone: Interactions of the Tien Shan and Tarim Basin, northwest China. Tectonics 1999, 18, 639–654. [Google Scholar] [CrossRef]
  54. Chen, J.; Ding, G.; Burbank, D.; Scharer, K.; Rubin, C.; Sobel, E.; Qu, G.; Shen, J.; Yin, J.; Zhao, R. Late Cenozoic tectonics and seismicity in the southwestern Tian Shan, China. Earthq. Res. China 2001, 17, 134–155. [Google Scholar]
  55. Shao, X.; Zhang, J. Preliminary Results of Study of Deep Structures in Tarim Basin by the Method of Converted Waves of Earthquakes. Chin. Sci. Abstr. Ser. B 1995, 1995, 60. [Google Scholar]
  56. Wang, S.; Shi, Z.; Huan, W. The Yecheng, Xinjiang, China, earthquake of 14 February 1980. Acta Seismol. Sin. 1992, 5, 675–682. [Google Scholar] [CrossRef]
  57. Cowgill, E.; Yin, A.; Harrison, T.M.; Xiao-Feng, W. Reconstruction of the Altyn Tagh fault based on U-Pb geochronology: Role of back thrusts, mantle sutures, and heterogeneous crustal strength in forming the Tibetan Plateau. J. Geophys. Res. Solid Earth 2003, 108. [Google Scholar] [CrossRef]
  58. Shi, D. Crust and upper mantle tomographic structure across the Altyn fault zone using teleseismic P-waves. Chin. J. Geophys. 1999, 42, 341–350. [Google Scholar]
  59. Jia, C.; Wei, G. Structural characteristics and petroliferous features of Tarim Basin. Chin. Sci. Bull. 2002, 47, 1–11. [Google Scholar] [CrossRef]
  60. Xu, Y.-G.; Wei, X.; Luo, Z.-Y.; Liu, H.-Q.; Cao, J. The Early Permian Tarim Large Igneous Province: Main characteristics and a plume incubation model. Lithos 2014, 204, 20–35. [Google Scholar] [CrossRef]
Figure 1. Schematic diagram of the Tarim Basin structure (modified from Lin et al. [12]).
Remotesensing 14 03948 g001
Figure 2. Gravity correction steps and results; (a) gravity disturbance map; (b) ETOPO1 elevation map; (c) terrain gravity effect map; (d) complete Bouguer disturbance map; (e) sediment map after Laske and Masters [45]; (f) bouguer disturbance map corrected from sediments.
Remotesensing 14 03948 g002
Figure 3. The Bouguer gravity disturbance in the Tarim Basin separated by the minimum curvature. (a) Regional Bouguer disturbance and (b) residual Bouguer disturbance.
Remotesensing 14 03948 g003
Figure 4. (a) The regional Bouguer disturbance corrected from sediment and (b) the residual Bouguer disturbance corrected from sediment.
Remotesensing 14 03948 g004
Figure 5. Line segment AB crosses the Bachu uplift area (marked in Figure 4b). (a) Elevation; (b) Bouguer disturbance; and (c) residual Bouguer disturbance.
Remotesensing 14 03948 g005
Publisher’s Note: MDPI stays neutral with regard to jurisdictional claims in published maps and institutional affiliations.

