Article

Micro-Doppler Feature Extraction of Rotating Structures of Aircraft Targets with Terahertz Radar

School of Electronic Science, National University of Defense Technology, Changsha 410073, China
*
Author to whom correspondence should be addressed.
Remote Sens. 2022, 14(16), 3856; https://doi.org/10.3390/rs14163856
Submission received: 12 July 2022 / Revised: 5 August 2022 / Accepted: 7 August 2022 / Published: 9 August 2022
(This article belongs to the Section Remote Sensing Communications)

Abstract

:
The micro-Doppler features formed by the micro-motion of rotating blades of rotors and turbines are of great significance for aircraft target detection and recognition. Mastering the micro-motion features is the premise of radar target identification. The blades’ length and rotation rate are vital parameters for classifying aircraft targets. One can instantly judge the type and state of the targets by extracting micro-Doppler features. To extract the micro-Doppler features of rotating blades of the turbine target, we utilized microwave-band and terahertz-band radar to simulate the target and extract the Doppler frequency-shift information. For a turbine model with an obvious blade tip structure, we propose an algorithm based on wavelet coefficient enhancement and inverse Radon transform, integrating the time–frequency analysis with image processing. Under low SNR, this method allows for a high-accuracy parameter estimate. For a two-bladed rotor model without an obvious blade tip structure, we conducted an actual measurement experiment on the model utilizing a 120 GHz radar, and we propose a parameter estimation algorithm based on the fitting of the time–frequency distribution. By fitting the data of the time–frequency diagram, the micro-motion characteristic parameters of the rotor target were obtained. The simulation and experimental results demonstrate the benefits of terahertz radar in target detection, and indicate that the proposed algorithms have the characteristics of high extraction precision and insensitivity to noise.

1. Introduction

Terahertz (THz) radar detects targets by emitting terahertz waves. As an electromagnetic wave between microwaves and infrared light, the THz wave not only has the characteristics of both, but also has its own unique and outstanding properties [1]. It has special benefits in target early warning detection, while also having a wide range of potential applications in cloud image remote sensing, biological sciences, automobile safety, frontier security, and other areas.
Micro-motion refers to the phenomenon in which some parts of an object have slight vibration, rotation, and other higher-order motions relative to the translational motion of the center of mass of an object [2,3,4]. In the spectrum, the micro-motion can be shown as the micro-Doppler effect, which means that the echo Doppler frequency shift is time-varying, and there will be the presence of spectrum sidelobe or spectrum broadening on the spectral graph. The micro-Doppler feature is an essential auxiliary characteristic to detect and recognize the micro-motion target [5,6,7]. For example, the micro-motion can be detected at a helicopter propeller; according to different micro-Doppler features formed by the rotating blades of rotors, the helicopter propeller parameters, including the speed of rotation, the length, and the radial velocity of the blade tip, can be estimated so as to determine the type of helicopter, as well as more detailed information. Studying the micro-Doppler features of a radar target is the key to improving radar detection and resolution, imaging, and target recognition performance. The micro-Doppler effect is affected by the signal frequency band. The traditional radar system works in the lower frequency band, and the micro-Doppler effect is very slight and is not easy to detect. However, the THz radar is a radar with a higher frequency band, in which the micro-Doppler effect is very significant, and the micro-Doppler information that can be extracted is more abundant [8]. Therefore, we can achieve the feature parameter extraction of aircraft targets with high precision in the THz band.
In 1991, the Georgia Institute of Technology detected the Doppler echo of a stationary truck with an engine running using 225 GHz radar, producing the earliest research on micro-motion in the THz frequency [9]. Since 2007, the group led by Li Kangle from the National University of Defense Technology has taken the lead in the research of micro-motion feature extraction and estimation technology of radar targets, and proposed a micro-motion parameter estimation method based on sparse representation [10]. Then, an algorithm for bistatic micro-Doppler feature analysis of rotating targets was put forth by Ai Xiaofeng’s team in 2010, extending the micro-Doppler feature research of rotating targets from a single base to a bistatic base [11]. In 2011, Li Jin’s team from the University of Electronic Science and Technology of China analyzed and compared the differences in micro-Doppler features generated by the micro-motion target between the THz and microwave frequency bands from theoretical and simulated experiments, and proposed an algorithm to extract micro-motion parameters by using Radon transform [12], opening the prelude of the research on micro-motion target recognition with THz radar in China. In 2013, Tan Yuanquan’s team, from the University of Electronic Science and Technology of China also made full use of the spectra and modulation signatures of echoes to achieve the automatic classification of different aircraft with or without rotating structures [13]. Since 2019, a research team from the University of Chinese Academy of Sciences has extended the research of micro-Doppler feature analysis and feature extraction from single-rotor unmanned aerial vehicle (UAV) targets to multirotor targets [14,15], and proposed a method for estimating the micro-motion feature parameters of multirotor UAVs based on time–frequency concentration index, improving the accuracy of parameter estimation of multicomponent micro-Doppler signals. This method also had excellent robustness in a low-SNR environment. In 2021, Wang Wantian of the School of Early Warning proposed an effective method for estimating the rotational angular velocity of rotor targets based on the combination of a time–frequency analysis algorithm and the Hough transform [16]. This approach is effective in resolving issues with the short-time Fourier transform and Wigner–Ville distribution algorithms’ poor time–frequency resolution and cross-term interference.
The majority of previous studies of the micro-Doppler effect are based on radar in lower frequency bands. In this paper, we focus on the technique and method of precision identification of micro-motion targets in the THz band. Considering the micro-motion of turbines and rotor-wing rotation in aircraft [17], we establish a micro-motion characteristic model of the rotational structure of the aircraft target. We obtain the radar echo data of the rotating turbine blade and rotor blade targets by simulation and experiment, respectively, and extract the micro-Doppler features of the target via time–frequency analysis. In addition, we extract the micro-motion feature parameters of the turbine and rotor targets. The suggested algorithm has high parameter extraction accuracy and good anti-noise performance, according to the simulated and experimental results.

2. Modeling of the Rotating Target Echo

The center of the propeller is located at the origin of the fixed coordinate system (X′, Y′, Z′) of the object. The blade rotates on the plane xoy with the z-axis (0, 0, 1) as the rotation axis, and the angular velocity is Ω. The radar is located at the origin of the space-fixed coordinate system (X, Y, Z), the distance from the radar to the center of the helicopter propeller is R0, and the azimuth and pitch angles of the incident wave are α and β, respectively. The geometry of the radar and the helicopter rotor is presented in Figure 1.
According to the theory of electromagnetic scattering, each blade of a helicopter rotor can be regarded as being composed of a bunch of scattered points. Let α = β = 0°; when t = 0, the scattering point P at ( x 0 , y 0 , z = 0 ) rotates counterclockwise with constant angular velocity Ω. At this point, the distance from point P to the radar is R P 0 , the distance from the propeller center is l P = x 0 2 + y 0 2 , and the initial rotation angle is φ0. The blade rotation plane sketch is shown in Figure 2.
At time t, the point P rotates to the position of ( x t , y t , z = 0 ) , and the rotation angle is φ t = Ω t + φ 0 . The distance from point P to the radar is:
R p ( t ) = ( R 0 + x t ) 2 + y t 2 = ( R 0 + l p cos φ t ) 2 + ( l p sin l p cos φ t ) 2 = R 0 2 + l p 2 + 2 R 0 l p cos ( φ 0 + Ω t ) .
In the case of the far field, the distance from point P to the radar becomes:
R P ( t ) = R 0 + l P cos ( φ 0 + Ω t ) .
The echo signal of the scattering point P received by the radar is:
s R ( t ) = exp [ j 2 π f 0 t + 4 π λ R P ( t ) ] = exp { [ j 2 π f 0 t + 4 π λ [ R 0 + l P cos ( φ 0 + Ω t ) ] ] } .
Generally, if neither the pitch angle β nor the height of the helicopter blade z0 is 0, then the phase function becomes:
φ P ( t ) = 4 π λ [ R 0 + l P cos β cos ( φ 0 + Ω t ) + z 0 sin β ] .
Thus, the baseband signal at the scattering point P is:
s P ( t ) = e j 4 π λ [ R 0 + z 0 sin β ] e j 4 π λ l p cos β cos ( Ω t + φ 0 ) .
At this time, the baseband signal at the blade tip is:
s ( t ) = e j 4 π λ [ R 0 + z 0 sin β ] e j 4 π λ L cos β cos ( Ω t + φ 0 ) .
For a propeller with N blades, the initial rotational angle of each blade is:
φ k = φ 0 + 2 k π / N ( k = 0 , 1 , 2 , N 1 ) .
The phase function of the echo at the tip of the blade k is expressed as follows:
φ k ( t ) = 4 π λ L cos β cos ( Ω t + φ 0 + 2 k π / N ) ( k = 0 , 1 , 2 , N 1 ) .
The frequency-domain features of the rotating propeller are represented by the Doppler frequency shift, and the instantaneous Doppler frequency shift generated by the blade tip rotation of the blade k is expressed as follows:
f D , k ( t ) = 1 2 π d φ k ( t ) d t = 2 Ω L λ cos β [ sin ( Ω t ) cos ( φ 0 + 2 k π / N ) cos ( Ω t ) sin ( φ 0 + 2 k π / N ) ] = 2 Ω L λ cos β sin ( Ω t + φ 0 + 2 k π / N )         ( k = 0 , 1 , 2 , , N 1 ) .
It can be seen from Equation (9) that the rotational speed modulates the instantaneous Doppler frequency as a sinusoidal curve, and the maximum Doppler frequency shift of the rotating blade is obtained at the tip of it, as follows:
f D max = 2 v λ cos β = 2 Ω L λ cos β .

3. Parameter Extraction of Rotating Targets

3.1. Signal Analysis

The idea of time–frequency analysis originated from the Gabor transform proposed by Dennis Gabor in 1946. Since then, research on time–frequency analysis has developed rapidly, and many time–frequency analysis algorithms have been proposed and applied to the processing of non-stationary signals. Time–frequency analysis is mainly divided into two categories: linear transformation, represented by STFT (short-time Fourier transform), and bilinear transformation, represented by WVD (Wigner–Ville distribution) [18,19].
The expression of STFT is s t f t ( t , f ) = + x ( t ) h ( τ t ) e j 2 π f τ d τ . The basic idea is to utilize a narrow time-window function h (t) to take out the signals and then assume that the signal in the time window is stationary, applying the Fourier transform to determine the frequency of the signal within the time window and filter out the window function outside the signal spectrum. After that, along with the signal to the mobile time window, we can obtain a two-dimensional time–frequency distribution, which contains the spectral characteristics of the signal at different times.
The STFT algorithm is simple and easy to use to analyze the micro-Doppler phenomenon. For a micro-motion target such as vibration or rotation, time–frequency analysis can verify the correctness of the model for micro-Doppler features; at the same time, it can be a tool for precision identification, and can provide theoretical support for the micro-Doppler effect. Nonetheless, when the signal has multiple components, there is serious interference of cross-terms when applying nonlinear transformation analysis. Therefore, we selected the STFT algorithm for all subsequent experimental analyses.
The micro-Doppler features of the different numbers of rotating blades are shown in Figure 3. For helicopters, the blade length, number, and rotational velocity are essential features to distinguish their type. The above features can be easily extracted from the Doppler spectrum produced by rotating blades. Therefore, by analyzing the time–frequency distribution of echo data, different types of helicopters can be identified.

3.2. Extraction of Parameters Based on the Enhancement of Wavelet Coefficients and Inverse Radon Transform at Low SNR

The algorithm based on autocorrelation is one of the most commonly utilized algorithms in periodicity estimation, by virtue of its easy and stable performance. The correlation of periodic function suggests that only when the cyclic displacement of the signal is an integer multiple of the period does it achieve the most significant correlation with itself. The peak value appears on the image of the autocorrelation function; thus, the period of the original signal can be determined by the position of the detected peak value. According to the theoretical analysis, the micro-Doppler frequency produced by rotation changes in a sinusoidal curve, and the frequency of the sinusoidal curve is the speed of the blade.
The basic idea of inverse Radon transform [20,21] is to map a sine curve in the image to a specific point in Radon space, and its position can reflect the amplitude and phase of the sine curve. If there is a sine curve in the graph, then the graph can be represented as follows:
F ( ρ , θ ) = δ ( ρ A sin ( θ + φ 0 ) ) ,
where ρ is the horizontal axis, and θ is the vertical axis of the image. The image expression obtained by inverse Radon transform is:
f ( x , y ) = F ( ρ , θ ) e j 2 π ρ v e j 2 π ( k x x + k y y ) d ρ d k x d k y = δ ( ρ A sin ( θ + φ 0 ) e j 2 π ρ v d ρ e j 2 π ( k x x + k y y ) d k x d k y = e j 2 π A sin ( θ + φ 0 ) v e j 2 π ( k x x + k y y ) d k x d k y = e j 2 π ( x A sin φ ) k x d k x e j 2 π ( y A cos φ ) k y d k y = δ ( x A sin φ ) δ ( y A cos φ ) ,
where k x = v cos θ , k y = v sin θ . According to Equation (12), the curve is presented as a point in the image after inverse Radon transformation, so the estimated value of the amplitude and initial phase of the curve can be calculated by Equation (13):
A = ( A sin φ 0 ) 2 + ( A cos φ 0 ) 2 φ 0 = arctan ( A sin φ 0 A cos φ 0 ) .
For a rotating structure with an obvious tip, such as the blades of turbines, the Doppler effect at the blade tip is extremely obvious. We utilized the inverse Radon transform to extract the maximal micro-Doppler frequency shift of the blades. The inverse Radon transform and autocorrelation algorithm were applied to estimate the micro-motion parameters of the rotor.
Nevertheless, at low SNR, the micro-Doppler curve is simply submerged in the background noise, rendering the inverse Radon transform ineffective in extracting the maximum Doppler frequency shift. For this reason, this paper proposes a new parameter-extraction method by integrating wavelet coefficient enhancement and inverse Radon transform at low SNR. Firstly, STFT time–frequency analysis is performed on the received noisy echo signal to obtain the time–frequency distribution containing noise. After decomposition by the DB4 wavelet, the threshold is set to divide the high-frequency and low-frequency components in the image. Then, we enhance the low-frequency component and weaken the high-frequency component to obtain the time–frequency distribution map after contrast enhancement.

3.3. Extraction of Parameters Based on Time–Frequency Distribution Fitting

For rotors with inconspicuous and uniformly flat blades at the tip, there are simultaneously countless scattered points rotating on the blade with the same attitude relative to the radar, and each scattering point’s distance from the center of rotation—and corresponding radial velocity—is different. Therefore, they form a bunch of sine curves with different amplitudes, but the tip-forming Doppler curves only embody the outermost sine envelope. In this case, the algorithm proposed in Section 3.2 cannot form special salient points, so the fitting algorithm based on time–frequency distribution is applied to extract micro-Doppler features. The flowchart is shown in Figure 4.
Firstly, transform the time–frequency spectrum of the echo signal into a grayscale image, and set the threshold for binarization processing. The threshold is constantly adjusted so that the binarization time–frequency matrix M (x, y) graph contains as few noise points as possible. Then, detect the coordinates of “black points” in the binarization image. Since the instantaneous frequency of each moment needs to be calculated, it is necessary to eliminate the repeated abscissa of the detected black spot to obtain the time series. Then, extract the edge—that is, the micro-Doppler curve generated by the rotor blade tip. The peripheral instantaneous frequency points at each moment are merged to obtain N (x, y), which is the discrete time–frequency curve matrix of the rotating blade tip. By fitting the discrete time–frequency curves, the micro-Doppler curves formed by the original blade tips can be recovered.

4. Micro-Motion Simulation Experiment Results of Turbine Blades

4.1. The Simulation Process

We utilized FEKO as the simulation software, which is a powerful electromagnetic calculation software developed by Ansys in the US. Its applications include EMC analysis, antenna design, and RCS analysis. The base of the FEKO solver is the MOM, and it also combines the MLFMM, FEM, high-frequency PO, and LE-PO algorithms, which have a preferable performance in analyzing electromagnetic radiation, scattering, and other problems. To improve the calculation efficiency, we took advantage of the combined algorithm of PO and MLFMM to calculate the backscattering of the rotating turbine.
Figure 5 shows the flowchart of the simulation. First, the model parameters were set using the FEKO software, and then the echo data were processed using MATLAB software. The specific process was as follows:
  • Import the turbine model, and set the model size, material, and rotation angle as required. The model utilized in this paper is a turbine with three blades on a turbine aircraft (the three-bladed turbine model illustrated in Figure 6).
Figure 6. The three-bladed turbine model.
Remotesensing 14 03856 g006
2.
Set variables such as radar pulse repetition frequency (PRF), rotational speed, rotation time, and other parameters. The simulation parameters of the three-bladed turbine in different frequency bands are reflected in Table 1.
3.
Set the frequency, add the plane-wave excitation, and set the angle of view.
4.
Set the far field, and output the out file.
5.
Set the algorithm using PO-only illuminated from the front algorithm to improve the accuracy of the electromagnetic calculation.
6.
Set the mesh and the global solution method. Coarse is adopted to improve the calculation speed, the triangular mesh is selected, and the global algorithm MLFMM is set.
7.
To achieve the effect of blade rotation, set the model rotation according to the previously defined variable rot = (k − 1) × drot. The rotation angle changes as k changes. The parameter optimization function in OPTFEKO is utilized to alter the value of k from 1 to ns, where ns is the time of turbine rotation. Submit computing tasks using OPTFEKO.
8.
After the electromagnetic calculation software is finished, the field intensity at each rotation angle is output, which is equivalent to the radar echo signal generated by turbine rotation at every moment. Since the results obtained by the electromagnetic calculation software are not the real field intensity, the MATLAB software is applied to design a reading data program to perform the mathematical transformation on the simulation results to obtain the real radar echo data of the turbine at every moment. Thus, the MATLAB software is used to read out the radar echo value of each time in turn and splice it into an echo sequence. Then, the radar echo sequence under slow time can be obtained.
9.
Sketch the time–frequency distribution of the STFT-transformed echo signal.

4.2. Analysis of the Micro-Doppler Features of Turbine Blades

The simulation results of three frequency bands for the three-bladed turbine are displayed in Figure 7. The odd-bladed turbine generates asymmetric Doppler graphs around the zero frequency, which is consistent with the formula derived theoretically.
In Figure 7a, it can be seen that the three blades have two scintillation phenomena, and a straight line with zero frequency can be seen in Figure 7, which is caused by the stationary hub of the turbine.
Comparing the four simulation images, when using the radar in the 3 GHz frequency band (Figure 7a), the Doppler curve of the echo obtained is not apparent in the time–frequency distribution, while when using the radar in the THz frequency band (Figure 7b–d) an apparent sinusoidal Doppler curve can be seen.
Compared with Figure 7a,b, when the radar carrier frequency rises from 3 GHz to 120 GHz, the maximum Doppler frequency shift increases from thousands of hertz to tens of thousands of hertz, signifying that under the conditions of the same rotational speed and blade length, the higher the radar carrier frequency, the stronger the micro-Doppler effect. Comparing Figure 7b,c, the longer the helicopter blade, the more pronounced the micro-Doppler features. In spite of the fact that Figure 7c,d are both in the terahertz band, the micro-Doppler map obtained via radar detection at the center frequency of 220 GHz is crisper, but necessitates a relatively large PRF.
Accordingly, the micro-Doppler effect of the blade obtained by the THz radar is stronger, making it easier to identify the presence of the target. Meanwhile, the micro-Doppler image is more intuitive, achieving the precision identification of the turbine target.

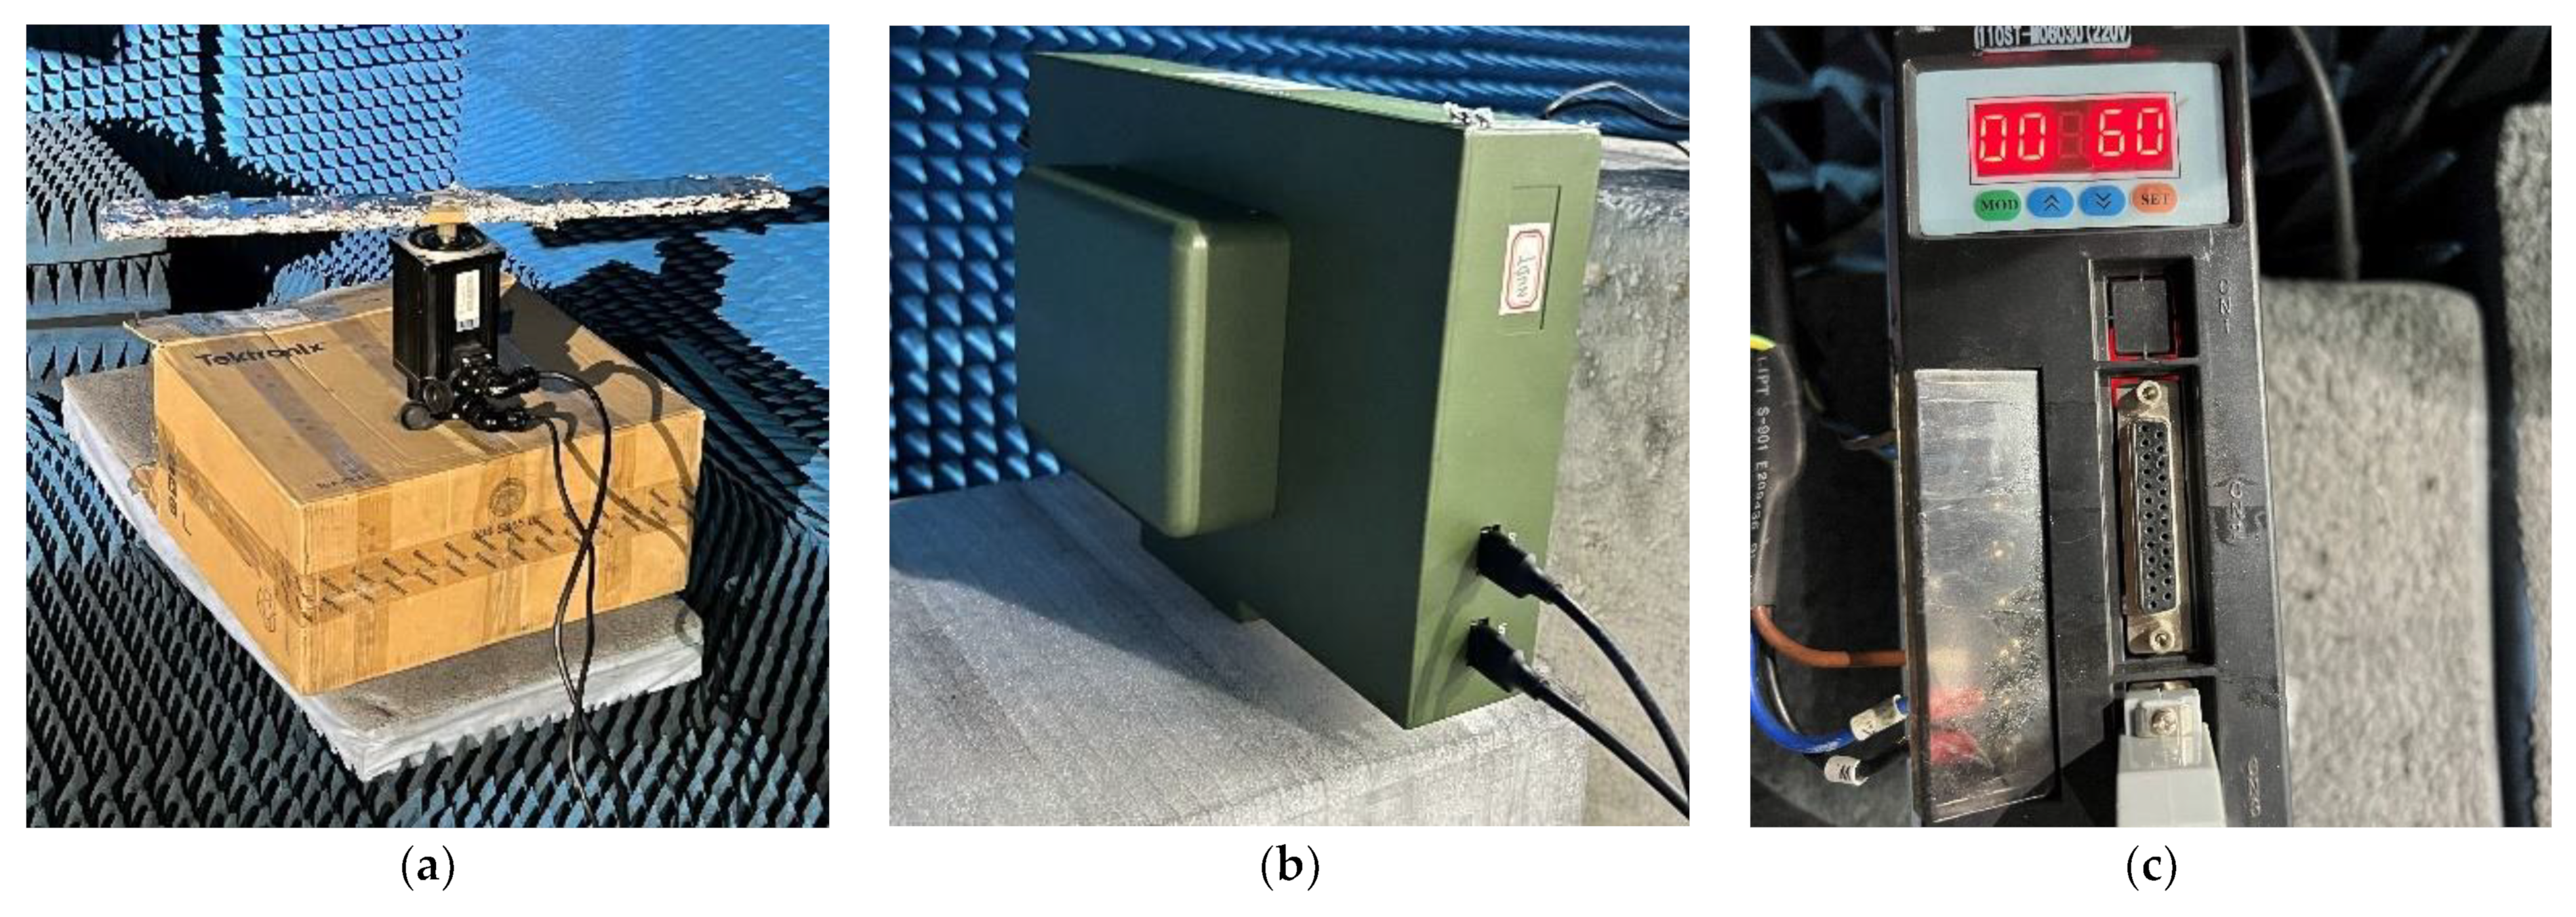
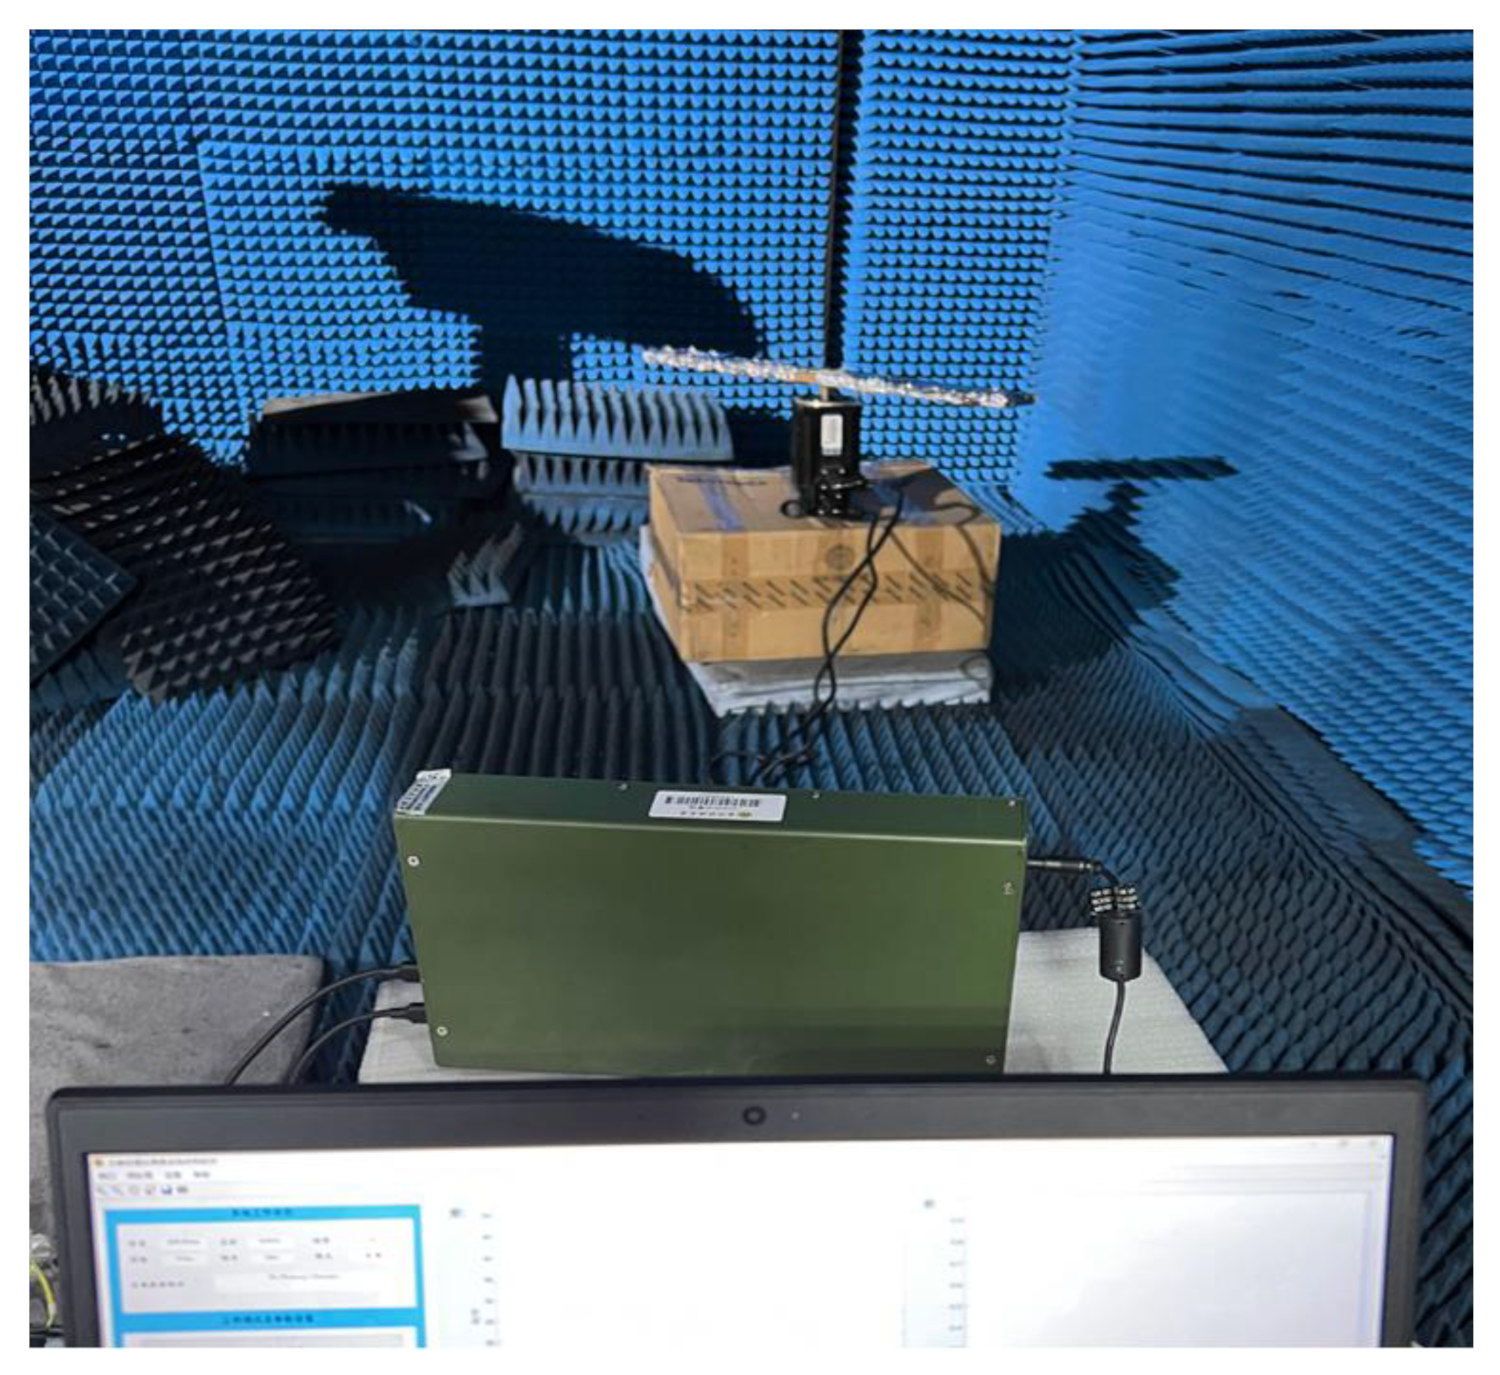
5. Micro-Motion Measurement Experiment Results of a Helicopter Rotor Model

5.1. Experimental Simulation

The micro-motion simulation device is shown in Figure 8. The motor was mainly utilized to realize the simulation of target rotation, and its speed range was controllable within 1–300 r/min. The target was a two-bladed helicopter rotor model wrapped in tinfoil, and the radar adopted FMCW radar with a center frequency of 120 GHz.
To verify the theory of the blade echo features of the two-bladed helicopter, we applied the experimental device mentioned above to conduct a measured experiment, and the whole experimental scene is shown in Figure 9. To decrease noise interference and obtain comparatively pure echo data, the experiment was carried out in a dark room covered with absorbing materials. The rotor target rotated parallel to the ground under the drive of the motor, and the radar emitted electromagnetic waves towards it. The specific experimental parameters are illustrated in Table 2.

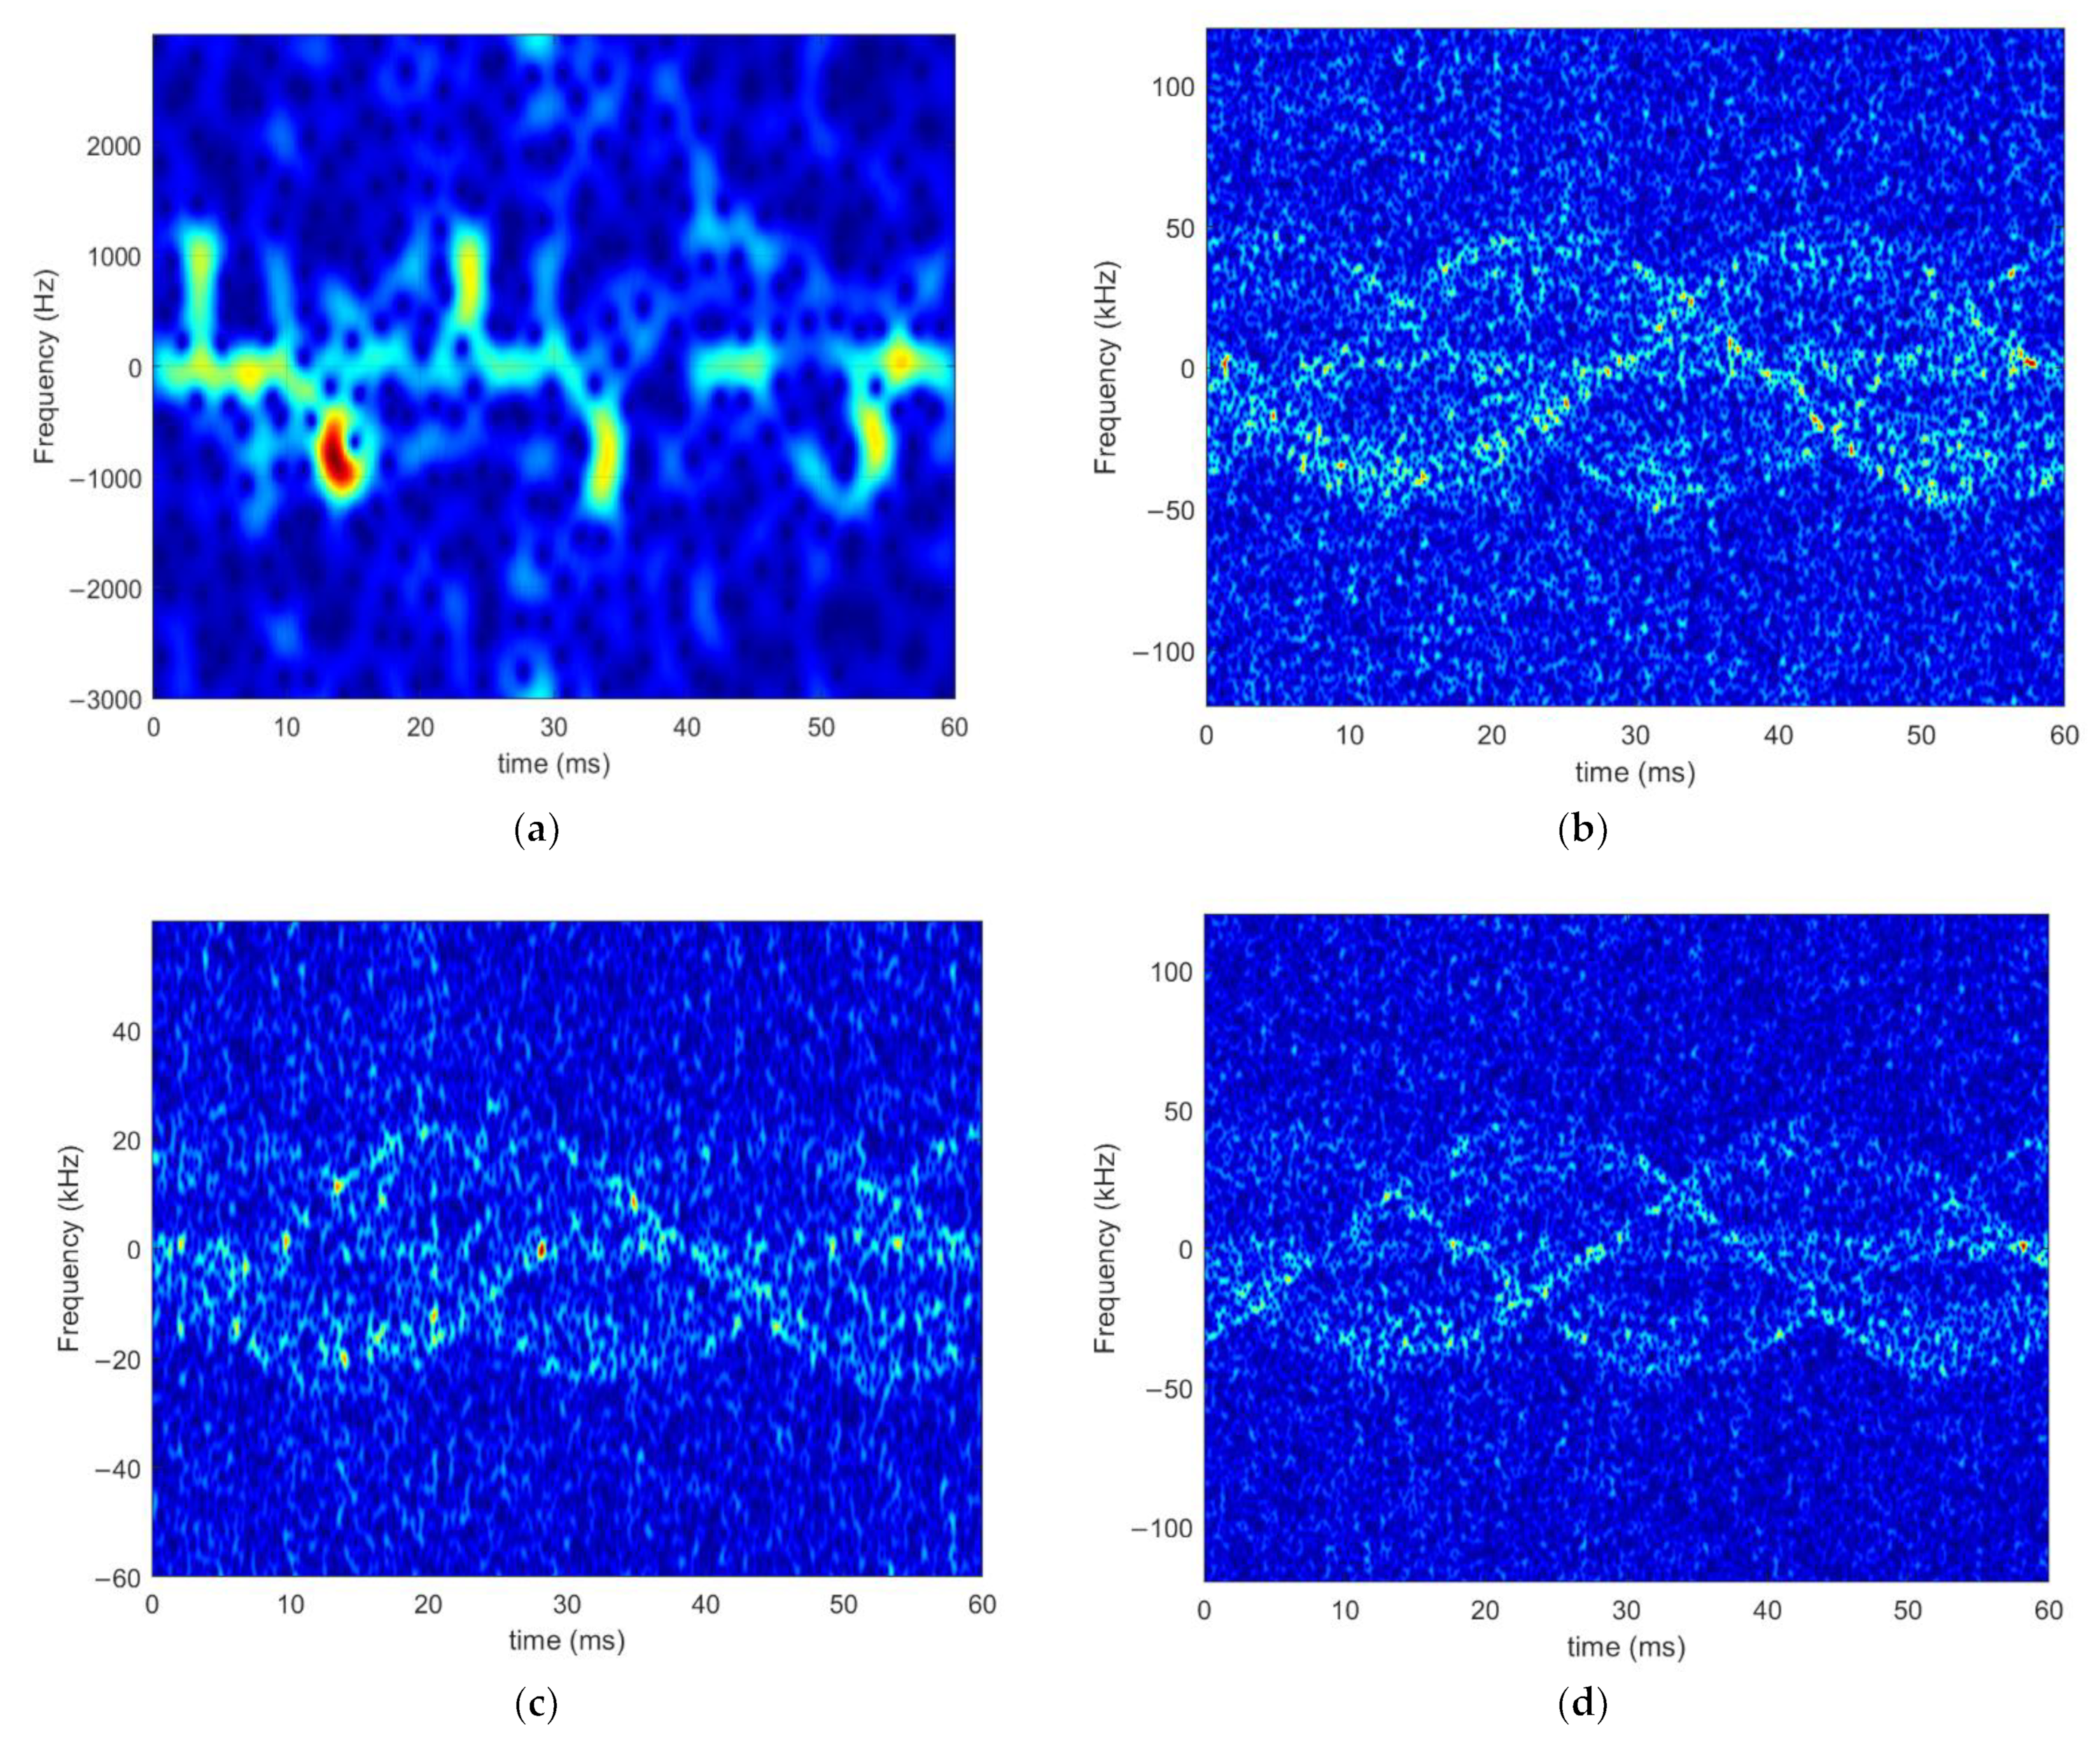
5.2. Analysis of the Micro-Doppler Features of the Helicopter Rotor Blades

Figure 10 shows the Doppler spectra generated by the rotation of the two-bladed rotor at different speeds. Both panels show symmetric sinusoidal Doppler patterns around the zero frequency. It can be seen that the experimental results of the two-bladed helicopter rotor are consistent with the theoretical results.
When the radial velocity direction of the blade is at the radar line of sight—that is, when the blade is facing the radar horizontally—we can generate the maximum Doppler frequency shift. There are millions of scattering points on the blade in the rotation, and each scattering point’s distance from the center of rotation is different, as is the corresponding radial velocity. Therefore, they form a bunch of sine curves with different amplitudes. In the position of the peaks and troughs, many strong points appear, and these strong points add up to form a bright line, as reflected in Figure 10a,b.
Due to the low rotational speed and the small number of sampling points obtained by sweep frequency, the micro-Doppler effect on the blade is relatively weak and close to the intensity of background noise, causing it to be nearly submerged in the background noise. Therefore, only a weak sinusoidal envelope and bright lines formed at the peaks and troughs of waves can be observed. Consequently, it is urgent to extract the micro-Doppler features from these weak time–frequency images to determine the relevant micro-motion parameters of the helicopter rotor.

6. Discussion

6.1. Turbine Parameter Extraction

Firstly, Gaussian white noise with SNR of 5 dB and 0 dB was added to the echo signals simulated by the turbine model with a blade length of 0.55 m and the radar in the 120 GHz frequency band, respectively. Since the turbine model contains obvious blade tips, we extracted the turbine parameters based on wavelet enhancement and the inverse Radon transform algorithm proposed in Section 3.2. According to Figure 11 and Figure 12, the micro-Doppler curve enhanced by the wavelet coefficient was considerably improved compared with the previous fuzzy curve containing noise.
As illustrated in Figure 13, when the SNR is 5 dB and 0 dB, the position of the second peak value appears at 60.0042 ms. Therefore, the estimated rotational speed of the three-bladed turbine is 16.666 r/s, and the error is only 0.007% compared with the speed set in the simulation. The relative error is far less than 1, and the estimation result is comparatively precise.
The inverse Radon transform was applied to the time–frequency distribution after enhancement of wavelet coefficients, and four bright spots were obtained. In the resulting figure of inverse Radon transform, the number of highlights represents the number of sinusoids in the original image. Therefore, the highlight in the center of the figure was generated by the stationary hub, and the three surrounding highlights were obtained by mapping the three corresponding sinusoids caused by the blade tips of the rotating turbine.
The amplitude estimation results based on inverse Radon transform are displayed in Figure 14. When the SNR is 5 dB, the average amplitude of the three sinusoidal curves can be estimated to be 24.12 kHz according to the inverse Radon transform mapping formula. At this point, the maximum Doppler frequency shift generated by the rotating blades of the turbine is 24.12 kHz, and the estimated length of the blade is 0.504 m. When the SNR is 0 dB, the average amplitude of the three sinusoidal curves is estimated to be 23.93 kHz. At this point, the maximum Doppler frequency shift generated by the rotating blades of the turbine is 23.93 kHz, and the estimated length of the blade is 0.500 m. In both cases, the relative errors of the maximum Doppler frequency shift are 8.3% and 9.0%, and the relative errors of the blade length are 8.4% and 9.1%, respectively, within the permissible range. Nonetheless, after the SNR falls below 5 dB, the estimation errors of the turbine parameters using wavelet-based coefficient enhancement sharply increase, and the continued improvement of this algorithm will remain the focus of subsequent work.
The turbine micro-motion parameter estimation results are shown in Table 3, and the error curves of the turbine parameter estimation are shown in Figure 15.

6.2. Extraction of Helicopter Rotor Parameters Based on Fitting Time–Frequency Distribution

Considering that the helicopter rotor model utilized in the experiment belongs to the type without an obvious blade tip structure, the fitting algorithm based on the time–frequency distribution proposed in Section 3.3 was applied to extract the micro-Doppler features of the rotating helicopter blade.
The discrete blade tip time–frequency curve matrices N1 (x, y) and N2 (x, y), extracted from the time–frequency spectrum of two groups of rotating helicopter blade echoes with different rotation rates, are illustrated in Figure 16.
Fit the discrete time–frequency curves N1 (x, y) and N2 (x, y). As shown in Figure 17a, when the rotor speed is 1 r/s, the fitting curves are y11 = 1359.6 sin (6.209x − 3.049) and y12 = 1357.3 sin (6.212x + 0.0425). Therefore, the estimated average maximal Doppler frequency shift is 1358.45 Hz, and the rotational speed is 0.991 r/s.
As shown in Figure 17b, when the rotor speed is 1.5 r/s, the fitting curves are y21 = 2091 sin (9.386x + 3.111) and y22 = 2097 sin (9.363x − 0.021). Therefore, the estimated average maximal Doppler frequency shift is 2094 Hz, and the rotational speed is 1.492 r/s.
The maximal Doppler frequency shifts obtained by the theory are 1507.96 Hz and 2261.95 Hz; therefore, the relative errors are 9.9% and 7.4%, respectively. Meanwhile, the relative errors of the rotational speed between the estimates and the settings are 0.90% and 0.53%, respectively. According to the estimated value of the maximum Doppler frequency shifts obtained by the fitting curves, the blade length can be calculated to be 0.273 m and 0.279 m, and the relative errors between the estimates and the settings are 9.0% and 7.0%, respectively. The relative errors are much less than 1, which is acceptable. The helicopter rotor micro-motion parameter estimation results are displayed in Table 4.

7. Conclusions

A method for extracting the micro-motion feature parameters of an aircraft target rotating structure in the THz band, with high accuracy, is proposed in this paper. Considering the micro-motion of the turbine and rotor-wing rotation in the aircraft, firstly, the micro-motion characteristic model of the rotor-wing target is established, and the echo features of the rotating micro-motion target are deduced theoretically. Subsequently, electromagnetic calculation software is utilized to simulate the three-bladed turbine model in different frequency bands and parameters, and short-time Fourier transform is utilized to extract the time–frequency features. Then, enhancement of wavelet coefficients is applied to strengthen the time–frequency distribution of the turbine echo data under conditions of low SNR. The micro-motion characteristics of the turbine target are estimated using the inverse Radon transform and autocorrelation algorithm. Finally, a radar with a center frequency of 120 GHz is utilized to experiment with the rotor model of the two-bladed helicopter in a low-SNR environment. The micro-Doppler pattern of the rotor blade tip is recovered by fitting the data of the time–frequency distribution, and the micro-motion parameters of the rotor target are also obtained.
The results demonstrate that the micro-Doppler effect in THz frequency is significantly enhanced compared to microwave frequency; the sinusoidal envelope is also more visible, and richer details of the blades can be observed, which can provide essential features for aircraft target identification. Meanwhile, this confirms the superiority in the field of the target detection capabilities of THz radar. At the same time, the proposed algorithm has high parameter-extraction accuracy and excellent anti-noise performance.

Author Contributions

Conceptualization, X.Q.; data curation, X.Q.; formal analysis, X.Q.; funding acquisition, B.D. and H.W.; investigation, X.Q.; methodology, X.Q.; project administration, B.D. and H.W.; resources, X.Q. and B.D.; software, X.Q.; validation, X.Q.; visualization, X.Q.; writing—original draft, X.Q.; writing—review and editing, X.Q. and B.D. All authors have read and agreed to the published version of the manuscript.

Funding

This research was supported by the National Natural Science Foundation of China (No. 61871386, 61971427, 62035014, 61921001).

Data Availability Statement

Not applicable.

Conflicts of Interest

The authors declare no conflict of interest.

Abbreviations

The Definition of Each Parameter in Section 2
ParametersDefinition
αThe azimuth angle of the incident wave.
βThe pitch angle of the incident wave.
f0The central frequency of the radar.
λThe wavelength of the radar.
R0The distance from the radar to the center of the helicopter propeller.
ΩThe angular velocity of the helicopter propeller’s rotation.
vThe radial velocity of the helicopter propeller’s rotation.
x0The horizontal coordinates of the scattering point P at the initial moment.
xtThe horizontal coordinates of the scattering point P at time t.
y0The vertical coordinates of the scattering point P at the initial moment.
ytThe vertical coordinates of the scattering point P at time t.
lPThe distance of point P from the center of the propeller.
RP0The distance from the radar to point P on the helicopter propeller at the initial moment.
RPtThe distance from the radar to the point P on the helicopter propeller at time t.
φ0The rotation angle at the initial moment.
φtThe rotation angle at time t.
z0The height of the helicopter propeller.
NThe number of propeller blades.
LThe length of the propeller blade.
The Full Meanings of the Abbreviations Mentioned in This Paper
AbbreviationFull Name
THzTerahertz
SNRSignal-to-noise ratio
STFTShort-time Fourier transform
WVDWigner–Ville distribution
RCSRadar cross-section
EMCElectromagnetic compatibility
MOMMethod of moments
MLFMMMultilevel fast multipole method
FEMFinite element method
POPhysical optics
LE-POLarge-element physical optics
PRFPulse repetition frequency
FMCWFrequency-modulated continuous wave

References

  1. Yang, Q.; Deng, B.; Wang, H.; Qin, Y. Advancements in Research on Micro-motion Feature Extraction in The Terahertz Region. Chin. J. Radars 2018, 7, 22–45. [Google Scholar]
  2. Chen, V.C.; Li, F.Y.; Ho, S.S. Micro-Doppler Effect in Radar-phenomenon, Model and Simulation Study. IEEE Trans. Aerosp. Electron. Syst. 2006, 41, 2–21. [Google Scholar] [CrossRef]
  3. Chen, V.C. Micro-Doppler Effect of Micro-motion Dynamics: A Review. SPIE 2003, 51, 240–249. [Google Scholar]
  4. Chen, V.C.; Li, F.Y. Analysis of Micro-Doppler Signatures. IEE Proc. Radar Sonar Navig. 2003, 150, 271–276. [Google Scholar] [CrossRef]
  5. Chen, H.; Liu, Y.; Li, X.; Guo, G. Analysis of Micro-Doppler and Parameters Estimation. Infrared Millim. Waves 2006, 25, 360–363. [Google Scholar]
  6. Wang, Z.; Luo, Y.; Li, K.; Yuan, H.; Zhang, Q. Micro-Doppler Parameters Extraction of Precession Cone-Shaped Targets Based on Rotating Antenna. Remote Sens. 2022, 14, 2549. [Google Scholar] [CrossRef]
  7. Zhang, Q.; Hu, J.; Luo, Y. Research Progresses in Radar Feature Extraction, Imaging, and Recognition of Target with Micro-motions. Chin. J. Radars 2018, 7, 531–547. [Google Scholar]
  8. Chen, V.C.; Ebrary, I. The Micro-Doppler Effect in Radar, 1st ed.; Artech House: Boston, MA, USA, 2011; pp. 18–27. [Google Scholar]
  9. Mcmillan, R.W.; Trussell, C.W.; Bohlander, R.A.; Butterworth, J.C.; Forsythe, R.E. An Experimental 225 GHz Pulsed Coherent Radar. IEEE Trans. Microw. Theory Tech. 1991, 39, 555–562. [Google Scholar] [CrossRef]
  10. Li, K.; Jiang, W.; Li, X. Micro-motion Feature Analysis and Extraction Methods for Ballistic Targets. Chin. Syst. Eng. Electron. 2010, 32, 115–118. [Google Scholar]
  11. Ai, X.; Zou, X.; Yang, J.; Liu, J.; Li, Y. Feature Extraction of Rotating Target Based on Bistatic Micro-Doppler Analysis. In Proceedings of the 2011 IEEE CIE International Conference on Radar, Chengdu, China, 24–27 October 2011. [Google Scholar]
  12. Xu, Z.; Tu, Z.; Li, J.; Pi, Y. Research on Micro-feature Extraction Algorithm of Target Based on Terahertz Radar. EURASIP J. Wirel. Commun. Netw. 2013, 2013, 77. [Google Scholar] [CrossRef] [Green Version]
  13. Tan, Y.; Wang, H.; Li, L. Target Identification Method Based on Rotor Structure Micro-Doppler Characteristics. Chin. J. Radio Sci. 2013, 28, 50–55. [Google Scholar]
  14. Ma, J.; Dong, Y.; Li, Y.; Li, L.; Yang, J. Multi-rotor UAV’s Micro-Doppler Characteristic Analysis and Feature Extraction. Chin. J. Univ. Chin. Acad. Sci. 2019, 36, 235–243. [Google Scholar]
  15. Song, C.; Zhou, L.; Wu, Y.; Ding, C. An Estimation Method of Micro-movement Parameters of UAV Based on The Concentration of Time-frequency. Chin. J. Electron. Inf. Technol. 2020, 42, 2029–2036. [Google Scholar]
  16. Wang, W.; Zhu, Y.; Tang, Z.; Chen, Y.; Zhu, Z.; Sun, Y.; Zhou, C. Efficient Rotational Angular Velocity Estimation of Rotor Target via Modified Short-Time Fractional Fourier Transform. Remote Sens. 2021, 13, 1970. [Google Scholar] [CrossRef]
  17. Citak, C.; Akdemir, M.; Yumusak, M. Multidisciplinary. Multiobjective Analysis and Optimization for the Design of Missile Jet Vane. In Proceedings of the 17th AIAA/ISSMO Multidisciplinary Analysis and Optimization Conference, Washington, DC, USA, 13–17 June 2016. [Google Scholar]
  18. Marple, S.L. Time-frequency Signal analysis: Issues and Alternative Methods. In Proceedings of the IEEE-SP International Symposium on Time-Frequency and Time-Scale Analysis (Cat. No.98TH8380), Pittsburgh, PA, USA, 9 October 1998. [Google Scholar]
  19. Ma, R.; Liu, W.; Miao, C.; Yang, Z.; Shao, H. The Simulation of Human Walking Micro-Doppler echo and Comparison of Time-frequency Analysis Method. In Proceedings of the 2017 First International Conference on Electronics Instrumentation & Information Systems (EIIS), Harbin, China, 3–5 June 2017. [Google Scholar]
  20. He, J. A Characterization of Inverse Radon Transform on The Laguerre Hypergroup. J. Math. Anal. Appl. 2006, 318, 387–395. [Google Scholar] [CrossRef] [Green Version]
  21. Stankovic, L.; Dakovic, M.; Thayaparan, T.; Popovic-Bugarin, V. Inverse Radon Transform-Based Micro-Doppler Analysis from a Reduced Set of Observation. Aerosp. Electron. Syst. IEEE Trans. 2015, 51, 1155–1169. [Google Scholar] [CrossRef]
Figure 1. Geometry of the radar and the helicopter rotor.
Remotesensing 14 03856 g001
Figure 2. Blade rotation plane sketch.
Remotesensing 14 03856 g002
Figure 3. The micro-Doppler features of rotors with different numbers of blades: (a) The micro-Doppler features of a two-bladed rotor. (b) The micro-Doppler features of a three-bladed rotor.
Remotesensing 14 03856 g003
Figure 4. The parameter-extraction flowchart of helicopter rotors based on fitting of time–frequency distribution.
Remotesensing 14 03856 g004
Figure 5. The flowchart of the turbine blade micro-motion simulation experiment.
Remotesensing 14 03856 g005
Figure 7. Simulation results of three frequency bands for the three-bladed turbine: (a) The simulation result of A. (b) The simulation result of B. (c) The simulation result of C. (d) The simulation result of D.
Remotesensing 14 03856 g007
Figure 8. The micro-motion simulation device: (a) Two-bladed rotor target and motor. (b) FMCW radar. (c) Motor controller.
Remotesensing 14 03856 g008
Figure 9. The scene of the micro-motion simulation experiment.
Remotesensing 14 03856 g009
Figure 10. Experimental results of different rotational speeds of the two-bladed helicopter rotor: (a) Time–frequency distribution of P1. (b) Time–frequency distribution of P2.
Remotesensing 14 03856 g010
Figure 11. Time–frequency distribution of turbine echo (SNR = 5 dB): (a) Before enhancement of wavelet coefficients. (b) After enhancement of wavelet coefficients.
Remotesensing 14 03856 g011
Figure 12. Time–frequency distribution of turbine echo (SNR = 0 dB): (a) Before enhancement of wavelet coefficients. (b) After enhancement of wavelet coefficients.
Remotesensing 14 03856 g012
Figure 13. Period estimation results are based on autocorrelation: (a) The result of autocorrelation-based period estimation at an SNR of 5 dB. (b) The result of autocorrelation-based period estimation at an SNR of 0 dB.
Remotesensing 14 03856 g013
Figure 14. Amplitude estimation results based on inverse Radon transform: (a) Amplitude estimation results based on the inverse Radon transform at an SNR of 5 dB. (b) Amplitude estimation results based on the inverse Radon transform at an SNR of 0 dB.
Remotesensing 14 03856 g014
Figure 15. Error curves of turbine parameter estimation: (a) Relative error of the estimated maximal micro-Doppler frequency shift. (b) Relative error of the estimated blade length.
Remotesensing 14 03856 g015
Figure 16. Blade tip discrete time–frequency curves: (a) Blade tip discrete time–frequency curve of P1. (b) Blade tip discrete time–frequency curve of P2.
Remotesensing 14 03856 g016
Figure 17. Time–frequency curves of the blade tip after fitting: (a) Time–frequency curve of the blade tip after fitting of P1. (b) Time–frequency curve of the blade tip after fitting of P2.
Remotesensing 14 03856 g017
Table 1. Table of simulation parameters of the three-bladed turbine in different frequency bands.
ParameterABCD
Frequency (GHz)3120120220
Blade length (m)1.101.100.550.55
Rotate speed (rpm)1000100010001000
Radar incidence direction θ (°)95959595
Radar incidence direction φ (°)35353535
PRF (kHz)6240120240
Sampling time (ms)60606060
Table 2. Table of parameters of the helicopter rotor micro-motion experiment.
ParameterAB
Rotate speed (r/s)11.5
Blade length (cm)3030
Center frequency of the radar (GHz)120120
Radar incidence direction θ (°)9090
Radar incidence direction φ (°)00
Bandwidth (MHz)40004000
PRF(Hz)50005000
Sample frequency (kHz)500500
Sampling time (s)21.33
Table 3. Estimation results of turbine micro-motion parameters.
SNR = 5 dBSNR = 0 dB
Theoretical micro-Doppler (kHz)26.3126.31
Estimated micro-Doppler (kHz)24.1223.93
Relative error8.3%9.0%
Practical rotational speed (r/s)16.66716.67
Estimated rotational speed (r/s)16.66616.666
Relative error0.007%0.007%
Practical blade length (m)0.5500.55
Estimated blade length (m)0.5040.500
Relative error8.4%9.1%
Table 4. Estimation results of the helicopter rotor micro-motion parameters.
P1P2
Theoretical micro-Doppler (Hz)1507.962261.95
Estimated micro-Doppler (Hz)1358.452094
Relative error 9.9%7.4%
Practical rotational speed (r/s)11.5
Estimated rotational speed (r/s)0.9911.492
Relative error0.90%0.53%
Practical blade length (m)0.30.3
Estimated blade length (m)0.2730.279
Relative error9.0%7.0%
Publisher’s Note: MDPI stays neutral with regard to jurisdictional claims in published maps and institutional affiliations.

