Article

Can Small Industrial Platforms Achieve Large Space Spillover? Identifying the Spatial Spillover Scope of Characteristic Towns Using the Gradient Difference Method

1
School of Public Affairs, Zhejiang University, Hangzhou 310058, China
2
School of Management, Zhejiang Shuren University, Hangzhou 310015, China
*
Author to whom correspondence should be addressed.
Remote Sens. 2022, 14(16), 3851; https://doi.org/10.3390/rs14163851
Submission received: 29 June 2022 / Revised: 5 August 2022 / Accepted: 5 August 2022 / Published: 9 August 2022
(This article belongs to the Section Urban Remote Sensing)

Abstract

:
Characteristic towns represent relatively small industrial platforms, characterized by clear industrial positioning, cultural connotations, tourism, and certain community functions. Determining the spatial spillover scope of characteristic towns is of importance for both spatial decision-making and policy optimization. By using the gradient difference method, this paper aims to determine the spatial spillover scope of characteristic towns in 2014 and 2020. The research is based on the nighttime light data of the first three batches of Zhejiang characteristic towns. The results suggest that (1) there is a spatial spillover phenomenon in Zhejiang characteristic towns; namely, the results of 84 characteristic towns are either consistent or partially consistent with the expected results; (2) there is an inverse S-shaped decreasing trend from the boundary of characteristic towns; the trend rapidly decreases with an increase at the boundary distance of characteristic towns; and (3) characteristic towns are formed around the 1 km core spillover area and 2 km secondary spillover area. Provincial characteristic towns have relatively high maturity and account for 43.86% of the total. They are concentrated in the 1 km range. Compared to previous research, this study was able to accurately identify the spatial spillover scope of characteristic towns using the gradient difference method. Specifically, the spatial spillover scope is concentrated primarily in the core spillover area of 1 km. These findings serve as reference for the adjustment and optimization of characteristic town policies as well as of town’s spatial layouts.

Graphical Abstract

1. Introduction

Since China’s reform, science and technology parks, economic and technological development zones, high-tech development zones, and incubators (innovation centers), have constantly been emerging. All the above institutions provide a crucial incentive for the development of urban industrial clusters and the transformation of industrial structures [1,2,3]. Characteristic towns, which originated in Zhejiang Province, represent relatively small industrial platforms, with clear industrial positioning, cultural connotations, tourism, and certain community functions. The purpose of these towns is to promote industrial development, which results from economic transformation and is guided by industrial upgrading and transformation policies [4,5,6].
In 2015, Zhejiang Province promulgated the opinions of the Zhejiang Provincial People’s Government on Accelerating the Planning and Construction of Characteristic Towns. These suggestions clarified the overall requirements, procedures, policies, and measures for the construction of characteristic towns. Zhejiang characteristic towns do not constitute small towns and are not organized by administrative divisions. Rather, these towns represent micro-industry clusters with characteristic industry positioning and cultural connotations [7,8,9]. In 2016, the Ministry of Housing and Urban-Rural Development, the National Development and Reform Commission, and the Ministry of Finance jointly issued the Notice on Developing the Cultivation of Characteristic Towns. In it, they proposed cultivating about 1000 characteristic towns by 2020. By September 2019, the National Development and Reform Commission had eliminated a total of 897 “problems of characteristic towns,” which were either wrongly used concepts or of low quality. Furthermore, the General Administration of Sport and the Forestry and Grass Administration built 112 characteristic towns, while another 1115 towns were built at the provincial level [10]. As a platform for industrial development, economic growth, talent accumulation, regional up-grading, and urban–rural integration, characteristic towns represent both development space and investment opportunities. Evidently, maximizing the functional effect of characteristic towns is one of their core propositions.
As a spatial organization of emerging industries, characteristic towns effectively combine industrial parks, residential communities, and tourism areas, thus integrating production, everyday life, and ecological development [11,12,13,14,15]. Characteristic towns are also related to new urbanization strategies, rural revitalization strategies, and urban–rural integration development strategies [16,17,18,19,20,21]. By combining “top-down” top-level design with “bottom-up” grass-roots exploration, these towns represent an effective way of promoting new-type urbanization. Moreover, they man-age to integrate different groups and services within a limited space, thus meeting the needs of differentiated groups and providing multi-level public services [22,23].
When describing them, many existing studies focused on the functional orientations of characteristic towns, such as their general induction and experience. These towns are the product of both urban and industrial policies. They represent a space where urban functions and industrial activities are conducted, and where resource elements may be utilized as a “magnetic force” for attracting all types of elements [24,25]. These spaces are restricted by the hierarchical administrative management system. Moreover, the administrative resource allocation system of some of the towns is weak, facing a shortage of funds and talents, as well as lagging infrastructure construction [26,27]. Construction problems of characteristic towns and their development paths have been discussed in the literature [28,29].
Most present studies focused on the planning and construction path of characteristic towns, ignoring systematic and theoretical examination of their spatial effect [30]. With the development of characteristic towns, producing economic space spillover to the surrounding areas is inevitable. This phenomenon enhances the intensity of human activities, leading to local surface temperature increases, biodiversity risks, and other environmental issues. Therefore, it is necessary to quantify the spatial spillover effects of characteristic towns. Characteristic towns are characterized by small areas, wide distribution, and large numbers. Based on traditional research methods, it is challenging to obtain comprehensive and time-sensitive data, making it difficult to accurately assess the spatial spillover effects of characteristic towns [30]. The night-light remote sensing data can detect the night light intensity of the ground in an extensive range and with high time and can effectively represent the intensity of human activities and social and economic development. Nighttime light intensity is an intuitive representation of the strength of social and economic activities in a city and usually decreases with the increase of the distance to the city center [31]. Nighttime light data have been widely used to extract city boundaries [32], describe spatiotemporal patterns of urban expansion by combining indexes such as compactness, sprawl, and intensity of urban expansion [33], and calculate nighttime light increment and evolution characteristics by statistical analysis [34]. Therefore, we try to quantify the spatial spillover effect of the characteristic towns based on nightlight data.
The focus of this paper is the spatial spillover scope of characteristic towns. Its aim is to gather empirical results of the spatial spillover scope based on nighttime light. The planned construction area of Zhejiang characteristic towns is approximately three square kilometers. This paper postulates three research questions. (1) First, it examines whether this micro-industrial agglomeration will produce spatial spillover in the surrounding areas. (2) Consequentially, it investigates how far this spatial spillover scope goes. (3) Lastly, it sees differences in the spatial spillovers of characteristic towns in different town types. The study uses a gradient difference method that has been used to examine the correlation between the development of characteristic towns and surrounding areas, as well as their space-time response to surrounding areas.

2. Materials and Methodology
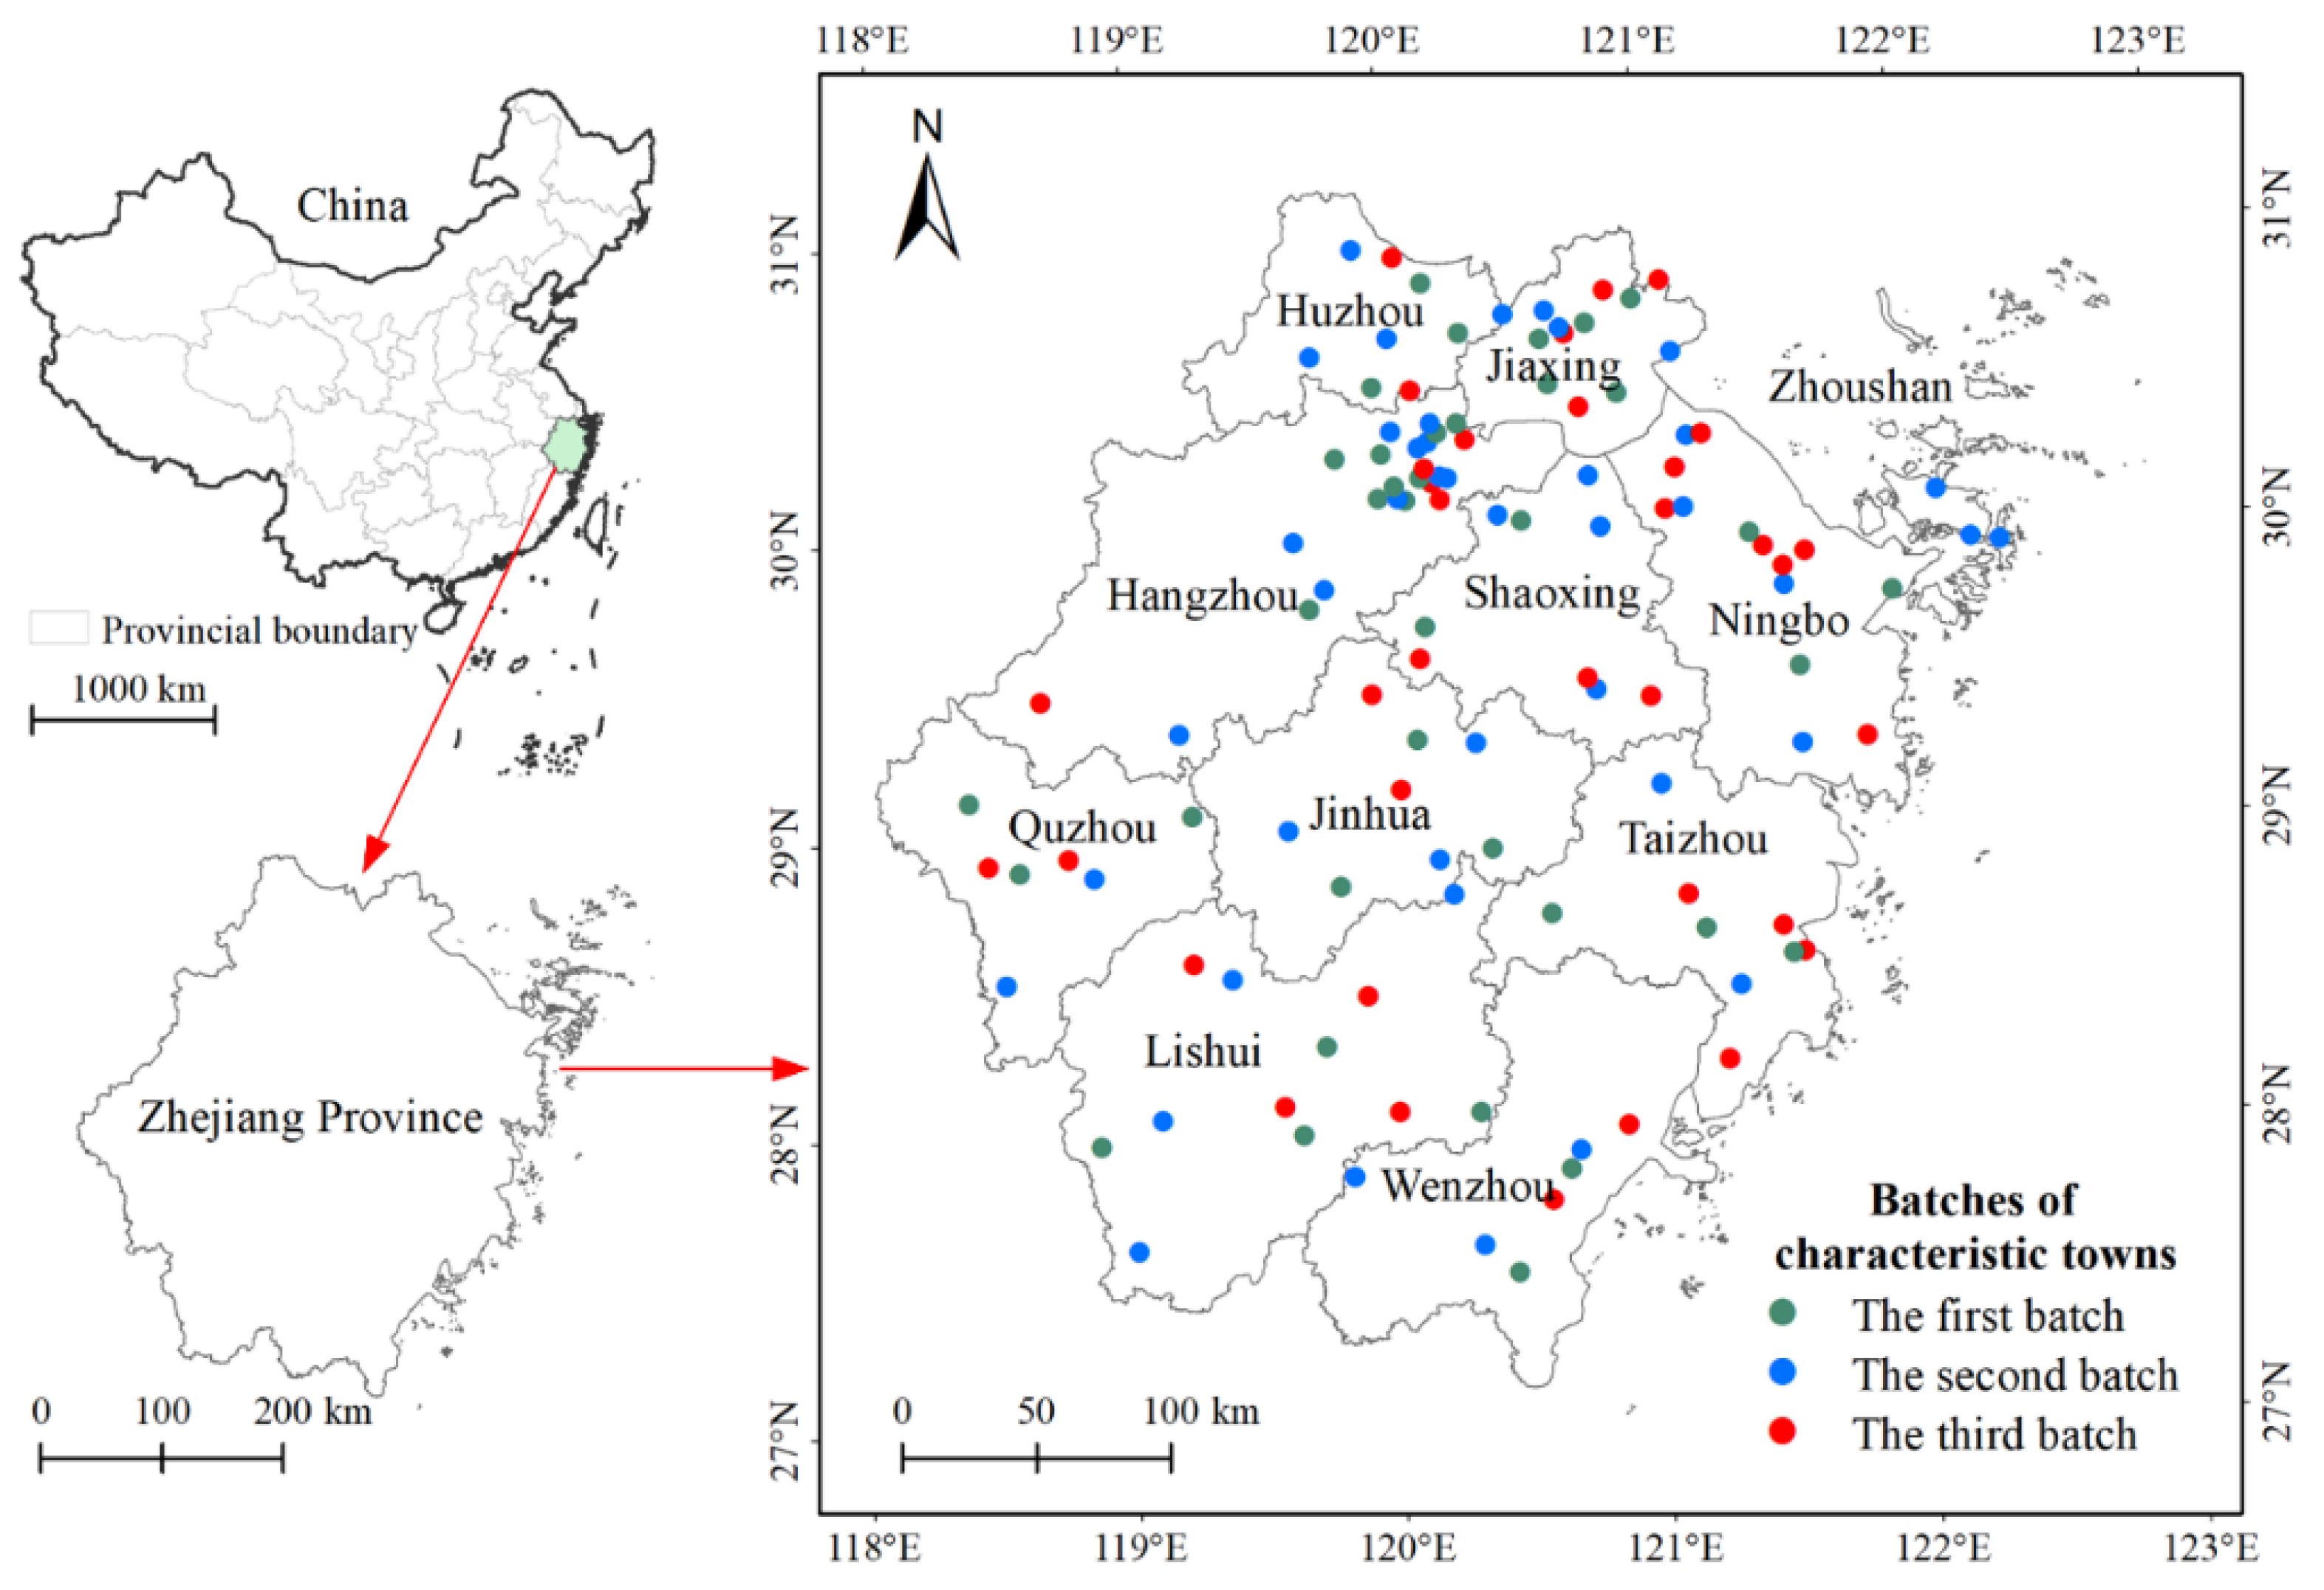
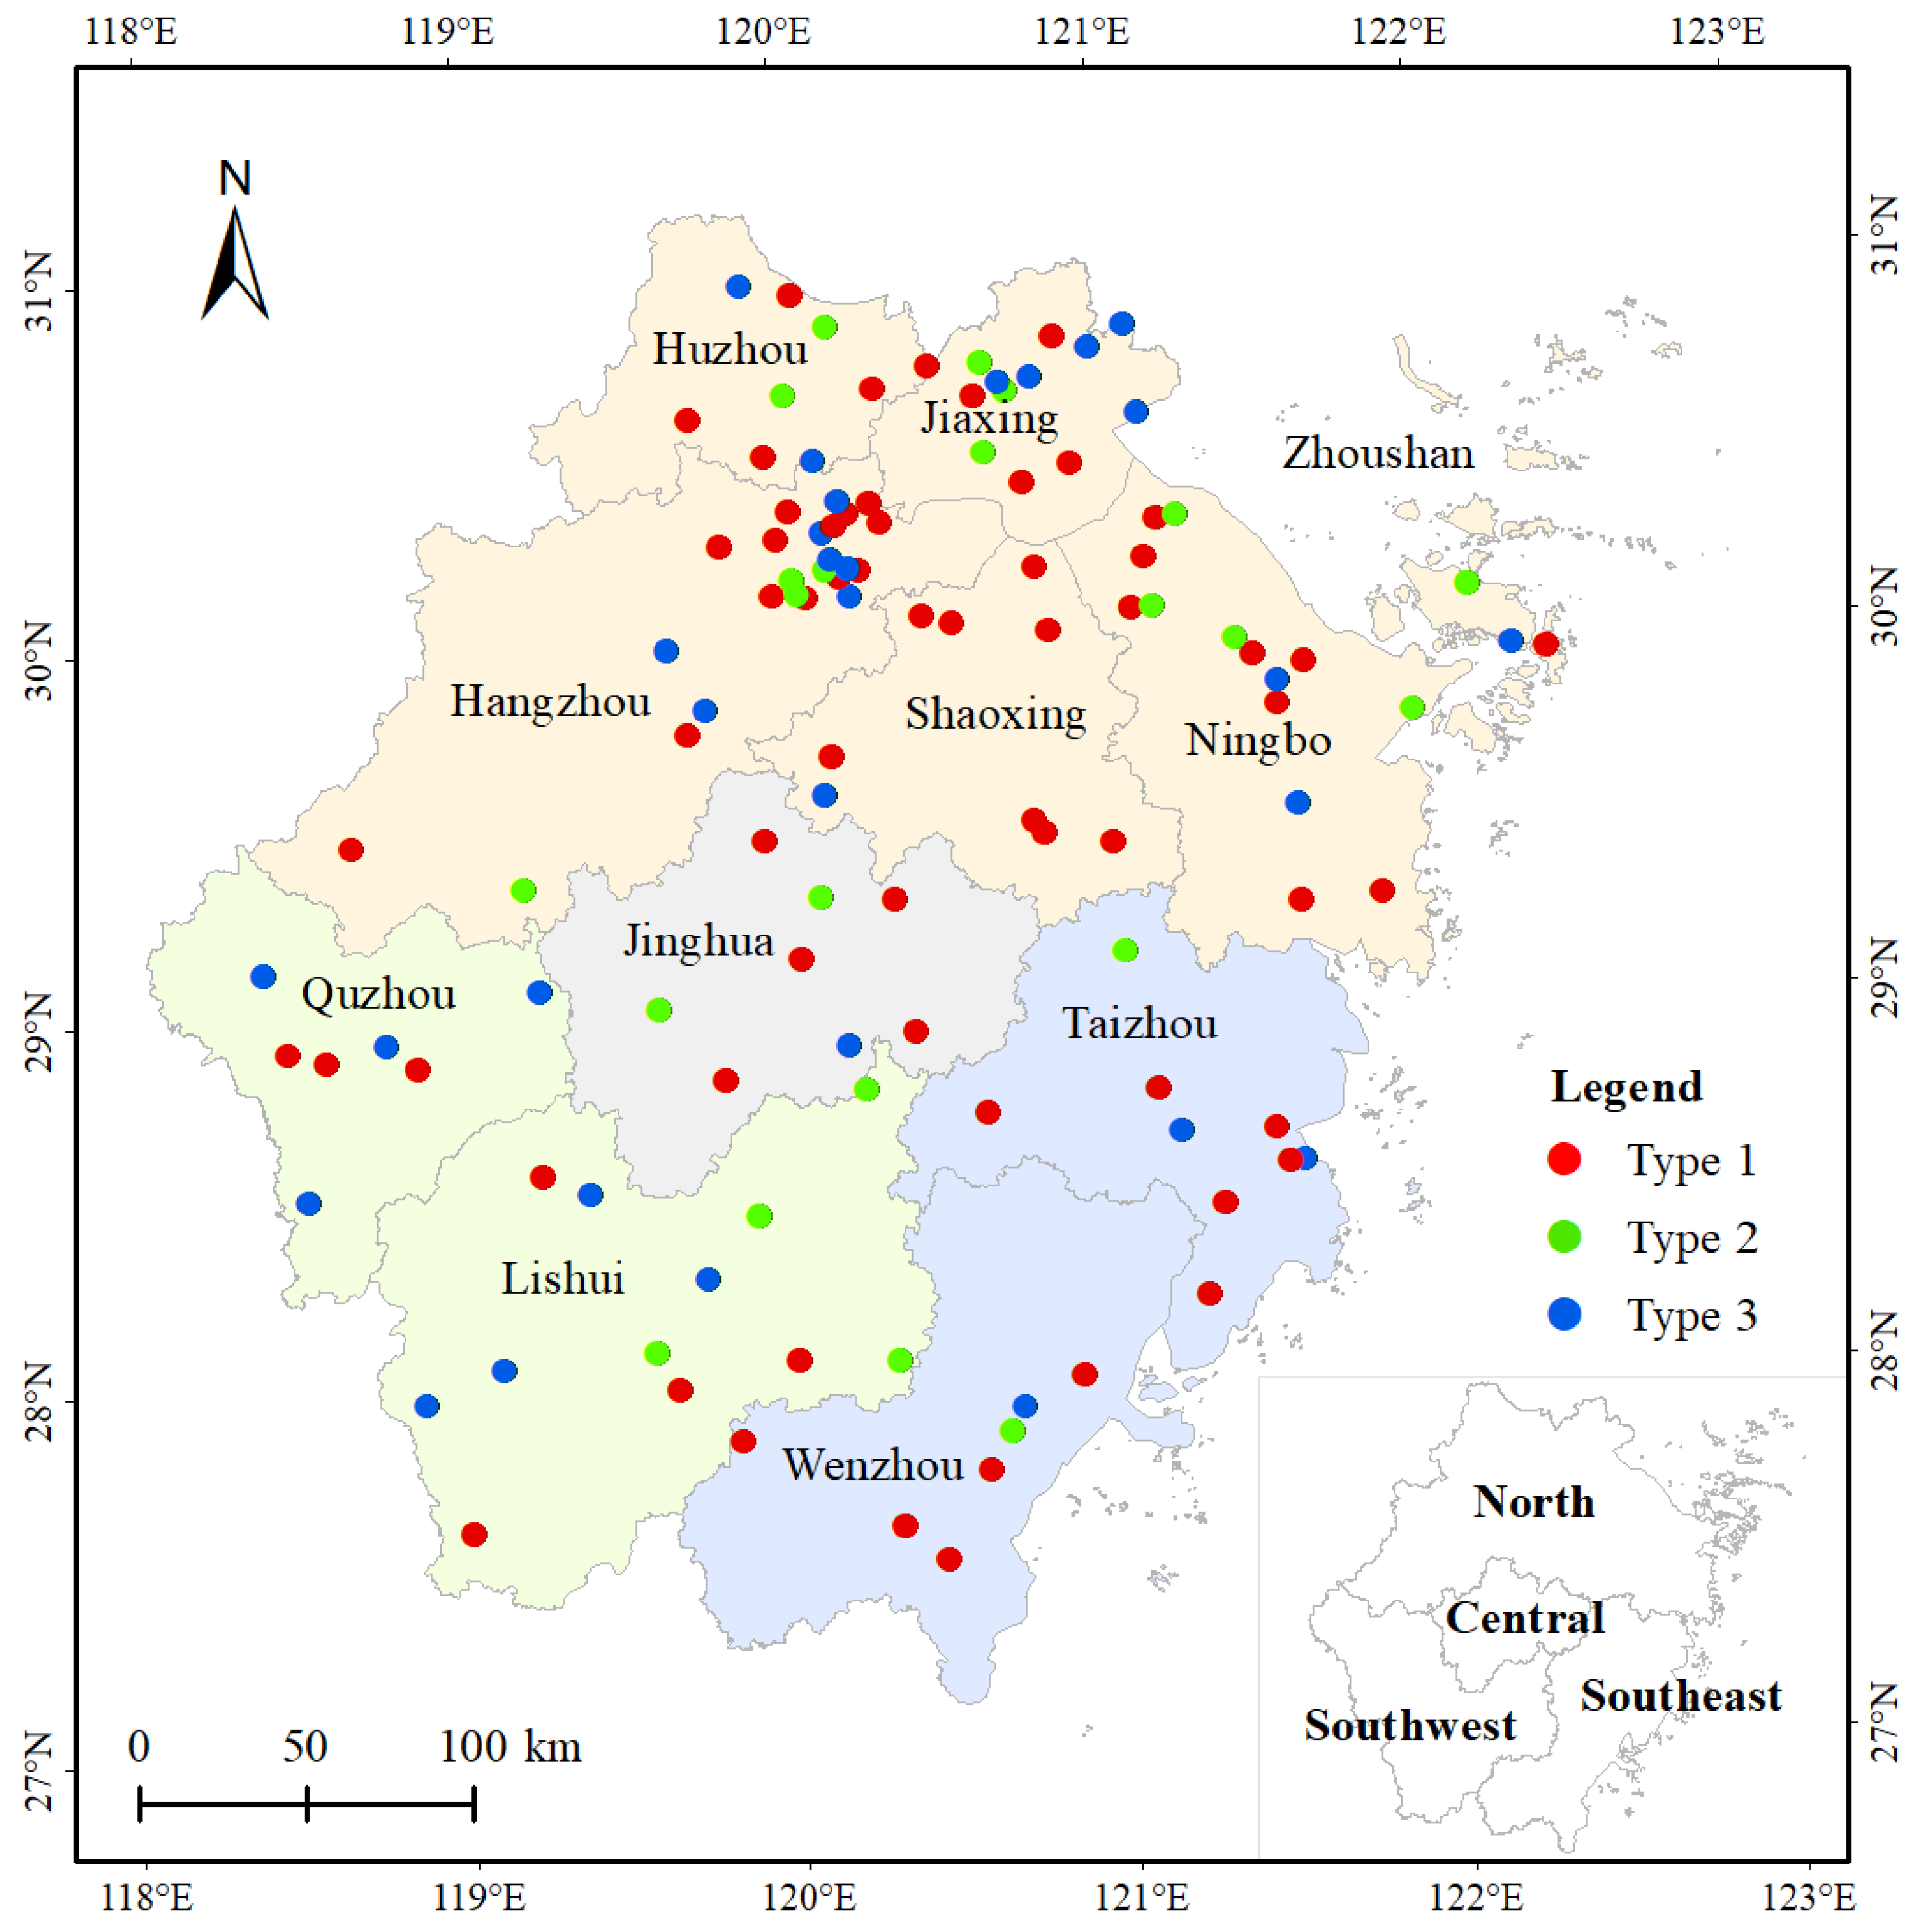
2.1. Study Area

Zhejiang Province was the first to suggest the notion of characteristic towns and has led their establishment across the entire province. In 2014, the “characteristic towns” concept was first implemented at Hangzhou Yunqi Conference. In 2016, the Zhejiang experience attracted attention and response across the country, and top-level designs to promote the planning and construction of characteristic towns were issued from the central to local governments. Characteristic towns need their primary industries, such as the tourism industry, digital economy industry, health industry, and so on. The purpose of creating characteristic towns is to promote the region’s industrial development. By 2019, there were 1225 characteristic towns created and cultivated in 32 provinces, cities, and autonomous regions in China [10]. The characteristic towns in Zhejiang Province are characterized by a long duration of industrial development, abundance of industry types, large numbers and wide distribution, and representativeness. Therefore, this study takes the characteristic towns in Zhejiang Province as the research object.
Following the four procedures of voluntary declaration, batch audit, annual assessment, and acceptance and naming, the province adopted a strict creation method and established characteristic towns. The construction period of characteristic towns is generally 3–5 years. The basic requirements for their construction in Zhejiang Province are provided in Supplementary Materials, Table S1. The Zhejiang characteristic towns system includes provincial named characteristic towns, provincial characteristic towns used to create objects, and provincial characteristic towns used to cultivate objects. A Zhejiang characteristic town adopts the creation system, which means that excellent provincial characteristic towns used to create objects will be upgraded to provincial named characteristics towns (Supplementary Materials, Figure S1).
Zhejiang characteristic towns adhere to the notion of the “three-life integration”: production, life, and ecology and the “four in one” of industry, culture, tourism, and community functions. Furthermore, characteristic towns are suitable not only for high-quality economic development but for the development of high-quality urban and rural areas as well. In 2015, Zhejiang Province formally put forward the construction goal of characteristic towns. Both Figure 1 and Table 1 present the spatial distribution and basic information of the first three batches of characteristic towns.
The first three batches of provincial characteristic towns are selected as the research objects for several reasons. Firstly, their construction cycle is three years. In 2015, Zhejiang Province began building characteristic towns across the entire province. In December 2020, the first three batches of characteristic towns met all the requirements of the construction cycle, whereas other batches were not yet able to meet them. Moreover, after years of construction, the surrounding areas of the first three batches are relatively mature, helping uncover the development process and law of characteristic towns. Second, since 2015, Zhejiang Province has been conducting annual assessments of provincial characteristic towns. The relevant information of these assessments results is detailed, providing an abundance of useful materials for this study. Lastly, there are differences between the various types of provincial characteristic towns. The first three batches cover various types, thus ensuring the comprehensiveness of the research objects. Therefore, the first three batches of characteristic towns are largely able to reflect the construction level of these towns and are thus representative research objects.

2.2. Data Collection

Since nighttime light data were decrypted in 1972, the spatial correlation between light intensity and human activities has been at the forefront of scholastic research [35,36,37,38]. In addition to the national and provincial dimension, the application of light data in smaller geographical units, such as at the city level has also emerged [39,40]. Nighttime light data reflect the range of human activities, with brighter areas indicating more frequent human production and living activities [41,42,43,44].
As the construction area of characteristic towns is relatively small, it is difficult to use traditional methods to accurately measure the spatial spillover of these towns. In this case, remote sensing monitoring technology and nighttime light data have several advantages, including access and update speed, strong anti-interference ability, high resolution, no light spillover, and intuitive reflection of spatial changes, etc. Therefore, this paper uses nighttime light data to study the spatial spillover of characteristic towns. The research calibrates datasets based on Chen et al. (2021) [43]. This study uses the average nighttime light index (ANLI) to study the spatial spillover. The formula is as follows:
T N L I = i = 0 n D N i
A N L I = T N L I n
In the formula above, T N L I represents the total nighttime light index of characteristic towns. Furthermore, D N i denotes the radiation value of each pixel, while n refers to the number of pixels within a characteristic town. The total light intensity or average light intensity of a characteristic town may reflect its lighting characteristics. As the A N L I value rises, so does the development degree of the characteristic towns. Nighttime light data are used to analyze the areas surrounding characteristic towns. Because the implementation year of the characteristic town policy is 2015, data from 2014 are used as reference. The results are then compared with those in 2020.

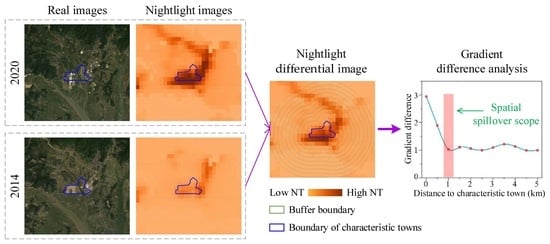
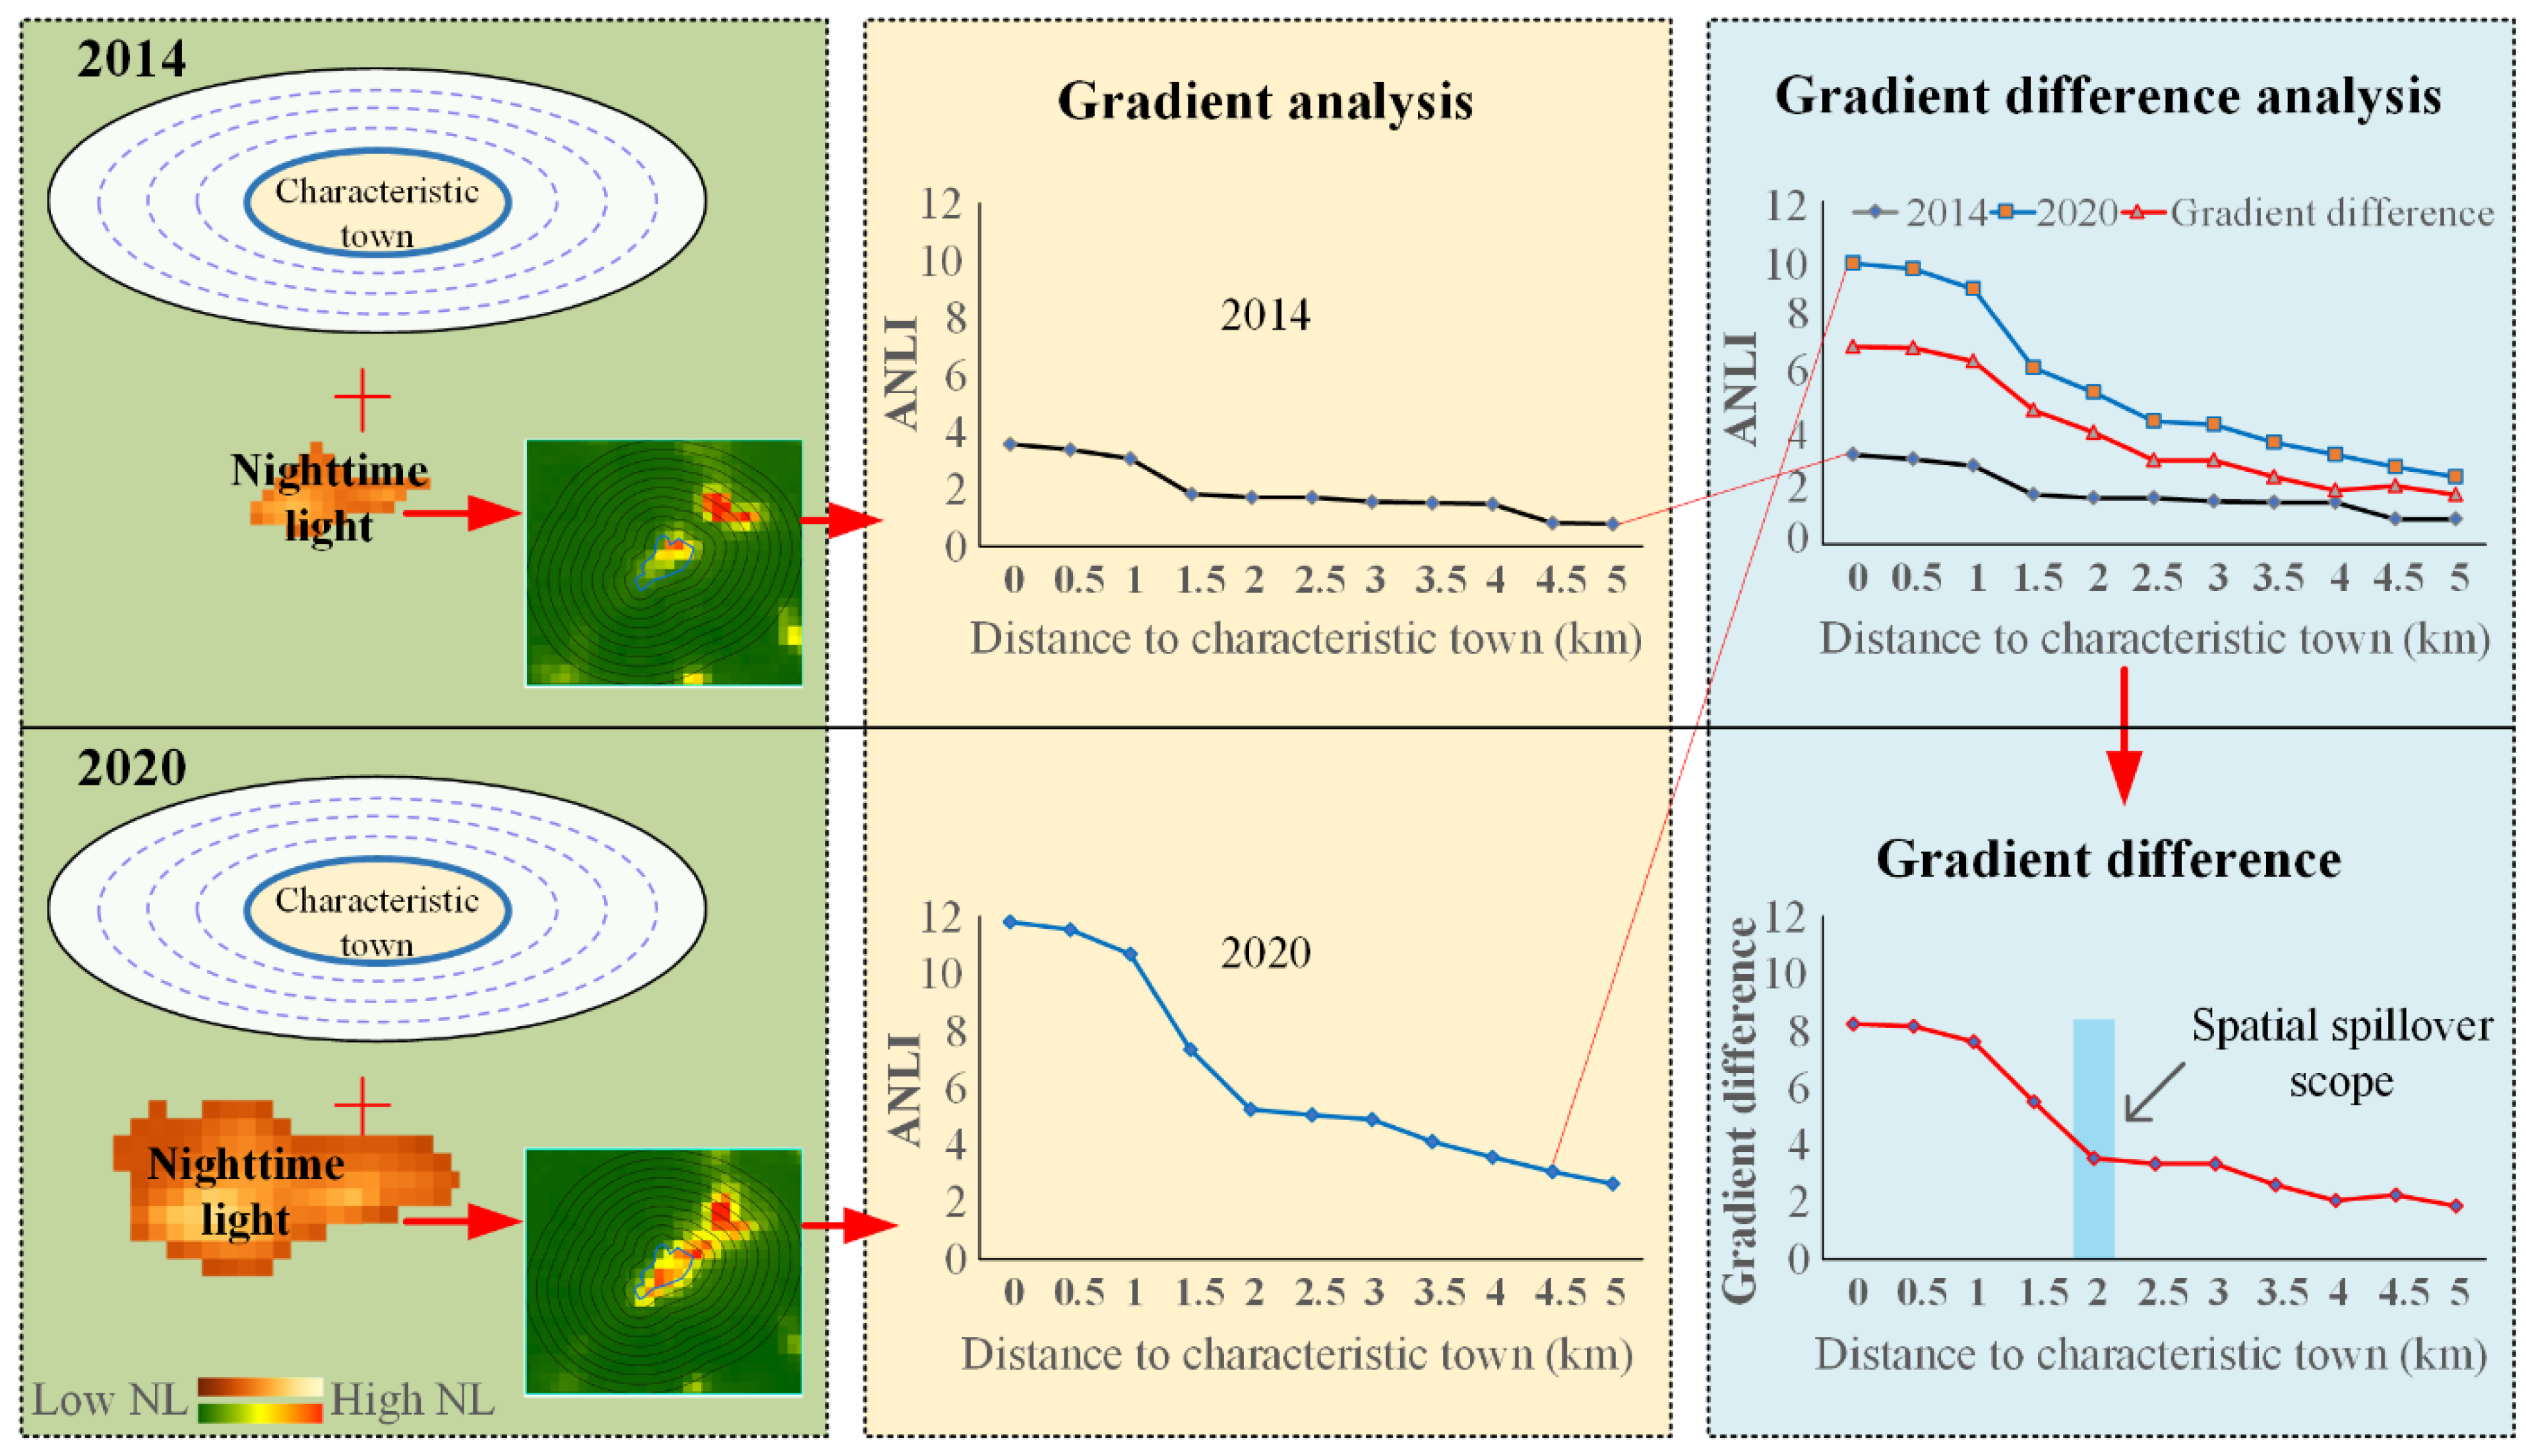
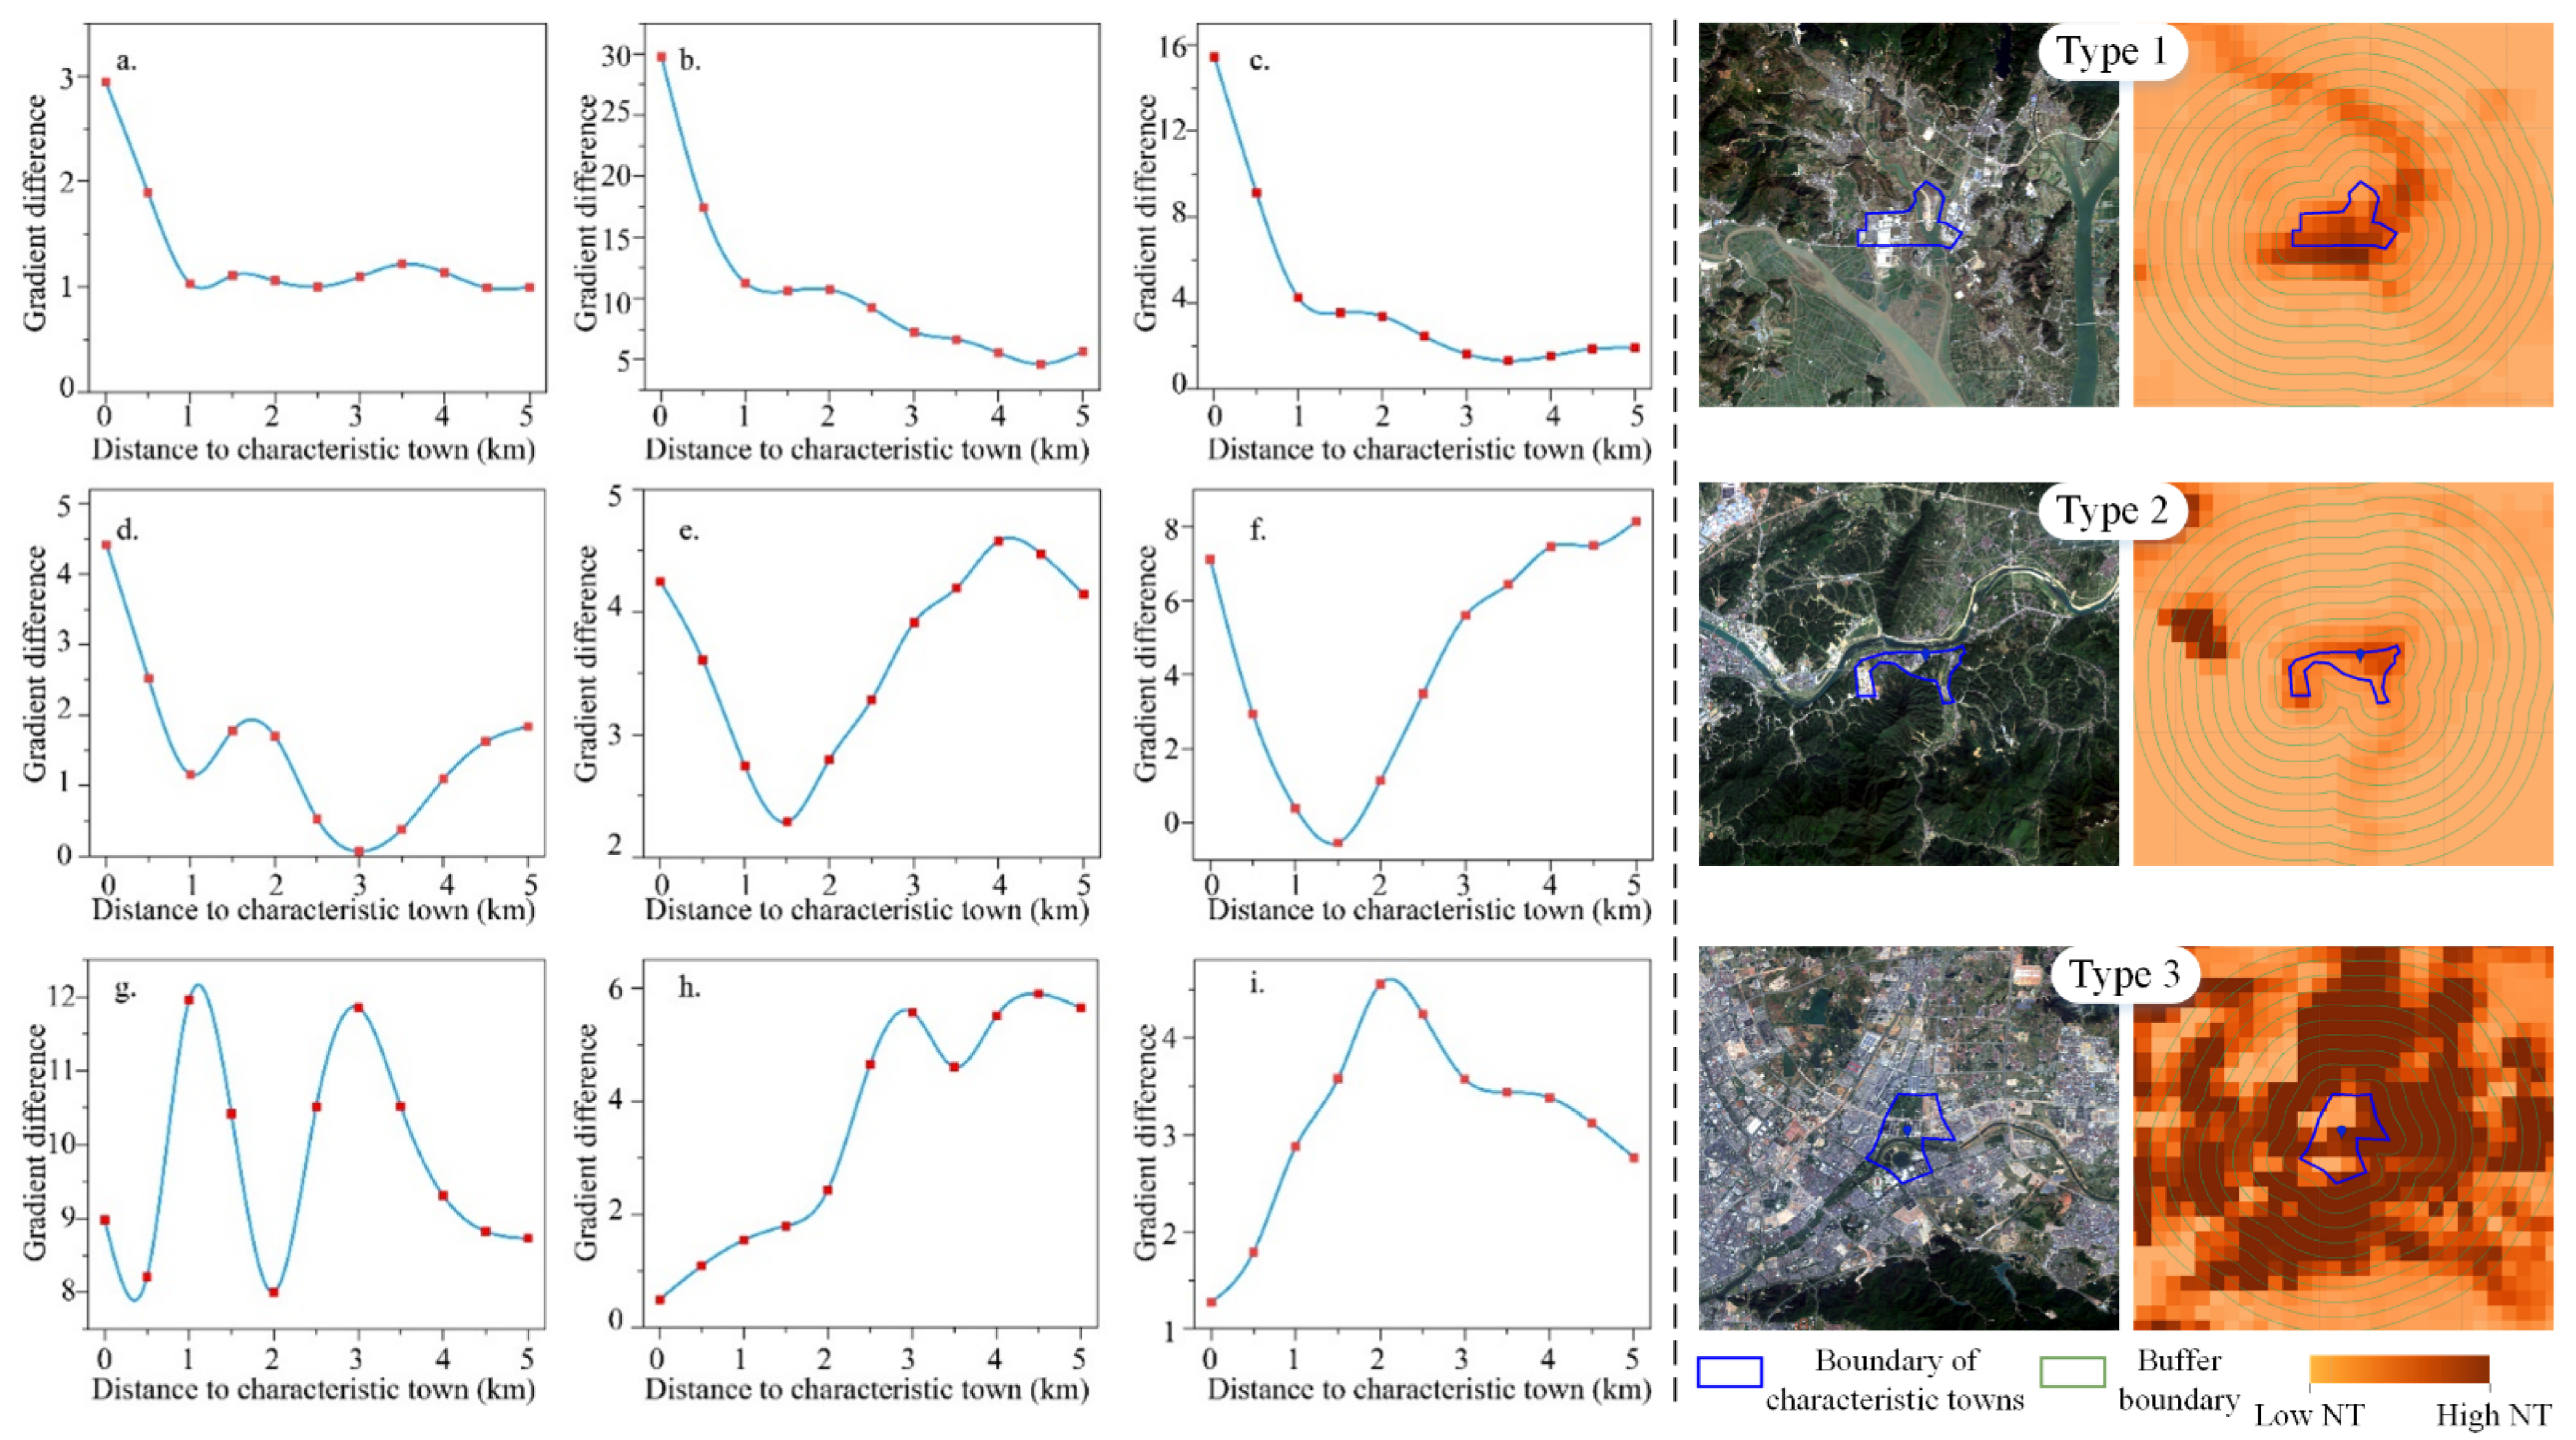
2.3. Gradient Difference Method

This study used the gradient difference analysis method to examine the spillover spatial scope of characteristic towns. Based on this analysis, a gradient difference method is proposed. This type of analysis includes both the section method and circle layer method [44]. The former analyzes pattern changes in several characteristic towns with set directions. On the other hand, the circle layer rule is suitable for studying the macroscopic agglomeration and distribution of characteristic towns. To explore the influence of these towns on the surrounding spatial gradient, this study employs the circle layer method for gradient analysis [45]. The nighttime light value of each circle layer is calculated based on the circle layer structure. This method can resolve the issue of proximity with respect to spatial entities and is thus able to analyze their area of influence.
The gradient difference method uses the difference in the gradient distribution values of two different time nodes, to eliminate the linear trend of growth factors, which can accurately measure the influence range of spatial entities on the surrounding area. This method is also capable of better explaining the function of characteristic towns. Namely, it reduces the risk of over or undervaluing the impact of characteristic towns on the surrounding area.
The study uses the characteristic town area as the boundary and 0.5 km as the interval unit. The interval unit gradually increases and achieves different spatial ranges, spanning from 0.5 km to 5 km, with 0.5 km intervals, only to finally form 10 buffers from the inside to the outside. Because of the characteristic towns policy implemented in Zhejiang in 2015, this paper uses gradient distribution values of nighttime light from 2014 and 2020. The difference between the gradient distribution values for these two periods is used to compare the difference in the spatial spillovers of characteristic towns (Figure 2).

3. Results

3.1. Spatial Spillover Types of Characteristic Towns

3.1.1. The Overall Characteristic of Spatial Spillover Types

When comparing the actual results of the spatial spillover with the expected results, we found that the results of 62 characteristic towns were as expected. Furthermore, the results of another 22 characteristic towns were partially consistent with the expected results, and those of 30 were inconsistent.
Figure 3 reveals that the spatial spillover of characteristic towns forms an inverse S-shaped decreasing trend from the town boundary to the outside. This trend experiences a rapid decrease with the increase of the boundary distance, thus revealing the influence of the construction of characteristic towns on the development of surrounding regions. There are three distinct distribution patterns of nighttime light around characteristic towns. At first, the distribution curve of nighttime light rapidly declined and then slowly declined, reflecting its high centripetal concentration (type 1). This type of spatial spillover effect, noted in Haining sunshine science and technology town (Figure 3a) and Yuhang yishang town (Figure 3b), are as expected. Characteristic towns exhibit a certain centrality in their region. In addition, their spatial spillover is consistent with the rule that the spillover effect gradually decreases with an increase in the town’s boundary distance. This distribution pattern also confirms the fact that characteristic towns exhibit a spatial spillover effect (Figure 3a–c).
Secondly, the undulating morphological characteristics of the local bulge appear at different distances of the town boundary. This reflects the presence of the local agglomeration phenomenon outside the town center and sub-center. In other words, these results of the spatial spillover of characteristic towns are only partially consistent with the expected results (type 2). When surrounding areas influence characteristic towns, they are recognized as part of the spatial spillover. For example, due to the influence of surrounding central areas, the spatial spillover effect of Haining leather fashion town (Figure 3d) is as expected. With their development, provincial characteristic towns interact with their surrounding area. Therefore, the spatial spillover of characteristic towns is partly in line with the expected results (Figure 3d–f).
Thirdly, this paper identified characteristic towns that are inconsistent with the expected results due to the influence of other locations (type 3). Examples of the third type of characteristic towns are Bingjiang internet of things town (Figure 3g) and Changxing new energy town (Figure 3h). In general, the distribution curve of nighttime light shows a slow rise and then rapid rise, indicating that the centripetal concentration of characteristic towns is low. Binjiang internet of things town is closely related to its region. It is greatly affected by the development of surrounding areas, while its spatial spillover effect is not significant. With respect to Changxing new energy town, its area, population and economic scale, and social-economic relations have reached a higher level, achieving a certain maturity, relative to the spatial spillover of characteristics town. The surrounding area of the spatial spillover is more than a zone of characteristic town, rather it results in a large deviation from the expected results (Figure 3g–i).
Based on the spatial spillover types discussed above, this study selects three typical characteristic towns for further empirical analysis. Based on their scope, this paper selects 0.5 km as the buffer distance, which gradually increases, and allows for different spatial ranges (from 0.5 km to 5 km) to be obtained. Finally, 10 buffers, ranging from the inside to the outside are formed. The results are provided in Figure 4.
In general, characteristic towns have a relatively small area, making it difficult to obtain town data, which in turn affects the evaluation results of the spatial spillover effect. After five years of construction and development, the three towns examined by this study appear to directly promote the internal development of characteristic towns, thus also promoting the development of the towns’ surrounding areas. The gradient difference analysis method also proved capable of accurately defining the spatial spillover scope of characteristic towns to surrounding areas, thus avoiding the risk of exaggerated spatial spillover.

3.1.2. Regional Differences of the Spatial Spillover Types

Our study analyzes the overall distribution in the four regions of Zhejiang Province. The results of this analysis are shown in Figure 5. According to Wang, D.X et al., 2020 [46], 11 cities in Zhejiang Province are divided into four regions according to their geographical location: north, central, southeast, and southwest. The north region includes Hangzhou, Jiaxing, Huzhou, Ningbo, Shaoxing, Zhoushan. The central region includes Jinhua, while south Zhejiang includes Wenzhou and Taizhou and southwest includes Quzhou and Lishui.
Figure 5 shows the clustering direction of spatial spillover types in Zhejiang Province. The number of spatial overflow types represents a spatial distribution of “less in the south and more in the north”. This is consistent with the spatial distribution of the number of characteristic towns. The Hangzhou-Jia-Hu region in North Zhejiang was the core area of the province. It was followed by the Southeast Zhejiang, and finally, by Central Zhejiang and southwest of Zhejiang. The above discussed Type 1 is closely related to the industrial distribution of various cities, mostly distributed in the region with clear industrial characteristics.
Table 2 illustrates that the number of Type 1 characteristic towns is the largest. This type is mainly concentrated in Northern and Southeast Zhejiang. The number of Type 1 characteristic towns in these areas is 39 and 11, respectively. Type 3 is predominantly concentrated in North and Southwest Zhejiang, with 18 and 8 towns, respectively. The results suggest that Zhejiang characteristic towns greatly differ among regions. In terms of the proportion of space spillover types, Type 1 is the highest in Southeast Zhejiang, with 68.75%, followed by 62.5% in Central Zhejiang, with the lowest proportion 36.84% in Southwest Zhejiang. The spatial distribution of characteristic towns is mainly concentrated in Southeast Zhejiang and Central Zhejiang. On the other hand, characteristic towns are mostly distributed in the North Zhejiang, especially around Hangzhou Bay, making it an area around which characteristic towns are concentrated. To some extent, the research results reflect the internal differentiation in the construction of characteristic towns in North Zhejiang and that in Southwest Zhejiang, which lags behind.

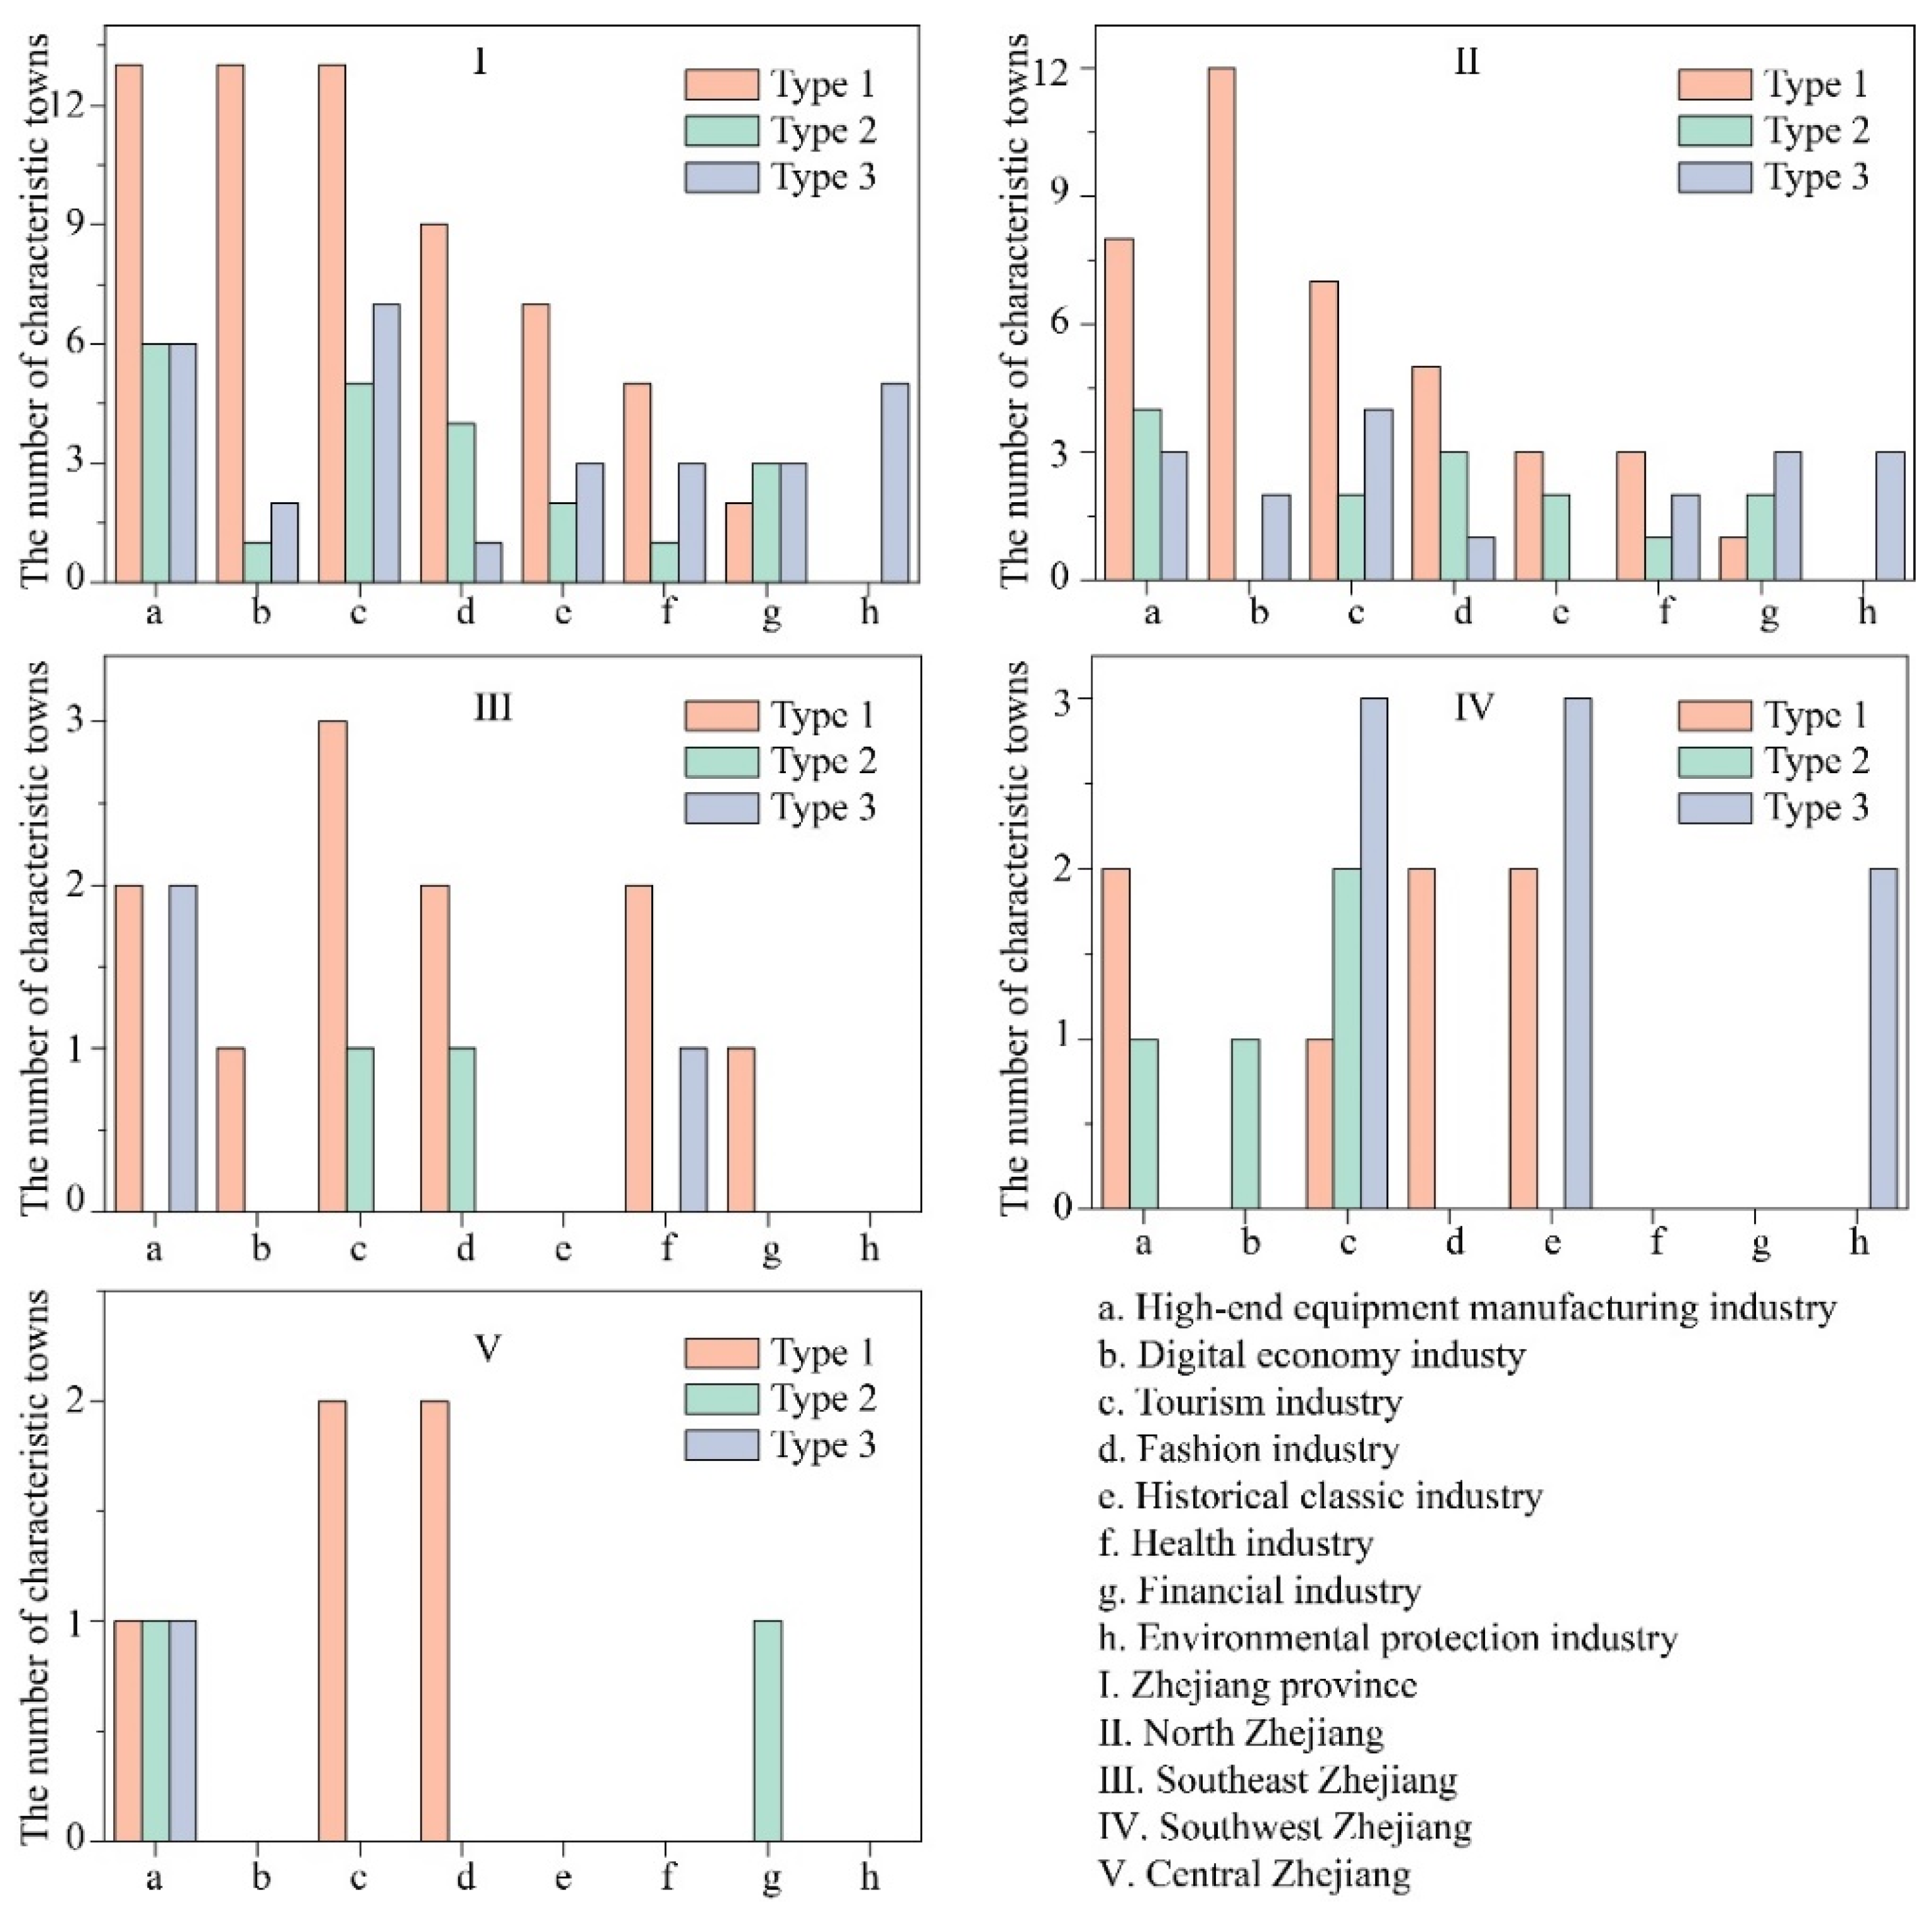
3.1.3. Regional Differences of Spatial Spillover Types in Industrial Types

The industrial types of Zhejiang characteristic towns include the digital economy industry, environmental protection industry, health industry, travel industry, fashion industry, finance industry, high-end equipment manufacturing industry, and the historical classic industry.
As Figure 6 indicates, in Type 1, the number of characteristic towns dominated by high-end equipment manufacturing, digital economy and tourism is 13. By providing new industrial support, the development of the information economy industry in Zhejiang had an important role in establishing characteristic towns. There are 9, 7, and 2 characteristic towns with industrial base and historical heritage positioned as fashion, historical classics, and health industries, respectively. In Type 3, the number of characteristic towns with a developed tourism industry is the largest, namely 7. Furthermore, there are 6 and 5 characteristic towns with high-end equipment manufacturing and environmental protection industries, respectively. Within the categories of health, environmental protection, fashion, and history, the distribution density of these towns is between those of the aforementioned industrial types.
This study also considers the industrial types of four regions in Zhejiang Province. With respect to them, Figure 6 shows that the spatial spillover types of characteristic towns exhibit clear regional differentiation. For North Zhejiang, characteristic towns are mainly local in this region, the main industrial types are high-end equipment manufacturing, tourism, and digital economy. The number of Type 1 characteristics towns with a developed digital economy industry is 12, the largest. In addition, there are 8 and 7 characteristic towns with developed high-end equipment manufacturing and environmental protection industries. With respect to Type 3 characteristic towns, the number of towns with a developed tourism industry is the largest, meaning 4.
In Southeast Zhejiang, the main industrial types are towns with a developed tourism industry, health industry, and high-end equipment manufacturing industry. For Type 1 characteristics towns, the number of those with an expanding tourism industry is the largest, a total of 3. On the other hand, for Type 3 characteristic towns, the number with high-end equipment manufacturing industry is the largest, equaling to 2. For Southwest Zhejiang, the main industrial types are the tourism industry and the historical classic industry. For Type 1, there are 2 characteristic towns with an evolving high-end equipment manufacturing industry, fashion industry, and historical classic industry. The number of Type 3 (8) is more than that of Type 1 (7) in Southwest Zhejiang. The main reasons for this are twofold. On the one hand, this kind of characteristic town is more affected by human activities in surrounding areas than the characteristic town itself. For example, the characteristic town is located around or inside the city. The closer the town is to the city, the more likely it is to be driven by the urban economy and develop preferentially. As a result, the night light intensity around the characteristic town is higher than the town center. On the other hand, there was no obvious economic development in the characteristic town during 2014–2020, and no spatial spillover phenomenon was formed. The industry types of the main characteristic towns in Southwest Zhejiang are tourism industry and historical classic industry, which account for 75% of the number of Type 3. The development of the two above-mentioned industry types highly depends on the continuous population movement, is consumer-oriented, vulnerable to market economic fluctuations, and more difficult to develop than other industry types.

3.2. Gradient Feature of Characteristic Towns

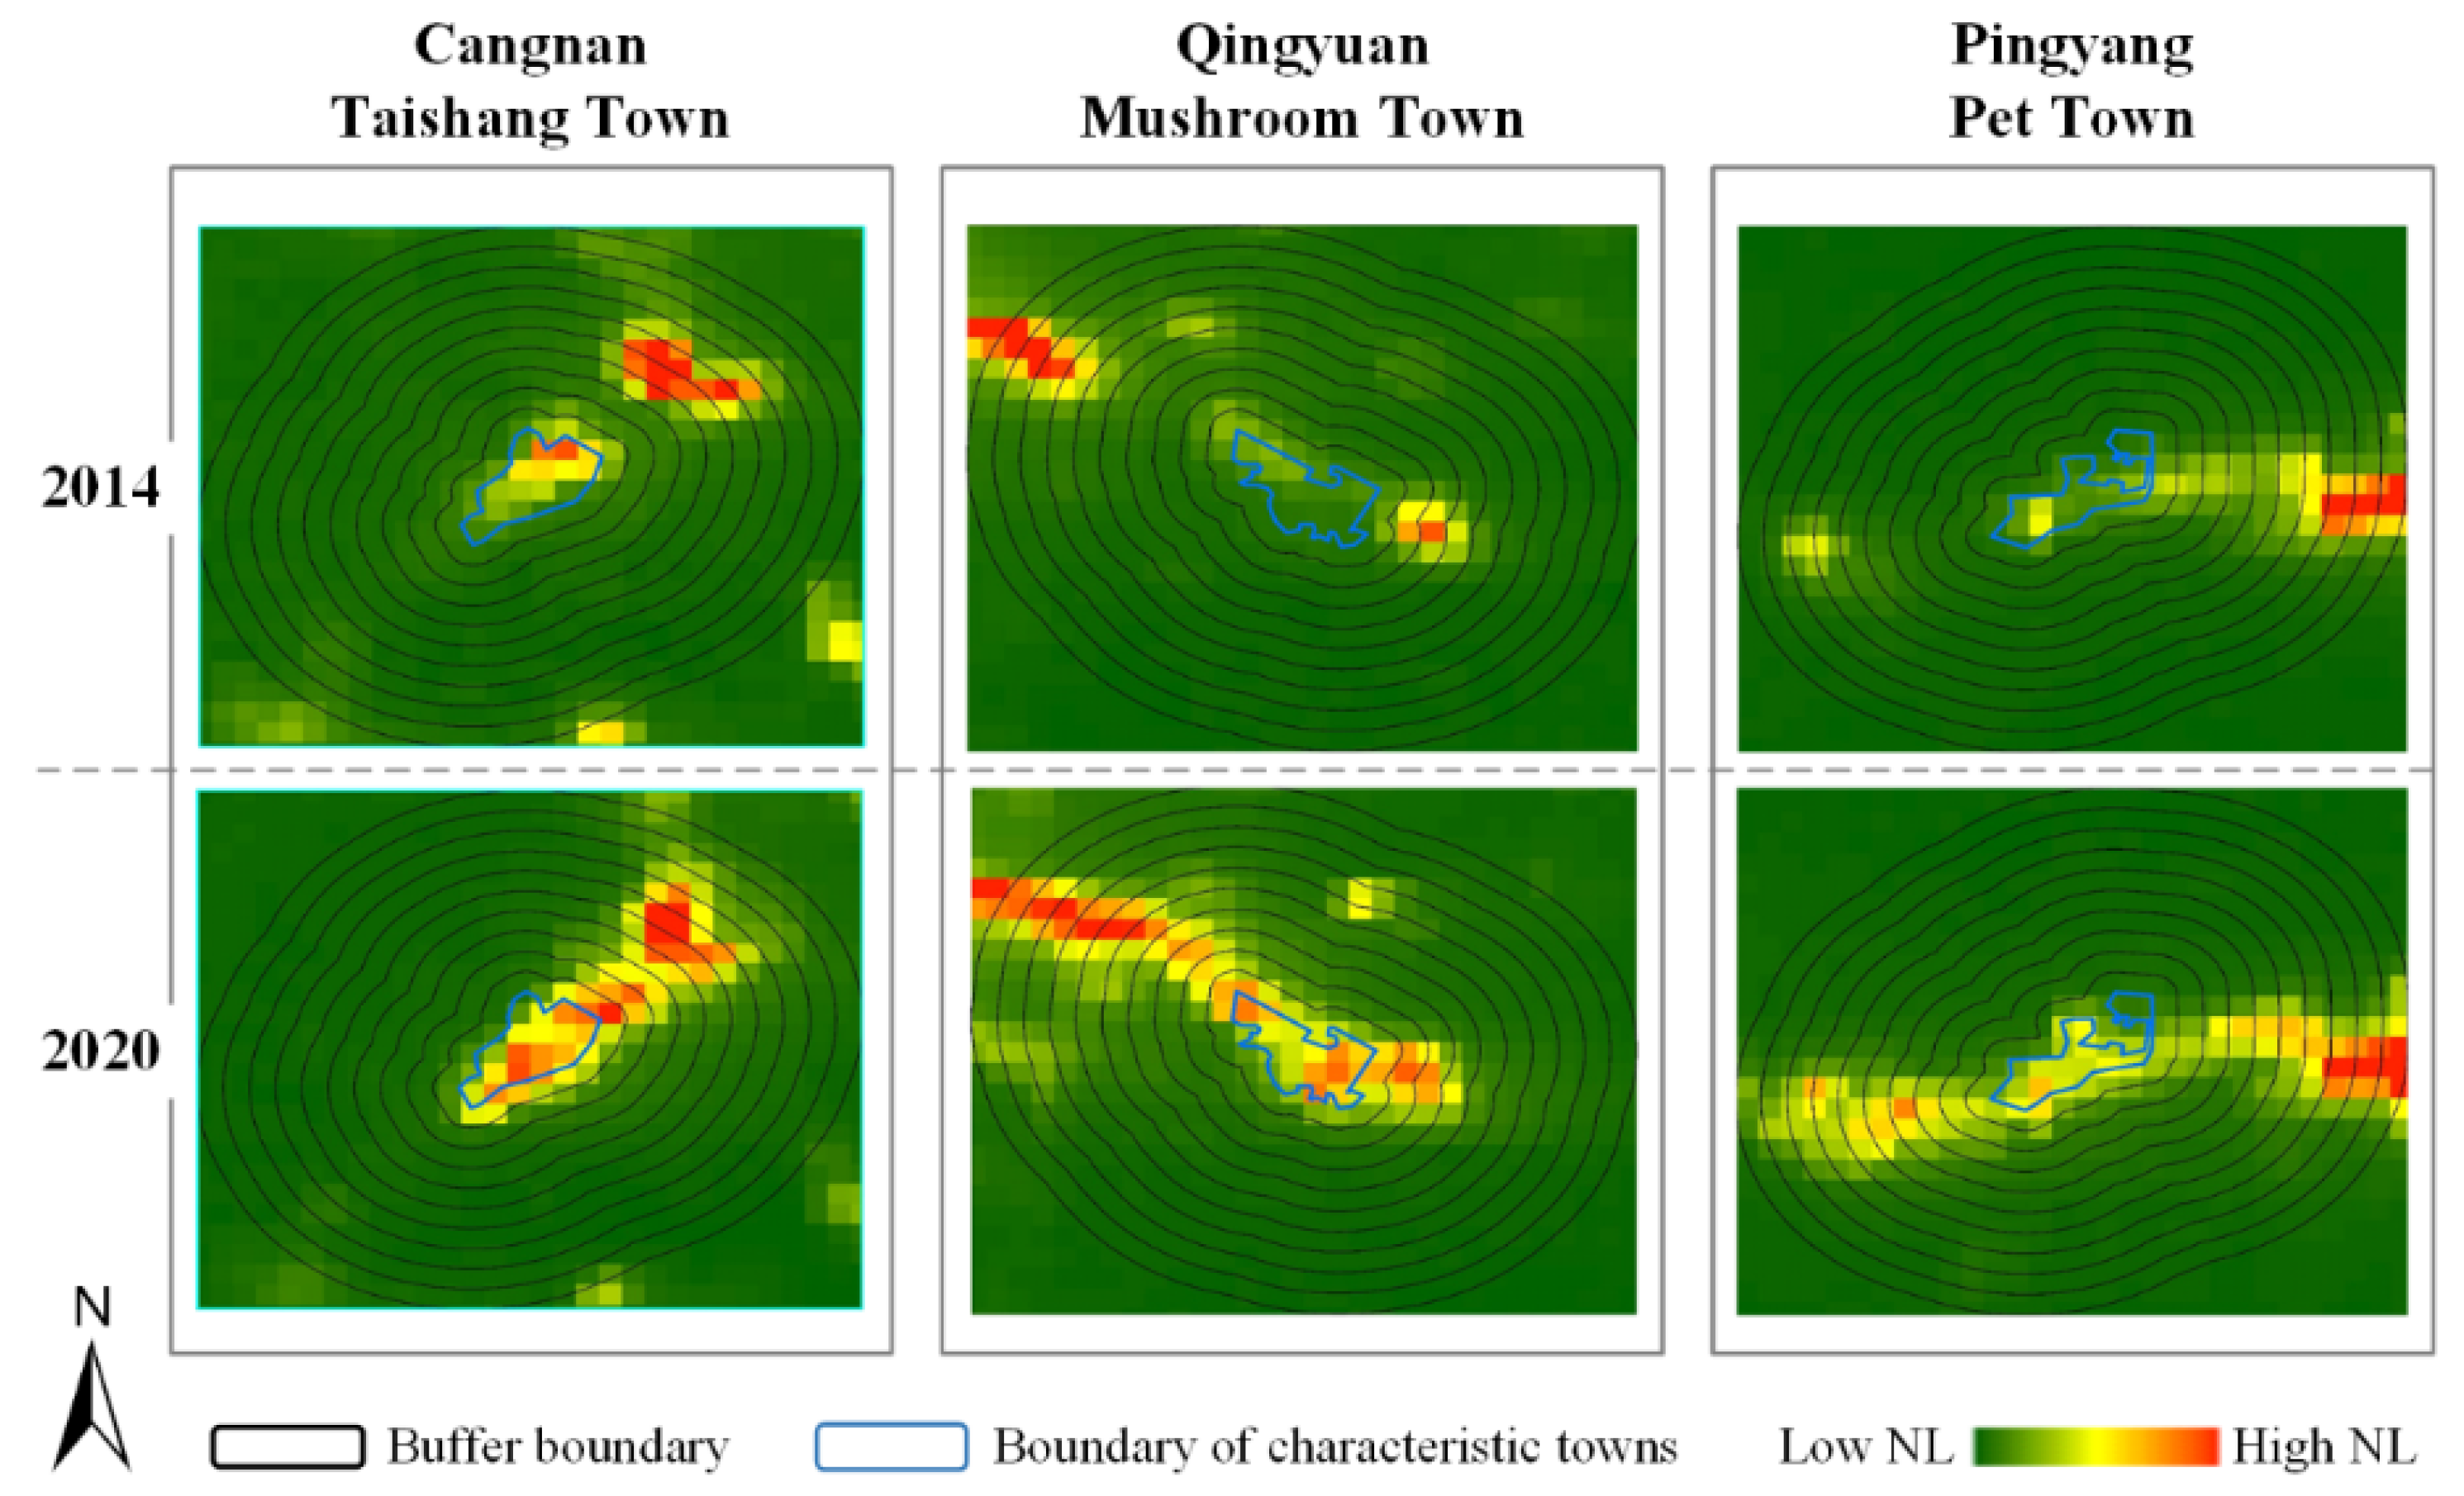
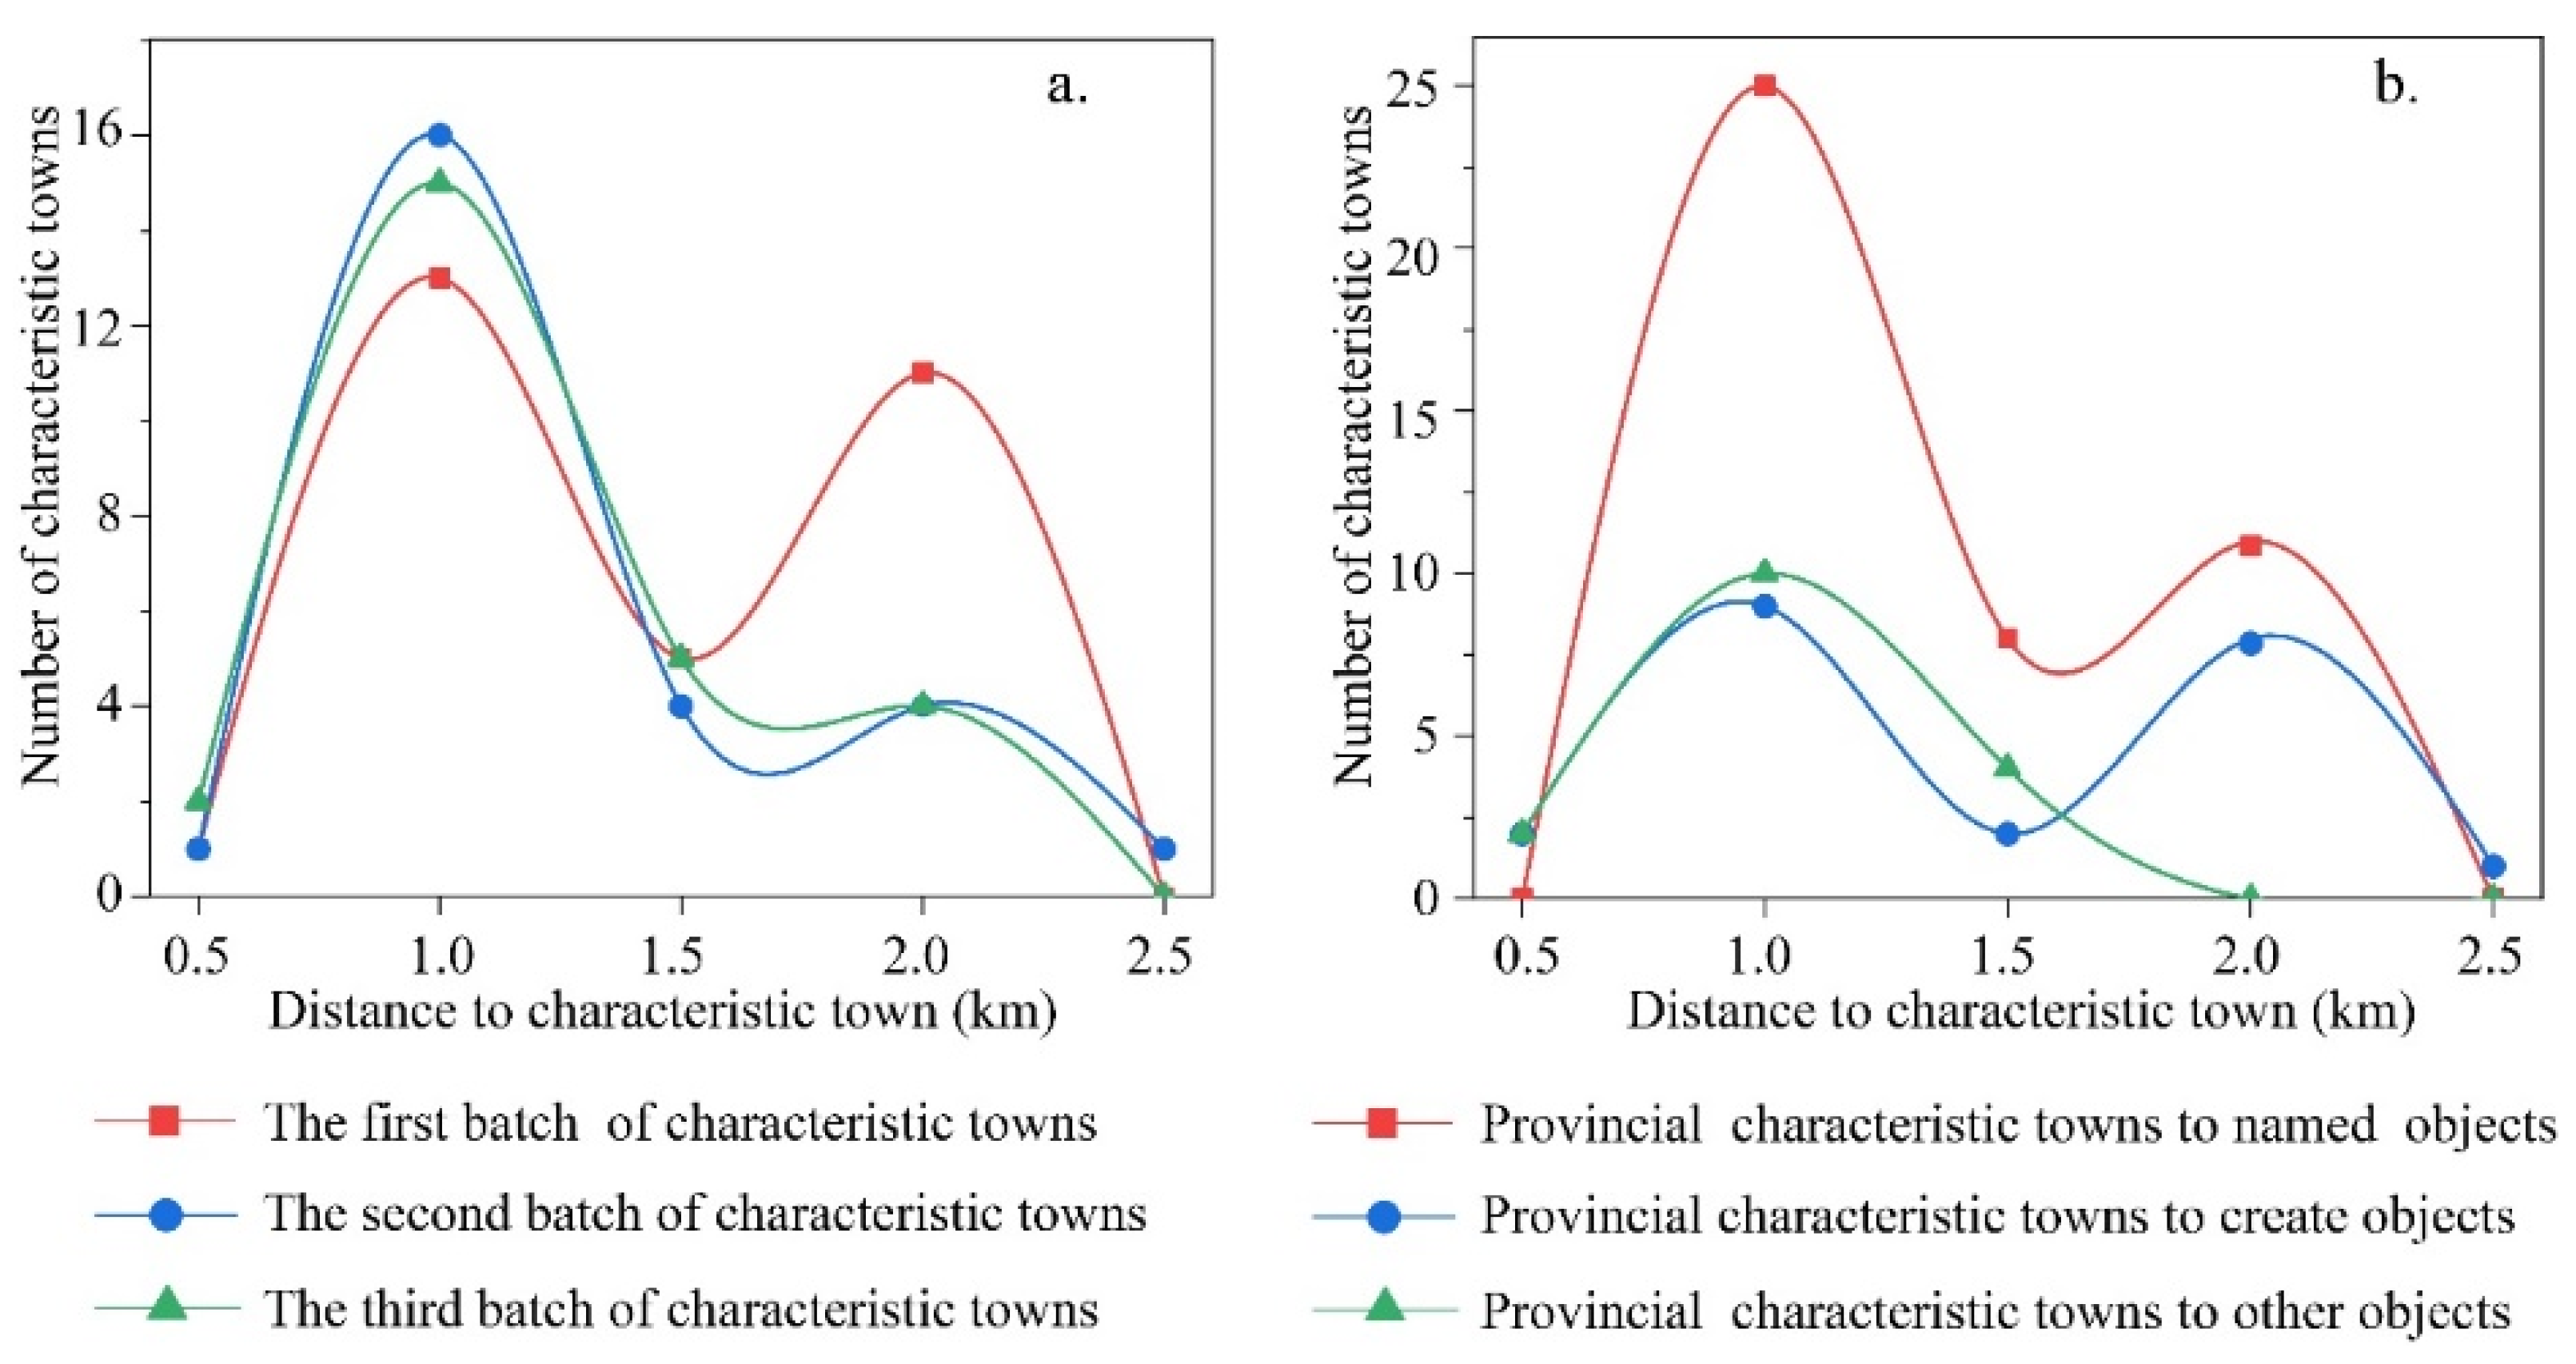
3.2.1. Different Types of Characteristic Towns

By comparing the identification results of the spatial spillover effects and the expected results, this paper analyzed the spatial spillover scope of characteristic towns. Based on the boundary of the first three groups of characteristic towns, we obtained the spatial spillover gradient distribution of characteristic towns in 2014 and 2020. In addition, the spillover spatial scope is obtained using the gradient difference method.
Provincial characteristic towns to create objects are an important part of the construction system of Zhejiang Province. They will be upgraded to characteristics towns, while others will be either downgraded to the provincial characteristic towns to create objects or will be eliminated. Provincial named characteristic towns, provincial characteristic towns to cultivate objects, and other characteristic towns differ with respect to their construction maturity. However, the law of change does not differ between them, indicating that the spatial heterogeneity of characteristic towns will increase as they mature, and its influence on the surrounding areas will tend to remain stable.
With respect to the construction time, there are significant differences in the amplitude of the first three batches of characteristic towns. Nevertheless, their change rules do not differ greatly. This observation also indicates that the construction degree of characteristic towns increases yearly. The characteristic town heterogeneity is enhanced, and the influence of characteristic towns on the surrounding area gradually becomes differentiated. Moreover, the trend of the 114 characteristic towns reveals that their spatial influence gradually decreases with an increase in the distance from the boundary. It begins to significantly decrease within a 1 km distance from the boundary (Figure 7a), relating to the dominant position of the construction land within the region. Furthermore, the agglomeration is significant within a 2 km distance from the towns’ boundary, reflecting the expansion and direction of their influence (Figure 7a). Among the first three batches of characteristic towns, only one town in the second group has a spatial influence range of 2.5 km. This may be connected to the industrial type of these specific towns.
In general, the construction system of characteristic towns in Zhejiang Province reflects the fact that spatial influence gradually decreases with an increase in the boundary distance and significantly decreases within 1 km from the boundary of characteristic towns (Figure 7b). Highly mature characteristic towns are mainly concentrated in the 1 km radius, thus accounting for 56.82% of the 44 characteristic towns within this range. There are also secondary spillover areas within the 2 km range, with 11 named characteristic towns within this radius, indicating that characteristic towns have dynamic development characteristics (Figure 7b).

3.2.2. Industrial Types of Characteristic Towns

The industrial types of characteristic towns have different amplitudes of variation with respect to the buffer distance. Nonetheless, their variation rules do not differ substantially. Figure 8 illustrates that the influence of different industrial types on the sur-rounding area is mainly concentrated in the 1 km range. This observation is similar to the spatial gradient distribution of characteristic towns in reference to different industrial types. The influence of industrial types on the surrounding areas is also evident in the concentration area within the 2 km range. In other words, the core and secondary spillover areas of characteristic towns are 1 km and 2 km, respectively. As the boundary distance of the characteristic town increases, it reflects the changing intensity and direction of the surrounding areas. This study shows that characteristic towns have become the center of regional economic activities, which is in line with their present policy.
The industrial types of characteristic towns—digital economy industry, environ-mental protection industry, health industry, tourism industry, fashion industry, finance industry, high-end equipment manufacturing industry, and historical classic industry—have a decreasing influence on the surrounding area. Among the industry types of characteristic towns, high-end equipment manufacturing, tourism, and digital economy support the above trend with dominant numbers (Figure 8).
Furthermore, the three industrial types of characteristic towns have an impact on their surrounding areas. Namely, characteristic towns form a core spillover area within a 1 km range and a secondary spillover area within a 2 km range. Among the characteristic towns in question, only one tourism town has an influence range of 2.5 km, indicating a relationship between the industrial type and spatial layout of a characteristic town. Furthermore, the influence scope of the five environmental protection towns is non-significant. This observation is consistent with the actual result, showing that the development of environmental protection towns is lagging. Overall, this study reveals that the core spillover areas of characteristic towns is located primarily within the 1 km radius.

4. Discussion

4.1. Spatial Spillover Scope of Characteristic Towns

Characteristic towns are considered important industrial platforms that create industrial clusters to upgrade industries, including science and technology parks, economic and technological development zones, high-tech development zones, incubators (innovation centers), and other carrier industrial spaces [47]. With the continuous implementation of the characteristic town policy, their surrounding areas have become one of the most important tasks in the future. To promote the healthy and sustainable development of characteristic towns, their regional development and construction should consider the gradient characteristics of surrounding areas and reasonably delimit the core function area and overflow area of characteristic towns. Many current studies have reported on the relationship between characteristic towns and theirs surrounding areas [10,14]. However, there is relatively scarce quantitative research on the spatial spillover of characteristic towns.
According to the regional factors flow theory, the flow and diffusion of labor, capital, information, and knowledge balances the regional economy and narrows the regional gap. Moreover, when the growth pole develops into industrial agglomeration, it enters the stage of interactive development. At that moment, the diffusion effect exceeds the absorption effect, and produces a spillover effect to the surrounding areas [48].
Characteristic towns are relatively small industrial platforms, which may cause spatial spillover into the surrounding areas. To measure their influence on the surrounding areas, the study divides the interval by 0.5 km as a unit. Figure 3 illustrates the change rule of different distances, which indicates that the towns’ spatial spillover represents an inverted S-shaped path. The spillover effect in 0–1 km is consistent with the ripple effect, i.e., the increase in geographical distance may be regarded as the weakening of the spillover effect. When the distance interval is greater than 2 km, the spatial effect tends to decrease, while the overflow reaches zero at 2.5 km. The diffusion distance of the spatial spillover effect appears to be concentrated between 1 and 2 km, presenting a rapid decline that tends to stabilize and thus expand the traditional geographical law. From the current results, the towns’ surrounding areas appear to be only rapidly growing areas, with most industrial activities still focused in the towns’ interior. This research confirmed that there is rapid development around characteristic towns, while avoiding the risk of exaggerating the spatial spillover and ignoring the other carriers in the surrounding area. The present study also reaffirms the fact that the spatial spillover of characteristic towns needs empirical research.

4.2. Application of the Gradient Difference Method

Gradient analysis encompasses the section method and the circle layer method [49]. Previous studies have shown that the gradient analysis method is mainly used for land fragmentation [50], determining the urban landscape pattern [51], and urban expansion [52]. To explore the influence of characteristic towns on the surrounding spatial gradient, this study employed the circle layer method for its gradient analysis [44]. We gathered the characteristic town policy before and after the implementation. We used the gradient difference method to identify the spatial spillover scope of characteristic towns.
This method includes gradient distribution before and after policy implementation, enabling it to more accurately understand the influence of characteristic towns on the surrounding areas. Furthermore, the gradient difference method also reflects the heterogeneity and gradient changes of other spaces, making it more intuitive than the traditional method (Figure 4). This method produces the quantitative measurement of the influence of characteristic towns on surrounding areas. Nightlight remote sensing data have the characteristics of high time efficiency and free access, which has been effectively used in the study of urban economic vitality, urban–rural boundary, and spatial spillover effect of characteristic small towns. Therefore, the gradient difference method based on nightlight intensity proposed in this paper may be easily applied to other industrial platforms or cities worldwide. In addition, the current results provide useful reference for the construction of characteristic towns in other regions.

4.3. Limitations and Future Work

Firstly, nighttime light data are incapable of accurately measuring the indirect spatial spillovers of characteristic towns. Furthermore, this study adopted the gradient difference method, which cannot entirely replace the notion of characteristic towns among the total population and economic analysis. Thus, future research should consider introducing a new method for measuring the spatial spillover of characteristic towns. Secondly, future studies should discuss the influence of different buffer partition methods. For instance, they could examine the influence of single-center, multi-center, and circle lines of characteristic towns as buffer objects and compare the differences caused by buffer distances on different scales. Finally, characteristic towns are in the process of development and change, meaning that their spatial spillover scope is also experiencing a dynamic change. The characteristic town policy has been implemented for a relatively short period, and its spillover effect is still developing. In the present study, only the spatial spillover of characteristic towns has been discussed. However, the impact of characteristic town development on the ecological, biodiversity, and thermal environment is not quantified. Therefore, follow-up research identifying the spatial spillover of characteristic towns and the extent of their environmental impact should be conducted.

5. Conclusions

The present paper focused on the spatial spillover scope of characteristic towns in Zhejiang Province. By employing nighttime light data, the study examined the first three batches of characteristic towns and constructed the nighttime light index, which would serve to reflect the development of characteristic towns and their surrounding areas. The gradient difference method was used to analyze the spatial spillover scope of characteristic towns in 2014 and 2020. Several conclusions have been drawn and are as follows:
The study observed spatial spillover in Zhejiang characteristic towns, which had a clear positive effect on the surrounding areas. This spatial spillover exhibits an inverse S-shaped decreasing trend from the towns’ boundary outward. In other words, the spatial spillover effect rapidly decreases with an increase in the boundary distance. This is consistent with conclusion drawn about surrounding areas in other studies and proves that there is a spatial spillover effect of characteristic towns. The surrounding area has a 1 km range as the core spillover area and a 2 km as the secondary spillover area. Our results are similar to the conclusion on characteristic towns drawn in other relevant papers. However, it differs substantially from the planning assumption that sees them as carriers of new urbanization and urban–rural integration.

Supplementary Materials

The following supporting information can be downloaded at: https://www.mdpi.com/article/10.3390/rs14163851/s1, Figure S1: The construction system of Zhejiang characteristic town; Table S1: Basic requirements for the construction of characteristic towns in Zhejiang province.

Author Contributions

Conceptualization, H.S.; methodology, validation T.H.; writing—original draft preparation, H.S. and A.G.; writing—review and editing, H.S. and T.H. All authors have read and agreed to the published version of the manuscript.

Funding

This work was supported by the National Natural Science Foundation of China Youth Fund (72004197).

Data Availability Statement

The data presented in this study are available on request from the corresponding author.

Conflicts of Interest

The authors declare that they have no known competing financial interests or personal relationships that could have appeared to influence the work reported in this paper.

References

  1. Bao, K.; Xia, Y.F. Carrier industrial space and China’s economic growth: On the development of sci-tech industrial parks and economic transformation in the past 30 years. Manag. World. 2008, 7, 1–6. [Google Scholar]
  2. Yang, Z.; Dunford, M. Cluster evolution and urban industrial dynamics in the transition from a planned to a socialist market economy: The case of Beijing. Spat. Econ. Anal. 2017, 12, 50–71. [Google Scholar] [CrossRef]
  3. Miao, J.T.; Phelps, N.A. ‘Featured town’fever: The anatomy of a concept and its elevation to national policy in China. Habitat Int. 2019, 87, 44–53. [Google Scholar] [CrossRef]
  4. Yao, S.J. Governance convergence in urban-rural Integration: Policy issues based on “characteristic town”. Soc. Sci. Res. 2017, 1, 45–50. [Google Scholar]
  5. Zou, Y.; Zhao, W. Searching for a new dynamic of industrialization and urbanization: Anatomy of China’s characteristic town program. Urban Geogr. 2018, 39, 1060–1069. [Google Scholar] [CrossRef]
  6. Zhang, R.L.; Ding, Y.; Liu, W.C.; Chai, Z.J. Practice and Exploration of Zhejiang characteristic town based on high-quality development. Urban Plan. Rev. 2020, 44, 67–74. [Google Scholar]
  7. Yu, J.; Xu, Z.X. The process and evolution logic of characteristic town policy: A case study of Zhejiang Province. Fisc. Sci. 2019, 6, 128–136. [Google Scholar]
  8. Feng, K.; Huang, X.Y. Accurately grasp the policy focus of promoting the development of characteristic towns: The enlightenment of Promoting the development of characteristic towns in Zhejiang and other places. China Dev. Watch. 2016, 18, 15–18. [Google Scholar]
  9. Li, Q. Characteristic town is the strategic choice of Innovation and development in Zhejiang Province. Zhejiang Today 2015, 24, 22–23. [Google Scholar]
  10. Qian, Y.; Liu, C.Y.; Ren, H.N. Development status and Policy Choices of Characteristic Towns. Macroecon. Manag. 2020, 9, 26–27. [Google Scholar]
  11. Sheng, S.H.; Zhang, W.M. Characteristic town: A form of industrial spatial organization. Zhejiang Soc. Sci. 2016, 3, 36–38. [Google Scholar]
  12. Wu, Y.; Chen, Y.; Deng, X.; Hui, E.C. Development of characteristic towns in China. Habitat Int. 2018, 77, 21–31. [Google Scholar] [CrossRef]
  13. Li, N.; Qiu, B.X. Research on industrial development and spatial Optimization of characteristic town based on complex adaptive system theory. Urban Dev. Res. 2019, 26, 8–12. [Google Scholar]
  14. Ma, Y.Q.; Ren, S.B. Transaction costs and the formation of urban carrier industry space: A case study of characteristic towns in Zhejiang Province. Urban Dev. Res. 2020, 27, 127–132. [Google Scholar]
  15. Zhou, L.Y.; Zhou, G.M. From development zone to characteristic town: New changes of regional development mode. Urban Dev. Res. 2017, 4, 51–55. [Google Scholar]
  16. Fu, X.D.; Jiang, Y.W. Research on the Development mode of Characteristic towns in China based on the perspective of grounding. China Soft Sci. 2017, 08, 102–111. [Google Scholar]
  17. Zeng, J.; Ci, F. Construction of characteristic towns under the background of new urbanization. Macroecon. Manag. 2016, 12, 51–56. [Google Scholar]
  18. Cheng, X.; He, J.X. The positive interaction between urban-rural integration development and characteristic town construction: Based on the perspective of urban-rural and regional factor flow Theory. Guangxi Soc. Sci. 2018, 10, 89–93. [Google Scholar]
  19. Liu, X.P. A scientific grasp of the functional positioning of characteristic towns in the new era. Macroecon. Res. 2019, 04, 153–161. [Google Scholar]
  20. Yin, X.; Wang, J.; Li, Y.; Feng, Z.; Wang, Q. Are small towns really inefficient? A data envelopment analysis of sampled towns in Jiangsu province, China. Land Use Policy 2021, 109, 105590. [Google Scholar] [CrossRef]
  21. Su, S.B.; Zhang, X.L. Analysis on the practice mode of Zhejiang characteristic towns in the new urbanization. Macroecon. Manag. 2016, 10, 73–75+80. [Google Scholar]
  22. Wang, D.W.; Li, Y. Typical problems and sustainable promotion strategies of characteristic town development. Econ. Rev. 2019, 08, 69–75. [Google Scholar]
  23. Hu, X.; Xu, W.; Miao, J.T. Think locally, act locally: A critique of China’s specialty town program in practice. Geogr. Rev. 2021, 111, 393–414. [Google Scholar] [CrossRef]
  24. Gao, S.J. Research on construction and development of characteristic small towns: A case study of Qingdao haiqing tea garden town. Issues Agric. Econ. 2017, 38, 40–44. [Google Scholar]
  25. Liu, H. Spatio-temporal evolution mechanism and influence factors of the China’s characteristic town policy and diffusion. Open J. Soc. Sci. 2020, 8, 328–340. [Google Scholar] [CrossRef]
  26. Min, X.Q. Characteristics of small towns from the perspective of precise governance and its construction path. J. Tongji Univ. 2016, 27, 55–60. [Google Scholar]
  27. Zheng, S.H.; Chen, J.; Mei, H.L.; Chen, Y.P. Research on the development of small towns with science and innovation characteristics based on the cooperation capacity of core enterprises. Sci. Res. Manag. 2020, 41, 143–152. [Google Scholar]
  28. Wang, T.Y. On the cultivation and development of characteristic towns under the background of rural revitalization Strategy: Based on the Interaction analysis of characteristic towns, smes and rural revitalization. Soc. Sci. Henan 2020, 28, 105–111. [Google Scholar]
  29. Zhou, F.; Zhao, F.; Xu, Q.; Yuan, Y.; Zhang, M. Evaluation and selection methods of tourism characteristic town: The case of Liaoning Province, China. Sustainability 2020, 12, 5372. [Google Scholar] [CrossRef]
  30. Huang, J.H.; Lu, N. Review of domestic characteristic town research: Progress and prospect. Contemp. Econ. Manag. 2018, 40, 47–51. [Google Scholar]
  31. Zheng, M.C.; Xu, G.; Xiao, R.; Jiao, L.M. Distance decay of nighttime lights from urban centers and its application. Prog. Geogr. 2022, 41, 1251–1260. [Google Scholar] [CrossRef]
  32. Imhoff, M.L.; Lawrence, W.T.; Stutzer, D.C.; Elvidge, C.D. A technique for using composite DMSP/OLS ‘‘city lights’’ satellite data to map urban area. Remote Sens. Environ. 1997, 61, 361–370. [Google Scholar] [CrossRef]
  33. Liu, Q.P.; Yang, Y.C.; Fu, D.X.; Li, H.; Tian, H. Urban spatial expansion based on DMSP/OLS nighttime light data in China in 1992–2010. Sci. Geogr. Sin. 2014, 34, 129–136. [Google Scholar]
  34. Li, D.R.; Yu, H.R.; Li, X. The spatial temporal pattern analysis of city development in countries along the Belt and Road Initiative based on nighttime light data. Geomat. Inf. Sci. Wuhan Univ. 2017, 42, 711–720. [Google Scholar]
  35. Doll, C.N.; Muller, J.P.; Morley, J.G. Mapping regional economic activity from night-time light satellite imagery. Ecol. Econ. 2006, 57, 75–92. [Google Scholar] [CrossRef]
  36. Henderson, J.V.; Storeygard, A.; Weil, D.N. Measuring economic growth from outer space. Am. Econ. Rev. 2012, 102, 994–1028. [Google Scholar] [CrossRef] [Green Version]
  37. Yang, M.Y.; Cai, Z.B.; Zhang, K.Y. Urban size measurement and its sources of spatial competition in China: Based on global nighttime light data. Financ. Trade Econ. 2017, 38, 38–51. [Google Scholar]
  38. Storeygard, A. Farther on down the road: Transport costs, trade and urban growth in sub-Saharan Africa. Rev. Econ. Stud. 2016, 83, 1263–1295. [Google Scholar] [CrossRef] [Green Version]
  39. Du, X.; Shen, L.; Wong, S.W.; Meng, C.; Yang, Z. Night-time light data based decoupling relationship analysis between economic growth and carbon emission in 289 Chinese cities. Sustain. Cities Soc. 2021, 73, 103119. [Google Scholar] [CrossRef]
  40. Elvidge, C.D.; Cinzano, P.; Pettit, D.R.; Arvesen, J.; Sutton, P.; Small, C.; Nemani, R.; Longcore, T.; Rich, C.; Safran, J.; et al. The Nightsat mission concept. Int. J. Remote Sens. 2007, 28, 2645–2670. [Google Scholar] [CrossRef]
  41. Hu, X.; Qian, Y.; Pickett, S.T.; Zhou, W. Urban mapping needs up-to-date approaches to provide diverse perspectives of current urbanization: A novel attempt to map urban areas with nighttime light data. Landsc. Urban Plan. 2020, 195, 103709. [Google Scholar] [CrossRef]
  42. Zheng, Y.; He, Y.; Zhou, Q.; Wang, H. Quantitative Evaluation of Urban Expansion using NPP-VIIRS Nighttime Light and Landsat Spectral Data. Sustain. Cities Soc. 2021, 76, 103338. [Google Scholar] [CrossRef]
  43. Chen, Z.; Yu, B.; Yang, C.; Zhou, Y.; Yao, S.; Qian, X.; Wang, C.; Wu, B.; Wu, J. An extended time series (2000–2018) of global NPP-VIIRS-like nighttime light data from a cross-sensor calibration. Earth Syst. Sci. Data 2021, 13, 889–906. [Google Scholar] [CrossRef]
  44. Jiao, L.M.; Xiao, F.T.; Xu, G. Spatial-temporal response of green land fragmentation patterns to urban expansion in Wuhan metropolitan area. Resour. Sci. 2015, 37, 1650–1660. [Google Scholar]
  45. Xue, B.; Xiao, X.; Li, J. Identification method and empirical study of urban industrial spatial relationship based on POI big data: A case of Shenyang City, China. Geogr. Sustain. 2020, 1, 152–162. [Google Scholar] [CrossRef]
  46. Wang, D.X.; Wang, S.Y.; Wu, Y.Z. Analysis and Optimization of Spatial Structure of Regional Small Towns: Taking Zhejiang Province as an Example. J. Zhejiang Univ. Technol. 2020, 19, 47–53. [Google Scholar]
  47. Liu, J.; Hou, X.; Wang, Z.; Shen, Y. Study the effect of industrial structure optimization on urban land-use efficiency in China. Land Use Policy 2021, 105, 105390. [Google Scholar] [CrossRef]
  48. Chen, X.S.; Zhang, K.Y. Regional Economic Theory; The Commercial Press: Beijing, China, 2003. [Google Scholar]
  49. Chen, W.; Zeng, J.; Chu, Y.; Liang, J. Impacts of Landscape Patterns on Ecosystem Services Value: A Multiscale Buffer Gradient Analysis Approach. Remote Sens. 2021, 13, 2551. [Google Scholar] [CrossRef]
  50. Shrestha, M.K.; York, A.M.; Boone, C.G.; Zhang, S. Land fragmentation due to rapid urbanization in the Phoenix Metropolitan Area: Analyzing the spatiotemporal patterns and drivers. Appl. Geogr. 2012, 32, 522–531. [Google Scholar] [CrossRef]
  51. Luck, M.; Wu, J. A gradient analysis of urban landscape pattern: A case study from the Phoenix metropolitan region, Arizona, USA. Landsc. Ecol. 2002, 17, 327–339. [Google Scholar] [CrossRef]
  52. Zhou, L.; Dang, X.; Mu, H.; Wang, B.; Wang, S. Cities are going uphill: Slope gradient analysis of urban expansion and its driving factors in China. Sci. Total Environ. 2021, 775, 145836. [Google Scholar] [CrossRef] [PubMed]
Figure 1. Study area.
Remotesensing 14 03851 g001
Figure 2. The analytical framework.
Remotesensing 14 03851 g002
Figure 3. Spatial spillover types and typical cases of characteristic towns ((ac) represent type 1, which is consistent with the expected results; (df) represent type 2, which is partially consistent with the expected results; (gi) represent type 3, which is inconsistent with the expected results. The right figure shows the 3 typical cases of spatial spillover types, including real images and nightlight differential images).
Remotesensing 14 03851 g003
Figure 4. Spatial spillover scope of typical characteristic towns.
Remotesensing 14 03851 g004
Figure 5. Spatial distribution of spatial spillover types of characteristic towns.
Remotesensing 14 03851 g005
Figure 6. Spatial spillover types in industrial types.
Remotesensing 14 03851 g006
Figure 7. Gradient distribution of different types of characteristic towns. (a) the construction batch of characteristic towns; (b) the construction level of characteristic towns.
Remotesensing 14 03851 g007
Figure 8. Gradient distribution of industrial types of characteristic towns.
Remotesensing 14 03851 g008
Table 1. The first three batches of provincial characteristic towns in Zhejiang Province.
The Type of Characteristic Towns201520162017
The First BatchThe Second BatchThe Third Batch
Provincial named characteristic towns261912
Provincial characteristic towns to cultivate objects296
Provincial characteristic towns to create objects81116
Provincial characteristic towns to be eliminated131
Total374235
Note: Relevant data are available until November 2021.
Table 2. Regional differences of spatial spillover types.
RegionType 1Type 2Type 3
NumberProportionNumberProportionNumberProportion
North Zhejiang3954.93%1419.72%1825.35%
Southeast Zhejiang1168.75%212.50%318.75%
Southwest Zhejiang736.84%421.05%842.11%
Central Zhejiang562.50%225%112.50%
Publisher’s Note: MDPI stays neutral with regard to jurisdictional claims in published maps and institutional affiliations.

