
Monitoring Surface Water Inundation of Poyang Lake and Dongting Lake in China Using Sentinel-1 SAR Images


Abstract
:
1. Introduction
2. Materials and Methods
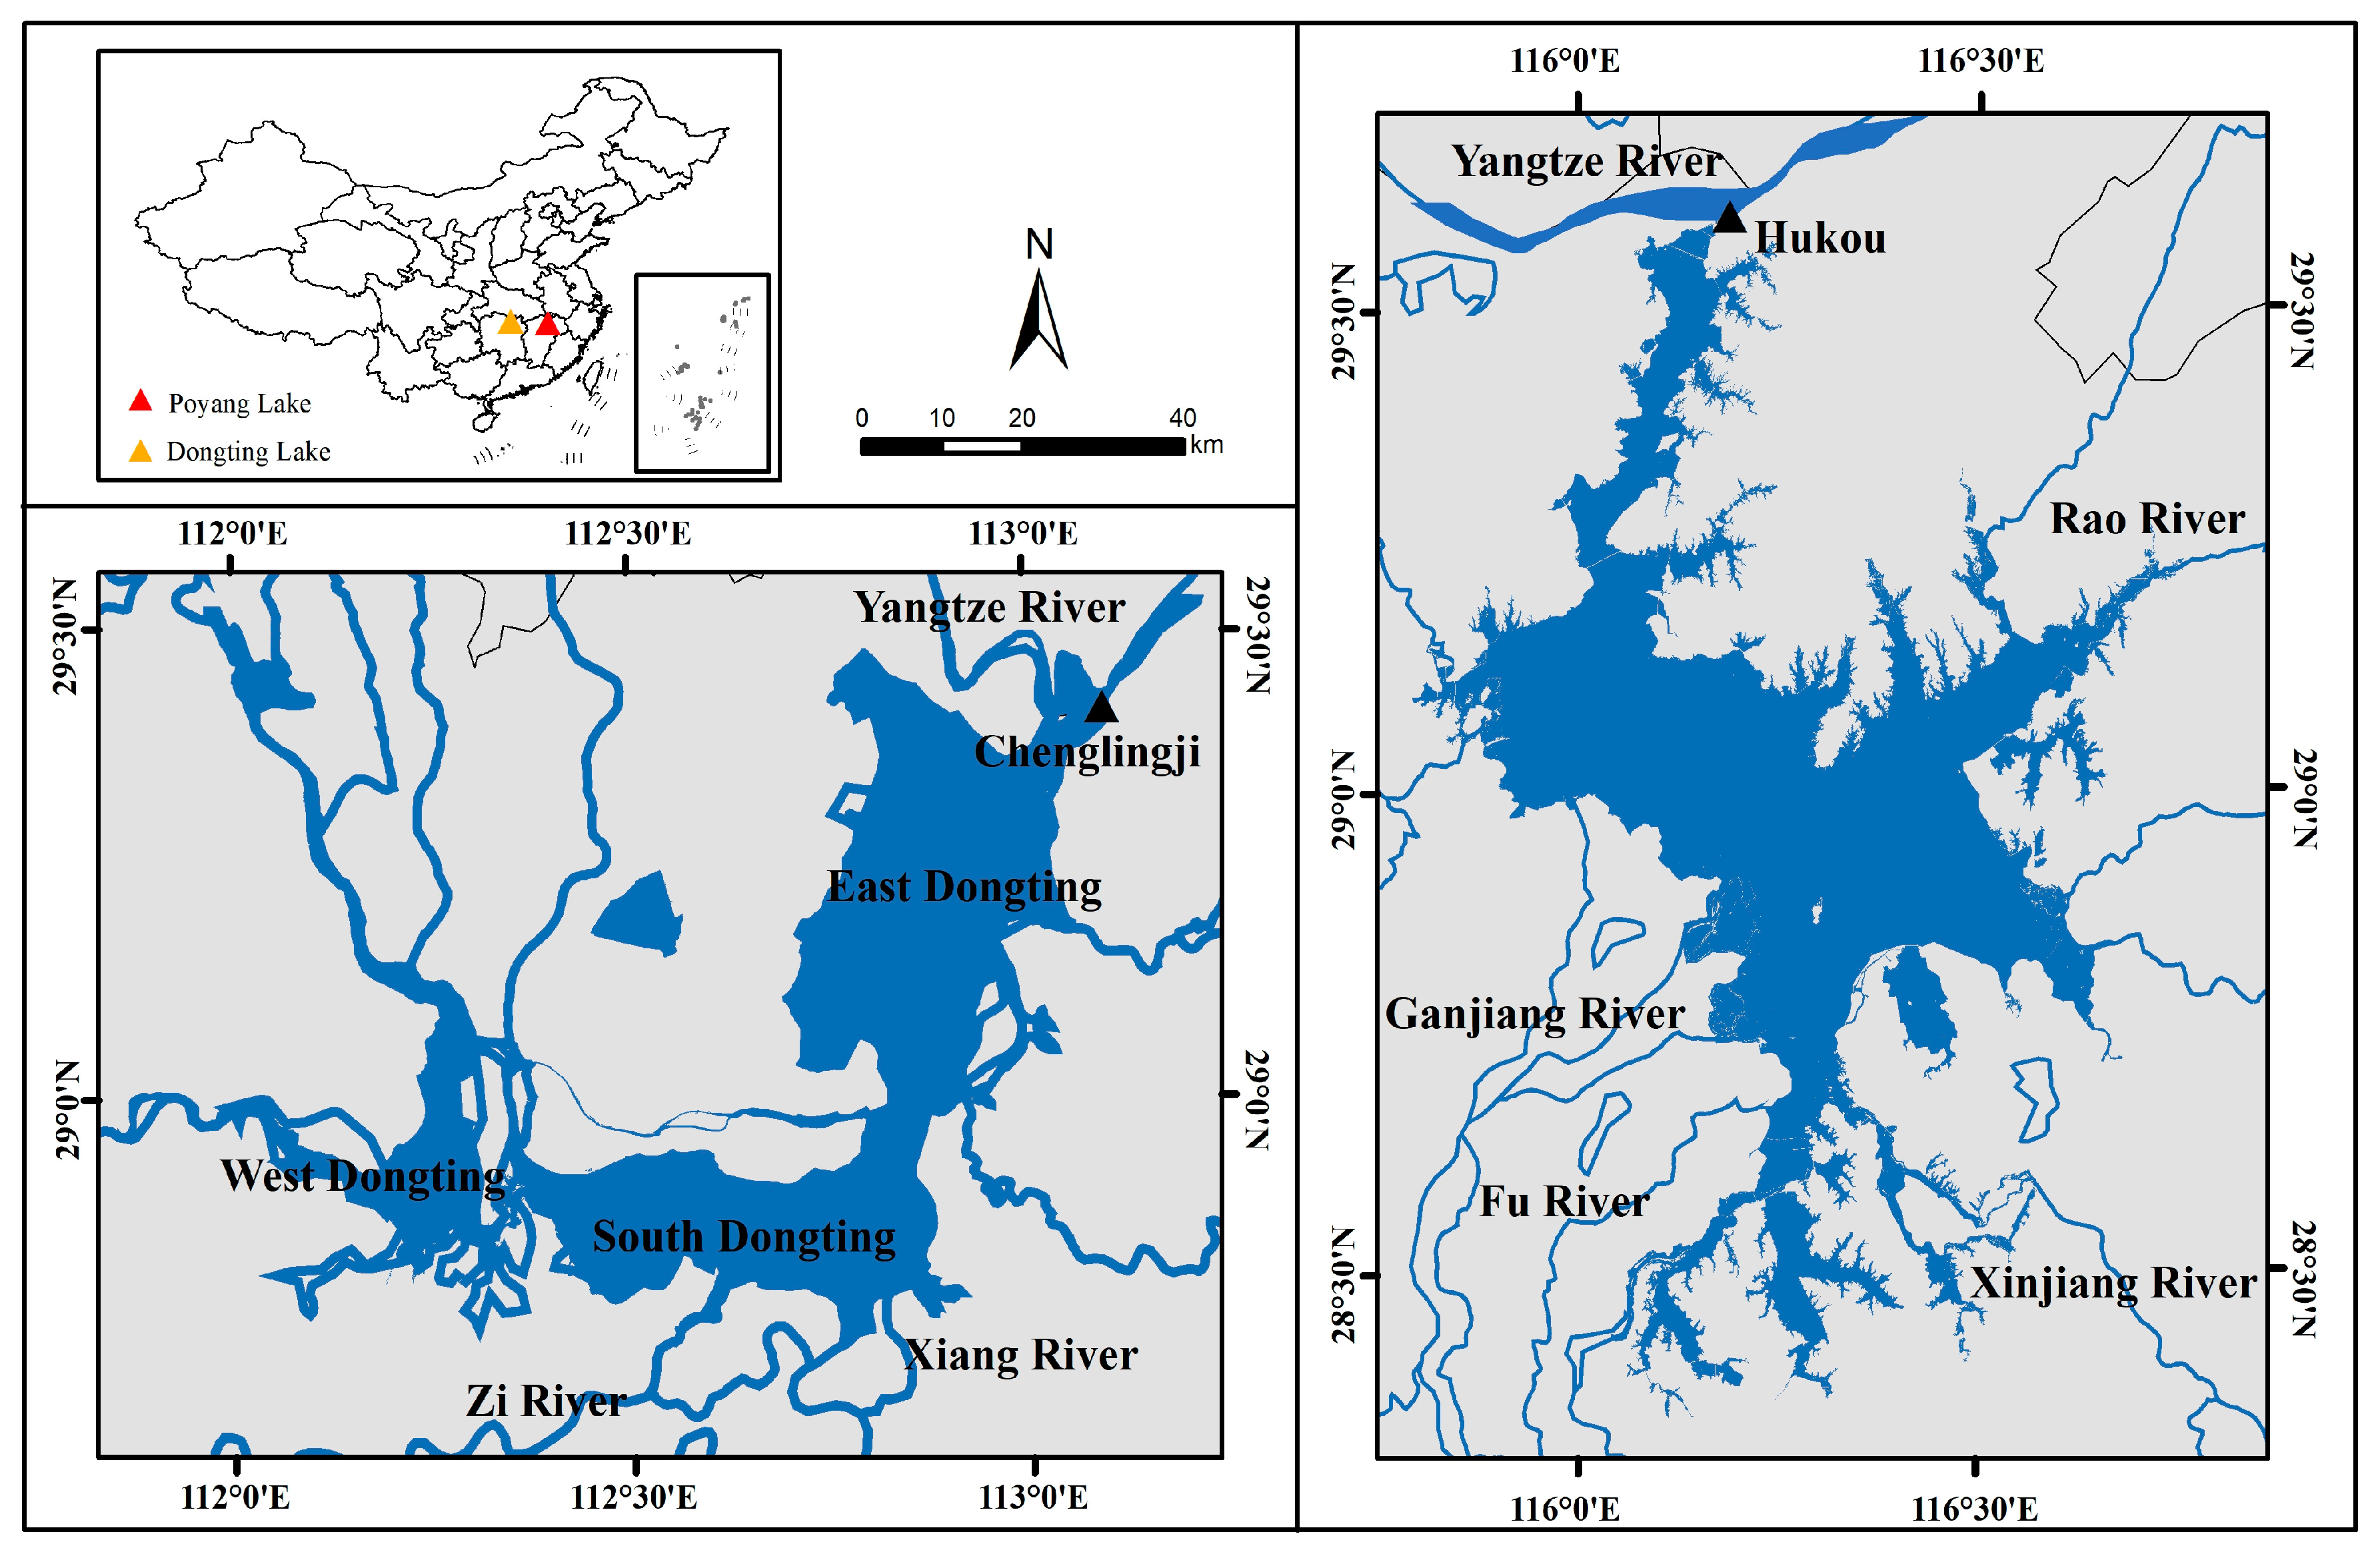
2.1. Study Area
2.2. Materials
2.2.1. Sentinel-1 Data
2.2.2. JRC Monthly Water History Data
2.2.3. Validation Data
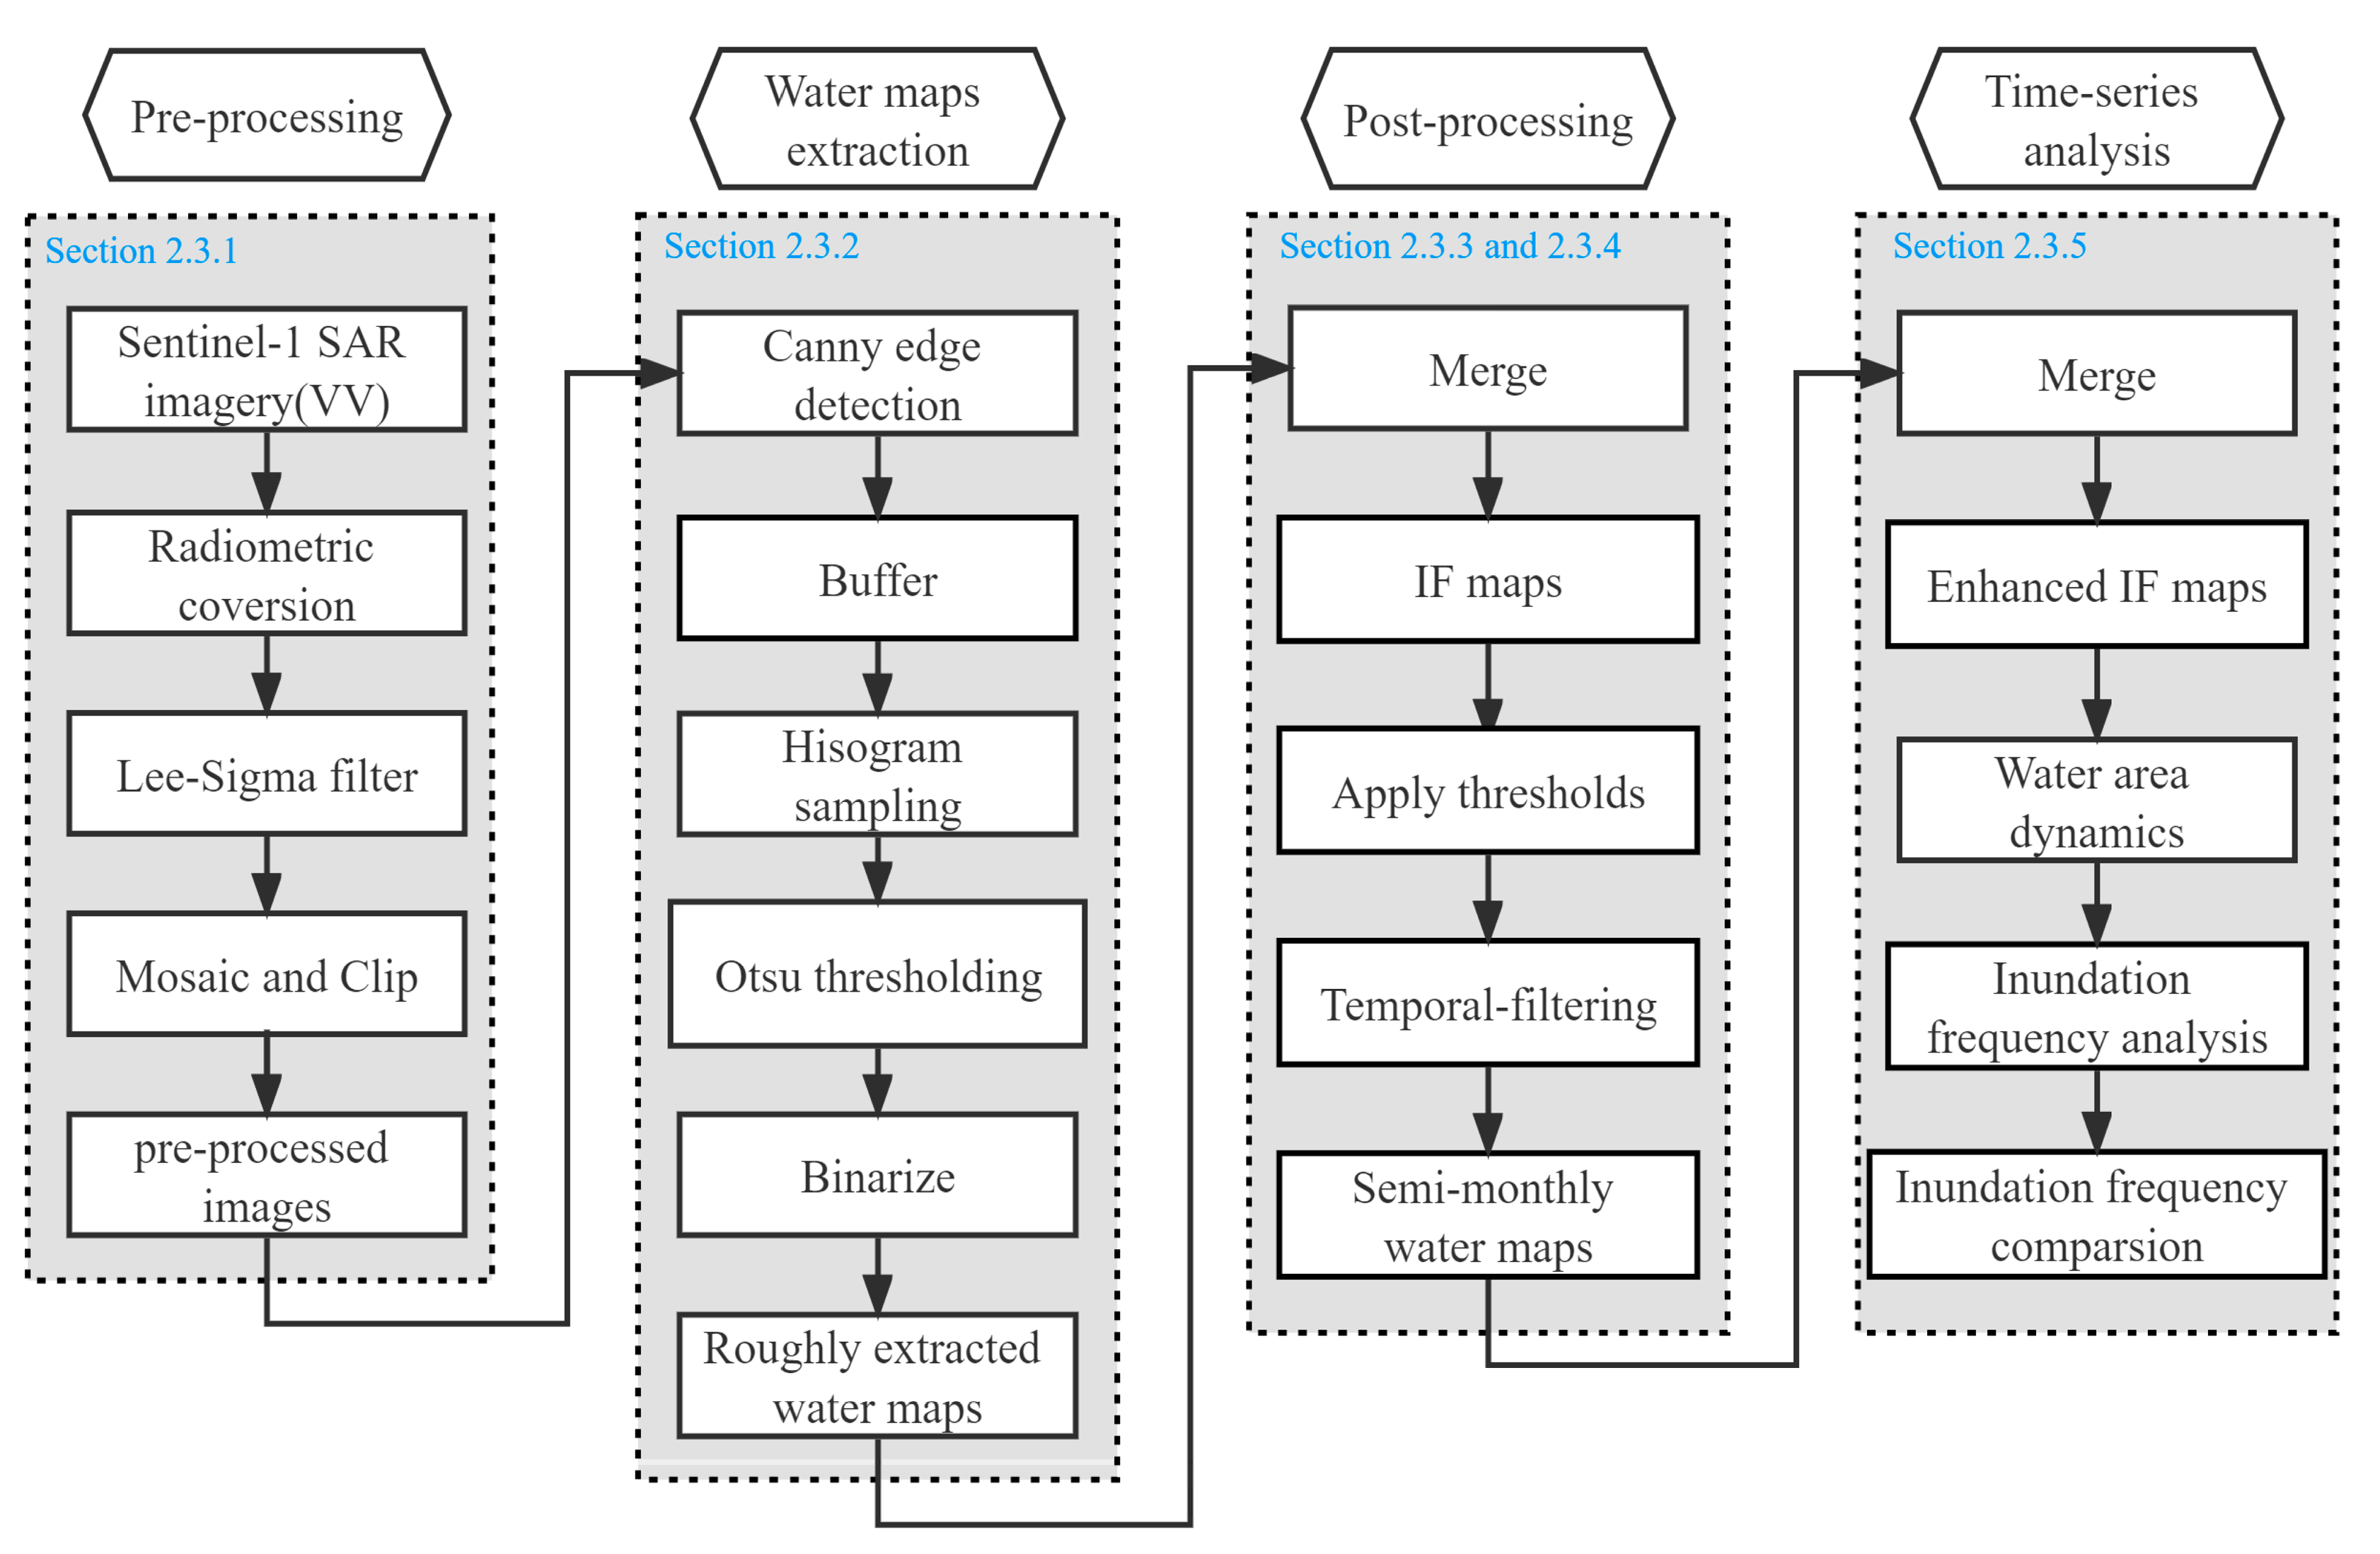
2.3. Methods
2.3.1. Data Preprocessing
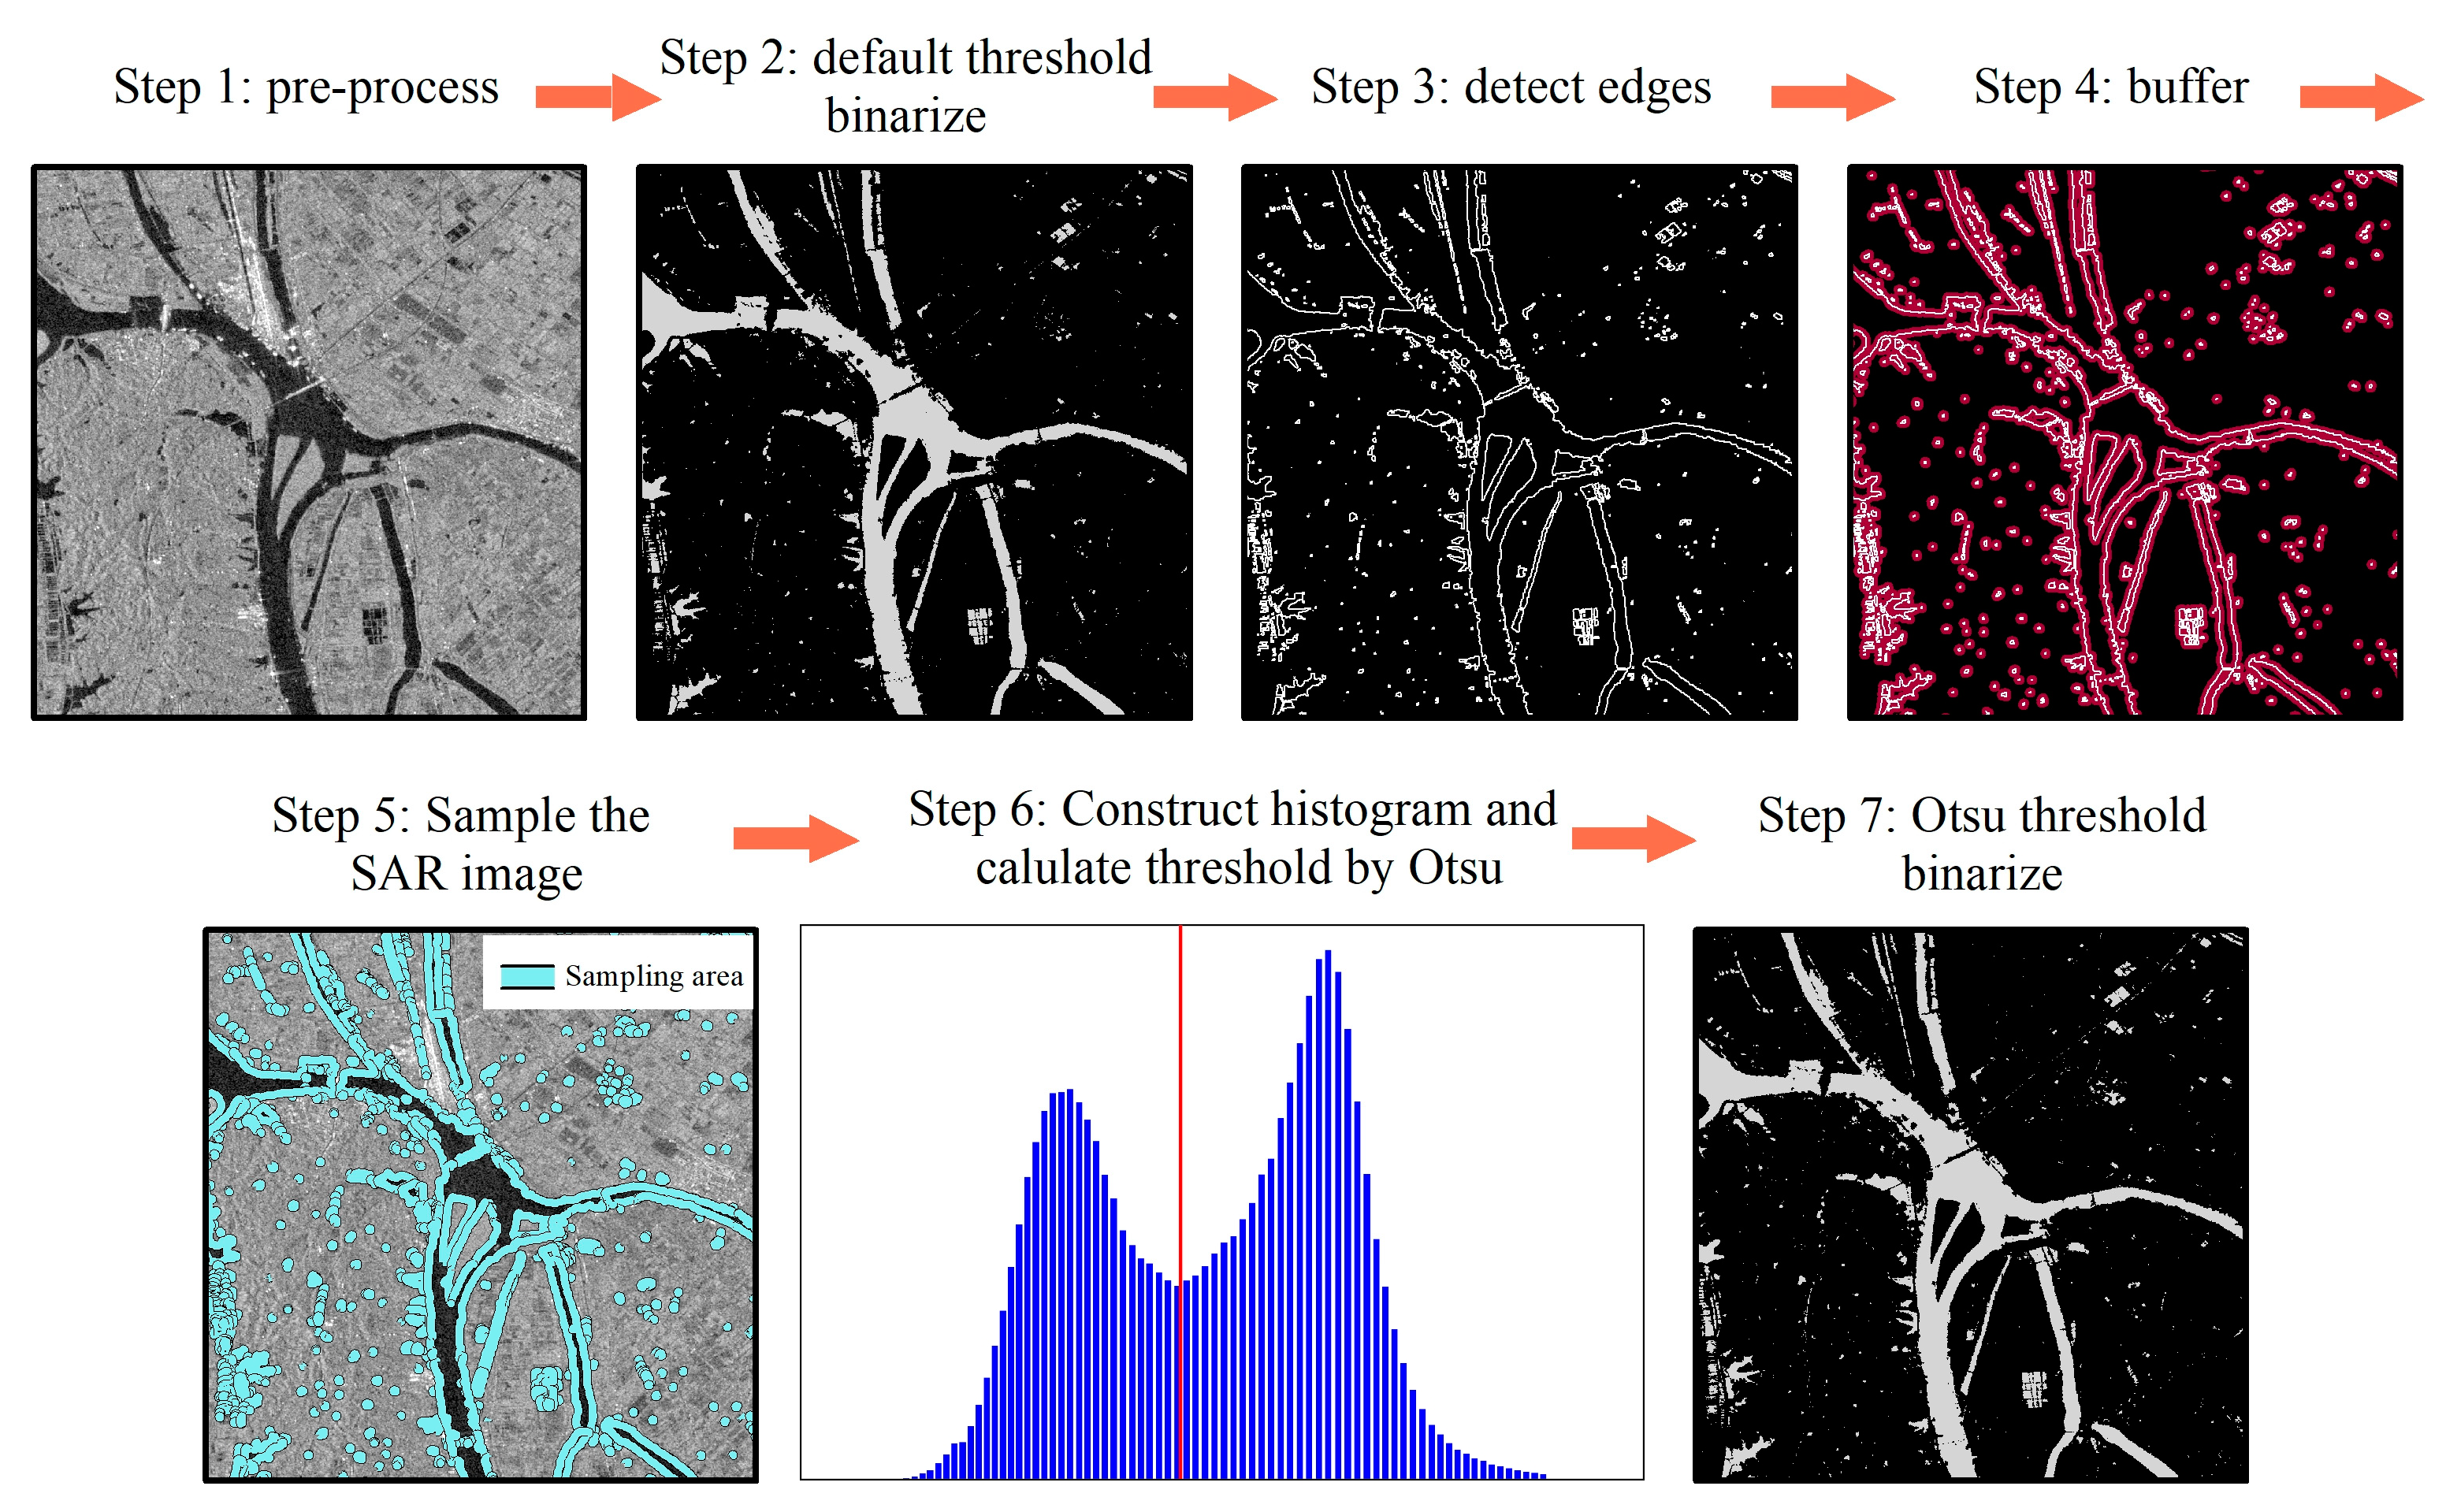
2.3.2. Edge Otsu’s Algorithm
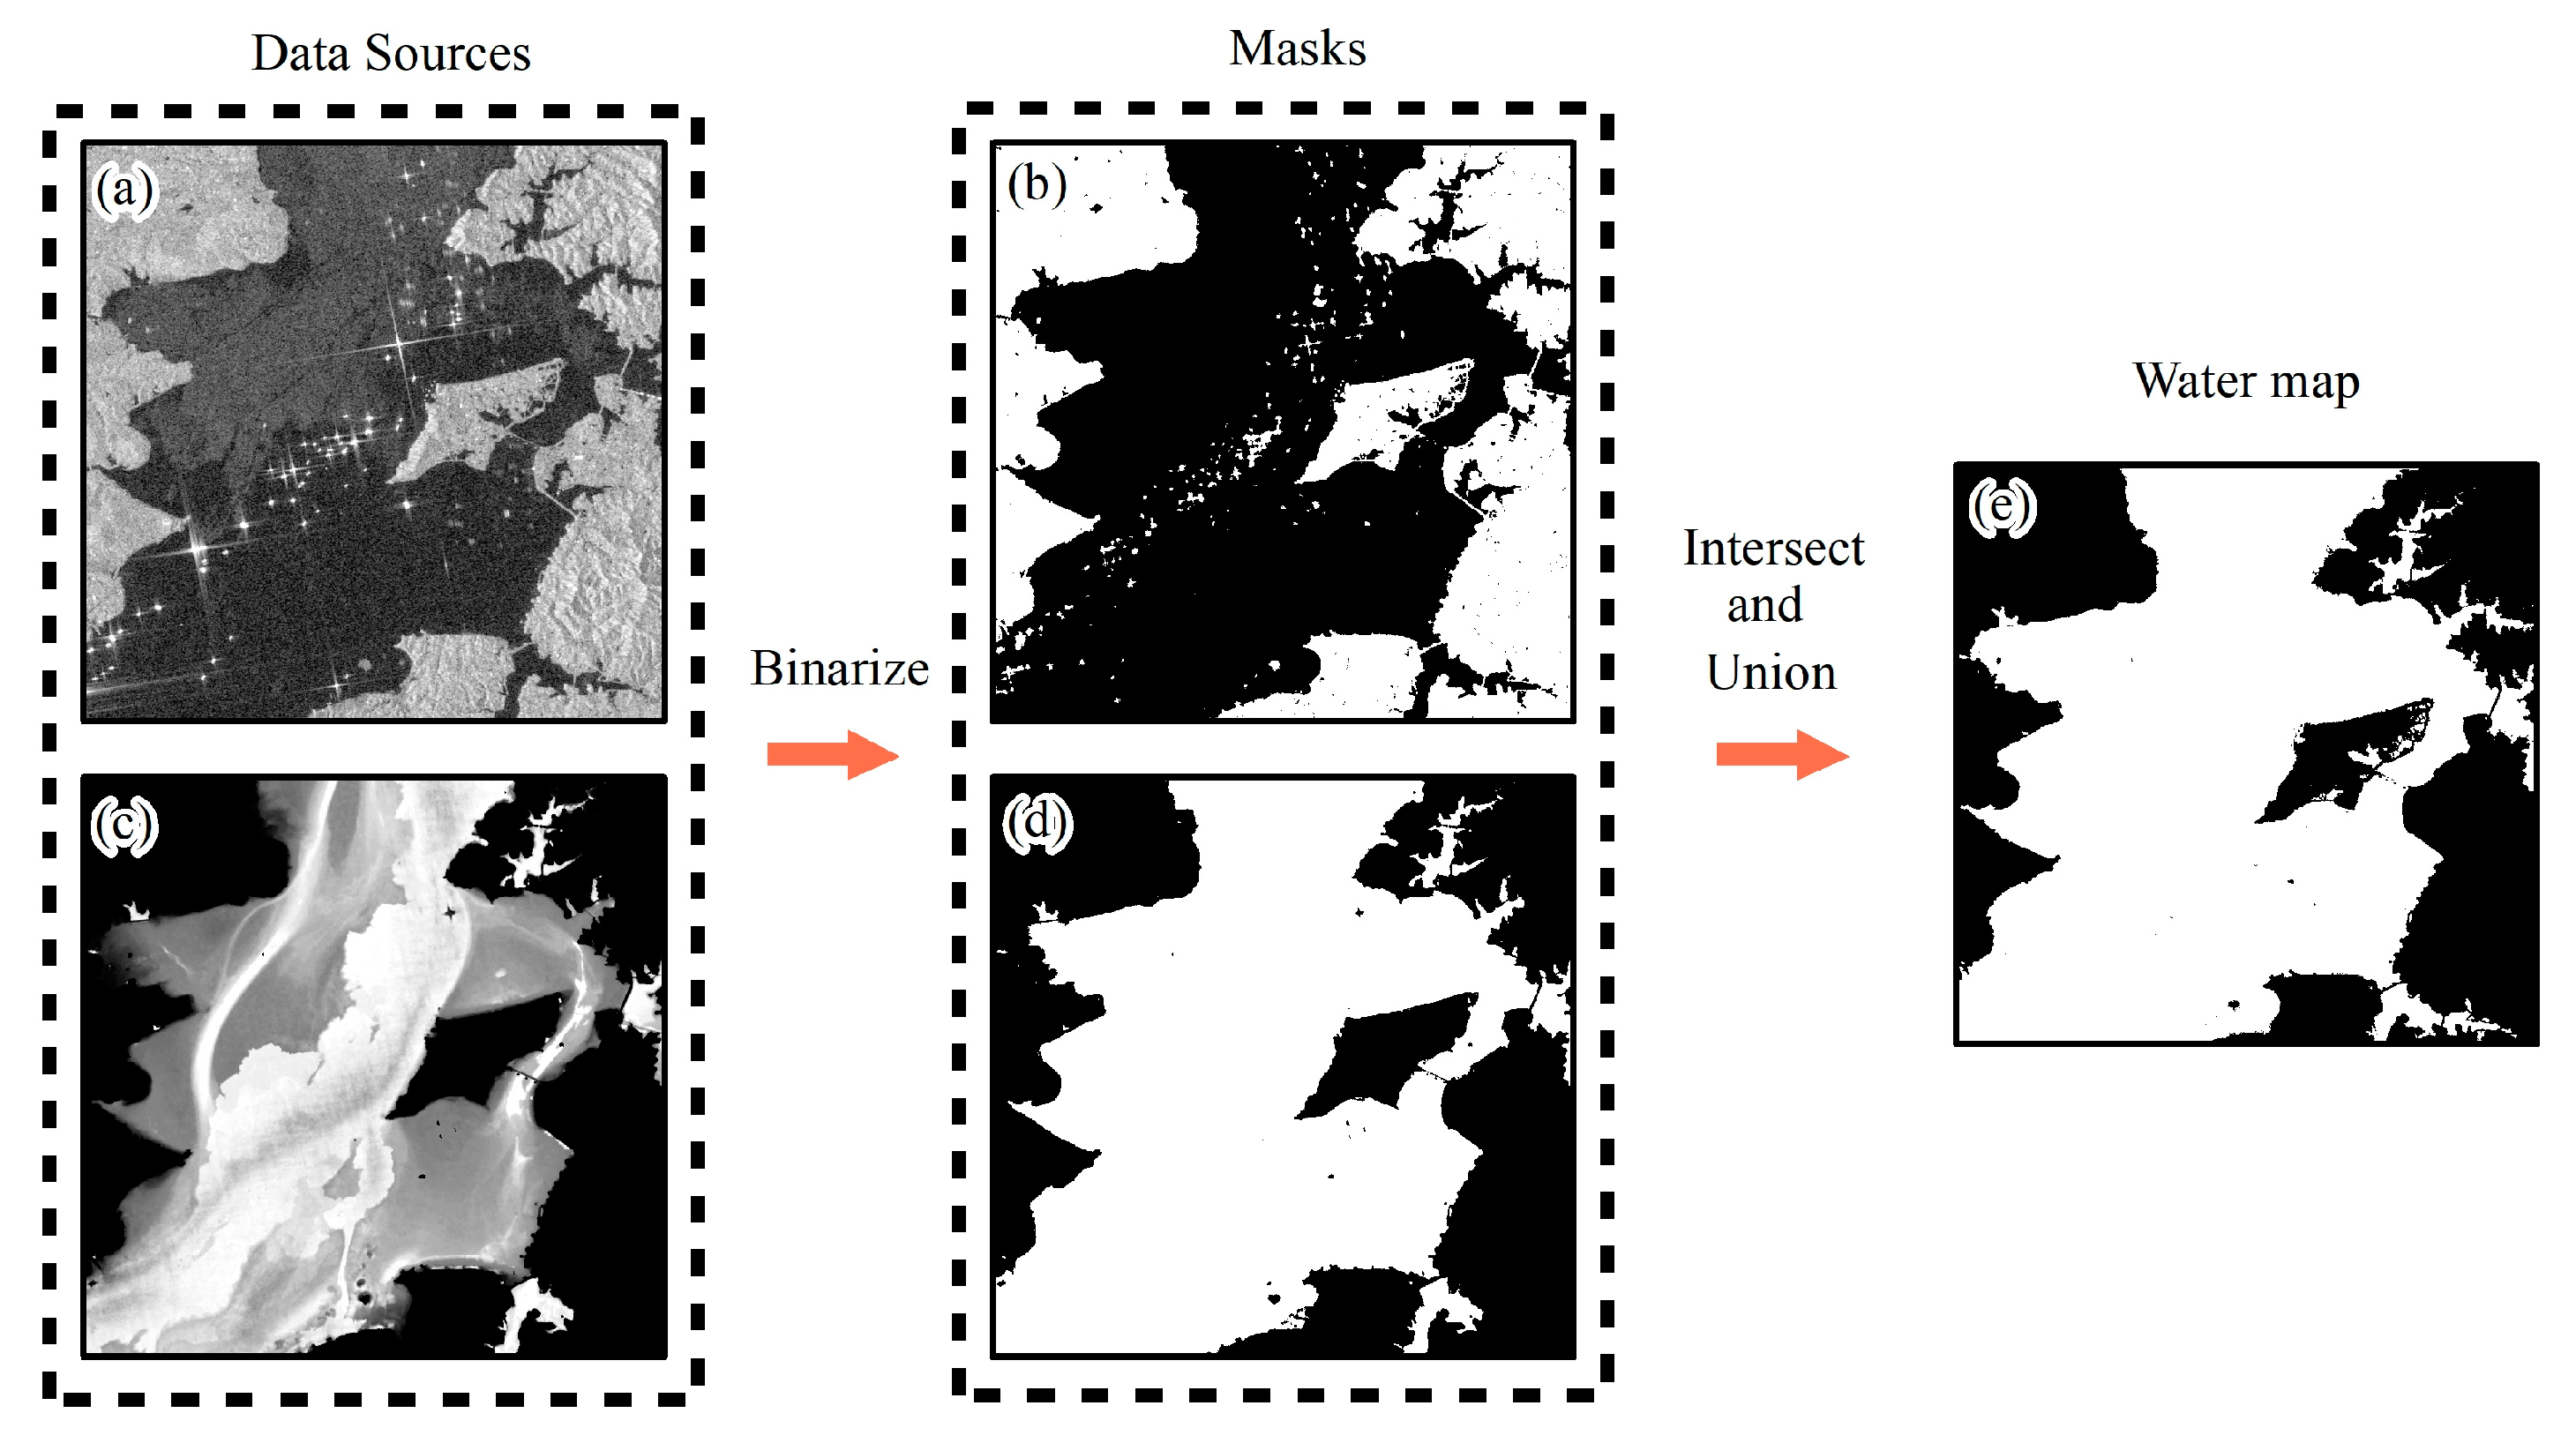
2.3.3. Temporal-Filtering Algorithm
- If , assign threshold 1;
- If , assign threshold according to expression of ;
- If , assign threshold 0.
2.3.4. Evaluation Design
2.3.5. Analysis of Water Dynamics
3. Results
4. Discussion
4.1. Surface Water Mapping Algorithms
4.2. The Inundation Frequency Maps
4.3. Limitation and Caveats
4.4. Future Work
5. Conclusions
Author Contributions
Funding
Data Availability Statement
Conflicts of Interest
References
- Downing, J.A.; Prairie, Y.T.; Cole, J.J.; Duarte, C.M.; Tranvik, L.J.; Striegl, R.G.; McDowell, W.H.; Kortelainen, P.; Caraco, N.F.; Melack, J.M.; et al. The global abundance and size distribution of lakes, ponds, and impoundments. Limnol. Oceanogr. 2006, 51, 2388–2397. [Google Scholar] [CrossRef] [Green Version]
- Pekel, J.F.; Cottam, A.; Gorelick, N.; Belward, A.S. High-resolution mapping of global surface water and its long-term changes. Nature 2016, 540, 418–422. [Google Scholar] [CrossRef] [PubMed]
- Barrow, C.J. Water Resources and Agricultural Development in the Tropics; Routledge: Abingdon, UK, 2016. [Google Scholar]
- Duan, Z.; Bastiaanssen, W.G.M. Estimating water volume variations in lakes and reservoirs from four operational satellite altimetry databases and satellite imagery data. Remote Sens. Environ. 2016, 134, 403–416. [Google Scholar] [CrossRef]
- Messager, M.L.; Ettinger, A.K.; Murphy-Williams, M.; Levin, P.S. Fine-scale assessment of inequities in inland flood vulnerability. Appl. Geogr. 2021, 133, 102492. [Google Scholar] [CrossRef]
- Song, J.H.; Kang, M.S.; Song, I.; Jun, S.M. Water balance in irrigation reservoirs considering flood control and irrigation efficiency variation. J. Irrig. Drain. Eng. 2016, 142, 04016003. [Google Scholar] [CrossRef]
- Verpoorter, C.; Kutser, T.; Seekell, D.A.; Tranvik, L.J. A global inventory of lakes Regime Assessment Method for Lakes based on high-resolution satellite imagery. Geophys. Res. Lett. 2014, 41, 6396–6402. [Google Scholar] [CrossRef]
- Yang, K.; Smith, L.C. Internally drained catchments dominate supraglacial hydrology of the southwest Greenland Ice Sheet. Geophys. Res. Earth Surf. 2016, 121, 1891–1910. [Google Scholar] [CrossRef]
- Cheng, Y.; Niemeyer, R.J.; Mao, Y.; Yearsley, J.R.; Nijssen, B. Climate change impacts on river temperature in the southeastern United States: A case study of the Tennessee River basin. In AGU Fall Meeting Abstracts; American Geophysical Union: Washington, DC, USA, 2016. [Google Scholar]
- Chiang, T.Y.; Perng, Y.H.; Liou, L.E. Impact and adaptation strategies in response to climate change on Taiwan’s water resources. Appl. Mech. Mater. 2017, 858, 335–341. [Google Scholar]
- Klein, I.; Gessner, U.; Dietz, A.J.; Kuenzer, C. Global WaterPack–A 250 m resolution dataset revealing the daily dynamics of global inland water bodies. Remote Sens. Environ. 2017, 198, 345–362. [Google Scholar] [CrossRef]
- Luo, S.; Song, C.; Liu, K.; Ke, L.; Ma, R. An Effective Low-Cost Remote Sensing Approach to Reconstruct the Long-Term and Dense Time Series of Area and Storage Variations for Large Lakes. Sensors 2019, 19, 4247. [Google Scholar] [CrossRef] [Green Version]
- Tong, X.; Pan, H.; Xie, H.; Xu, X.; Li, F.; Chen, L.; Luo, X.; Liu, S.; Chen, P.; Jin, Y. Estimating water volume variations in Lake Victoria over the past 22 years using multi-mission altimetry and remotely sensed images. Remote Sens. Environ. 2016, 187, 400–413. [Google Scholar] [CrossRef]
- Wu, Q.; Lane, C.R.; Wang, L.; Vanderhoof, M.; Christensen, J.R.; Liu, H. Efficient Delineation of Nested Depression Hierarchy in Digital Elevation Models for Hydrological Analysis Using Level-Set Method. Water Resour. Assoc. 2018, 55, 354–368. [Google Scholar] [CrossRef] [PubMed]
- Ahamed, A.; Bolten, J.D. A MODIS-based automated flood monitoring system for southeast asia. Int. J. Appl. Earth Obs. Geoinf. 2017, 61, 104–117. [Google Scholar] [CrossRef] [Green Version]
- Yilmaz, K.K.; Adler, R.F.; Tian, Y.; Hong, Y.; Pierce, H.F. Evaluation of a satellite-based global flood monitoring system. Int. J. Remote Sens. 2010, 31, 3763–3782. [Google Scholar] [CrossRef]
- Fayne, J.V.; Bolten, J.D.; Doyle, C.S.; Fuhrmann, S.; Rice, M.T.; Houser, P.R.; Lakshmi, V. Flood mapping in the lower Mekong River Basin using daily MODIS observations. Int. J. Remote Sens. 2017, 38, 1737–1757. [Google Scholar] [CrossRef]
- Ling, F.; Li, X.; Foody, G.M.; Boyd, D.; Ge, Y.; Li, X.; Du, Y. Monitoring surface water area variations of reservoirs using daily MODIS images by exploring sub-pixel information. ISPRS J. Photogramm. Remote Sens. 2020, 168, 141–152. [Google Scholar] [CrossRef]
- Du, Z.; Li, W.; Zhou, D.; Tian, L.; Ling, F.; Wang, H.; Gui, Y.; Sun, B. Analysis of Landsat-8 OLI imagery for land surface water mapping. Remote Sens. Lett. 2014, 5, 672–681. [Google Scholar] [CrossRef]
- Ji, L.; Geng, X.; Sun, K.; Zhao, Y.; Gong, P. Target detection method for water mapping using Landsat 8 OLI/TIRS imagery. Water 2015, 7, 794–817. [Google Scholar] [CrossRef] [Green Version]
- Yang, X.; Zhao, S.; Qin, X.; Zhao, N.; Liang, L. Mapping of urban surface water bodies from Sentinel-2 MSI imagery at 10 m resolution via NDWI-based image sharpening. Remote Sens. 2017, 9, 596. [Google Scholar] [CrossRef] [Green Version]
- Du, Y.; Zhang, Y.; Ling, F.; Wang, Q.; Li, W.; Li, X. Water Bodies’ Mapping from Sentinel-2 Imagery with Modified Normalized Difference Water Index at 10-m Spatial Resolution Produced by Sharpening the SWIR Band. Remote Sens. 2016, 8, 354. [Google Scholar] [CrossRef] [Green Version]
- Jones, J.W. Efficient wetland surface water detection and monitoring via landsat: Comparison with in situ data from the everglades depth estimation network. Remote Sens. 2015, 7, 12503–12538. [Google Scholar] [CrossRef] [Green Version]
- Jones, J.W. Improved automated detection of subpixel-scale inundation—Revised dynamic surface water extent (dswe) partial surface water tests. Remote Sens. 2019, 11, 374. [Google Scholar] [CrossRef] [Green Version]
- Xu, H. Modification of normalised difference water index (NDWI) to enhance open water features in remotely sensed imagery. Int. J. Remote Sens. 2006, 27, 3025–3033. [Google Scholar] [CrossRef]
- Feyisa, G.L.; Meilby, H.; Fensholt, R.; Proud, S.R. Automated Water Extraction Index: A new technique for surface water mapping using Landsat imagery. Remote Sens. Environ. 2014, 140, 23–35. [Google Scholar] [CrossRef]
- Ling, F.; Xiao, F.; Du, Y.; Xue, H.P.; Ren, X.Y. Waterline mapping at the subpixel scale from remote sensing imagery with high-resolution digital elevation models. Int. J. Remote Sens. 2008, 29, 1809–1815. [Google Scholar] [CrossRef]
- Li, X.; Ling, F.; Foody, G.M.; Boyd, D.S.; Jiang, L.; Zhang, Y.; Zhou, P.; Wang, Y.; Chen, R.; Du, Y. Monitoring high spatiotemporal water dynamics by fusing MODIS, Landsat, water occurrence data and DEM. Remote Sens. Environ. 2021, 265, 112680. [Google Scholar] [CrossRef]
- Zhou, Y.; Dong, J.; Xiao, X.; Xiao, T.; Yang, Z.; Zhao, G.; Zou, Z.; Qin, Y. Open surface water mapping algorithms: A comparison of water-related spectral indices and sensors. Water 2017, 9, 256. [Google Scholar] [CrossRef]
- Isikdogan, F.; Bovik, A.C.; Passalacqua, P. Surface water mapping by deep learning. IEEE J. Sel. Top. Appl. Earth Obs. Remote Sens. 2017, 10, 4909–4918. [Google Scholar] [CrossRef]
- Yin, Z.; Ling, F.; Li, X.; Cai, X.; Chi, H.; Li, X.; Wang, L.; Zhang, Y.; Du, Y. A Cascaded Spectral-Spatial CNN Model for Super-Resolution River Mapping With MODIS Imagery. IEEE Trans. Geosci. Remote Sens. 2021, 60, 5614213. [Google Scholar] [CrossRef]
- Ling, F.; Boyd, D.; Ge, Y.; Foody, G.M.; Li, X.; Wang, L.; Zhang, Y.; Shi, L.; Shang, C.; Li, X.; et al. Measuring river wetted width from remotely sensed imagery at the subpixel scale with a deep convolutional neural network. Water Resour. Res. 2019, 55, 5631–5649. [Google Scholar] [CrossRef]
- Feng, M.; Sexton, J.O.; Channan, S.; Townshend, J.R. A global, high-resolution (30-m) inland water body dataset for 2000: First results of a topographic–spectral classification algorithm. Int. J. Digit. Earth 2016, 9, 113–133. [Google Scholar] [CrossRef] [Green Version]
- Liao, A.; Chen, L.; Chen, J.; He, C.; Cao, X.; Chen, J.; Peng, S.; Sun, F.; Gong, P. High-resolution remote sensing mapping of global land water. Sci. China Earth Sci. 2014, 57, 2305–2316. [Google Scholar] [CrossRef]
- Markert, K.N.; Chishtie, F.; Anderson, E.R.; Saah, D.; Griffin, R.E. On the merging of optical and SAR satellite imagery for surface water mapping applications. Results Phys. 2018, 9, 275–277. [Google Scholar] [CrossRef]
- Shi, L.; Ling, F.; Foody, G.M.; Chen, C.; Fang, S.; Li, X.; Zhang, Y.; Du, Y. Permanent disappearance and seasonal fluctuation of urban lake area in Wuhan, China monitored with long time series remotely sensed images from 1987 to 2016. Int. J. Remote Sens. 2019, 40, 8484–8505. [Google Scholar] [CrossRef]
- Du, Y.; Xue, H.P.; Wu, S.J.; Ling, F.; Xiao, F.; Wei, X.H. Lake area changes in the middle Yangtze region of China over the 20th century. J. Environ. Manag. 2011, 92, 1248–1255. [Google Scholar] [CrossRef]
- Li, X.; Ling, F.; Cai, X.; Ge, Y.; Li, X.; Yin, Z.; Shang, C.; Jia, X.; Du, Y. Mapping water bodies under cloud cover using remotely sensed optical images and a spatiotemporal dependence model. Int. J. Appl. Earth Obs. Geoinf. 2021, 103, 102470. [Google Scholar] [CrossRef]
- Oddo, P.C.; Bolten, J.D. The Value of Near Real-Time Earth Observations for Improved Flood Disaster Response. Front. Environ. Sci. 2019, 7, 127. [Google Scholar] [CrossRef] [Green Version]
- Long, S.; Fatoyinbo, T.E.; Policelli, F. Flood extent mapping for Namibia using change detection and thresholding with SAR. Environ. Res. Lett. 2014, 9, 035002. [Google Scholar] [CrossRef]
- Gstaiger, V.; Huth, J.; Gebhardt, S.; Wehrmann, T.; Kuenzer, C. Multi-sensoral and automated derivation of inundated areas using TerraSAR-X and ENVISAT ASAR data. Int. J. Remote Sens. 2012, 33, 7291–7304. [Google Scholar] [CrossRef]
- Pulvirenti, L.; Pierdicca, N.; Chini, M.; Guerriero, L. An algorithm for operational flood mapping from synthetic aperture radar (SAR) data using fuzzy logic. Nat. Hazards Earth Syst. Sci. 2011, 11, 529–540. [Google Scholar] [CrossRef] [Green Version]
- Sanyal, J.; Lu, X. Application of remote sensing in flood management with special reference to monsoon Asia: A review. Nat. Hazards 2004, 33, 283–301. [Google Scholar] [CrossRef]
- Olthof, I.; Tolszczuk-Leclerc, S. Comparing Landsat and RADARSAT for current and historical dynamic flood mapping. Remote Sens. 2018, 10, 780. [Google Scholar] [CrossRef] [Green Version]
- Schumann, G.; Di Baldassarre, G.; Bates, P.D. The utility of spaceborne radar to render flood inundation maps based on multialgorithm ensembles. IEEE Trans. Geosci. Remote Sens. 2009, 47, 2801–2807. [Google Scholar] [CrossRef]
- Chini, M.; Hostache, R.; Giustarini, L.; Matgen, P. A hierarchical split-based approach for parametric thresholding of SAR images: Flood inundation as a test case. IEEE Trans. Geosci. Remote Sens. 2017, 55, 6975–6988. [Google Scholar] [CrossRef]
- Westerhoff, R.S.; Kleuskens, M.P.H.; Winsemius, H.C.; Huizinga, H.J.; Brakenridge, G.R.; Bishop, C. Automated global water mapping based on wide-swath orbital synthetic-aperture radar. Hydrol. Earth Syst. Sci. 2013, 17, 651–663. [Google Scholar] [CrossRef] [Green Version]
- Benoudjit, A.; Guida, R. A novel fully automated mapping of the flood extent on SAR images using a supervised classifier. Remote Sens. 2019, 11, 779. [Google Scholar] [CrossRef] [Green Version]
- Shen, X.; Anagnostou, E.N.; Allen, G.H.; Brakenridge, G.R.; Kettner, A.J. Near-real-time non-obstructed flood inundation mapping using synthetic aperture radar. Remote Sens. Environ. 2019, 221, 302–315. [Google Scholar] [CrossRef]
- Markert, K.N.; Markert, A.M.; Mayer, T.; Nauman, C.; Haag, A.; Poortinga, A.; Bhandari, B.; Thwal, N.S.; Kunlamai, T.; Chishtie, F.; et al. Comparing Sentinel-1 Surface Water Mapping Algorithms and Radiometric Terrain Correction Processing in Southeast Asia Utilizing Google Earth Engine. Remote Sens. 2020, 12, 2469. [Google Scholar] [CrossRef]
- Chen, X.; Wu, T.; Ruan, X. Updated Progress in Polarimetric SAR Techniques on Vessel Detection. Remote Sens. Technol. Appl. 2009, 6, 841–848. [Google Scholar]
- Song, L.; Song, C.; Luo, S.; Chen, T.; Liu, K.; Li, Y.; Jing, H.; Xu, J. Refining and densifying the water inundation area and storage estimates of Poyang Lake by integrating Sentinel-1/2 and bathymetry data. Int. J. Appl. Earth Obs. Geoinf. 2021, 105, 102601. [Google Scholar] [CrossRef]
- Ding, X.; Li, X. Monitoring of the water-area variations of Lake Dongting in China with ENVISAT ASAR images. Int. J. Appl. Earth Obs. Geoinf. 2011, 13, 894–901. [Google Scholar] [CrossRef]
- Hu, Y.; Huang, J.; Du, Y.; Han, P.; Huang, W. Monitoring spatial and temporal dynamics of flood regimes and their relation to wetland landscape patterns in Dongting Lake from MODIS time-series imagery. Remote Sens. 2015, 7, 7494–7520. [Google Scholar] [CrossRef] [Green Version]
- Li, J.; Wang, C.; Xu, L.; Wu, F.; Zhang, H.; Zhang, B. Multitemporal Water Extraction of Dongting Lake and Poyang Lake Based on an Automatic Water Extraction and Dynamic Monitoring Framework. Remote Sens. 2021, 13, 865. [Google Scholar] [CrossRef]
- Tian, H.; Li, W.; Wu, M.; Huang, N.; Li, G.; Li, X.; Niu, Z. Dynamic Monitoring of the Largest Freshwater Lake in China Using a New Water Index Derived from High Spatiotemporal Resolution Sentinel-1A Data. Remote Sens. 2017, 9, 521. [Google Scholar] [CrossRef] [Green Version]
- ILEC (International Lake Environment Committee Foundation). World Lake Database; ILEC: Kusatsu, Japan, 1999. [Google Scholar]
- Feng, L.; Hu, C.; Chen, X.; Li, R.; Tian, L.; Murch, B. MODIS observations of the bottom topography and its inter-annual variability of Poyang Lake. Remote Sens. Environ. 2011, 15, 2729–2741. [Google Scholar] [CrossRef]
- Shankman, D.; Keim, B.D.; Song, J. Flood frequency in China’s Poyang Lake region: Trends and teleconnections. Int. J. Climatol. 2006, 26, 1255–1266. [Google Scholar] [CrossRef] [Green Version]
- Zhang, J.; Xu, K.; Yang, Y.; Qi, L.; Hayashi, S.; Watanabe, M. Measuring water storage fluctuations in Lake Dongting, China, by Topex/Poseidon satellite altimetry. Environ. Monit. Assess. 2006, 115, 23–37. [Google Scholar] [CrossRef]
- Yuan, Y.J.; Zeng, G.M.; Liang, J.; Huang, L.; Hua, S.S.; Li, F.; Zhu, Y.; Wu, H.P.; Liu, J.Y.; He, X.X.; et al. Variation of water level in Dongting Lake over a 50-year period: Implications for the impacts of anthropogenic and climatic factors. J. Hydrol. 2015, 525, 450–456. [Google Scholar] [CrossRef]
- Twele, A.; Cao, W.; Plank, S.; Martinis, S. Sentinel-1-based flood mapping: A fully automated processing chain. Int. J. Remote Sens. 2016, 37, 2990–3004. [Google Scholar] [CrossRef]
- Uddin, K.; Matin, M.A.; Meyer, F.J. Operational Flood Mapping Using Multi-Temporal Sentinel-1 SAR Images: A Case Study from Bangladesh. Remote Sens. 2019, 11, 1581. [Google Scholar] [CrossRef] [Green Version]
- Lee, I.; Wen, J.; Ainsworth, T.L.; Chen, K.; Chen, A. Improved Sigma Filter for Speckle Filtering of SAR Imagery. IEEE Trans. Geosci. Remote Sens. 2009, 47, 202–213. [Google Scholar]
- Salameh, E.; Frappart, F.; Turki, I.; Laignel, B. Intertidal topography mapping using the waterline method from Sentinel-1 & -2 images: The examples of Arcachon and Veys Bays in France. ISPRS J. Photogramm. Remote Sens. 2020, 163, 98–120. [Google Scholar]
- Yang, K.; Smith, L.C.; Sole, A.; Livingstone, S.J.; Cheng, X.; Chen, Z.Q.; Li, M.C. Supraglacial rivers on the northwest Greenland Ice Sheet, Devon Ice Cap, and Barnes Ice Cap mapped using Sentinel-2 imagery. Int. J. Appl. Earth Obs. Geoinf. 2019, 78, 1–13. [Google Scholar] [CrossRef] [Green Version]
- Schlaffer, S.; Chini, M.; Dorigo, W.; Plank, S. Monitoring surface water dynamics in the Prairie Pothole Region of North Dakota using dual-polarised Sentinel-1 synthetic aperture radar (SAR) time series. Hydrol. Earth Syst. Sci. 2021, 26, 841–860. [Google Scholar] [CrossRef]
- Schwatke, C.; Dettmering, D.; Bosch, W.; Seitz, F. DAHITI—An innovative approach for estimating water level time series over inland waters using multi-mission satellite altimetry. Hydrol. Earth Syst. Sci. 2015, 19, 4345–4364. [Google Scholar] [CrossRef] [Green Version]
- Li, K.; Shao, Y.; Zhang, F. Rice information extraction using multi-polarization airborne synthetic aperture radar data. J. Zhejiang Univ. (Agric. Life Sci.) 2011, 37, 181–186. [Google Scholar]
- Otsu, N. A threshold selection method from gray-level histograms. IEEE Trans. Syst. Man Cybern. 1979, 9, 62–66. [Google Scholar] [CrossRef] [Green Version]
- Donchyts, G.; Schellekens, J.; Winsemius, H.; Eisemann, E.; Van de Giesen, N. A 30 m resolution surface water mask including estimation of positional and thematic differences using landsat 8, srtm and openstreetmap: A case study in the Murray-Darling Basin, Australia. Remote Sens. 2016, 8, 386. [Google Scholar] [CrossRef] [Green Version]
- Guo, S.C.; Du, P.J.; Meng, Y.P.; Wang, X.; Tang, P.F.; Lin, C.; Xia, J.S. Dynamic monitoring on flooding situation in the Middle and Lower Reaches of the Yangtze River Region using Sentinel-1A time series. Natl. Remote Sens. Bull. 2021, 25, 2127–2141. [Google Scholar]
- Steinhausen, M.J.; Wagner, P.D.; Narasimhan, B.; Waske, B. Combining Sentinel-1 and Sentinel-2 data for improved land use and land cover mapping of monsoon regions. Int. J. Appl. Earth Obs. Geoinf. 2018, 73, 595–604. [Google Scholar] [CrossRef]
- Yang, X.; Qin, Q.; Yésou, H.; Ledauphin, T.; Koehl, M.; Grussenmeyer, M.; Zhu, Z. Monthly estimation of the surface water extent in France at a 10-m resolution using Sentinel-2 data. Remote Sens. Environ. 2020, 244, 111803. [Google Scholar] [CrossRef]
- Xing, L.; Tang, X.; Wang, H.; Fan, W.; Wang, G. Monitoring monthly surface water dynamics of Dongting Lake using Sentinel-1 data at 10 m. PeerJ. 2018, 6, e4992. [Google Scholar] [CrossRef]
- Zeng, L.; Schmitt, M.; Li, L.; Zhu, X. Analysing changes of the Poyang Lake water area using Sentinel-1 synthetic aperture radar imagery. Int. J. Remote Sens. 2017, 38, 7041–7069. [Google Scholar] [CrossRef] [Green Version]
- Huang, S.; Li, J.; Xu, M. Water surface variations monitoring and flood hazard analysis in Dongting Lake area using long-term Terra/MODIS data time series. Nat. Hazards 2012, 62, 93–100. [Google Scholar]
- Cao, H.; Zhang, H.; Wang, C.; Zhang, B. Operational Flood Detection Using Sentinel-1 SAR Data over Large Areas. Water 2019, 11, 786. [Google Scholar] [CrossRef] [Green Version]
- Mullen, C.; Penny, G.; Müller, M.F. A simple cloud-filling approach for remote sensing water cover assessments. Hydrol. Earth Syst. Sci. 2021, 25, 2373–2386. [Google Scholar]
- Zhao, G.; Gao, H. Automatic correction of contaminated images for assessment of reservoir surface area dynamics. Geophys. Res. Lett. 2018, 45, 6092–6099. [Google Scholar] [CrossRef]

| Region | Bands | Res. (m) | Scenes | ||||
|---|---|---|---|---|---|---|---|
| 2017 | 2018 | 2019 | 2020 | 2021 | |||
| Poyang Lake | VV | 10 | 48 | 48 | 48 | 48 | 48 |
| Dongting Lake | VV | 10 | 96 | 96 | 92 | 80 | 80 |
| Date. | Reference | Site | OA/% | PA/% | UA/% | F1 |
|---|---|---|---|---|---|---|
| 17 September 2017 | 17 September 2017 | Poyang Lake | 95.36 | 91.35 | 90.75 | 0.91 |
| 19 July 2018 | 19 July 2018 | Poyang Lake | 97.20 | 92.97 | 97.37 | 0.95 |
| 2 August 2020 | 1 August 2020 | Poyang Lake | 98.69 | 98.53 | 97.67 | 0.98 |
| 23 July 2021 | 22 July 2021 | Poyang Lake | 98.41 | 97.10 | 97.71 | 0.97 |
| 17 July 2017 | 17 July 2017 | Dongting Lake | 96.01 | 82.72 | 99.68 | 0.90 |
| 17 August 2019 | 16 August 2019 | Dongting Lake | 95.05 | 80.84 | 98.75 | 0.85 |
| 20 August 2020 | 18 August 2020 | Dongting Lake | 97.00 | 88.73 | 98.91 | 0.93 |
| 1 August 2021 | 1 August 2021 | Dongting Lake | 97.50 | 86.59 | 98.46 | 0.92 |
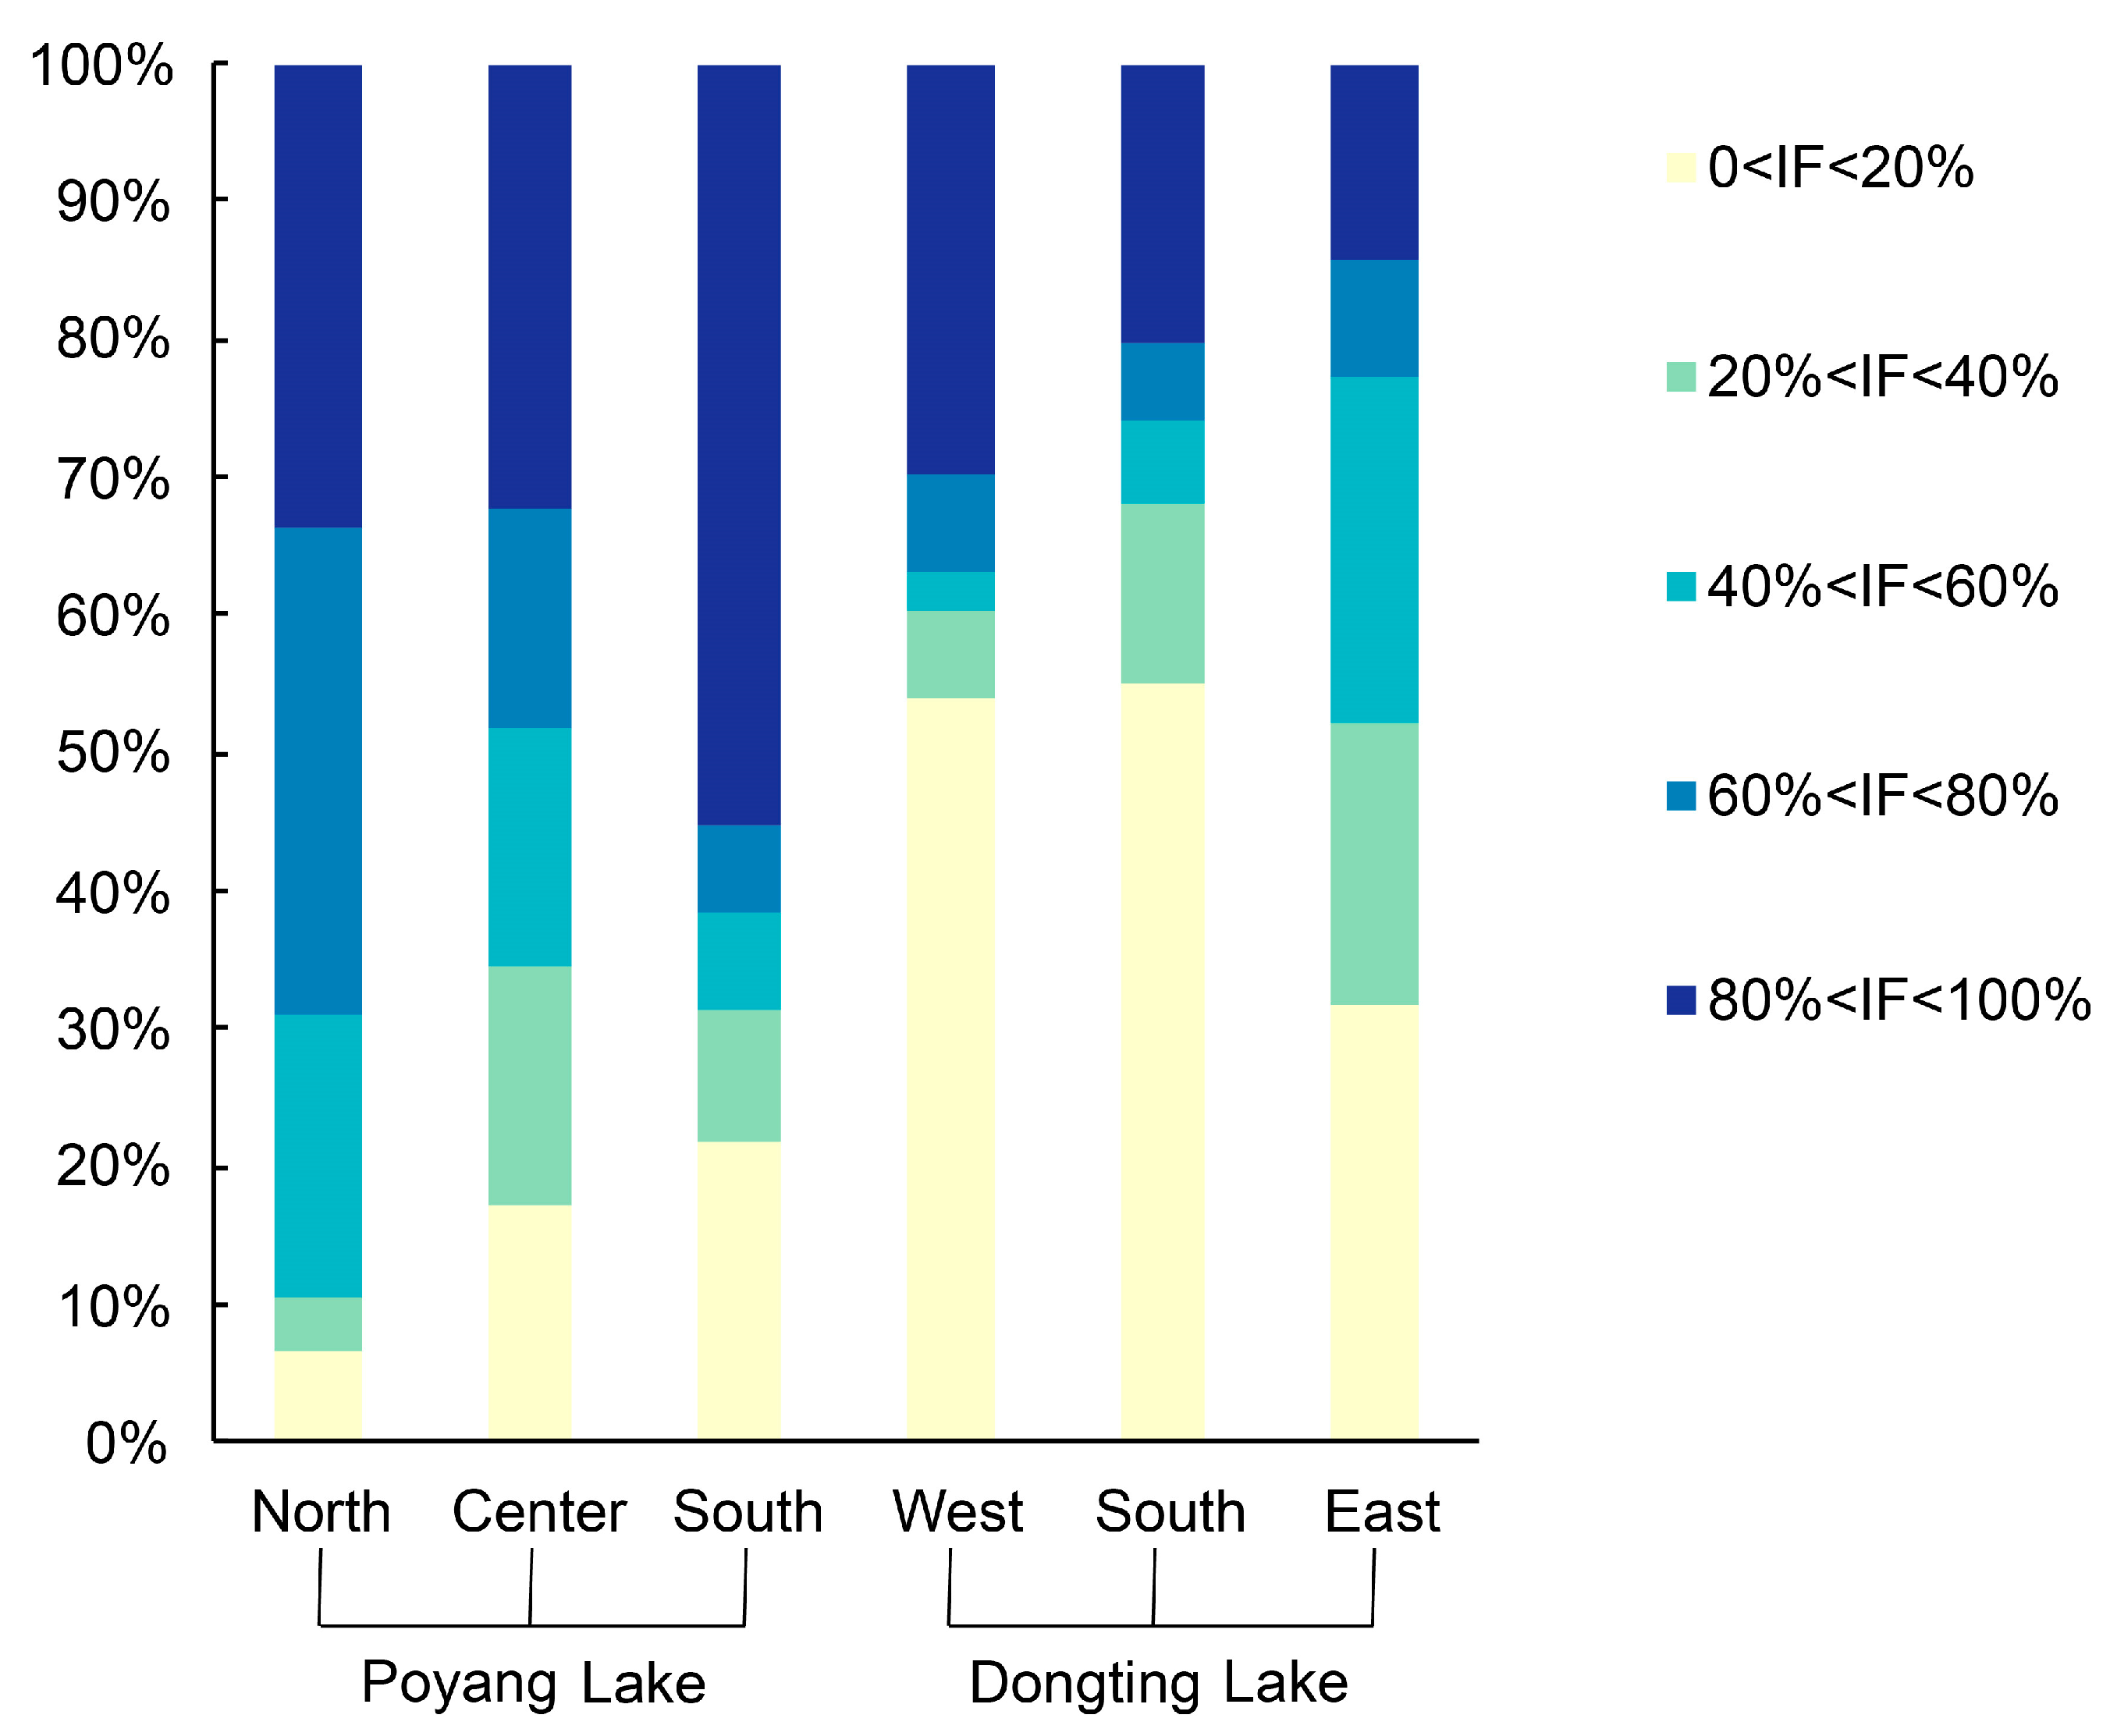
| IF Value | Poyang Lake | Dongting Lake | ||
|---|---|---|---|---|
| Ratio/% | Area/km2 | Ratio/% | Area/km2 | |
| 0–20% | 19.82% | 666.35 | 42.47% | 944.77 |
| 20–40% | 17.25% | 579.75 | 15.64% | 347.99 |
| 40–60% | 18.86% | 634.03 | 15.72% | 349.67 |
| 60–80% | 18.87% | 634.28 | 7.39% | 164.35 |
| 80–100% | 25.20% | 846.98 | 18.78% | 417.75 |
Publisher’s Note: MDPI stays neutral with regard to jurisdictional claims in published maps and institutional affiliations. |
© 2022 by the authors. Licensee MDPI, Basel, Switzerland. This article is an open access article distributed under the terms and conditions of the Creative Commons Attribution (CC BY) license (https://creativecommons.org/licenses/by/4.0/).
Share and Cite
Wang, Z.; Xie, F.; Ling, F.; Du, Y. Monitoring Surface Water Inundation of Poyang Lake and Dongting Lake in China Using Sentinel-1 SAR Images. Remote Sens. 2022, 14, 3473. https://doi.org/10.3390/rs14143473
Wang Z, Xie F, Ling F, Du Y. Monitoring Surface Water Inundation of Poyang Lake and Dongting Lake in China Using Sentinel-1 SAR Images. Remote Sensing. 2022; 14(14):3473. https://doi.org/10.3390/rs14143473
Chicago/Turabian StyleWang, Zirui, Fei Xie, Feng Ling, and Yun Du. 2022. "Monitoring Surface Water Inundation of Poyang Lake and Dongting Lake in China Using Sentinel-1 SAR Images" Remote Sensing 14, no. 14: 3473. https://doi.org/10.3390/rs14143473
APA StyleWang, Z., Xie, F., Ling, F., & Du, Y. (2022). Monitoring Surface Water Inundation of Poyang Lake and Dongting Lake in China Using Sentinel-1 SAR Images. Remote Sensing, 14(14), 3473. https://doi.org/10.3390/rs14143473