
Impact of Snowpack on the Land Surface Phenology in the Tianshan Mountains, Central Asia


Abstract
:
1. Introduction
2. Data and Methods
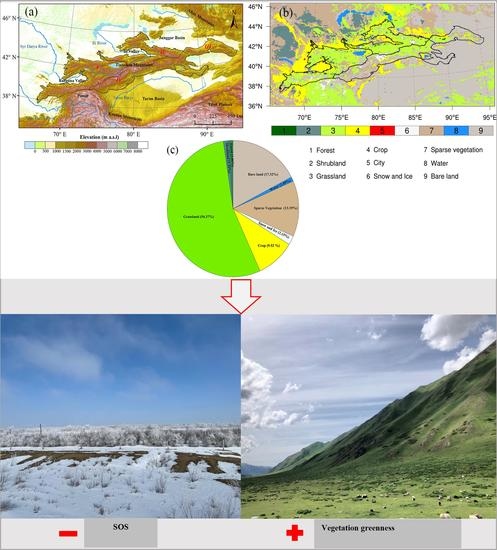
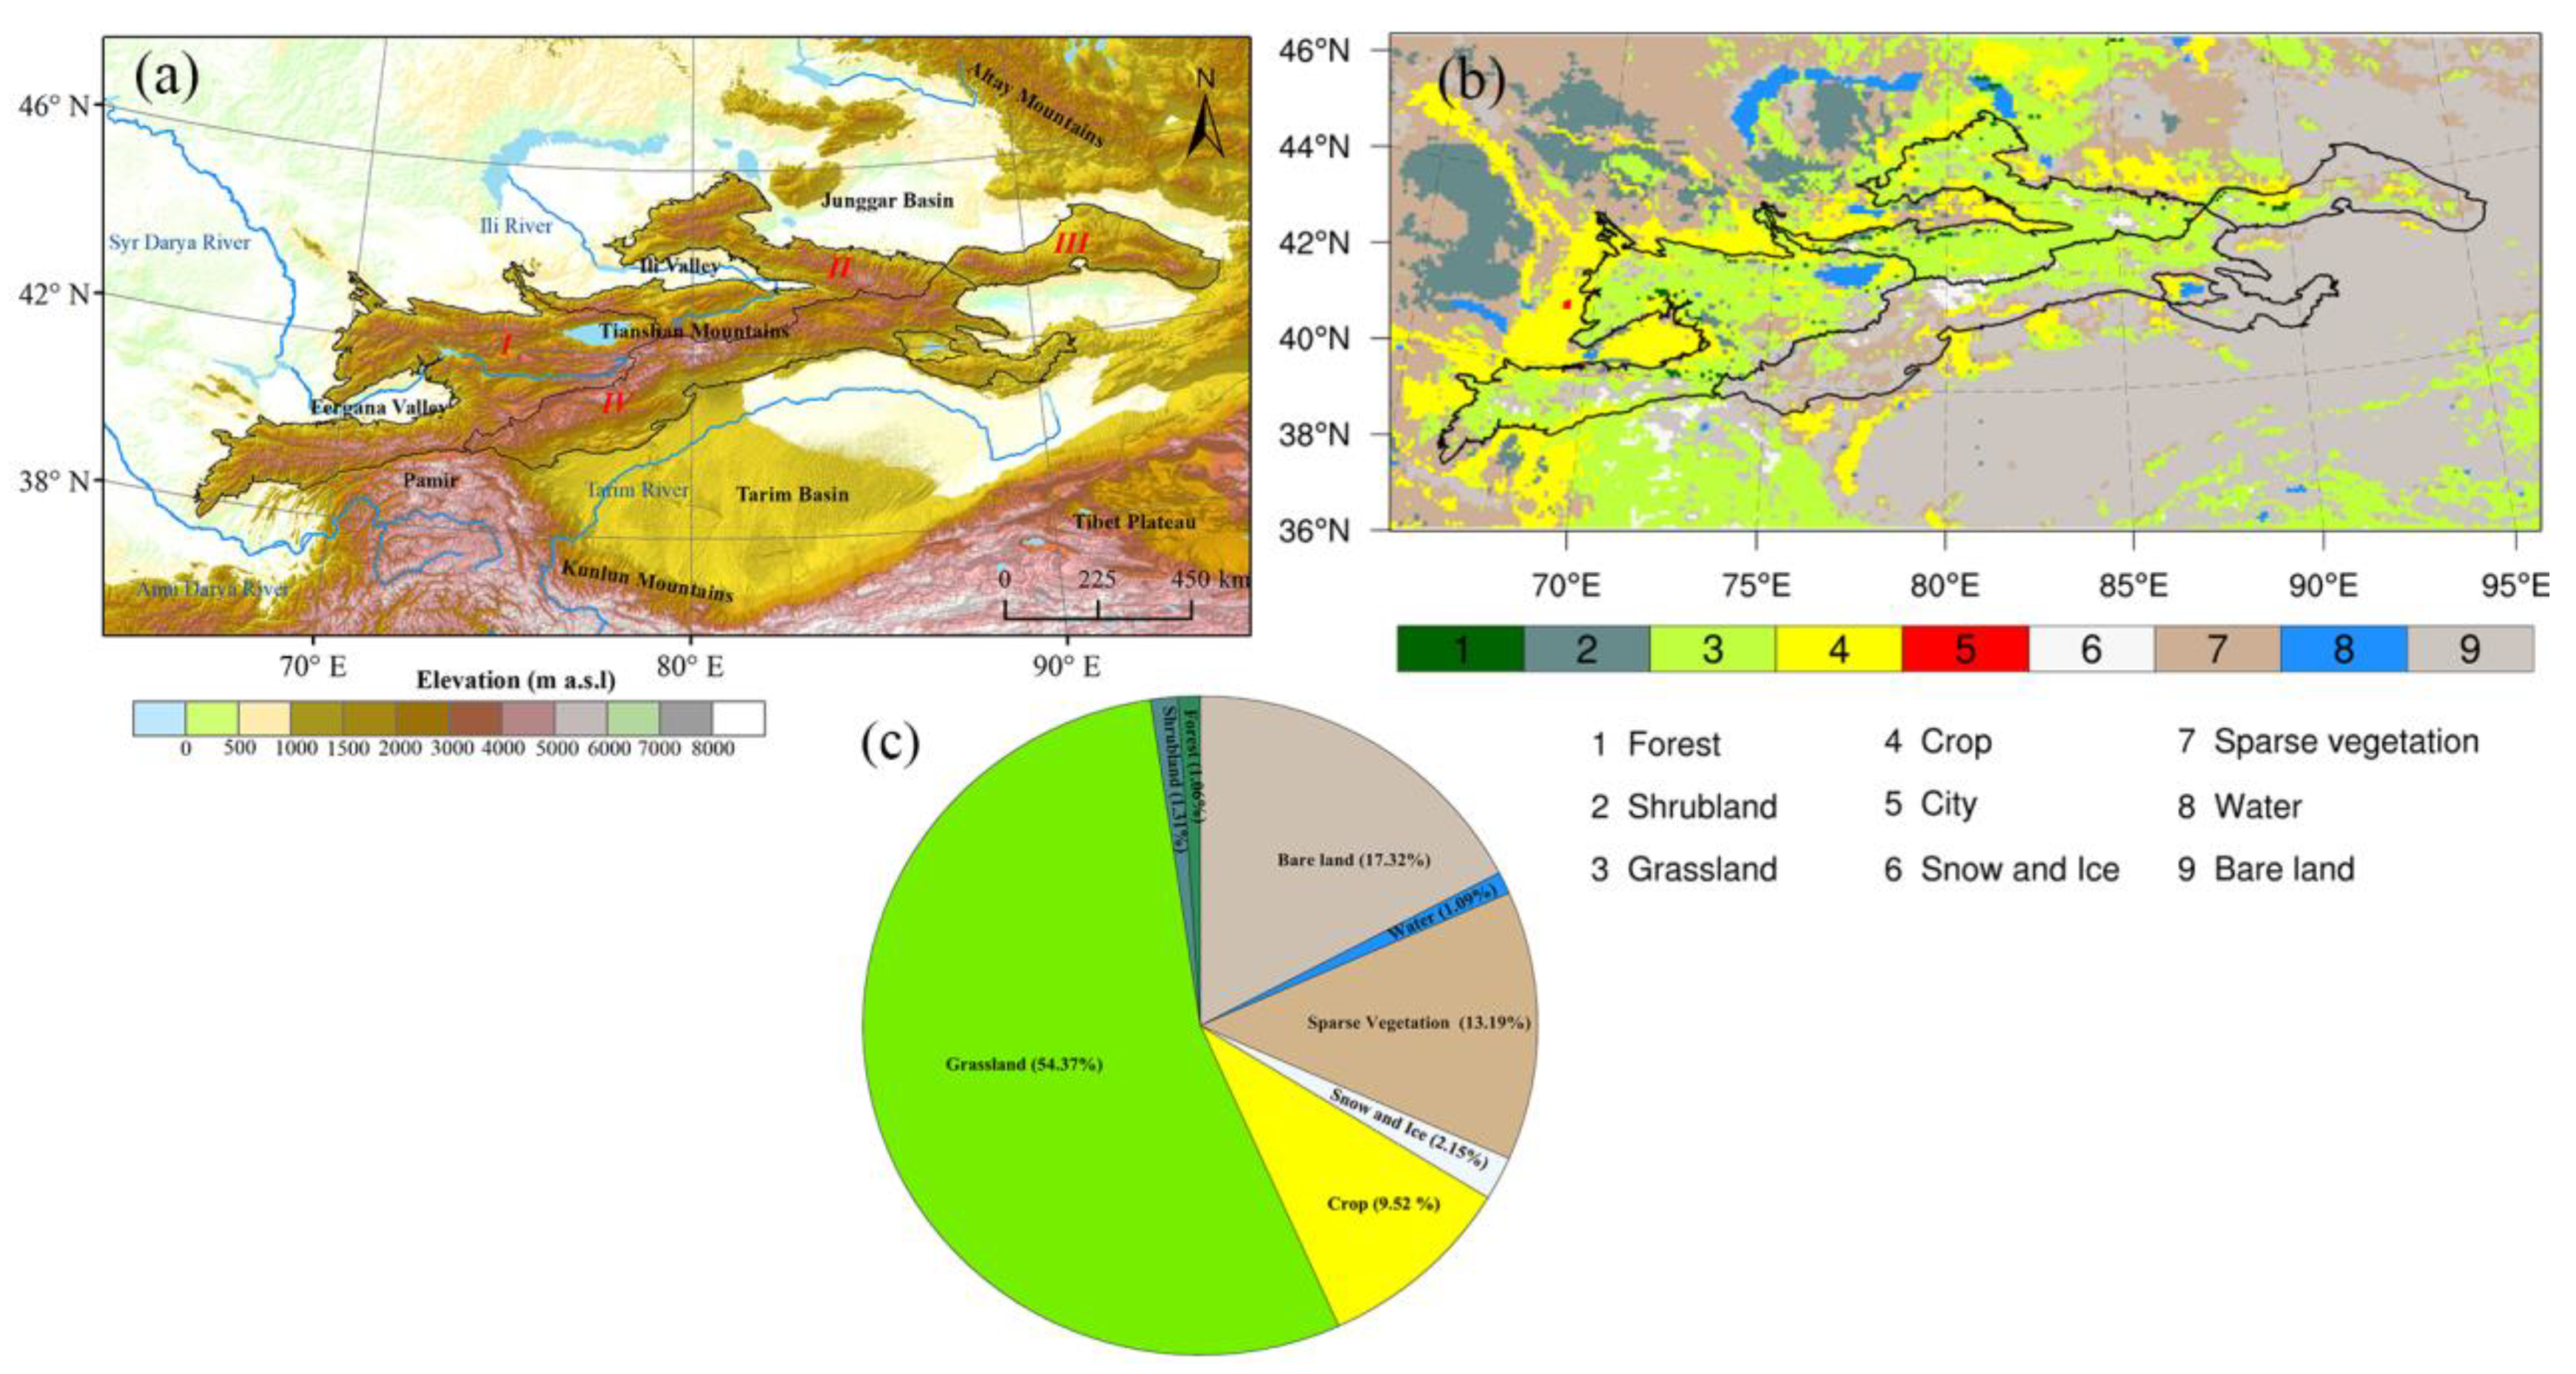
2.1. Study Area
2.2. Datasets
2.2.1. Vegetation Product
2.2.2. Climate Data
2.3. Land Surface Phenology Method
2.4. Statistical Analyses
3. Result
3.1. Spatiotemporal Distribution of Land Surface Phenology
3.2. Spatiotemporal Variability of SWE, SCF, and Snowmelt
3.3. Response of Land Surface Phenology to Snow
4. Discussion
4.1. Influence of Snow on Land Surface Phenology
4.2. Responses of Different Vegetation Types to Snow
4.3. Limitations and Uncertainties
5. Conclusions
- 1
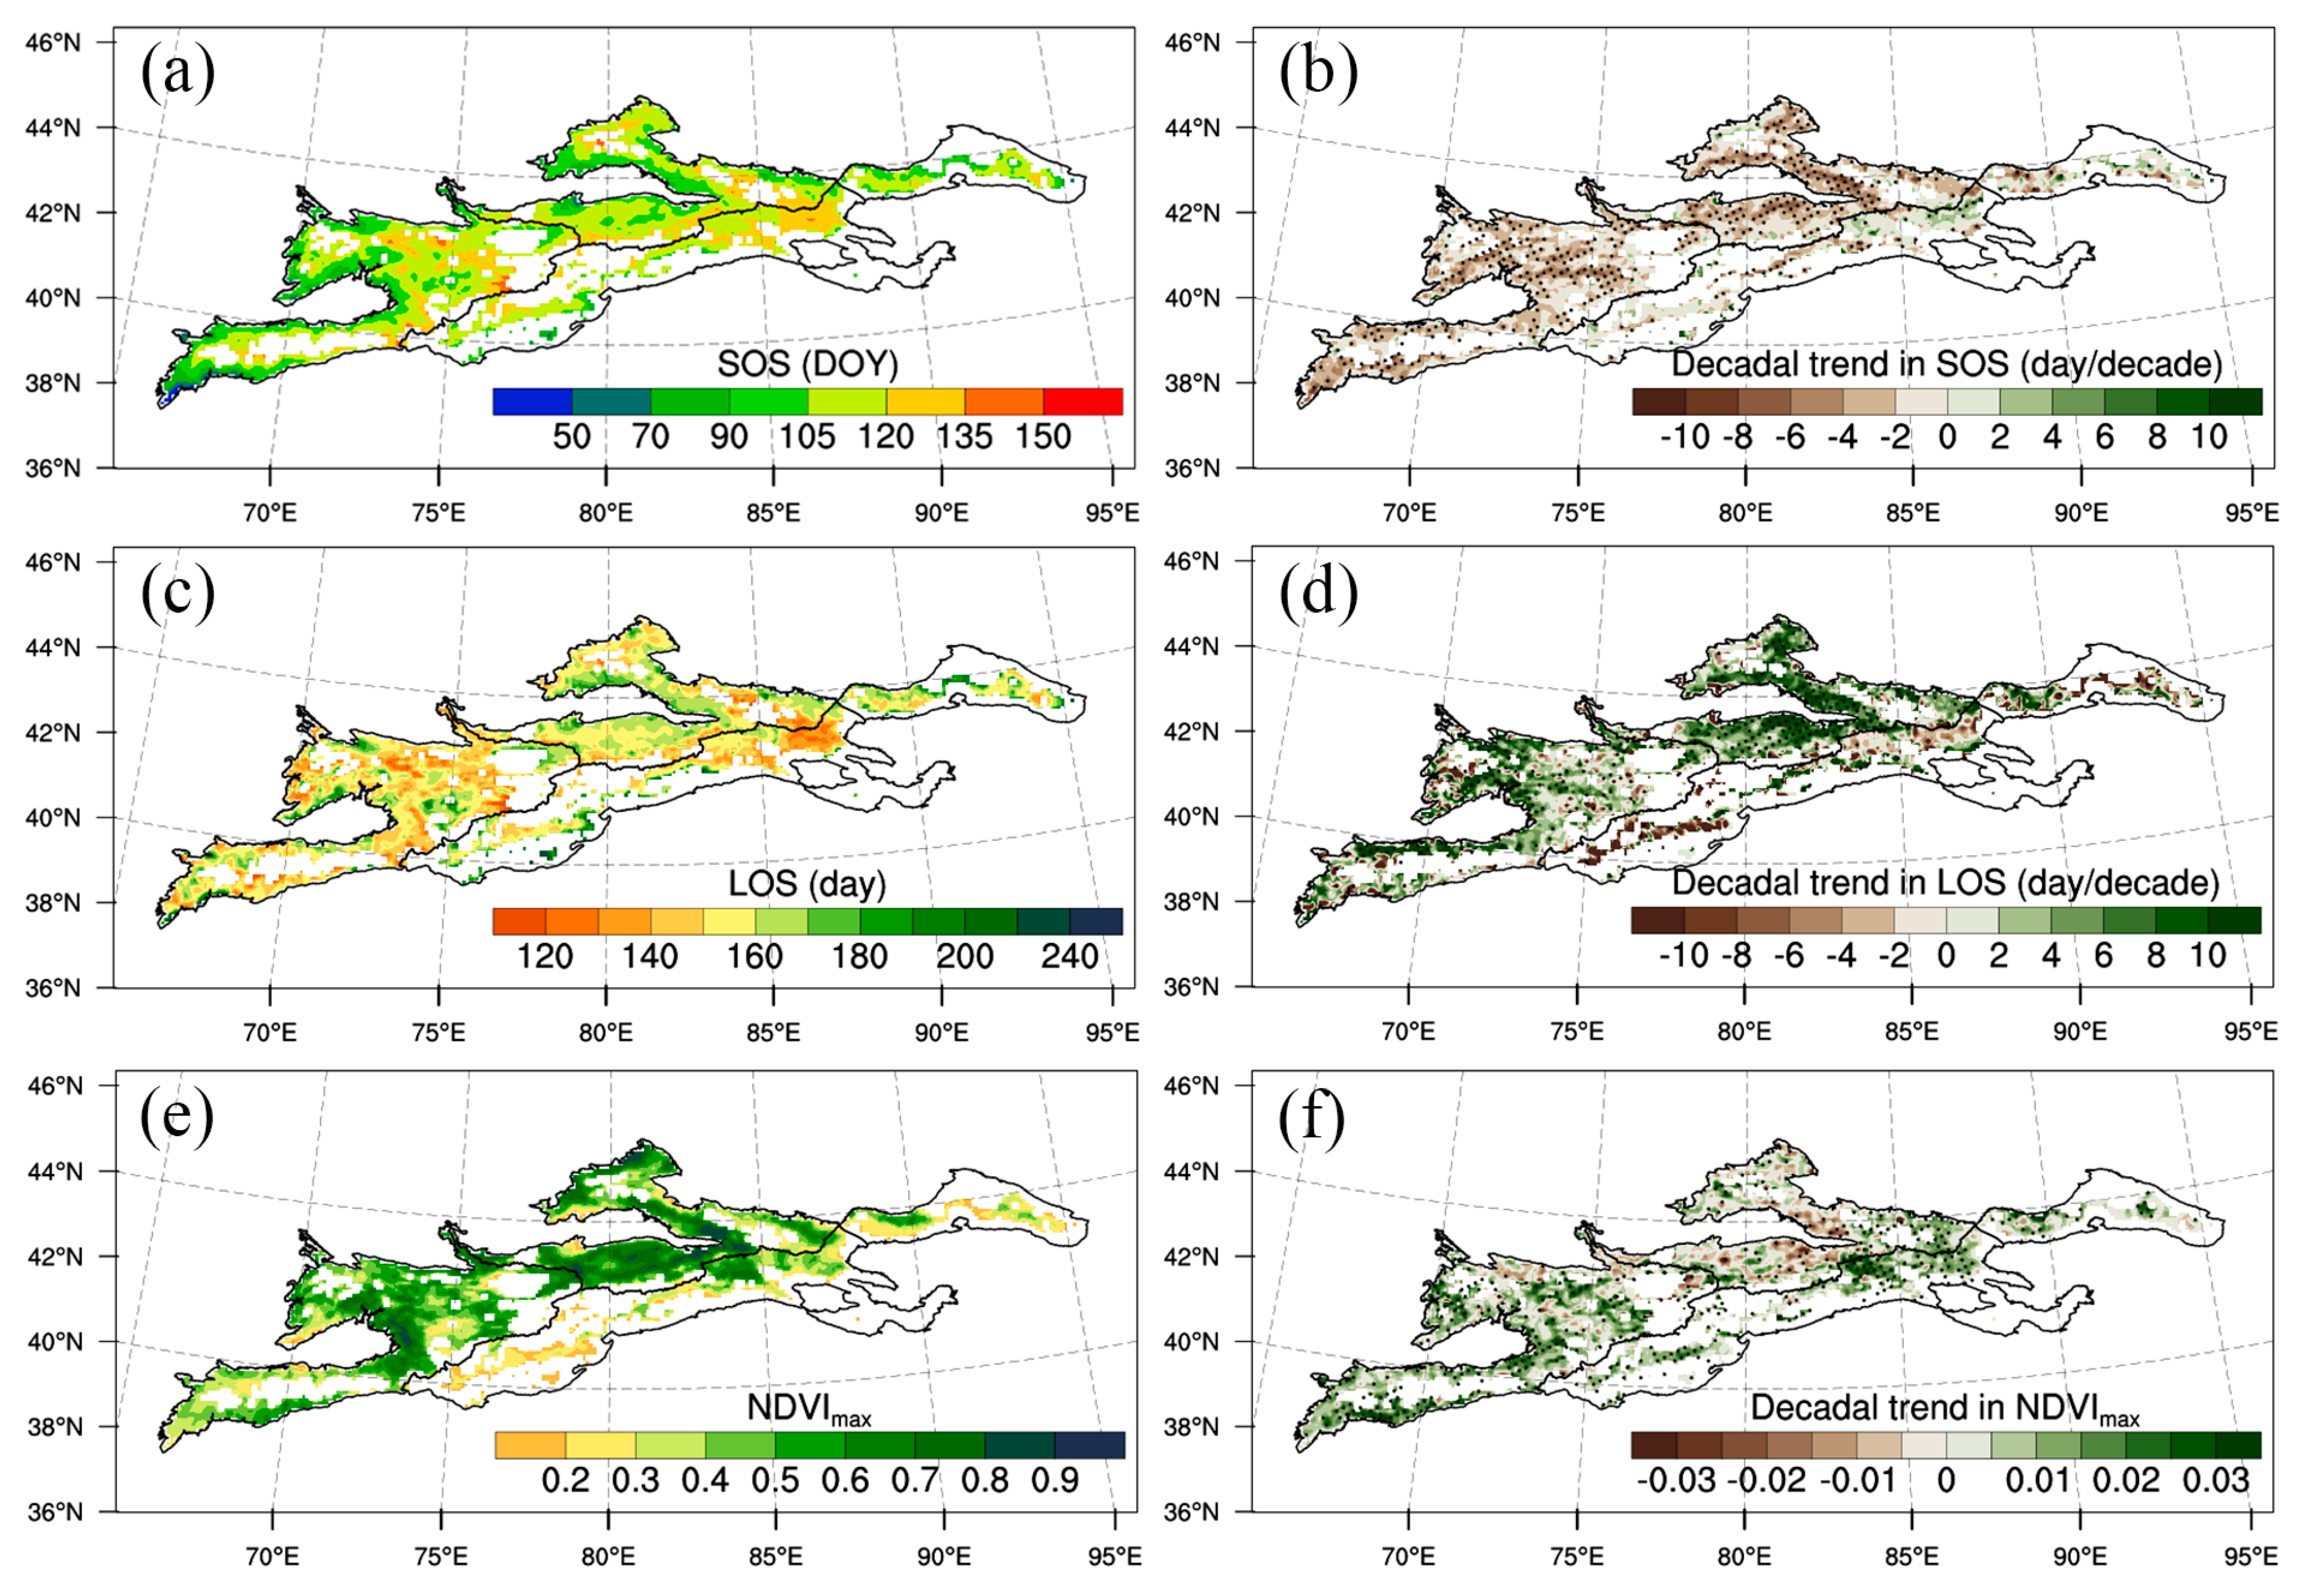
- The annual mean start of growing season was 106.30 (day of the year) and exhibited a significant decrease trend (p < 0.05, −2.45 days/decade), which concentrated in the Ili Valley and Western Tianshan Mountains with an elevation from 2500 to 3500 m a.s.l. In contrast, the length of growing season was 162.24 days and exhibited a significant increase trend (p < 0.05, 2.98 days/decade), which was mainly seen in low-elevation regions (elevations below 3000 m a.s.l) of the Ili Valley and Western Tianshan Mountains.
- 2
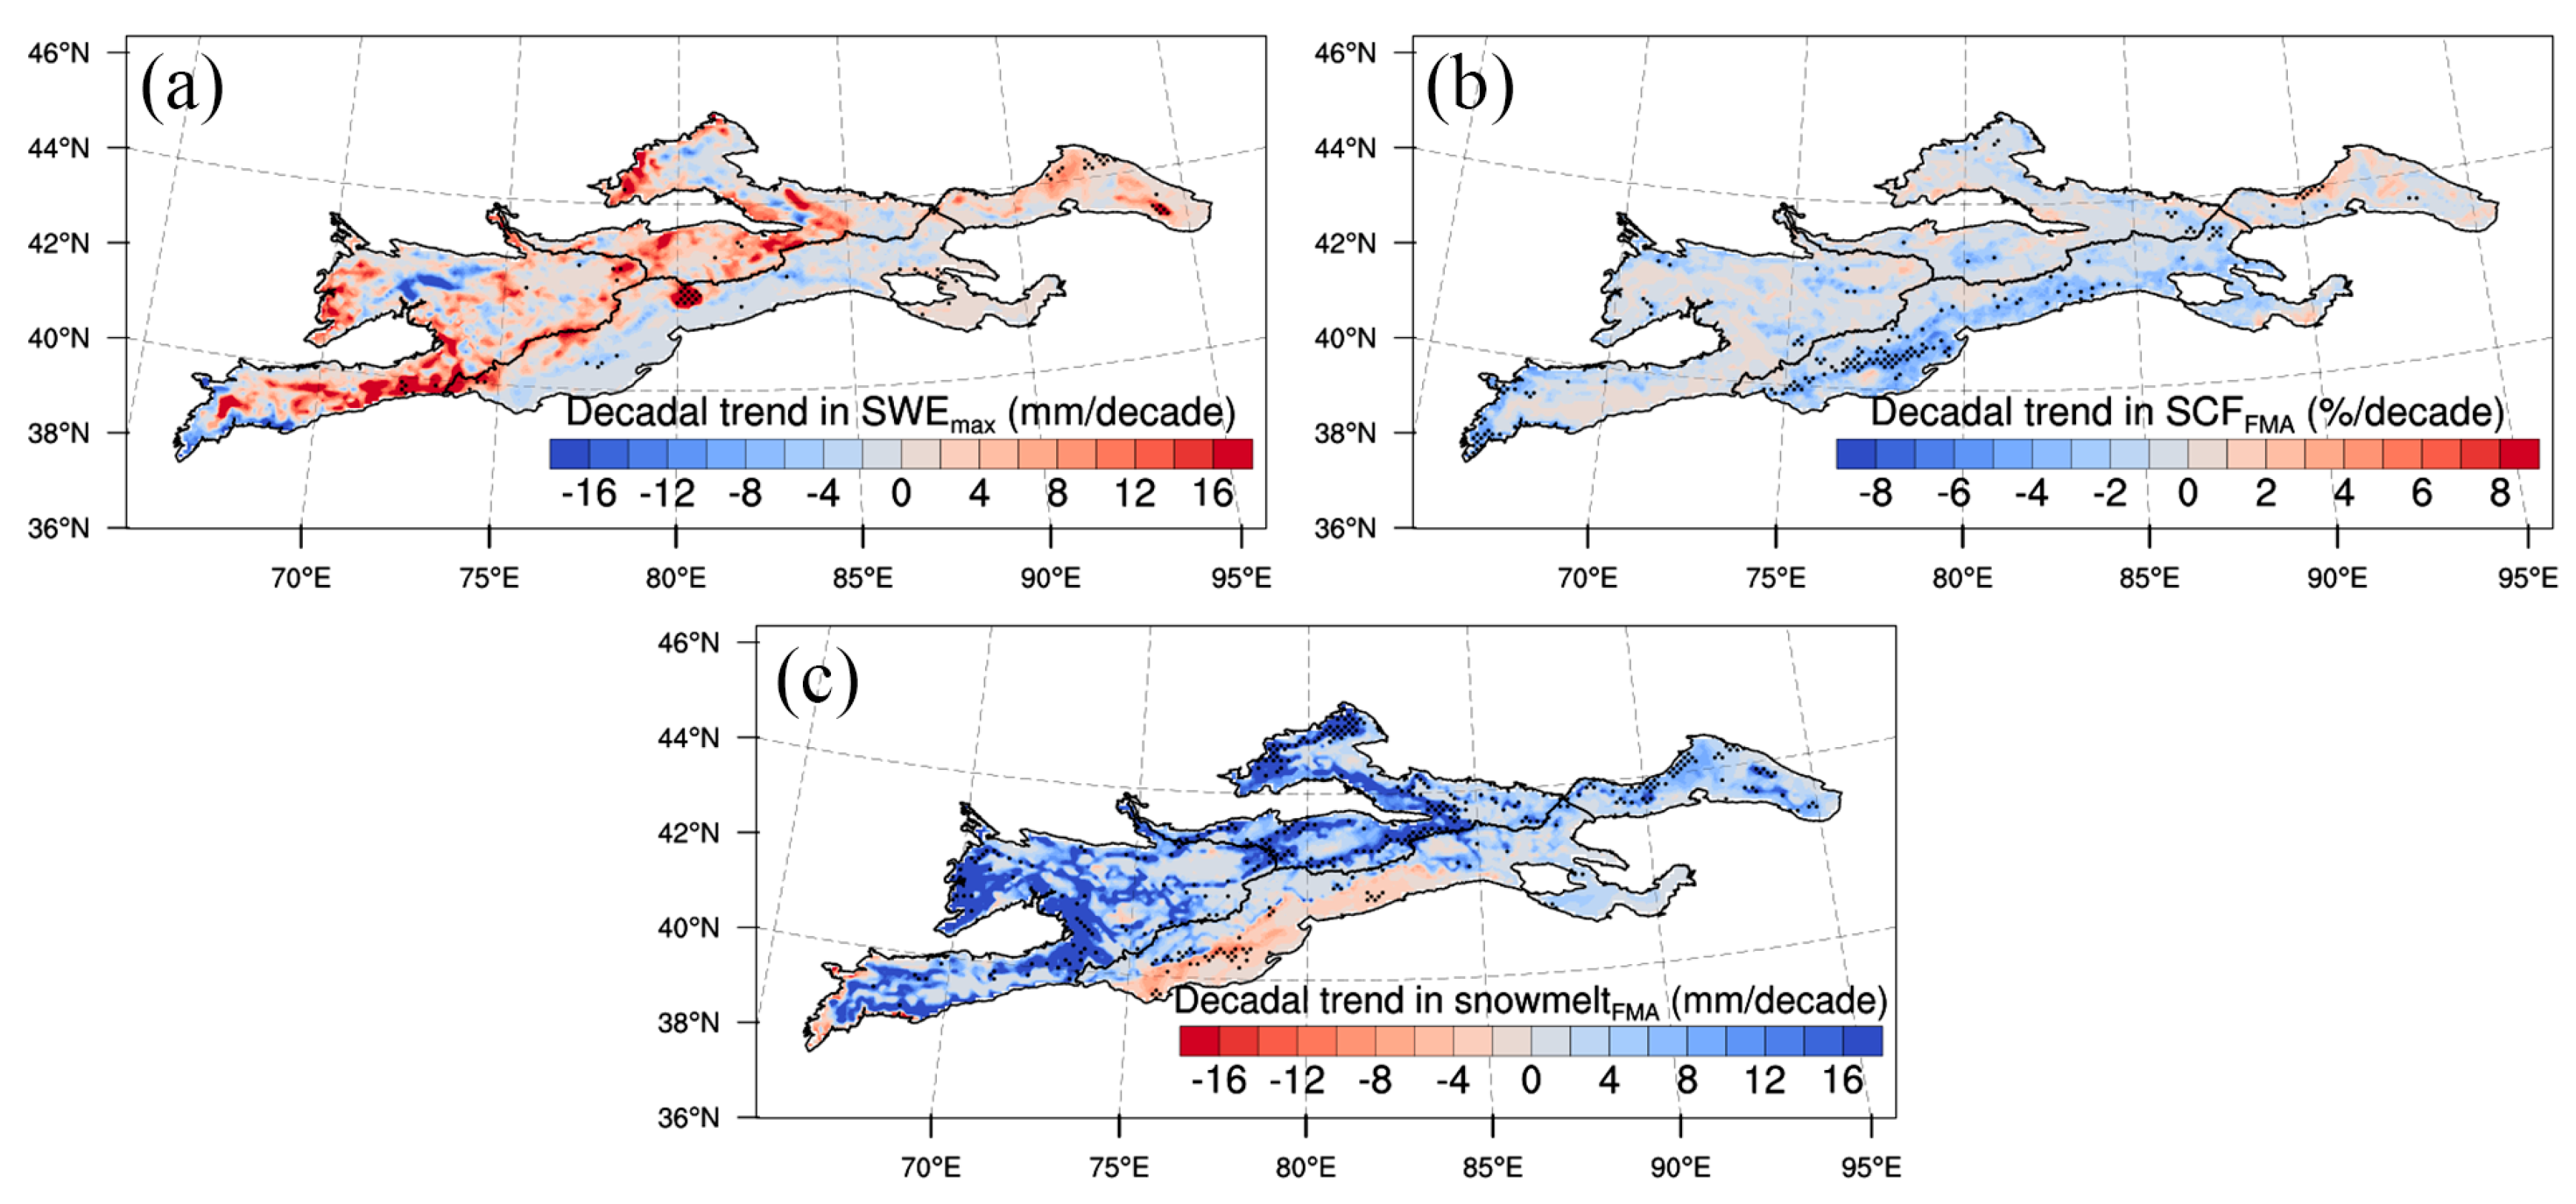
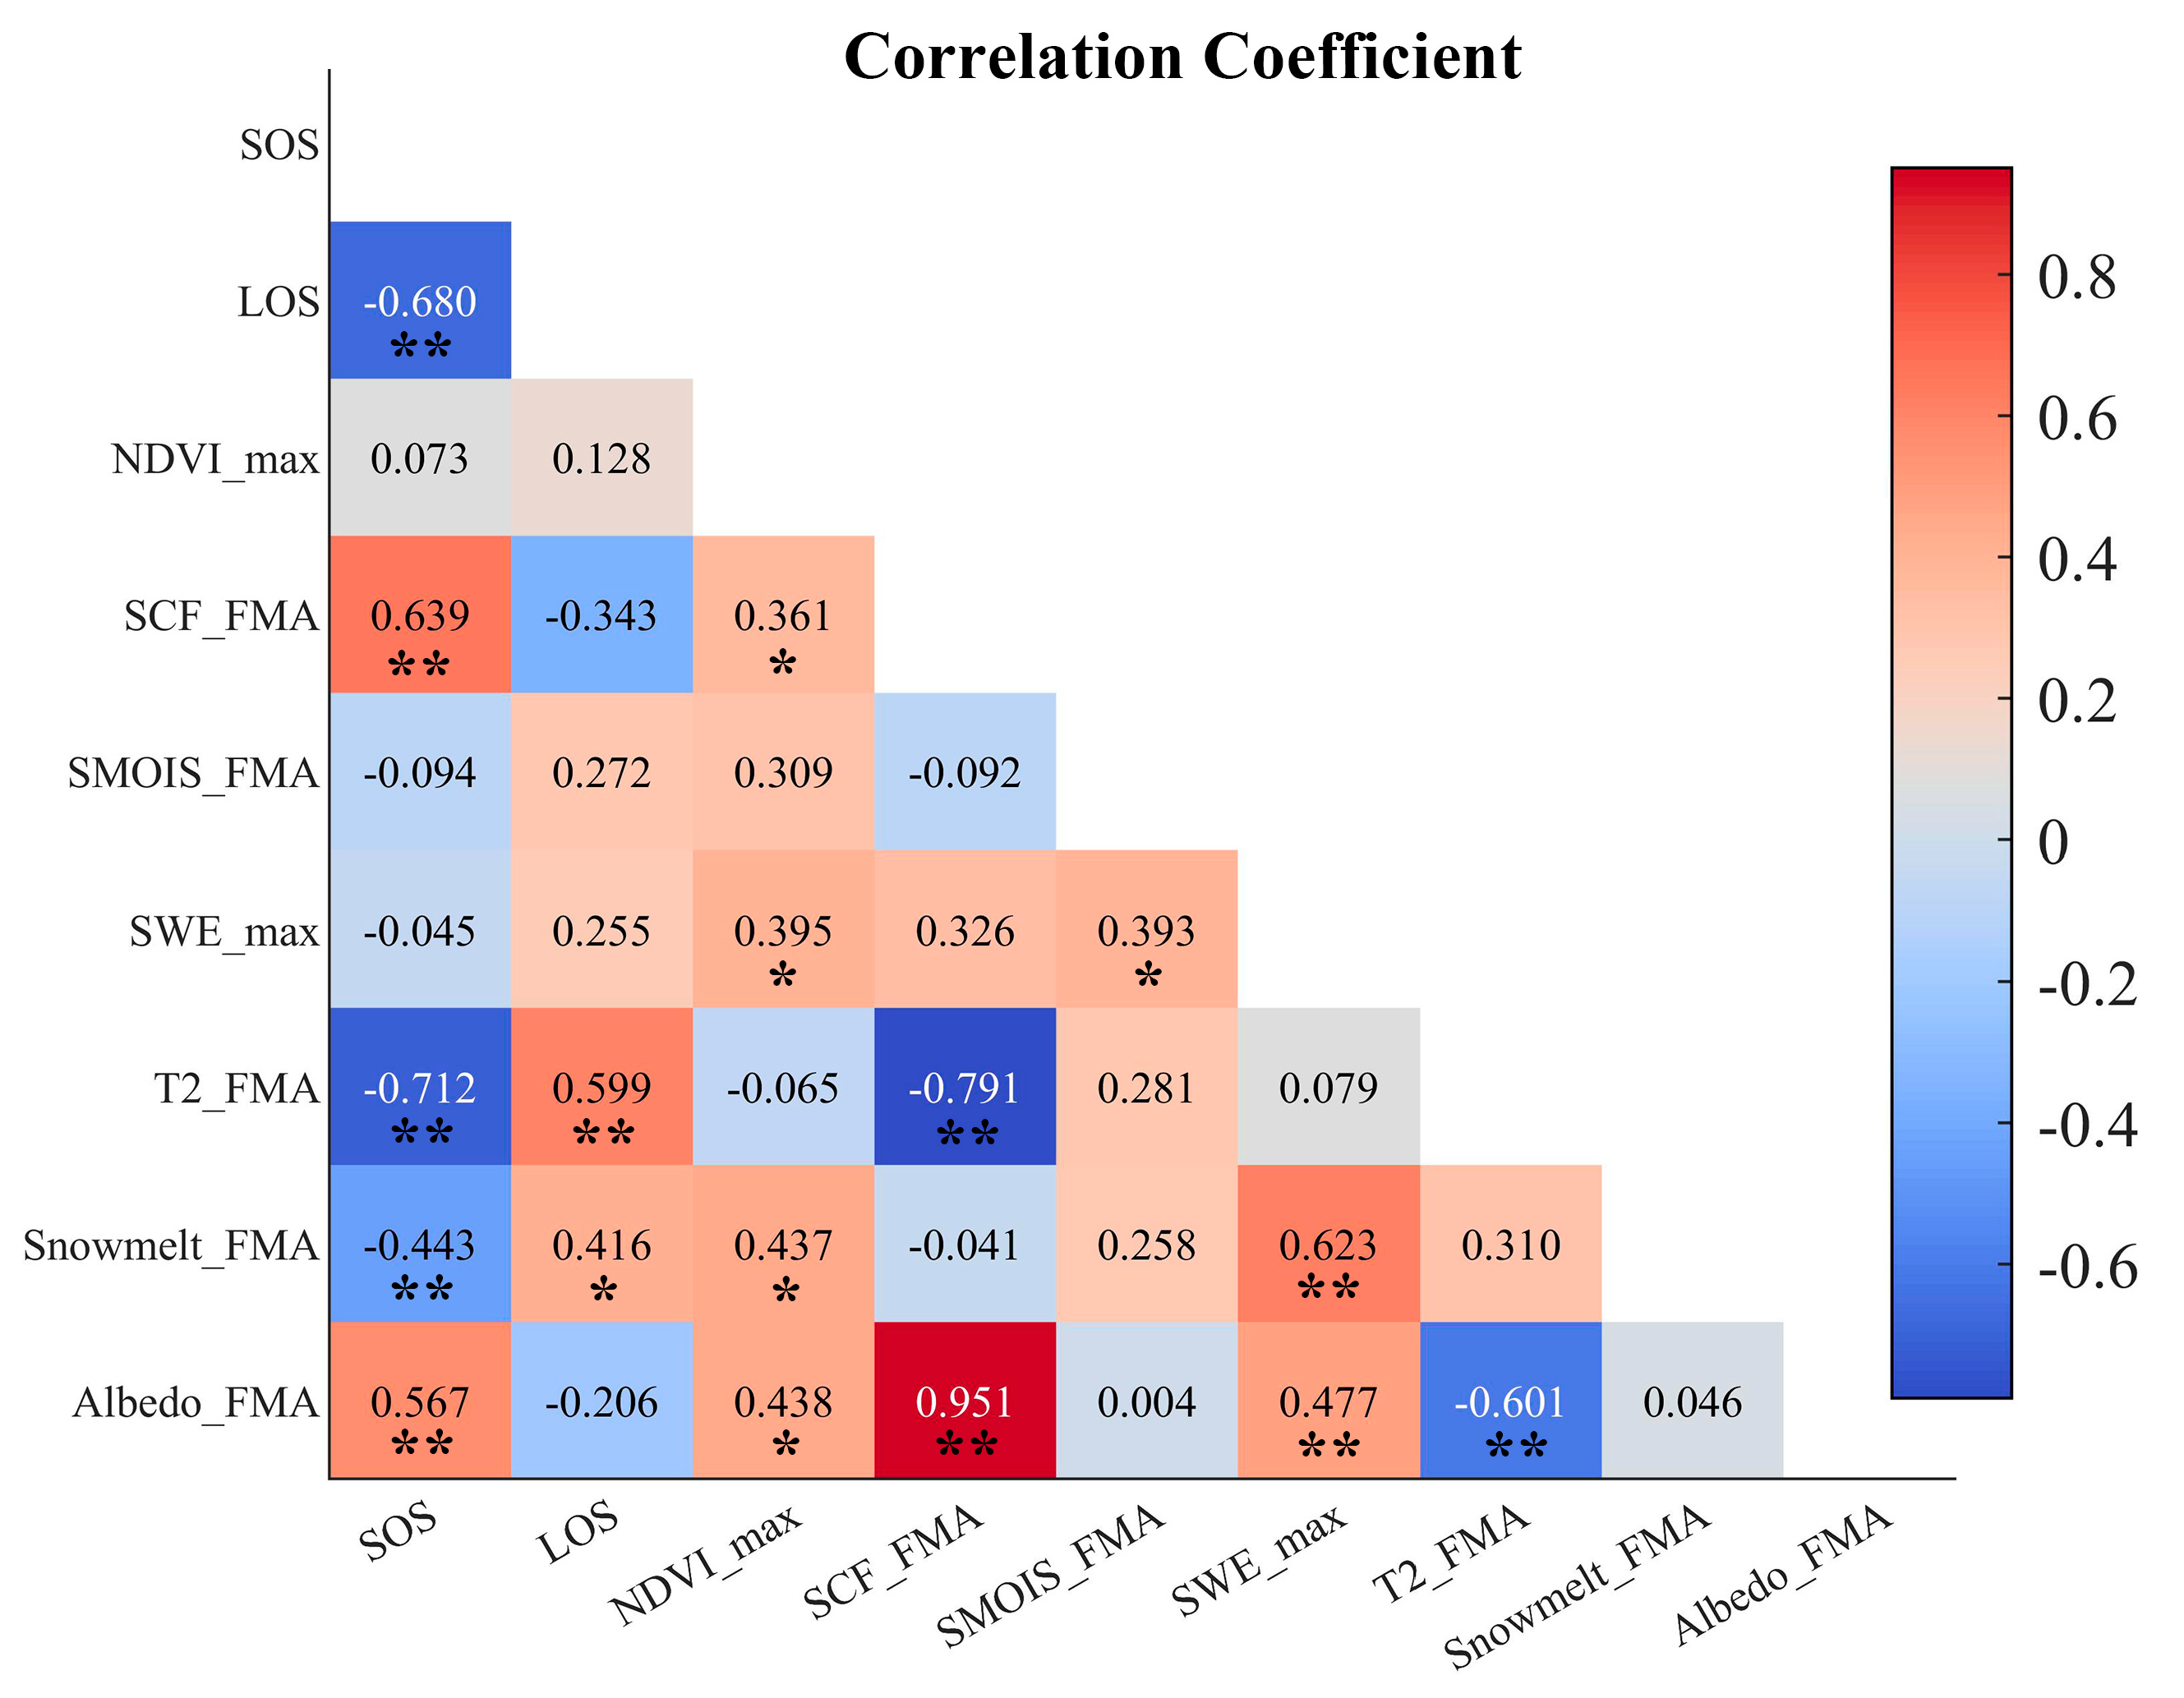
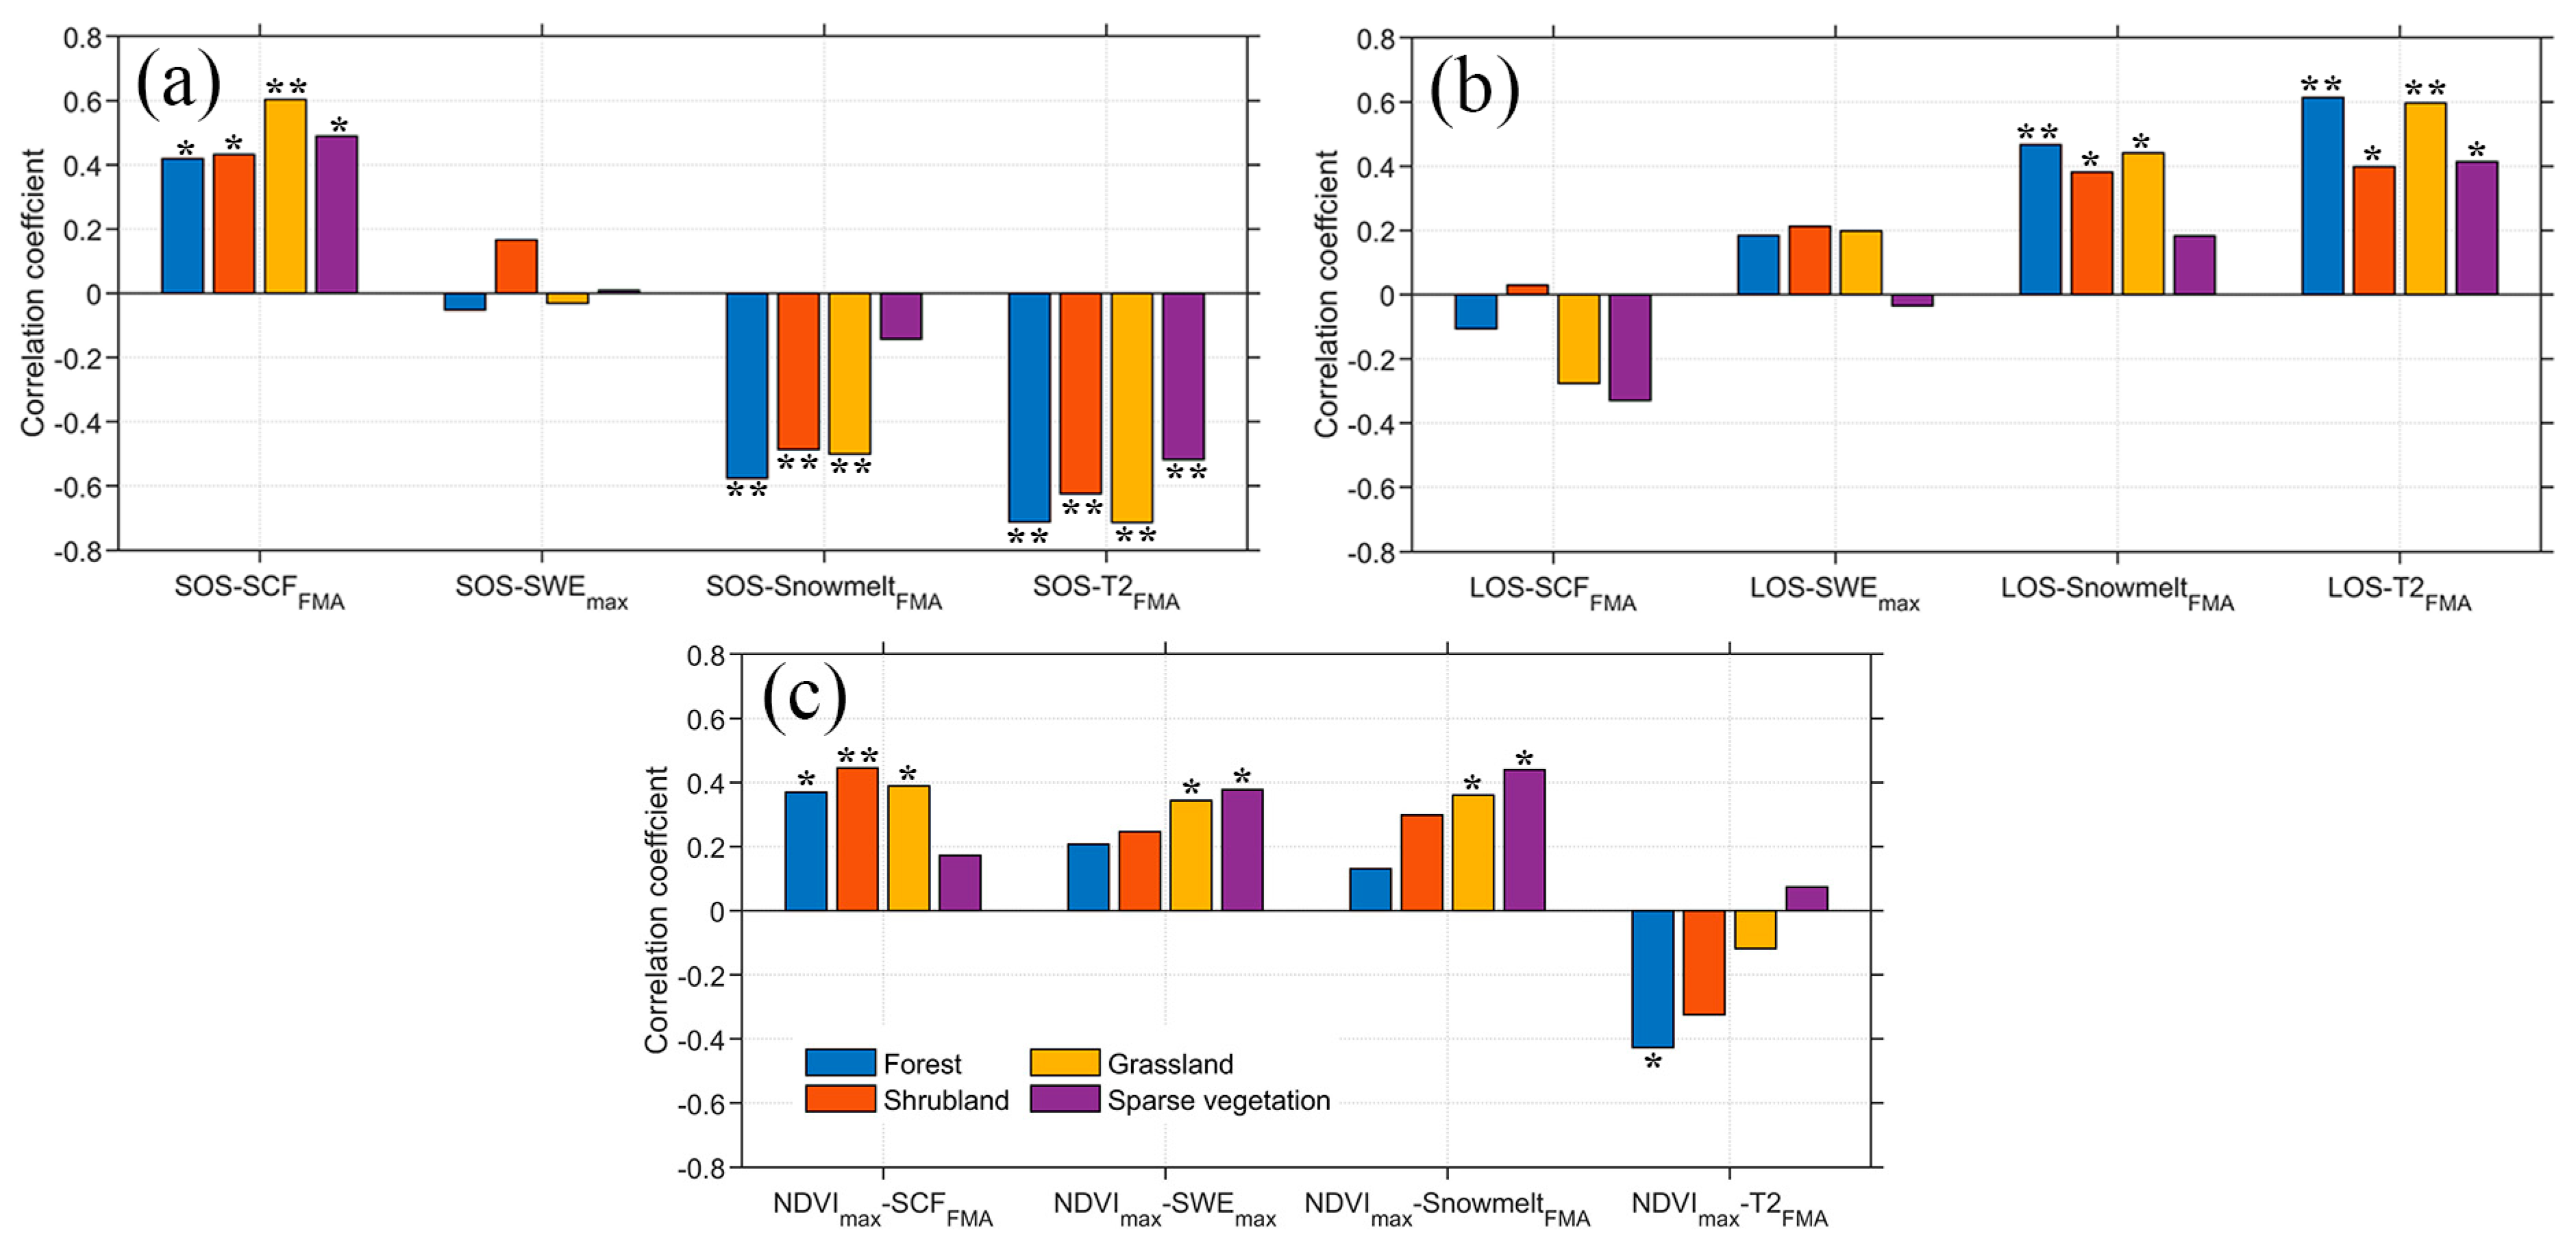
- Snow cover fraction during February–April has a significant positive effect on the start of growing season. In contrast, snowmelt amount during February–April and annual maximum snow water equivalent have an almost equally significant positive correlation with NDVImax. In particular, the start of growing season of grassland was the most sensitive to variations of snow cover fraction during February–April than that of other vegetation types, and their strong relationship was mainly located at elevations from 1500 to 3000 m a.s.l. In addition, its greenness was significantly affected by the annual maximum snow water equivalent in all elevation bands.
- 3
- Both decreased snow cover fraction and increased temperature in the early spring period caused the significant advance of the start date of vegetation growing season, consequently prolonging the length of vegetation growing season. Large annual maximum snow water equivalent and more snowmelt amount could significantly promote the increase in NDVImax by consistently regulating the soil moisture.
Author Contributions
Funding
Conflicts of Interest
References
- Miguez-Macho, G.; Fan, Y. Spatiotemporal origin of soil water taken up by vegetation. Nature 2021, 598, 624–628. [Google Scholar] [CrossRef] [PubMed]
- Piao, S.; Wang, X.; Park, T.; Chen, C.; Lian, X.; He, Y.; Bjerke, J.W.; Chen, A.; Ciais, P.; Tømmervik, H.; et al. Characteristics, drivers and feedbacks of global greening. Nat. Rev. Earth Environ. 2020, 1, 14–27. [Google Scholar] [CrossRef]
- Forzieri, G.; Miralles, D.G.; Ciais, P.; Alkama, R.; Ryu, Y.; Duveiller, G.; Zhang, K.; Robertson, E.; Kautz, M.; Martens, B.; et al. Increased control of vegetation on global terrestrial energy fluxes. Nat. Clim. Chang. 2020, 10, 356–362. [Google Scholar] [CrossRef]
- Richardson, A.D.; Keenan, T.F.; Migliavacca, M.; Ryu, Y.; Sonnentag, O.; Toomey, M. Climate change, phenology, and phenological control of vegetation feedbacks to the climate system. Agric. For. Meteorol. 2013, 169, 156–173. [Google Scholar] [CrossRef]
- Gao, M.; Piao, S.; Chen, A.; Yang, H.; Liu, Q.; Fu, Y.H.; Janssens, I.A. Divergent changes in the elevational gradient of vegetation activities over the last 30 years. Nat. Commun. 2019, 10, 2970. [Google Scholar] [CrossRef]
- Immerzeel, W.W.; Lutz, A.F.; Andrade, M.; Bahl, A.; Biemans, H.; Bolch, T.; Hyde, S.; Brumby, S.; Davies, B.J.; Elmore, A.C.; et al. Importance and vulnerability of the world’s water towers. Nature 2020, 577, 364–369. [Google Scholar] [CrossRef]
- Pepin, N.C.; Arnone, E.; Gobiet, A.; Haslinger, K.; Kotlarski, S.; Notarnicola, C.; Palazzi, E.; Seibert, P.; Serafin, S.; Schöner, W.; et al. Climate Changes and Their Elevational Patterns in the Mountains of the World. Rev. Geophys. 2022, 60, e2020RG000730. [Google Scholar] [CrossRef]
- Xu, L.; Myneni, R.B.; Chapin, F.S.; Callaghan, T.V.; Pinzon, J.E.; Tucker, C.J.; Zhu, Z.; Bi, J.; Ciais, P.; Tømmervik, H.; et al. Temperature and vegetation seasonality diminishment over northern lands. Nat. Clim. Chang. 2013, 3, 581–586. [Google Scholar] [CrossRef] [Green Version]
- Zhu, Z.; Piao, S.; Myneni, R.B.; Huang, M.; Zeng, Z.; Canadell, J.G.; Ciais, P.; Sitch, S.; Friedlingstein, P.; Arneth, A.; et al. Greening of the Earth and its drivers. Nat. Clim. Chang. 2016, 6, 791–795. [Google Scholar] [CrossRef]
- Cleverly, J.; Eamus, D.; Restrepo Coupe, N.; Chen, C.; Maes, W.; Li, L.; Faux, R.; Santini, N.S.; Rumman, R.; Yu, Q.; et al. Soil moisture controls on phenology and productivity in a semi-arid critical zone. Sci. Total Environ. 2016, 568, 1227–1237. [Google Scholar] [CrossRef]
- Ren, S.; Chen, X.; Lang, W.; Schwartz, M.D. Climatic Controls of the Spatial Patterns of Vegetation Phenology in Midlatitude Grasslands of the Northern Hemisphere. J. Geophys. Res. Biogeosci. 2018, 123, 2323–2336. [Google Scholar] [CrossRef]
- Piao, S.; Liu, Q.; Chen, A.; Janssens, I.A.; Fu, Y.; Dai, J.; Liu, L.; Lian, X.; Shen, M.; Zhu, X. Plant phenology and global climate change: Current progresses and challenges. Glob. Chang. Biol. 2019, 25, 1922–1940. [Google Scholar] [CrossRef]
- Yang, B.; He, M.; Shishov, V.; Tychkov, I.; Vaganov, E.; Rossi, S. New perspective on spring vegetation phenology and global climate change based on Tibetan Plateau tree-ring data. Proc. Natl. Acad. Sci. USA 2017, 114, 6966–6971. [Google Scholar] [CrossRef] [Green Version]
- Gavrilov, M.B.; An, W.; Xu, C.; Radaković, M.G.; Hao, Q.; Yang, F.; Guo, Z.; Perić, Z.; Gavrilov, G.; Marković, S.B. Independent aridity and drought pieces of evidence based on meteorological data and tree ring data in Southeast Banat, Vojvodina, Serbia. Atmosphere 2019, 10, 586. [Google Scholar] [CrossRef] [Green Version]
- Huang, K.; Zhang, Y.; Tagesson, T.; Brandt, M.; Wang, L.; Chen, N.; Zu, J.; Jin, H.; Cai, Z.; Tong, X.; et al. The confounding effect of snow cover on assessing spring phenology from space: A new look at trends on the Tibetan Plateau. Sci. Total Environ. 2021, 756, 144011. [Google Scholar] [CrossRef]
- Xie, J.; Kneubühler, M.; Garonna, I.; de Jong, R.; Notarnicola, C.; De Gregorio, L.; Schaepman, M.E. Relative Influence of Timing and Accumulation of Snow on Alpine Land Surface Phenology. J. Geophys. Res. Biogeosci. 2018, 123, 561–576. [Google Scholar] [CrossRef]
- Tomaszewska, M.A.; Nguyen, L.H.; Henebry, G.M. Land surface phenology in the highland pastures of montane Central Asia: Interactions with snow cover seasonality and terrain characteristics. Remote Sens. Environ. 2020, 240, 111675. [Google Scholar] [CrossRef]
- Yun, J.; Jeong, S.J.; Ho, C.H.; Park, C.E.; Park, H.; Kim, J. Influence of winter precipitation on spring phenology in boreal forests. Glob. Chang. Biol. 2018, 24, 5176–5187. [Google Scholar] [CrossRef]
- Chen, X.; Yang, Y. Observed earlier start of the growing season from middle to high latitudes across the Northern Hemisphere snow-covered landmass for the period 2001–2014. Environ. Res. Lett. 2020, 15, 034042. [Google Scholar] [CrossRef]
- Xie, J.; Hüsler, F.; de Jong, R.; Chimani, B.; Asam, S.; Sun, Y.; Schaepman, M.E.; Kneubühler, M. Spring Temperature and Snow Cover Climatology Drive the Advanced Springtime Phenology (1991–2014) in the European Alps. J. Geophys. Res. Biogeosci. 2021, 126, e2020JG006150. [Google Scholar] [CrossRef]
- Zheng, J.; Jia, G.; Xu, X. Agricultural and Forest Meteorology Earlier snowmelt predominates advanced spring vegetation greenup in Alaska. Agric. For. Meteorol. 2022, 315, 108828. [Google Scholar] [CrossRef]
- Henderson, G.R.; Peings, Y.; Furtado, J.C.; Kushner, P.J. Snow–atmosphere coupling in the Northern Hemisphere. Nat. Clim. Chang. 2018, 8, 954–963. [Google Scholar] [CrossRef]
- Barnett, T.P.; Adam, J.C.; Lettenmaier, D.P. Potential impacts of a warming climate on water availability in snow-dominated regions. Nature 2005, 438, 303–309. [Google Scholar] [CrossRef]
- Kraaijenbrink, P.D.A.; Stigter, E.E.; Yao, T.; Immerzeel, W.W. Climate change decisive for Asia’s snow meltwater supply. Nat. Clim. Chang. 2021, 11, 591–597. [Google Scholar] [CrossRef]
- Zhang, T. Influence of the seasonal snow cover on the ground thermal regime: An overview. Rev. Geophys. 2005, 43, RG4002. [Google Scholar] [CrossRef]
- Pulliainen, J.; Aurela, M.; Laurila, T.; Aalto, T.; Takala, M.; Salminen, M.; Kulmala, M.; Barr, A.; Heimann, M.; Lindroth, A.; et al. Early snowmelt significantly enhances boreal springtime carbon uptake. Proc. Natl. Acad. Sci. USA. 2017, 114, 11081–11086. [Google Scholar] [CrossRef] [Green Version]
- Peng, S.; Piao, S.; CIAIS, P.; Fang, J.; Wang, X. Change in winter snow depth and its impacts on vegetation in China. Glob. Chang. Biol. 2010, 16, 3004–3013. [Google Scholar] [CrossRef]
- Wang, X.; Wang, T.; Guo, H.; Liu, D.; Zhao, Y.; Zhang, T.; Liu, Q.; Piao, S. Disentangling the mechanisms behind winter snow impact on vegetation activity in northern ecosystems. Glob. Chang. Biol. 2018, 24, 1651–1662. [Google Scholar] [CrossRef]
- Jinfei, Y.; Xiaobing, Z.; Benfeng, Y.; Yonggang, L.; Yuanming, Z. Species-dependent responses of root growth of herbaceous plants to snow cover changes in a temperate desert, Northwest China. Plant Soil 2021, 459, 249–260. [Google Scholar] [CrossRef]
- Evan, A.; Eisenman, I. A mechanism for regional variations in snowpack melt under rising temperature. Nat. Clim. Chang. 2021, 11, 326–330. [Google Scholar] [CrossRef]
- Notarnicola, C. Hotspots of snow cover changes in global mountain regions over 2000–2018. Remote Sens. Environ. 2020, 243, 111781. [Google Scholar] [CrossRef]
- Chen, Y.; Li, Z.; Fang, G.; Li, W. Large Hydrological Processes Changes in the Transboundary Rivers of Central Asia. J. Geophys. Res. Atmos. 2018, 123, 5059–5069. [Google Scholar] [CrossRef]
- Farinotti, D.; Longuevergne, L.; Moholdt, G.; Duethmann, D.; Mölg, T.; Bolch, T.; Vorogushyn, S.; Güntner, A. Substantial glacier mass loss in the Tien Shan over the past 50 years. Nat. Geosci. 2015, 8, 716–722. [Google Scholar] [CrossRef]
- Hu, Z.; Zhang, C.; Hu, Q.; Tian, H. Temperature changes in central Asia from 1979 to 2011 based on multiple datasets. J. Clim. 2014, 27, 1143–1167. [Google Scholar] [CrossRef]
- Yang, T.; Li, Q.; Ahmad, S.; Zhou, H.; Li, L. Changes in snow phenology from 1979 to 2016 over the Tianshan Mountains, Central Asia. Remote Sens. 2019, 11, 499. [Google Scholar] [CrossRef] [Green Version]
- Li, Q.; Yang, T.; Zhou, H.; Li, L. Patterns in snow depth maximum and snow cover days during 1961–2015 period in the Tianshan Mountains, Central Asia. Atmos. Res. 2019, 228, 14–22. [Google Scholar] [CrossRef]
- Yang, T.; Li, Q.; Chen, X.; Hamdi, R.; De Maeyer, P.; Li, L. Variation of Snow Mass in a Regional Climate Model Downscaling Simulation Covering the Tianshan Mountains, Central Asia. J. Geophys. Res. Atmos. 2021, 126, e2020JD034183. [Google Scholar] [CrossRef]
- Li, Y.; Chen, Y.; Sun, F.; Li, Z. Recent vegetation browning and its drivers on Tianshan Mountain, Central Asia. Ecol. Indic. 2021, 129, 107912. [Google Scholar] [CrossRef]
- Li, Z.; Chen, Y.; Li, W.; Deng, H.; Fang, G. Potential impacts of climate change on vegetation dynamics in Central Asia. J. Geophys. Res. Atmos. 2015, 120, 12345–12356. [Google Scholar] [CrossRef]
- Jiang, L.; Jiapaer, G.; Bao, A.; Guo, H.; Ndayisaba, F. Vegetation dynamics and responses to climate change and human activities in Central Asia. Sci. Total Environ. 2017, 599–600, 967–980. [Google Scholar] [CrossRef]
- Wu, L.; Ma, X.; Dou, X.; Zhu, J.; Zhao, C. Impacts of climate change on vegetation phenology and net primary productivity in arid Central Asia. Sci. Total Environ. 2021, 796, 149055. [Google Scholar] [CrossRef]
- Zhang, B.; Li, X.; Li, C.; Nyiransengiyumva, C.; Qin, Q. Alpine vegetation responses to snow phenology in the Chinese Tianshan mountainous region. J. Mt. Sci. 2022, 19, 1307–1323. [Google Scholar] [CrossRef]
- Dong, C. Remote sensing, hydrological modeling and in situ observations in snow cover research: A review. J. Hydrol. 2018, 561, 573–583. [Google Scholar] [CrossRef]
- Sorg, A.; Bolch, T.; Stoffel, M.; Solomina, O.; Beniston, M. Climate change impacts on glaciers and runoff in Tien Shan (Central Asia). Nat. Clim. Chang. 2012, 2, 725–731. [Google Scholar] [CrossRef]
- Lu, X.; Tang, G.; Wang, X.; Liu, Y.; Jia, L.; Xie, G.; Li, S.; Zhang, Y. Correcting GPM IMERG precipitation data over the Tianshan Mountains in China. J. Hydrol. 2019, 575, 1239–1252. [Google Scholar] [CrossRef]
- Aizen, V.B.; Kuzmichenok, V.A.; Surazakov, A.B.; Aizen, E.M. Glacier changes in the Tien Shan as determined from topographic and remotely sensed data. Glob. Planet. Chang. 2007, 56, 328–340. [Google Scholar] [CrossRef]
- Yang, T.; Li, Q.; Hamdi, R.; Zou, Q.; Chen, X.; De Maeyer, P.; Cui, F.; Li, L. Snowfall climatology in the Tianshan Mountains based on 36 cold seasons of WRF dynamical downscaling simulation. Atmos. Res. 2022, 270, 106057. [Google Scholar] [CrossRef]
- Pinzon, J.E.; Tucker, C.J. A non-stationary 1981-2012 AVHRR NDVI3g time series. Remote Sens. 2014, 6, 6929–6960. [Google Scholar] [CrossRef] [Green Version]
- Tian, F.; Fensholt, R.; Verbesselt, J.; Grogan, K.; Horion, S.; Wang, Y. Evaluating temporal consistency of long-term global NDVI datasets for trend analysis. Remote Sens. Environ. 2015, 163, 326–340. [Google Scholar] [CrossRef]
- ESA. Land Cover CCI Product User Guide Version 2. Technical Report. 2017. Available online: maps.elie.ucl.ac.be/CCI/viewer/download/ESACCI-LC-Ph2-PUGv2_2.0.pdf (accessed on 20 February 2020).
- Yang, Y.; Xiao, P.; Feng, X.; Li, H. Accuracy assessment of seven global land cover datasets over China. ISPRS J. Photogramm. Remote Sens. 2017, 125, 156–173. [Google Scholar] [CrossRef]
- Skamarock, W.C.; Klemp, J.B. A time-split nonhydrostatic atmospheric model for weather research and forecasting applications. J. Comput. Phys. 2008, 227, 3465–3485. [Google Scholar] [CrossRef]
- Niu, G.Y.; Yang, Z.L.; Mitchell, K.E.; Chen, F.; Ek, M.B.; Barlage, M.; Kumar, A.; Manning, K.; Niyogi, D.; Rosero, E.; et al. The community Noah land surface model with multiparameterization options (Noah-MP): 1. Model description and evaluation with local-scale measurements. J. Geophys. Res. Atmos. 2011, 116, D12109. [Google Scholar] [CrossRef] [Green Version]
- Zeng, L.; Wardlow, B.D.; Xiang, D.; Hu, S.; Li, D. A review of vegetation phenological metrics extraction using time-series, multispectral satellite data. Remote Sens. Environ. 2020, 237, 111511. [Google Scholar] [CrossRef]
- Liu, X.; Chen, Y.; Li, Z.; Li, Y.; Zhang, Q.; Zan, M. Driving forces of the changes in vegetation phenology in the qinghai–tibet plateau. Remote Sens. 2021, 13, 4952. [Google Scholar] [CrossRef]
- Yu, H.; Luedeling, E.; Xu, J. Winter and spring warming result in delayed spring phenology on the Tibetan Plateau. Proc. Natl. Acad. Sci. USA 2010, 107, 22151–22156. [Google Scholar] [CrossRef] [Green Version]
- Zhang, Q.; Kong, D.; Shi, P.; Singh, V.P.; Sun, P. Vegetation phenology on the Qinghai-Tibetan Plateau and its response to climate change (1982–2013). Agric. For. Meteorol. 2018, 248, 408–417. [Google Scholar] [CrossRef]
- White, M.A.; de Beurs, K.M.; Didan, K.; Inouye, D.W.; Richardson, A.D.; Jensen, O.P.; O’Keefe, J.; Zhang, G.; Nemani, R.R.; van Leeuwen, W.J.D.; et al. Intercomparison, interpretation, and assessment of spring phenology in North America estimated from remote sensing for 1982–2006. Glob. Chang. Biol. 2009, 15, 2335–2359. [Google Scholar] [CrossRef]
- Chen, J.; Jönsson, P.; Tamura, M.; Gu, Z.; Matsushita, B.; Eklundh, L. A simple method for reconstructing a high-quality NDVI time-series data set based on the Savitzky-Golay filter. Remote Sens. Environ. 2004, 91, 332–344. [Google Scholar] [CrossRef]
- Wang, X.; Xiao, J.; Li, X.; Cheng, G.; Ma, M.; Zhu, G.; Altaf Arain, M.; Andrew Black, T.; Jassal, R.S. No trends in spring and autumn phenology during the global warming hiatus. Nat. Commun. 2019, 10, 2389. [Google Scholar] [CrossRef]
- Sen, P.K. Journal of the American Statistical Estimates of the Regression Coefficient Based on Kendall’s Tau. J. Am. Stat. Assoc. 1968, 63, 1379–1389. [Google Scholar] [CrossRef]
- Mann, H.B. Nonparametric tests against trend. Econometrica 1945, 13, 245–259. [Google Scholar] [CrossRef]
- Kendall, M.G. Rank Correlation Methods; Griffin: London, UK, 1975. [Google Scholar]
- Qi, Y.; Wang, H.; Ma, X.; Zhang, J.; Yang, R. Relationship between vegetation phenology and snow cover changes during 2001–2018 in the Qilian Mountains. Ecol. Indic. 2021, 133, 108351. [Google Scholar] [CrossRef]
- Kelsey, K.C.; Pedersen, S.H.; Leffler, A.J.; Sexton, J.O.; Feng, M.; Welker, J.M. Winter snow and spring temperature have differential effects on vegetation phenology and productivity across Arctic plant communities. Glob. Chang. Biol. 2021, 27, 1572–1586. [Google Scholar] [CrossRef]
- Wang, T.; Peng, S.; Lin, X.; Chang, J. Declining snow cover may affect spring phenological trend on the Tibetan Plateau. Proc. Natl. Acad. Sci. USA 2013, 110, E2854–E2855. [Google Scholar] [CrossRef] [Green Version]
- Rumpf, S.B.; Gravey, M.; Brönnimann, O.; Luoto, M.; Cianfrani, C.; Mariethoz, G.; Guisan, A. vegetation productivity in the European Alps. Science 2022, 1122, 1119–1122. [Google Scholar] [CrossRef]
- Déry, S.J.; Brown, R.D. Recent Northern Hemisphere snow cover extent trends and implications for the snow-albedo feedback. Geophys. Res. Lett. 2007, 34, 2–7. [Google Scholar] [CrossRef]
- Wang, X.; Wu, C.; Peng, D.; Gonsamo, A.; Liu, Z. Snow cover phenology affects alpine vegetation growth dynamics on the Tibetan Plateau: Satellite observed evidence, impacts of different biomes, and climate drivers. Agric. For. Meteorol. 2018, 256–257, 61–74. [Google Scholar] [CrossRef]
- Wang, K.; Zhang, L.; Qiu, Y.; Ji, L.; Tian, F.; Wang, C.; Wang, Z. Snow effects on alpine vegetation in the Qinghai-Tibetan Plateau. Int. J. Digit. Earth 2015, 8, 56–73. [Google Scholar] [CrossRef]
- Zheng, L.; Xu, J.; Li, D.; Xia, Z.; Chen, Y.; Xu, G.; Lu, D. Increasing control of climate warming on the greening of alpine pastures in central Asia. Int. J. Appl. Earth Obs. Geoinf. 2021, 105, 102606. [Google Scholar] [CrossRef]
- Körner, C.; Paulsen, J. A world-wide study of high altitude treeline temperatures. J. Biogeogr. 2004, 31, 713–732. [Google Scholar] [CrossRef]
- Thompson, J.A.; Paull, D.J.; Lees, B.G. Using phase-spaces to characterize land surface phenology in a seasonally snow-covered landscape. Remote Sens. Environ. 2015, 166, 178–190. [Google Scholar] [CrossRef]
- Terzago, S.; Andreoli, V.; Arduini, G.; Balsamo, G.; Campo, L.; Cassardo, C.; Cremonese, E.; Dolia, D.; Gabellani, S.; Von Hardenberg, J.; et al. Sensitivity of snow models to the accuracy of meteorological forcings in mountain environments. Hydrol. Earth Syst. Sci. 2020, 24, 4061–4090. [Google Scholar] [CrossRef]
- Wrzesien, M.L.; Pavelsky, T.M.; Durand, M.T.; Dozier, J.; Lundquist, J.D. Characterizing Biases in Mountain Snow Accumulation From Global Data Sets. Water Resour. Res. 2019, 55, 9873–9891. [Google Scholar] [CrossRef]
- Bonekamp, P.N.J.; Collier, E.; Immerzeel, W. The Impact of spatial resolution, land use, and spinup time on resolving spatial precipitation patterns in the Himalayas. J. Hydrometeorol. 2018, 19, 1565–1581. [Google Scholar] [CrossRef] [Green Version]
- Yang, T.; Li, Q.; Chen, X.; Hamdi, R.; De Maeyer, P.; Kurban, A.; Li, L. Improving snow simulation with more realistic vegetation parameters in a regional climate model in the Tianshan Mountains, Central Asia. J. Hydrol. 2020, 590, 125525. [Google Scholar] [CrossRef]
- Guay, K.C.; Beck, P.S.A.; Berner, L.T.; Goetz, S.J.; Baccini, A.; Buermann, W. Vegetation productivity patterns at high northern latitudes: A multi-sensor satellite data assessment. Glob. Chang. Biol. 2014, 20, 3147–3158. [Google Scholar] [CrossRef]
- Vrieling, A.; Meroni, M.; Darvishzadeh, R.; Skidmore, A.K.; Wang, T.; Zurita-Milla, R.; Oosterbeek, K.; O’Connor, B.; Paganini, M. Vegetation phenology from Sentinel-2 and field cameras for a Dutch barrier island. Remote Sens. Environ. 2018, 215, 517–529. [Google Scholar] [CrossRef]
- Yan, D.; Scott, R.L.; Moore, D.J.P.; Biederman, J.A.; Smith, W.K. Understanding the relationship between vegetation greenness and productivity across dryland ecosystems through the integration of PhenoCam, satellite, and eddy covariance data. Remote Sens. Environ. 2019, 223, 50–62. [Google Scholar] [CrossRef]
- Tian, F.; Cai, Z.; Jin, H.; Hufkens, K.; Scheifinger, H.; Tagesson, T.; Smets, B.; Van Hoolst, R.; Bonte, K.; Ivits, E.; et al. Calibrating vegetation phenology from Sentinel-2 using eddy covariance, PhenoCam, and PEP725 networks across Europe. Remote Sens. Environ. 2021, 260, 112456. [Google Scholar] [CrossRef]
- Zhang, M.; Luo, G.; Cao, X.; Hamdi, R.; Li, T.; Cai, P.; Ye, H.; He, H. Numerical Simulation of the Irrigation Effects on Surface Fluxes and Local Climate in Typical Mountain-Oasis-Desert Systems in the Central Asia Arid Area. J. Geophys. Res. Atmos. 2019, 124, 12485–12506. [Google Scholar] [CrossRef]
- Wei, H.; Xiong, L.; Tang, G.; Strobl, J.; Xue, K. Spatial—Temporal variation of land use and land cover change in the glacial affected area of the Tianshan Mountains. Catena 2021, 202, 105256. [Google Scholar] [CrossRef]
- Cai, P.; Hamdi, R.; Luo, G.; He, H.; Zhang, M.; Termonia, P.; De Maeyer, P. Agriculture intensification increases summer precipitation in Tianshan Mountains, China. Atmos. Res. 2019, 227, 140–146. [Google Scholar] [CrossRef]
- de Kok, R.J.; Kraaijenbrink, P.D.A.; Tuinenburg, O.A.; Bonekamp, P.N.J.; Immerzeel, W.W. Towards understanding the pattern of glacier mass balances in High Mountain Asia using regional climatic modelling. Cryosphere 2020, 14, 3215–3234. [Google Scholar] [CrossRef]
- Yang, T.; Li, Q.; Chen, X.; De Maeyer, P.; Yan, X.; Liu, Y.; Zhao, T.; Li, L. Spatiotemporal variability of the precipitation concentration and diversity in Central Asia. Atmos. Res. 2020, 241, 104954. [Google Scholar] [CrossRef]
- Gerlitz, L.; Steirou, E.; Schneider, C.; Moron, V.; Vorogushyn, S.; Merz, B. Variability of the cold season climate in central asia. Part I: Weather types and their tropical and extratropical drivers. J. Clim. 2018, 31, 7185–7207. [Google Scholar] [CrossRef]


Publisher’s Note: MDPI stays neutral with regard to jurisdictional claims in published maps and institutional affiliations. |
© 2022 by the authors. Licensee MDPI, Basel, Switzerland. This article is an open access article distributed under the terms and conditions of the Creative Commons Attribution (CC BY) license (https://creativecommons.org/licenses/by/4.0/).
Share and Cite
Yang, T.; Li, Q.; Zou, Q.; Hamdi, R.; Cui, F.; Li, L. Impact of Snowpack on the Land Surface Phenology in the Tianshan Mountains, Central Asia. Remote Sens. 2022, 14, 3462. https://doi.org/10.3390/rs14143462
Yang T, Li Q, Zou Q, Hamdi R, Cui F, Li L. Impact of Snowpack on the Land Surface Phenology in the Tianshan Mountains, Central Asia. Remote Sensing. 2022; 14(14):3462. https://doi.org/10.3390/rs14143462
Chicago/Turabian StyleYang, Tao, Qian Li, Qiang Zou, Rafiq Hamdi, Fengqi Cui, and Lanhai Li. 2022. "Impact of Snowpack on the Land Surface Phenology in the Tianshan Mountains, Central Asia" Remote Sensing 14, no. 14: 3462. https://doi.org/10.3390/rs14143462
APA StyleYang, T., Li, Q., Zou, Q., Hamdi, R., Cui, F., & Li, L. (2022). Impact of Snowpack on the Land Surface Phenology in the Tianshan Mountains, Central Asia. Remote Sensing, 14(14), 3462. https://doi.org/10.3390/rs14143462