Abstract
Vicarious calibration, as one on-orbit calibration method, is a supplement to onboard calibration of sensors. The application of vicarious calibration, however, is greatly limited due to the time- and effort-consuming field measurements of atmosphere and surface. Fortunately, the Radiometric Calibration Network (RadCalNet) provides automated in situ data at multiple sites, thus increasing the opportunities to achieve ongoing ground-reference calibration of in-orbit instruments. The MEdium Resolution Spectrum Imager-II (MERSI-II) onboard FengYun-3D (FY) has the temporal, spectral, spatial, and radiometric capacity for image capture at a level on par with other sensors used worldwide, such as the Moderate Resolution Imaging Spectroradiometer (MODIS). Its on-orbit radiometric performance, however, is assessed in a limited manner. In this study, the reflectance-based vicarious calibration method was employed to calibrate the MERSI-II sensor using ground measurements from RadCalNet at the Railroad Valley Playa site. The calibration of the MERSI-II sensor with large view angles presents difficulties due to the uncertainties introduced by surface bidirectional reflectance distribution function (BRDF) effects. Thus, we performed BRDF correction to harmonize the sensor and ground measurements to consistent observation geometries, before the in-situ measurements were taken as inputs for the 6SV radiative transfer model to predict at-sensor radiance. The calibration results were comprehensively validated with ground data and MODIS benchmark datasets. The results show that accounting for BRDF correction could improve the accuracy of vicarious calibration and ensure inter-consistency between different sensors. An analysis of the vicarious calibration of FY-3D MERSI-II yielded uncertainties of <5% for solar reflective bands, which meets the radiometric accuracy requirements typical for land-monitoring space missions. The proposed approach is also applicable to the calibration of other large footprint sensors.
1. Introduction
China started the meteorological satellite program in the 1970s, aiming at global and high-temporal measurements of the earth [1]. As a part of this program, the FengYun-3D (FY-3D) is the latest Chinese sun-synchronous polar orbit meteorological satellite. It was launched on 15 November 2017. The MEdium Resolution Spectrum Imager-II (MERSI-II), as the primary payload onboard the FY-3D, is the most advanced low-earth-orbit sensor at present in China [2]. MERSI-II is equipped with temporal, spectral, spatial, and radiometric capacity for image capture comparable with other sensors used worldwide such as the Moderate Resolution Imaging Spectroradiometer (MODIS) [3]. The MERSI-II sensor collects data for 25 spectral bands, including 16 visible/near-infrared bands at 250 and 1000 m, 3 short-wave infrared bands at 1000 m and 6 mid- and long-wave infrared bands at a 250 and 1000 m [4]. This sensor acquires global observations twice a day for high-precision quantitative estimation of atmospheric, terrestrial and marine parameters [3]. The sensor’s in-orbit radiometric performance, however, was only assessed in a limited set of reports. This restricts the generation and application of MERSI-II products, since radiometric calibration is an essential preprocess before the remotely sensed data is quantitatively used.
The previous researches on radiometric calibration of the FY-3D MERSI-II sensor are limited in terms of site and period. The prelaunch MERSI-II performance testing showed that most bands perform effectively, while a few reflective solar bands (RSBs) showed mirror specification non-compliance [5]. The cross-calibration of MERSI-II sensor referenced by Visible Infrared Imaging Radiometer (VIIRS) observations could result in consistent ocean color products with VIIRS sensor [6]. The lunar calibration of FY-3D MERSI-II obtained comparable coefficients with the prelaunch laboratory calibration [7]. The vicarious calibration of MERSI-II on FY-3D at the Dunhuang site found that the degradation rate is higher at the beginning of the on-orbit operation and is decreasing over time [8]. The performance of MERSI-II RSBs during the period from 2019 till present has not been assessed, even though spectral channels are likely to experience significant instability in the first few years after launch [9]. To ensure the optimal performance of the MERSI-II sensor, continuous radiometric calibration using all the complementary techniques independently should be implemented to determine whether there are radiometric drifts and, if possible, to identify them or recommend adjustments of the calibration coefficients [10].
In-orbit calibration methods all have strengths and weaknesses. These methods include monitoring with an onboard calibrator, lunar calibration, cross-calibration, and vicarious calibration [11]. An on-board calibrator degrades over time [12,13], and lunar reflectance is much more difficult to measure than the reflectance of earth targets [13,14]. Cross-calibration and vicarious calibration based on earth targets are more commonly used [15,16]. The accuracy of cross-calibration depends on the radiometric performance of the reference sensor. The mismatch in spatial resolution and spectral response between the target and reference sensor could also bring uncertainties to the cross-calibration results [15]. Over the past two decades, the vicarious calibration based on ground measurements was widely adopted [17,18,19], since it is independent from satellite observations and enables traceable and quantifiable accuracy [13].
Due to the time and effort-consuming in-situ measurements of atmosphere and surface properties, however, it is not that feasible to apply the vicarious calibration. Fortunately, the Radiometric Calibration Network (RadCalNet) publicly provides automated in-situ atmosphere and surface data at multiple sites [20]. The site-collected standard ground measurements with associated uncertainties enable ongoing ground-reference calibration and radiometric validation of in-orbit sensors. We employed the reflectance-based vicarious calibration method to exploit the measured field data from RadCalNet and track the radiometric performance of MERSI-II.
In this study, we calibrated MERSI-II visible and near-infrared (NIR) band data observed in 2019 by using in-situ measurements of the atmosphere and surface from RadCalNet at Railroad Valley Playa site in combination with 6SV radiative transfer model. Given the fact that MERSI-II captures the signals of the target with large view angles while the ground measurements is nadir-viewing, the surface bidirectional reflectance distribution function (BRDF) effects need to be considered to eliminate the uncertainties brought by surface anisotropy [21,22,23]. Thus, we performed BRDF correction to harmonize satellite observations and field measurements to consistent illumination and viewing geometries. The ground data provide by RadCalNet at Baotou Sandy site were used to validate the calibration results, as well as the MODIS benchmark surface reflectance products.
The rest of this paper is organized as follows. The descriptions of Railroad Valley Playa site and data sets used in this study are in Section 2. Section 3 introduces the vicarious calibration method adopted in this paper, while vicarious calibration and validation results are presented in Section 4. The uncertainties are analyzed in Section 5. The concluding remarks are finally provided in Section 6.
2. Calibration Site and Data Sets
2.1. Railroad Valley Playa Site
Railroad Valley Playa, a dry lakebed located in east central Nevada, USA (38.504° N latitude, 115.692° W longitude, 1435 m height) (as depicted in Figure 1a), is one of the Committee on Earth Observation Satellites (CEOS) instrumented sites. The dry lakebed is a 15 km × 15 km flat area dominated by clay-composited lacustrine deposits with no vegetation (as shown in Figure 1b) [24]. It has been used by Remote Sensing Group (RSG) at the University of Arizona since 1996, and has proven to be a versatile site for sensors of varying spatial and spectral characteristics [25,26,27].
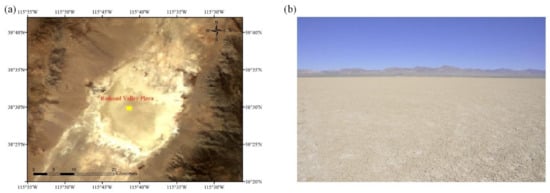
Figure 1.
The location and characteristics of Railroad Valley Playa site from (a) FengYun-3D MEdium Resolution Spectrum Imager-II (FY-3D MERSI-II)image and (b) local snapshot of the dry lakebed from RadCalNet. The yellow block represents the 1 km2 RadCalNet region.
Railroad Valley Playa is located in the desert, which results in generally low aerosol-loading with an average aerosol optical depth lower than 0.060 at 550 nm and a high probability of clear skies [28]. As shown in Figure 2, the aerosol optical depth and water vapor are generally low with several days of unusual atmospheric conditions, while the ozone column is stable all year round. The directional reflectance of the playa is characterized to be nearly Lambertian for view angles of less than 30 degrees off-nadir [24]. The site generally has high reflectance of greater than 0.3 in the near-infrared and short-wave infrared [29]. With these advantages, Railroad Valley Playa with large coverage is preferred for vicarious calibration of moderate spatial resolution sensors.
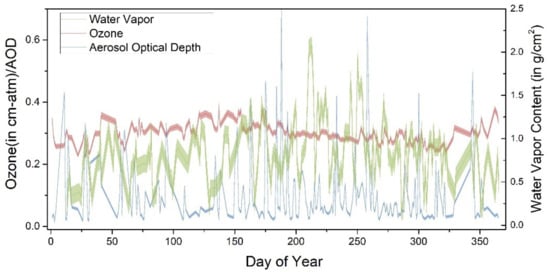
Figure 2.
The temporal atmospheric conditions over Railroad Valley Playa site in 2019, including aerosol optical depth at 550 nm, water vapor and ozone content.
2.2. Data Sets
2.2.1. The Radiometric Calibration Network (RadCalNet)
RadCalNet is a network of multiple instrumented sites that provide automated in-situ measurements of surface and atmospheric conditions, such as surface bottom-of-atmosphere (BOA) reflectance, water vapor, ozone content, aerosol optical depth at 550 nm and the associated uncertainties of each parameter. The top-of-atmosphere (TOA) reflectance derived from these measurements is also provided in this dataset. The RadCalNet was established for use in vicarious calibration and radiometric monitoring of on-orbit optical sensors overpassing the sites. It became available to public users in June 2018 [20].
The ground and atmosphere measurements associated with their uncertainties provided by RadCalNet are automatically collected at 30-minute intervals from local time 9 pm to 3 am [30]. The nadir-viewing TOA and BOA reflectance cover a spectral range from 400 nm to 1000 nm sampled at 10 nm intervals or longer wavelengths (from 400 nm to 2500 nm; also 10 nm intervals), as well as their uncertainties. The only nadir viewing configuration limits the matchup possibilities for the sensor observations viewed at off-nadir angles, as both atmosphere and surface anisotropy can lead to a significant deviation from nadir measurements [20]. Therefore, a BRDF correction for RadCalNet data should be developed to radiometrically calibrate or monitor sensors viewing the RadCalNet sites with large angles. Since RadCalNet data from the 1 km2 area at Railroad Valley Playa site is potentially applicable to medium resolution sensors due to the large spatial coverage, we calibrated FY-3D MERSI-II visible and near-infrared bands at 250 m using Railroad Valley Playa site, and validated the calibration results at Baotou Sand site with a sandy area of 300 × 300 m2. The associated errors of the measurements were analyzed to determine the uncertainties of the calibration results.
2.2.2. FY-3D MERSI-II Data
The FY-3D MERSI-II daily observes the global surface via a 55.1° scanning angle and collects imagery by a large swath of 2900 km cross-track × 10 km along the track (at nadir) for each scan [5]. The large footprint leads to the high proportion of pixels in a scan that are obtained with large solar and sensor zenith angle, as shown in Figure 3, which contributes to BRDF effects. Figure 3 presents an example to show that FY-3D MERSI-II views Railroad Valley Playa site with large solar (greater than 45°) and sensor (greater than 50°) zenith angles on 10 October 2019. In order to achieve accurate calibration of MERSI-II, the illumination angles should be taken into account when matching the satellite observations to in-situ measurements.
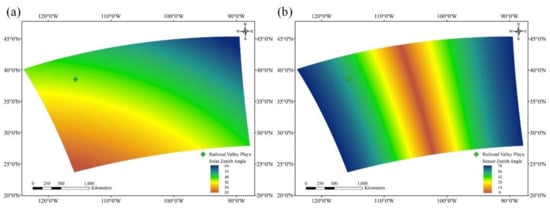
Figure 3.
The illumination and observation geometries of FY-3D MERSI-II at Railroad Valley Playa site during overpass on 10 September 2019: (a) solar zenith angle; (b) sensor zenith angle.
To minimize the discrepancy between satellite observations and field measurements and ensure high quality for both vicarious calibration procedures and validation with in-situ data, we only counted the matchups agreeing with the following criteria: (1) the FY-3D MERSI-II images over the study sites are cloud-free with low aerosols loading, as well as the ground measurements; (2) the acquired solar zenith angles difference between satellite and field observations is less than 2°; (3) the difference of observation time between satellite and field instruments is no more than three hours.
We obtained 106 matchups at Railroad Valley Playa site (Figure 4) and 38 matchups over the Baotou Sandy site in 2019. Figure 4 shows the matchups between sensor and RadCalNet observations at Railroad Valley Playa site. High agreement between the solar zenith angle from sensor observations and field measurements can be seen, although the overpass times of around thirty MERSI-II observations were not exactly coincident with the ground instrument acquisition times. Given that the sunny weather is more likely to appear in the autumn at the Railroad Valley Playa site [31], it is not surprising that matchups are distributed densely between the days of year (DOY) in 2019 from 150 to 330.
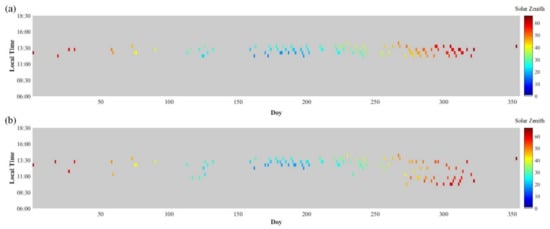
Figure 4.
The time, date and solar zenith angle of the quality-controlled matchups between FY-3D MERSI-II observations and in-situ measurements at Railroad Valley Playa site involved in calibration procedure in this study: (a) FY-3D MERSI-II observations; (b) in-situ measurements.
The FY-3D MERSI-II visible and near-infrared spectral images at spatial resolutions of 250 m, the associated geolocation data (longitude and latitude) and observation geometry (sun and sensor zenith and azimuth angles) are stored in separated files in Hierarchical Data Format (HDF). In this study, the observation geometry data at 1 km were interpolated to the same size as spectral images. The 106 MERSI-II images at Railroad Valley Playa site and 38 MERSI-II images at Baotou Sand site and their associated sun-sensor geometries were georeferenced using the geographic lookup table (GLT) built by corresponding geolocation data. The FY-3D MERSI-II spectral and observation geometries were extracted at a window size of 4 × 4 pixels for calibration at Railroad Valley Playa (1 km2 area) to limit the effects of point spread function and geometric mismatch [31], while for validation at Baotou Sand site (300 × 300 m2 area) the window size is 2 × 2 pixels.
2.2.3. MODIS BRDF Product
MODIS BRDF product (MCD43A1 Version 6) was used in this study to implement BRDF correction between the sensor and in-situ measurements from different observation angles. The MCD43A1 product combines daily Terra and Aqua BRDF model parameters at 500 m [32], which has been widely used in the studies of surface characteristics [33,34,35,36]. Data are temporally weighted to the ninth day of the retrieval period, as they are produced using 16 days of Terra and Aqua MODIS data. MCD43A1 provides the three Ross-Thick Li-Sparse (RTLS) BRDF model weighting parameters (isotropic, volumetric, and geometric) for MODIS spectral bands 1 through 7 as well as the visible, NIR, and short-wave bands. Along with the three-dimensional parameter layers for these bands are the simplified mandatory quality layers for each of the 10 bands. The three coefficients of the RTLS BRDF model stored in MCD43A1 are involved in this study: RTLS isotropic kernel parameter (), volumetric kernel parameter (), and geometric kernel parameter () for channels 1 through 4. These three parameters, as the constant coefficients in RTLS BRDF model, were used to conduct BRDF correction. Note that the symbols used here to represent the three kernel parameters are identical to those in the equations appearing in the rest paper.
The mandatory Quality Assurance (QA) layers proved by MCD43A1 product were used to select full BRDF inversions at a good quality (QA flag is 0). To spatially match the FY-3D MERSI-II data, we re-projected the MCD43A1 product from a sinusoidal projection to a latitude/longitude grid as the FY-3D MERSI-II product.
2.2.4. MODIS Surface Reflectance Product
The MODIS surface reflectance product (MYD09GA Version 6) served as a benchmark to evaluate the calibrated FY-3D MERSI-II reflectance using different versions of calibration coefficients. The MYD09GA product provides the daily surface spectral reflectance from the Aqua MODIS dataset for bands 1 through 7 at 500 m pixel size, corrected for atmospheric effects of gasses, aerosols, and Rayleigh scattering [37]. The zenith and azimuth angles to the sun and sensor and QA bands at 500 m resolution, 1 km observation, and geolocations are provided along with the 500-m surface reflectance. The 500 m surface reflectance for bands 1–4 and corresponding observation and QA bands were involved in this study.
To ensure reasonable comparison between FY-3D MERSI-II reflectance and MODIS benchmarks, pixels that were cloudy or affected by aerosols were masked out from MYD09GA product based on the QA layers. Then the quality-controlled surface reflectance and associated observation geometries at 500 m were re-projected to the same grid of MERSI-II images.
3. Methods
3.1. Reflectance-Based Vicarious Calibration with BRDF Correction
We adopted the reflectance-based vicarious calibration method with BRDF correction to calibrate FY-3D MERSI-II four visible and near-infrared bands at 250 m. The flow chart of the proposed method, along with the input datasets and satellite image processing steps is presented in Figure 5. The major steps and key equations will be discussed in Section 3.2 and Section 3.3 in detail.
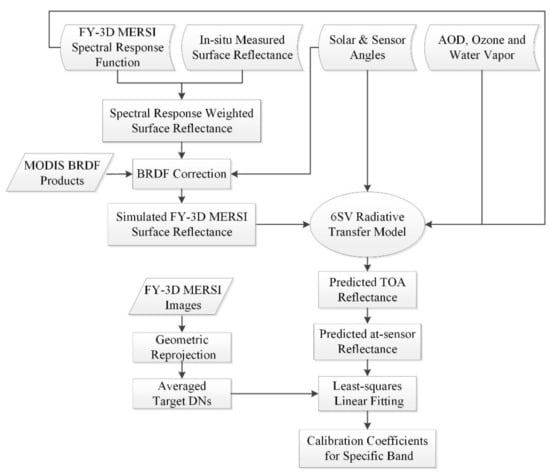
Figure 5.
The flow chart of the adopted method of reflectance-based vicarious calibration with bidirectional reflectance distribution function (BRDF) correction.
As shown in Figure 5, for each FY-3D MERSI-II target band, the vicarious calibration process was performed separately to obtain the calibration coefficients for each specific band. The hyperspectral surface reflectance scaled from in-situ measurements was interpolated and convolved with the spectral response function of MERSI-II to simulate band-specific MERSI-II surface reflectance. The BRDF correction was performed using MODIS weighting parameters from the BRDF kernels to simulate the surface reflectance in the sun-sensor direction during a MERSI-II overpass. The TOA reflectance was predicted using the 6SV radiative transfer model with the in-situ measured atmospheric conditions from RadCalNet and the sun-sensor geometry of the sensor as inputs. The calibration coefficients were calculated by linear least-squares fitting between the geometrically processed Digital Numbers (DNs) recorded by MERSI-II and the predicted at-sensor reflectance.
3.2. BRDF Correction
The RadCalNet-provided surface reflectance is at 10 nm intervals, scaled from multispectral measurements using fitted hyperspectral data. In order to simulate FY-3D MERSI-II observations for a specific band, the hyperspectral surface reflectance scaled from in-situ measurements was interpolated and convolved with the spectral response function of MERSI-II. The equation is as follows:
where and represent the sensor observed and in-situ measured surface reflectance, respectively; is the band-specific spectral response function of MERSI-II sensor; and are band number and wavelength, respectively. and define the spectral range for specific band .
Since the MERSI-II views the site with a large angle significantly deviated from in-situ nadir measurements, BRDF correction should be performed to harmonize the MERSI-II and field measurements to consistent observation geometry. The c-factor approach [38] using the ratio of BRDF between different viewing and illuminating angles based on the MCD43A1 parameters:
was employed in this study to achieve the BRDF harmonization. In the equation, and are zenith angles to sun and sensor, respectively; stands for the relative azimuth angle between the direction of sensor and ground instrument; the is the surface reflectance observed from sun and sensor angles of MERSI-II, while the is nadir-viewed in the direction of ground instrument with view zenith angle equal to 0 and is sun azimuth angle for in-situ measurement since the ground view azimuth angle is also 0; The is the BRDF model of the target at the site. As one of the most popular BRDF models, the kernel driven model RTLS used in study expressed as:
is used in this study. The , and are the weights for the RTLS isotropic kernel, Ross-Thick volumetric scattering kernel (), and Li-Sparse geometric scattering kernel (), respectively. In this study, the three kernel parameters , and were obtained from MCD43A1 BRDF products. The Ross-Thick volumetric kernel () and Li-Sparse geometric kernel () are expressed as:
where is constrained in the range of [−1,1]. The BRDF corrected surface reflectance will be later used to predict TOA reflectance through the radiative transfer model.
3.3. Radiative Transfer Model Simulation
The reflected signal recorded by a sensor is generally affected by atmospheric processes, such as gas absorptions, molecule and aerosol scattering. Thus, the amount of reflected energy received by a sensor can be roughly separated into two parts: energy reflected from the surface and atmosphere. Given the surface reflectance with the associated sun-target-sensor geometry and atmospheric conditions, the TOA reflectance recorded by a sensor can be simulated by using a radiative transfer model, assuming the surface is Lambertian. The equation is described as:
where is the TOA reflectance, surface reflectance, and is atmospheric reflectance for path radiance; represents atmospheric spherical albedo; refer to the downward and upward transmittances, respectively.
In this study, we used the latest version of 6S vector radiative transfer model (6SV2.1) [39,40] to predict MERSI-II TOA reflectance based on the simulated MERSI-II surface reflectance and corresponding observation geometry and atmospheric conditions. Since the MERSI-II spectral response functions are not defined in 6SV FORTRAN code, we embedded them into 6SV2.1 code and then recompiled it to obtain the executable program that could run specifically for MERSI-II spectral data. The 6SV required input parameters of observation geometric conditions, including zenith and azimuth angles to sun and sensor, are provide by FY-3D HDF files, while the atmospheric conditions, such as AOD at 550 nm and aerosol type, water vapor and ozone, are taken from the in-situ measurements from RadCalNet data portal. We selected a user-defined atmospheric model with the water vapor and ozone content configurations. The aerosol types at Railroad Valley Playa and Baotou Sand sites are determined as rural type in RadCalNet files, which is between the continental and desert type in 6SV model. Given the fact that in 6SV model, the angstroms (aerosol wavelength exponent) for continental and desert types are 1.2 and 0.3, respectively, the continental aerosol type is chosen for both sites since the angstroms are generally greater than 0.95 in 2019. Finally, the unknown variables in Equation (9) will be obtained from the 6SV output so that the TOA reflectance can be predicted using Equation (9).
Since the TOA reflectance is derived from MERSI-II calibrated reflectance corrected by solar zenith angle and sun-earth distance, the calibrated at-sensor reflectance can be predicted though the equation:
where is the MERSI-II calibrated reflectance for a given band, and is the sun-earth distance in the astronomical unit. Note that there is a scale factor of 100 for radiometric calibration of MERSI-II.
There is a linear relationship between the calibrated reflectance and the DNs recorded by the sensor:
where is the multiplicative rescaling gain for a specific band and is the band-specific additive bias. The least-square linear fitting was utilized then in this study to calculate the calibration coefficients and for MERSI-II specific band based on Equation (11).
4. Results
4.1. Vicarious Calibration Results
Using the reflectance-based vicarious calibration method with BRDF correction, the radiometric calibration coefficients of FY-3D MERSI-II were calculated. In order to compare the performance with and without BRDF correction in the calibration process, the calibration were conducted in the two cases separately. Figure 6 shows the calibration results without consideration of the BRDF effects due to the sensor’s off-nadir viewing, while Figure 7 presents the results accounting for the contribution of BRDF effects to calibration results. Along with the scatters and fitting lines which show the relationships between the FY-3D MERSI-II calibrated reflectance and DNs of the target site, the statistical information, including regression equations and R2 are also provided in Figure 6 and Figure 7. Note that the first-order coefficient and constant corresponding to each fitting line are the final radiometric calibration coefficients gain and offset, respectively.
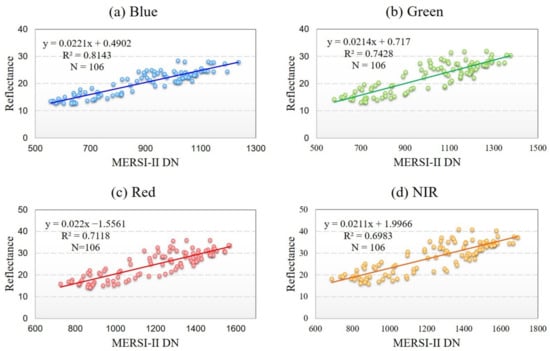
Figure 6.
The relationships between in-situ measurements simulated at-sensor reflectance and Digital Numbers (DNs) of FY-3D MERSI-II for the four spectral bands using the normal reflectance-based method without BRDF correction: (a) blue band; (b) green band; (c) red band; (d) Near-infrared (NIR) band. Least-squares linear fitting resulted in vicarious calibration coefficients.
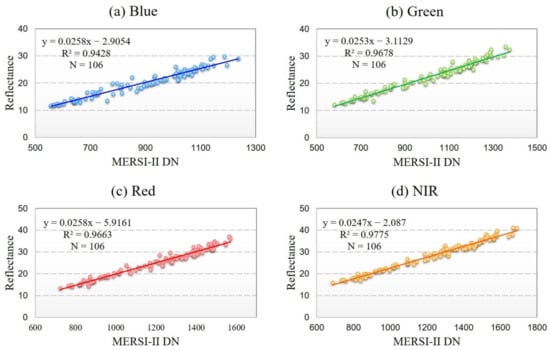
Figure 7.
The relationships between in-situ measurements simulated at-sensor reflectance and DNs of FY-3D MERSI-II for the four spectral bands using the reflectance-based method with BRDF correction: (a) blue band; (b) green band; (c) red band; (d) NIR band. Least-squares linear fitting resulted in vicarious calibration coefficients.
Comparing Figure 6 for results without BRDF correction and Figure 7 in case of calibration with BRDF correction, a better linear relationship can be seen between FY-3D MERSI-II calibrated reflectance and DNs after BRDF correction for each band. The results from normal reflectance-based calibration shown in Figure 6 demonstrate larger disagreement between predicted reflectance and sensor recorded DNs as the scatters distribute discretely along the fitting lines with not significant correlation for the four channels. For most bands, the determination coefficients (R2) are <0.75, excluding the near-infrared (NIR) band with a R2 of 0.8143. Favorable agreements could be observed in Figure 7 between the BRDF-corrected MERSI-II reflectance and DNs with scatters closely distributing along fitting lines and R2 more than 0.96 for most bands, except for the blue band with R2 of 0.9428. The efforts of BRDF correction can markedly improve the abilities of predicted reflectance to capture the variation in MERSI-II recorded DNs. The calibration results indicate that BRDF effects are not negligible since the sensor observation with large view angles leads to a significant deviation in the calibration results. The relationship after BRDF correction is more strongly linear, concluding that accounting for BRDF correction could significantly improve the performance of radiometric calibration of MERSI-II.
To achieve a comprehensive comparison between reflectance-based method with BRDF correction (BRDF-corrected) adopted in this study and normal reflectance-based method (Reflectance-Based) without consideration of BRDF effects, the calibration coefficients obtained from the two different methods, as well as the official coefficients are further analyzed in Table 1. The differences between the three versions of calibration coefficients are also provided in Table 1. The officially proved MERSI-II calibration coefficients are mostly obtained by integrated vicarious calibration method using 10 global stable earth targets [41,42], including desert sites located in Africa and China, and clean ocean sites. The accuracy of MERSI-II coefficients is generally better than 5%; most channels could reach 3%. Thus, we compared our results to the official version to evaluate the performance of the proposed method.

Table 1.
The three versions of calibration coefficients for FengYun-3D MEdium Resolution Spectrum Imager-II (FY-3D MERSI-II) were derived using different methods, including the officially provided coefficients. The differences between the three versions of coefficients are also provided in the table. The shaded columns are the calibration coefficients and determination coefficients derived using the proposed method (BRDF-corrected) in this study.
Calibration coefficients for FY-3D MERSI-II derived from different methods and the official coefficients are listed in Table 1. The differences between the three versions of gain coefficients are also analyzed. As shown in Table 1, the BRDF-corrected method obtains larger gain coefficients and much smaller offset coefficients with significantly higher fitting correlations than the normal Reflectance-Based method without BRDF correction for all four bands. This reveals that the large view angle off-nadir can lead to evident deviation in calibration results. When comparing the gain and offset coefficients derived using methods with and without BRDF correction to those officially provided coefficients (columns D 1, D 2, D 3, and D 4 in Table 1), much higher differences are observed for the normal reflectance-based method than the BRDF-corrected method. The gain differences (column D1) are generally > 12% for reflectance-based method in all bands, and especially high for the NIR band (19.77%). In contrast, the gain differences (column D 2) are within 1.7% for the three visible bands and the largest value observed in NIR band is only 6.08%, when comparing the gains derived from the BRDF-corrected method to officially provide gains. The comparisons of offset between the three versions of coefficients show a similar pattern. The BRDF-corrected method derived offsets are much closer to official coefficients than the reflectance-based method without BRDF correction. As seen in column D 4, the green-band offset obtained by using the BRDF-corrected method is the closest to the official coefficients with a difference ratio of 4.00%, while those of blue, red and NIR bands are 10.69%, 5.61% and 44.72%, respectively. In comparisons between Reflectance-Based method and Official coefficients (column D 3), the difference is up to 75.17% for the red band, but the figures are evidently much higher in blue, green, and red bands, which exceed 110%. Due to the accounting for BRDF correction, the coefficients obtained using the BRDF-corrected method are much closer to the official coefficients than the version derived by the normal reflectance-based method. Thus, eliminating the uncertainties brought by surface anisotropy could significantly improve the performance of vicarious calibration of sensors with large view angles.
4.2. Validation Results
4.2.1. Direct Validation with Field Measurements
In order to evaluate the calibration results, in-situ measurements from RadCalNet at another site (Baotou Sand) were utilized in this paper. The process of generating benchmark surface reflectance from field measurements is similar to that of vicarious calibration. After the band-specific in-situ surface reflectance was weighted by FY-3D MERSI-II spectral response function, BRDF and atmospheric correction were employed to simulate reference TOA and surface reflectance from filed measurements. The FY-3D MERSI-II surface reflectance was obtained through atmospheric correction using 6SV with the ground measured atmospheric conditions as inputs. The comparison between calibrated TOA and surface reflectance of FY-3D MERSI-II and in-situ benchmarks are presented in Figure 8 and Figure 9, respectively. For comparison, the radiometric coefficients obtained using the reflectance-based method without BRDF correction are also involved in the comparison, as well as the official coefficients.

Figure 8.
Validation of calibrated TOA reflectance of FY-3D MERSI-II using in-situ measurements simulated TOA reflectance for the four spectral bands: (a) the results for calibration coefficients derived using the proposed BRDF-corrected method; (b) the results for calibration coefficients derived using the reflectance-based method; (c) the results for official calibration coefficients. The statistical results of mean relative difference (MD), root mean squared error (RMSE), and the number of samples are also provided.
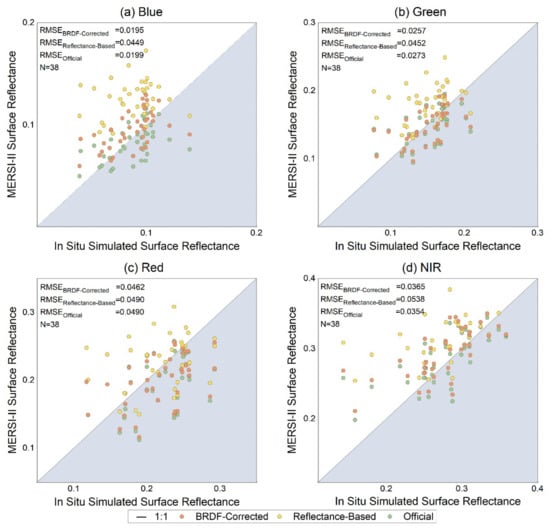
Figure 9.
Validation of calibrated surface reflectance of FY-3D MERSI-II using in-situ measurements simulated surface reflectance for the four spectral bands: (a) blue band; (b) green band; (c) red band; (d) NIR band. The results of the three versions of calibration coefficients are plotted in this figure. The statistical results of RMSE, and a number of samples are also provided.
Figure 8 depicts the MERSI-II calibrated TOA reflectance against the in situ simulated TOA reflectance for the three versions of calibration coefficients, respectively. The MERSI-II TOA reflectance calibrated by coefficients derived using the proposed BRDF-corrected method (Figure 8a) agrees well with the in situ simulated reference data, as indicated by the higher R2 of 0.77 and smaller MD of 10.45% and RMSE of 0.0278. Most of the scatters are aligned closely with the 1:1 line, with relatively discrete distribution observed in a few scatters of red and bands. The quite similar performance of official coefficients are observed in Figure 8c, with almost the same figures as the BRDF-corrected method generated coefficients (R2 of 0.76, MD of 10.84% and RMSE of 0.0285). It is no surprise because these two versions of coefficients have no significant difference (see Table 1).
The MERSI-II TOA reflectance calibrated by official coefficients shows a bit of underestimation against the in situ simulated TOA reflectance, as more than a half points are distributed under the 1:1 line. While Figure 8b shows poor performances of the coefficients derived using reflectance-based method without BRDF correction, which indicated by the lowest R2 (0.68) and the largest MD (16.90%) and RMSE (0.0307) and clear overestimation against the in situ simulated TOA reflectance.
Figure 9 separately plots the comparisons between the field measurements simulated surface reflectance and the MERSI-II surface reflectance using different versions of calibration coefficients for each band. We can see that the surface reflectance calibrated using the coefficients from the proposed method (BRDF-corrected) agrees better with the simulated ground truth than the other two versions of coefficients (reflectance-based method and Official) for all the visible bands, as the scatters align closer with the 1:1 line. In contrast, the surface reflectance calibrated using coefficients obtained by the reflectance-based method shows overestimation compared to the in-situ simulated reflectance, while the surface reflectance calibrated using official coefficients reveals underestimation. When it comes to RMSE, the coefficients derived by reflectance-based method without BRDF correction result in the largest RMSE for each band than other two versions of coefficients. The BRDF-corrected method produces similar RMSEs as official coefficients in the case of each band.
The validation results in Figure 8 and Figure 9 reveal the same pattern that the coefficients derived by the proposed method perform as well as the official coefficients and outperform those derived using the reflectance-based method without BRDF correction. This indicates that the efforts of BRDF correction can minimize the effects caused by off-nadir viewing so that the accuracy of vicarious calibration could be significantly improved.
4.2.2. Inter-Comparison to MODIS Observations
To comprehensively evaluate the performance of the derived calibration coefficients of FY-3D MERSI-II, cross-comparison with surface reflectance simulated from MODIS observations were further conducted and the results are shown in Figure 10 and Figure 11. Figure 10 represents the surface reflectance of FY-3D MERSI-II calibrated using different versions of coefficients against the simulated surface reflectance from MODIS observations, while Figure 11 shows the distributions of ratio of surface reflectance between MERSI-II and MODIS.
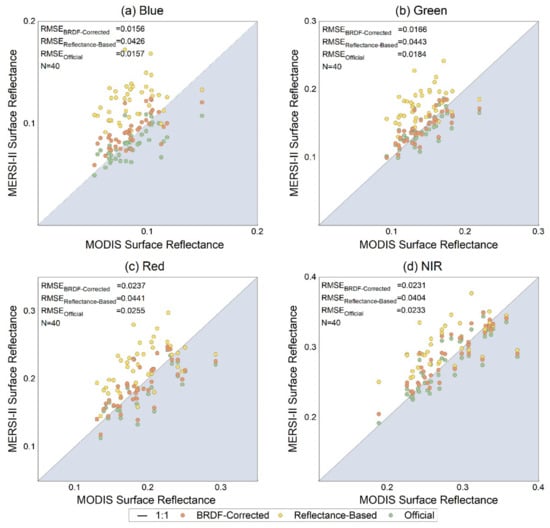
Figure 10.
Validation of calibrated surface reflectance of FY-3D MERSI-II using simulated surface reflectance from MODIS observations for the four spectral bands: (a) blue band; (b) green band; (c) red band; (d) NIR band. The results of the three versions of calibration coefficients are plotted in this figure. The statistical results of RMSE and number of samples are also provided.
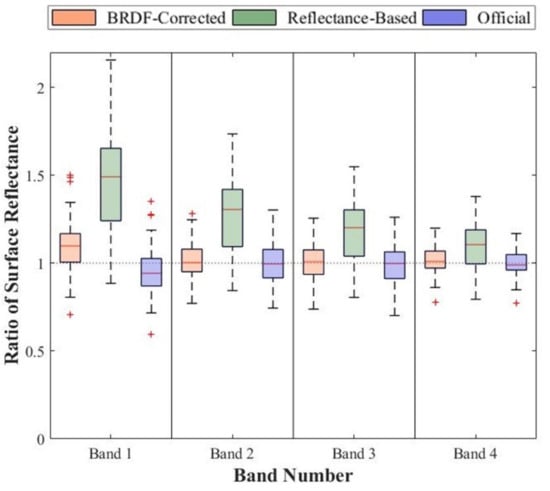
Figure 11.
Distributions of the ratio of surface reflectance (MERSI-II/ MYDO9) in the case of the three versions of calibration coefficients derived using different methods. The orange-red, green, and purple boxplots depict the distributions of the ratio between MERSI-II calibrated surface reflectance and MODIS simulated surface reflectance. The central red line in each box plot represents the median value of ratios.
Figure 10 shows the same pattern as Figure 9 that similar performance could be observed for coefficients obtained by the proposed method (BRDF-corrected) and officially provide coefficients, while poor performance occurred in results of coefficients derived using the reflectance-based method without BRDF correction. The MERSI-II surface reflectance calibrated by the BRDF-corrected coefficients fits well with the MODIS simulations, with the lowest RMSEs for each band (0.0156 of blue band, 0.0166 of green band, 0.0237 of red band, and 0.0231 of NIR band). The official coefficients result in almost the same figures of RMSE for the four bands as the BRDF-corrected coefficients, while the coefficients obtained from the reflectance-based method perform poorly with the highest RMSEs for each band. For the distribution of the points, the validation data of the BRDF-corrected coefficients align along the 1:1 line, while the results of official coefficients show slight underestimation and obvious overestimation occurred in the results of coefficients obtained using the reflectance-based method.
The validation with MODIS simulated surface reflectance is further analyzed by the ratio of surface reflectance (MERSI-II/MYDO9) in Figure 11. The colorful boxplots depict the distributions of the ratio between MERSI-II calibrated surface reflectance and MODIS simulated reflectance. The orange-red, green, and purple colors represent results from the three versions of radiometric coefficients, respectively.
Also, the three versions of calibration coefficients obtained by the BRDF-corrected and reflectance-based methods and officially provided are all participate in. A similar pattern could be observed in Figure 11 as in Figure 10. Surface reflectance obtained by the BRDF-corrected method is the closest to the MODIS benchmarks with ratios mostly near 1 for most bands, while those calibrated by the coefficients from reflectance-based method vary from the true values with boxes distributed far from the line of ratio equal to 1. In addition, the ratios of reflectance are mostly larger than 1 for reflectance-based method obtained coefficients, while for the version of official coefficients, the ratios are mostly lower than 1 in the case of each band. The results of validation with MODIS products (Figure 10 and Figure 11) indicate that the calibration coefficients derived by the BRDF-corrected method adopted in this study perform the best while coefficients from the reflectance-based method without BRDF correction tend to overestimate surface reflectance and officially provided coefficients lead to underestimation.
5. Uncertainty Analysis
The uncertainty of radiometric calibration is an essential indicator representing the reliability of the calibration result. A lower uncertainty indicates a more reliable result, which is closer to the true value. The calibration uncertainty is generally analyzed by estimating the contribution of each separate factor to the overall uncertainty [43]. In this study, the sources of uncertainty include surface reflectance, BRDF products, radiative transfer model, AOD, water vapor content, and ozone content. It was proved that the accuracy of vicarious calibration do not become sensitive to the choice of radiative transfer model, while the uncertainty of the atmospheric input parameters has shown a significant impact on reflectance-based results [20,44]. This is can be explained by the fact that vicarious calibration is usually performed at bright targets with low aerosol conditions, as shown in Figure 2. Thus, we independently estimated the potential influence that the involved factors, including surface reflectance, BRDF products, AOD, water vapor content and ozone column, have on the final calibration coefficients in this study. After determining the uncertainty brought by each factor, the overall uncertainty is taken as the root sum of squares of the uncertainty from all the sources [45].
- (1)
- The uncertainty caused by surface reflectance ()
The in-situ measured surface reflectance is one of the major sources that introduce errors to the calibration coefficients. According to the uncertainty budgets assisted with surface reflectance provided by RadCalNet portal, the error of instrument measured reflectance is about 4% for most bands, except for the blue band (about 5%) at Railroad Valley Playa Site. We took the specific errors of surface reflectance from RadCalNet to derive calibration coefficients of MERSI- II target bands. The four bands show comparable uncertainties (within 4%) caused by the errors in the ground surface reflectance measurements.
- (2)
- The uncertainty brought by BRDF product ()
The assessment of MODIS BRDF model parameters (MCD43A1 Collection 6) shows mean absolute errors of 0.013 for blue band, 0.010 in the green band, 0.008 for the red band, and 0.015 for the NIR band when compared with Landsat directional reflectance [46]. Taking the uncertainty brought by BRDF to surface reflectance, new calibration coefficients were derived. Unsurprisingly, the largest uncertainty appears in the blue band, as the blue band has the lowest reflectance with relatively high absolute errors among the four bands.
- (3)
- The uncertainty from the choice of aerosol type ()
The aerosol type for Railroad Valley Playa site provided by RadCalNet based on the in-situ measurement is rural, but this type is not identical to the convention used in the 6S model [23]. Actually, the rural type is between continental and desert type in 6S model. Although we choose the continental type as 6SV input according to the in-situ measured angstroms, it is still meaningful to explore the potential impact that the choice of aerosol type may have on the final calibration results (as shown in Table 2).

Table 2.
The determined uncertainties in the calibration of FY-3D MERSI-II brought by each involved factor and the total uncertainties of all the factors for the four spectral bands.
- (4)
- The uncertainty from AOD ()
The aerosol loading is another major source that brings uncertainty to the vicarious calibration results. The instrument measured AOD has an error of 0.05 at Railroad Valley Playa Site in 2019, according to the files from RadCalNet. Taking the errors of AOD to calibrate MERSI-II target bands, the uncertainties are shown in Table 2. The larger uncertainty is observed in the blue and green band (∼−0.4%), while the uncertainties are zero for the red and NIR bands. This can be explained by the fact that the reflectance of the blue and green bands is lower than that of the red and NIR bands; the small absolute variation will lead to relatively high uncertainty.
- (5)
- The uncertainty due to water vapor content ()
Water vapor is another atmospheric parameter that may bring errors to calibration results. During the field campaign, the instrument used to measure water vapor shows an error of 0.1 g/cm2 (as shown in Figure 2). Taking the uncertainty budget from RadCalNet, the MERSI- II target was calibrated again. The potential uncertainties are zero for all four bands, as shown in Table 2. This phenomenon was also found in studies that up to 15% uncertainty of water vapor content rarely contributes to the uncertainty of calibration results [45].
- (6)
- The uncertainty caused by ozone content ()
The third 6SV input atmospheric variable is ozone content. According to the uncertainty budgets provided by RadCalNet portal, the measurements of ozone have an uncertainty ranging from 0.07 to 0.12 cm-atm. Uncertainties in the overall calibration caused by these errors in the field measured ozone content are presented in Figure 6. The small error in ozone content (∼3%) brings minimal uncertainty in calibration results, as the uncertainties in the green bands are as low as 0.4% and those in blue, red, and NIR bands are zero.
- (7)
- The overall uncertainty of all factors ()
Assuming that each factor contributes to the uncertainties in radiometric calibration independently from each other, the overall uncertainty can be determined as the root sum of squares of the uncertainties of all of the factors [45]. The equation is expressed as:
The determined contribution of each factor brought to the uncertainty of calibration results, as well as the total uncertainty of calibration coefficients for each band are shown in Figure 7. The vicarious calibration of MERSI-II has total uncertainties ranging from 3.93% to 4.79% in all four bands, which satisfy the uncertainty requirement typical for land-monitoring space missions (within 5%). Among the four bands, the blue and NIR bands have relatively higher uncertainties than green and red bands mainly due to the larger BRDF errors in the two bands.
In general, the vicarious calibration results of MERSI-II with uncertainties within 5% for the visible and NIR bands are favorable for land monitoring applications [20]. Further efforts need to be made to improve the instrument capacity of measuring in-situ surface reflectance since the errors of reflectance measurements contribute the most to the uncertainties of calibration results. Using the ground measurements to describe surface anisotropy instead of satellite BRDF product is possible to eliminate the errors brought by satellite BRDF product due to the differences in spatial resolution and spectral configuration between sensors. In addition, the sources that bring uncertainty to the calibration results are not independent of each other. Thus, uncertainty analysis integrated all the factors accounting for the inter-correlation between each pair of involved factors should be included in our follow-up work.
6. Conclusions
The FY-3D equipped with an advanced MERSI-II sensor is comparable with the popularly used moderate sensors (i.e., the MODIS) in terms of temporal, spatial, and spectral capacities. However, the radiometric performance of MERSI-II is limited, as assessed by previous studies and reports. Facing the demand of periodic absolute radiometric calibration, we employed the reflectance-based vicarious calibration method with BRDF correction to calibrate the visible and NIR bands at 250 m of MERSI-II, taking advantage of publicly accessed in situ measurements of surface and atmospheric properties provided by RadCalNet. Given the fact that MERSI-II scans earth surface with a quite large swath leading to off-nadir viewing significantly deviated from the in-situ nadir measurements, there is non-negligible difference between sensor observation and ground measurement due to the surface anisotropy. Therefore, we performed BRDF correction to harmonize satellite observations and field measurements to consistent illumination and viewing geometries.
Our results demonstrate that the efforts of BRDF correction could significantly improve the performance of vicarious calibration, as a stronger linear relationship between MERSI-II reflectance and DNs are generated. The calibration results were comprehensively validated by both direct comparisons with ground data and inter-comparisons to MODIS benchmarks. The results indicate that the accounting for BRDF correction is essential to ensure radiometric accuracy of instrument and inter-consistency between multiple sensors. The vicarious calibration of FY-3D MERSI shows an uncertainty of <5% for visible and NIR bands, which meet the typical radiometric accuracy requirement for land-monitoring applications. In addition, the proposed approach is also applicable to calibrate other large footprint sensors.
Author Contributions
Y.C., K.S. and X.H. designed the experiments; Y.C., W.L. and P.L. conducted the experiments; Y.C., K.S., X.H., W.L., P.L. and T.B. discussed the results. All authors contributed to the writing and revising of the manuscript. All authors have read and agreed to the published version of the manuscript.
Funding
This work was supported by the National Natural Science Foundation of China (NO.41801344, NO. 41471354, NO. 91738301, NO. 92038301, and NO. 41871249) and National Key Research and Development Program of China (2018YFB0504901).
Institutional Review Board Statement
Not applicable.
Informed Consent Statement
Not applicable.
Data Availability Statement
Not applicable.
Acknowledgments
We would like to thank the Radiometric Calibration Network for providing the in-situ measurements and National Satellite Meteorological Center of China Meteorological Administration for providing satellite data.
Conflicts of Interest
The authors declare no conflict of interest.
References
- Yang, J.; Zhang, P.; Lu, N.; Yang, Z.; Shi, J.; Dong, C. Improvements on global meteorological observations from the current Fengyun 3 satellites and beyond. Int. J. Digit. Earth 2012, 5, 251–265. [Google Scholar] [CrossRef]
- Yang, Z.; Zhang, P.; Gu, S.; Hu, X.; Tang, S.; Yang, L.; Xu, N.; Zhen, Z.; Wang, L.; Wu, Q. Capability of Fengyun-3D satellite in earth system observation. J. Meteorol. Res. 2019, 33, 1113–1130. [Google Scholar] [CrossRef]
- Jin, S.; Zhang, M.; Ma, Y.; Gong, W.; Chen, C.; Yang, L.; Hu, X.; Liu, B.; Chen, N.; Du, B. Adapting the Dark Target Algorithm to Advanced MERSI Sensor on the FengYun-3-D Satellite: Retrieval and Validation of Aerosol Optical Depth Over Land. IEEE Trans. Geosci. Remote Sens. 2021. [Google Scholar] [CrossRef]
- Yan, L.; Hu, Y.; Zhang, Y.; Li, X.-M.; Dou, C.; Li, J.; Si, Y.; Zhang, L. Radiometric Calibration Evaluation for FY3D MERSI-II Thermal Infrared Channels at Lake Qinghai. Remote Sens. 2021, 13, 466. [Google Scholar] [CrossRef]
- Xu, N.; Niu, X.; Hu, X.; Wang, X.; Wu, R.; Chen, S.; Chen, L.; Sun, L.; Ding, L.; Yang, Z. Prelaunch calibration and radiometric performance of the advanced MERSI II on FengYun-3D. IEEE Trans. Geosci. Remote Sens. 2018, 56, 4866–4875. [Google Scholar] [CrossRef]
- Chen, J.; He, X.; Liu, Z.; Xu, N.; Ma, L.; Xing, Q.; Hu, X.; Pan, D. An approach to cross-calibrating multi-mission satellite data for the open ocean. Remote Sens. Environ. 2020, 246, 111895. [Google Scholar] [CrossRef]
- Wu, R.; Zhang, P.; Xu, N.; Hu, X.; Chen, L.; Zhang, L.; Yang, Z. FY-3D MERSI On-Orbit Radiometric Calibration from the Lunar View. Sensors 2020, 20, 4690. [Google Scholar] [CrossRef]
- Wen, Z.; Xun, L.; Chen, L.; Zhang, D.; Zhang, J.; Yan, Q.; Li, X. Absolute radiometric calibration of Fengyun-3D Medium Resolution Spectral Imager-II and radiation characteristics analysis. J. Appl. Remote Sens. 2020, 14, 047504. [Google Scholar] [CrossRef]
- Tsuchida, S.; Yamamoto, H.; Kouyama, T.; Obata, K.; Sakuma, F.; Tachikawa, T.; Kamei, A.; Arai, K.; Czapla-Myers, J.S.; Biggar, S.F.; et al. Radiometric Degradation Curves for the ASTER VNIR Processing Using Vicarious and Lunar Calibrations. Sensors 2020, 12, 427. [Google Scholar] [CrossRef]
- Tan, K.; Wang, X.; Niu, C.; Wang, F.; Du, P.; Sun, D.-X.; Yuan, J.; Zhang, J. Vicarious Calibration for the AHSI Instrument of Gaofen-5 With Reference to the CRCS Dunhuang Test Site. IEEE Trans. Geosci. Remote Sens. 2020. [Google Scholar] [CrossRef]
- Uprety, S.; Cao, C. Suomi NPP VIIRS reflective solar band on-orbit radiometric stability and accuracy assessment using desert and Antarctica Dome C sites. Remote Sens. Environ. 2015, 166, 106–115. [Google Scholar] [CrossRef]
- Barsi, J.A.; Schott, J.R.; Hook, S.J.; Raqueno, N.G.; Markham, B.L.; Radocinski, R.G. Landsat-8 Thermal Infrared Sensor (TIRS) Vicarious Radiometric Calibration. Remote Sens. 2014, 6, 11607–11626. [Google Scholar] [CrossRef]
- Bruegge, C.J.; Crisp, D.; Helmlinger, M.C.; Kataoka, F.; Kuze, A.; Lee, R.A.; Mcduffie, J.L.; Rosenberg, R.A.; Schwandner, F.M.; Shiomi, K. Vicarious Calibration of Orbiting Carbon Observatory-2. Ieee Trans. Geosci. Remote Sens. 2019, 57, 5135–5145. [Google Scholar] [CrossRef]
- Zhang, P. Monitor the radiance calibration of the remote sensing instrument by using the reflected lunar irradiance. J. Remote Sens. 2015, 20, 278–289. [Google Scholar]
- Chen, Y.; Sun, K.; Li, D.; Bai, T.; Huang, C. Radiometric cross-calibration of GF-4 PMS sensor based on assimilation of landsat-8 OLI images. Remote Sens. 2017, 9, 811. [Google Scholar] [CrossRef]
- Teillet, P.; Fedosejevs, G.; Gauthier, R.; O’neill, N.; Thome, K.J.; Biggar, S.F.; Ripley, H.; Meygret, A. A generalized approach to the vicarious calibration of multiple Earth observation sensors using hyperspectral data. Remote Sens. Environ. 2001, 77, 304–327. [Google Scholar] [CrossRef]
- Chen, S.; Zheng, X.; Li, X.; Wei, W.; Du, S.; Guo, F. Vicarious Radiometric Calibration of Ocean Color Bands for FY-3D/MERSI-II at Lake Qinghai, China. Remote Sens. 2021, 21, 139. [Google Scholar]
- Bacour, C.; Briottet, X.; Bréon, F.M.; Viallefont-Robinet, F.; Bouvet, M. Revisiting Pseudo Invariant Calibration Sites (PICS) Over Sand Deserts for Vicarious Calibration of Optical Imagers at 20 km and 100 km Scales. Remote Sens. 2019, 11, 1166. [Google Scholar] [CrossRef]
- Song, Q.; Chen, S.; Xue, C.; Lin, M.; Du, K.; Li, S.; Ma, C.; Tang, J.; Liu, J.; Zhang, T.; et al. Vicarious calibration of COCTS-HY1C at visible and near-infrared bands for ocean color application. Opt. Express 2019, 27, A1615–A1626. [Google Scholar] [CrossRef] [PubMed]
- Bouvet, M.; Thome, K.; Berthelot, B.; Bialek, A.; Czapla-Myers, J.; Fox, N.P.; Goryl, P.; Henry, P.; Ma, L.; Marcq, S.; et al. RadCalNet: A Radiometric Calibration Network for Earth Observing Imagers Operating in the Visible to Shortwave Infrared Spectral Range. Remote Sens. 2019, 11, 2401. [Google Scholar] [CrossRef]
- Pan, Z.; Zhang, H.; Min, X.; Xu, Z. Vicarious calibration correction of large FOV sensor using BRDF model based on UAV angular spectrum measurements. J. Appl. Remote Sens. 2020, 14, 1. [Google Scholar] [CrossRef]
- Zhou, Q.; Tian, L.; Li, J.; Wu, H.; Zeng, Q. Radiometric Cross-Calibration of Large-View-Angle Satellite Sensors Using Global Searching to Reduce BRDF Influence. IEEE Trans. Geosci. Remote Sens. 2020. [Google Scholar] [CrossRef]
- Feng, L.; Li, J.; Gong, W.; Zhao, X.; Chen, X.; Pang, X. Radiometric cross-calibration of Gaofen-1 WFV cameras using Landsat-8 OLI images: A solution for large view angle associated problems. Remote Sens. Environ. 2016, 174, 56–68. [Google Scholar] [CrossRef]
- Ong, C.; Thome, K.; Heiden, U.; Czapla-Myers, J.; Mueller, A. Reflectance-Based Imaging Spectrometer Error Budget Field Practicum at the Railroad Valley Test Site, Nevada. IEEE Geosci. Remote Sens. Mag. 2018, 6, 111–115. [Google Scholar] [CrossRef]
- Kuze, A.; Brien, D.M.O.; Taylor, T.E.; Day, J.O.; Dell, C.W.O.; Kataoka, F.; Yoshida, M.; Mitomi, Y.; Bruegge, C.J.; Pollock, H.; et al. Vicarious Calibration of the GOSAT Sensors Using the Railroad Valley Desert Playa. IEEE Trans. Geosci. Remote Sens. 2011, 49, 1781–1795. [Google Scholar] [CrossRef]
- Czapla-Myers, J.; McCorkel, J.; Anderson, N.; Thome, K.; Biggar, S.; Helder, D.; Aaron, D.; Leigh, L.; Mishra, N. The Ground-Based Absolute Radiometric Calibration of Landsat 8 OLI. Remote Sens. 2015, 7, 600–626. [Google Scholar] [CrossRef]
- Markham, B.L.; Haque, M.O.; Barsi, J.A.; Micijevic, E.; Helder, D.L.; Thome, K.J.; Aaron, D.; Czapla-Myers, J.S. Landsat-7 ETM+: 12 Years On-Orbit Reflective-Band Radiometric Performance. Ieee Trans. Geosci. Remote Sens. 2012, 50, 2056–2062. [Google Scholar] [CrossRef]
- Czapla-Myers, J.S.; Thome, K.J.; Cocilovo, B.R.; Mccorkel, J.T.; Buchanan, J.H. Temporal, spectral, and spatial study of the automated vicarious calibration test site at Railroad Valley, Nevada. Proc. Spie Int. Soc. Opt. Eng. 2015, 7081, 369–375. [Google Scholar]
- Thome, K.; McCorkel, J.; Czapla-Myers, J. Inflight intersensor radiometric calibration using the reflectance-based method for LANDSAT-type sensors. In Proceedings of the Pecora 17, Denver, CO, USA, 18–20 November 2008. [Google Scholar]
- Sterckx, S.; Wolters, E. Radiometric Top-of-Atmosphere Reflectance Consistency Assessment for Landsat 8/OLI, Sentinel-2/MSI, PROBA-V, and DEIMOS-1 over Libya-4 and RadCalNet Calibration Sites. Remote Sens. 2019, 11, 2253. [Google Scholar] [CrossRef]
- Thome, K.J.; Biggar, S.F.; Wisniewski, W. Cross comparison of EO-1 sensors and other Earth resources sensors to Landsat-7 ETM+ using Railroad Valley Playa. Ieee Trans. Geosci. Remote Sens. 2003, 41, 1180–1188. [Google Scholar] [CrossRef]
- Schaaf, C.; Wang, Z. MCD43A1 MODIS/Terra+Aqua BRDF/Albedo Model Parameters Daily L3 Global—500 m V006. 2015. NASA EOSDIS Land Processes DAAC. Available online: https://doi.org/10.5067/MODIS/MCD43A1.006 (accessed on 20 February 2021).
- Wang, Z.; Schaaf, C.B.; Sun, Q.; Shuai, Y.; Román, M. Capturing rapid land surface dynamics with Collection V006 MODIS BRDF/NBAR/Albedo (MCD43) products. Remote Sens. Environ. 2018, 207, 50–64. [Google Scholar] [CrossRef]
- Jiao, Z.; Dong, Y.; Schaaf, C.B.; Chen, J.M.; Román, M.; Wang, Z.; Zhang, H.; Ding, A.; Erb, A.; Hill, M. An algorithm for the retrieval of the clumping index (CI) from the MODIS BRDF product using an adjusted version of the kernel-driven BRDF model. Remote Sens. Environ. 2018, 209, 594–611. [Google Scholar] [CrossRef]
- Chappell, A.; Webb, N.P.; Guerschman, J.P.; Thomas, D.T.; Mata, G.; Handcock, R.N.; Leys, J.F.; Butler, H. Improving ground cover monitoring for wind erosion assessment using MODIS BRDF parameters. Remote Sens. Environ. 2018, 204, 756–768. [Google Scholar] [CrossRef]
- Zhou, Q.; Tian, L.; Li, J.; Li, W. Assessment of bidirectional reflectance effects on desert and forest for radiometric cross-calibration of satellite sensors. Isprs J. Photogramm. Remote Sens. 2020, 160, 180–194. [Google Scholar] [CrossRef]
- Vermote, E.; Wolfe, R. MYD09GA MODIS/Aqua Surface Reflectance Daily L2G Global 1kmand 500m SIN Grid V006. 2015. NASA EOSDIS Land Processes DAAC. Available online: https://doi.org/10.5067/MODIS/MYD09GA.006 (accessed on 20 February 2021).
- Roy, D.P.; Ju, J.; Lewis, P.; Schaaf, C.; Gao, F.; Hansen, M.; Lindquist, E. Multi-temporal MODIS–Landsat data fusion for relative radiometric normalization, gap filling, and prediction of Landsat data. Remote Sens. Environ. 2008, 112, 3112–3130. [Google Scholar] [CrossRef]
- Kotchenova, S.Y.; Vermote, E.F.; Matarrese, R.; Klemm, F.J., Jr. Validation of a vector version of the 6S radiative transfer code for atmospheric correction of satellite data. Part I: Path radiance. Appl. Opt. 2006, 45, 6762–6774. [Google Scholar] [CrossRef] [PubMed]
- Kotchenova, S.Y.; Vermote, E.F. Validation of a vector version of the 6S radiative transfer code for atmospheric correction of satellite data. Part II. Homogeneous Lambertian and anisotropic surfaces. Appl. Opt. 2007, 46, 4455–4464. [Google Scholar] [CrossRef] [PubMed]
- Na, X.; Ronghua, W.; Xiuqing, H.; Lin, C.; Ling, S. Integrated Method for On-Obit Wide Dynamic Vicarious Calibration of FY-3C MERSI Reflective Solar Bands. J Acta Opt. Sin. 2015, 35, 1228001. [Google Scholar]
- Ling, W.; Xiuqing, H.; Lin, C. Wide dynamic nonlinear radiometric calibration of optical satellite sensors using multiple stable earth targets. J. Remote Sens. 2017, 21, 892–906. [Google Scholar]
- Chen, W.; Zhao, H.; Li, Z.; Jing, X.; Yan, L. Uncertainty evaluation of an in-flight absolute radiometric calibration using a statistical Monte Carlo method. IEEE Trans. Geosci. Remote Sens. 2014, 53, 2925–2934. [Google Scholar] [CrossRef]
- Thome, K.; Schiller, S.; Conel, J.; Arai, K.; Tsuchida, S. Results of the 1996 earth observing system vicarious calibration joint campaign at Lunar Lake Playa, Nevada (USA). Metrologia 1998, 35, 631. [Google Scholar] [CrossRef]
- Yang, A.; Zhong, B.; Hu, L.; Wu, S.; Xu, Z.; Wu, H.; Wu, J.; Gong, X.; Wang, H.; Liu, Q. Radiometric Cross-Calibration of the Wide Field View Camera Onboard GaoFen-6 in Multispectral Bands. Remote Sens. 2020, 12, 1037. [Google Scholar] [CrossRef]
- Che, X.; Feng, M.; Sexton, J.O.; Channan, S.; Yang, Y.; Sun, Q. Assessment of MODIS BRDF/Albedo model parameters (MCD43A1 Collection 6) for directional reflectance retrieval. Remote Sens. 2017, 9, 1123. [Google Scholar] [CrossRef]
Publisher’s Note: MDPI stays neutral with regard to jurisdictional claims in published maps and institutional affiliations. |
© 2021 by the authors. Licensee MDPI, Basel, Switzerland. This article is an open access article distributed under the terms and conditions of the Creative Commons Attribution (CC BY) license (https://creativecommons.org/licenses/by/4.0/).