Abstract
Results on the accuracy of SeaSonde High Frequency (HF) radar wind direction measurements in the Gulf of Naples (Southern Tyrrhenian Sea, Central Mediterranean Sea) are here presented. The investigation was carried out for a winter period (2 February–6 March) and for one summer month (August) of the reference year 2009. HF radar measurements were compared with in situ recordings from a weather station and with model data, with the aim of resolving both small scale and large scale dynamics. The analysis of the overall performance of the HF radar system in the Gulf of Naples shows that the data are reliable when the wind speed exceeds a 5 m/s threshold. Despite such a limitation, this study confirms the potentialities of these systems as monitoring platforms in coastal areas and suggests further efforts towards their improvement.
1. Introduction
The possibility of obtaining information related to the surface dynamics of coastal areas, with synoptic measurements of currents, waves and wind, allows the implementation of an active surveillance system that can cover different fields, including: oil spill transport, marine renewables, navigational safety, water quality and tsunami detection, and several other applications in the areas of physical oceanography, marine ecology and coastal zone management [1].
Different kinds of High Frequency (HF) radar (HFr) systems are being extensively used for surface ocean remote sensing [2]. They are located on the coast and transmit radio waves out to sea that are scattered from surface ocean waves, generating a received signal that is Doppler shifted by the underlying surface current. The amplitude and Doppler shifts of the backscattered signal can be analyzed to provide measurements of surface currents, waves and winds direction [3]. Direction-finding HFrs, like the SeaSonde manufactured by CODAR Ocean Sensors Ltd., are compact systems using a monopole and cross-loop as a transceiving antenna [4]. Other radar systems like WEllen RAdar (WERA) use different arrays to separate transmitted and received signals [5].
The characteristic signature of the backscattered Doppler spectrum presents Bragg peaks containing specific information on the sea surface field. The first-order echoes are typically used to retrieve surface currents, while second order ones are analyzed to reconstruct the wave field [4]. While the analysis of surface currents is well established and the retrieval of wave parameters is an emerging topic [6,7,8,9], the use of first-order peaks to measure wind direction is still poorly explored in the SeaSonde system, while in the literature some investigation on acquisition and validation using phased-array systems are available. The first numerical model to extract the wind direction from HFr backscatter was suggested by Long and Trizna [10]. In recent decades, different research groups developed algorithms for the extraction of wind direction [11,12,13,14,15,16,17,18], including also a neural network method [19] applied for wind field inversion. To date, however, no robust algorithms for a reliable measurement of wind speed are available.
In the literature, experiments on the validation of HFr wind direction have been generally carried out in wide coastal areas and over the ocean for periods from days to months [20,21,22,23,24,25,26]. The results show that several factors contribute to the accuracy of HFr wind measurements, the operational frequency being the most relevant one. When the radar operates at higher frequencies, the resonant Bragg waves have a shorter wavelength being more sensitive to changes in the wind field. Therefore, for wind direction measurements from HFr backscatter signals, a radar with a higher operating frequency leads to estimations that are in better agreement with in situ measurements [21]. Another important factor is wind speed. Different studies comparing HFr and in situ measurements concluded that the retrieval of the wind direction is not reliable under wind speeds below 5 m/s [20,21,22,23,24,25].
In the present study, we provide the first test of the wind direction performance of the HFr system installed in the Gulf of Naples (GoN; Southern Tyrrhenian Sea, Central Mediterranean) (Figure 1). HFr measurements are provided by a CODAR network managed by the Department of Science and Technologies of University Parthenope [26]. Previous works were focused on the validation and application of surface currents [27,28,29,30] and wave data [31,32,33,34]. The GoN is located in a complex coastal area with very peculiar local factors influencing the wind field, among which an intricate coastline and a complex geomorphology [35,36]. HFr wind directions measurements are here compared with in situ anemometer records provided by a weather station managed by the Istituto Superiore per la Protezione e la Ricerca Ambientale (ISPRA). In addition, wind model data obtained from the FINE version of the SKIRON/Eta model [37] are used for comparison using the output of a grid point in the GoN. The aim of this paper is to carry out a preliminary analysis of HFr-derived wind directions in the GoN, which may provide a more general insight into the reliability of SeaSonde radar systems under different wind conditions. To fulfill this goal, data from two distinct periods, in winter and summer of the reference year 2009, will be used to assess the accuracy of SeaSonde HFr measurements, and to highlight potential handicaps in the use of such platforms. To authors’ knowledge, the analysis here presented is the first carried out in the Mediterranean Sea using a 25 MHz SeaSonde HFr. Only one work has so far analyzed wind data acquired in the Mediterranean region (Ligurian Sea), but using a 12-MHz WERA HFr [21]. The capability of HFr to cover wide sea areas allows to retrieve wind direction measurements relative to km-wide sea regions rather than point-measurements like anemometers, with continuous spatial coverage like numerical models but without the land contamination in the atmospheric variables in coastal regions typical of numerical simulations [38,39].
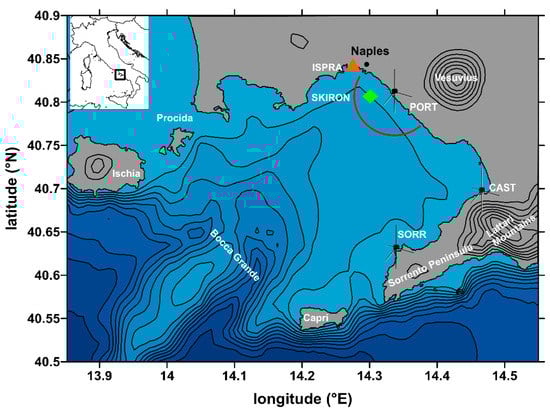
Figure 1.
Map of the Gulf of Naples (GoN) (Tyrrhenian Sea, see inset) with the locations of the three High Frequency radar (HFr) sites Portici (PORT), Castellammare di Stabia (CAST) and Massa Lubrense (SORR) (black antenna symbols), of the Istituto Superiore per la Protezione e la Ricerca Ambientale (ISPRA) weather station (orange triangle) and of the SKIRON/Eta model output point (green diamond). The red semi-circle represents the Range Cell 5 (RC5) used to retrieve the wind direction from the HFr data (see text). Toponyms of the main geographic sites are indicated. The bathymetric and orographic contours are spaced every 100 m; elevation iso-lines are plotted starting from 300 m for graphical reasons. Coastline data: NOAA National Geophysical Data Center, Coastline extract-ed: WLC (World Coast Line), Date Retrieved: 1 April 2015, http://www.ngdc.noaa.gov/mgg/shorelines/shorelines.html; bathymetric and elevation data from [40] (Access date: 8 September 2011).
The paper is structured as follows: in Section 2 an overview of the seasonal wind field in the study area is provided, while in Section 3 the instrumental platforms and the descriptive statistics used are explained. Section 4 shows the results of the comparison between HFr wind direction, in situ measurements (ISPRA) and model outputs (SKIRON/Eta). In Section 5, results derived from the comparisons are discussed. Finally, in Section 6, conclusions are summarized and future developments are outlined.
2. Study Area Overview
The GoN (Figure 1) is a highly populated area in the Southern Tyrrhenian Sea, characterized by the presence of several industrial, touristic and commercial activities [28]. The basin is almost rectangular, extending approximately 26 km along the NW-SE direction and 30 km along the NE-SW one, and communicates with the open Tyrrhenian Sea through the “Bocca Grande” (opening between Capri and Ischia Islands). Furthermore, the GoN is characterized by a complex geomorphology, with orographic obstacles that challenge wind prediction at coastal scales, as illustrated by [39].
Previous studies on the analysis and identification of typical wind fields in this area and their variation during the seasons were based on temporal series collected by weather stations installed in the urban area of Naples and resulting from model simulations [27,28,41,42,43,44]. Results showed good agreement between the measurements, depicting recurrent patterns characterized by strong seasonal influence. In winter, the most frequent winds blow from NNE and NE directions, alternated with S-SW winds associated with low-pressure systems. In summer, the reinforcement of the Azores anticyclone and, in recent years, of the African anticyclone [45], leads to long periods of stable atmospheric pressure. This determines a wind regime driven by breezes, with winds from SW and NE alternating over the day.
This atmospheric scenario makes the circulation in the interior of the GoN strongly affected by the local wind forcing, as noted in several modeling studies [46,47] and experimental investigations [48,49,50] carried out in the area.
3. Materials and Methods
The GoN HFr network includes three sites, installed in Portici (PORT), Castellammare di Stabia (CAST) and Massa Lubrense (SORR) (Figure 1). For the present study, only data from PORT were analyzed, as this site covered a sub-basin where both in situ measurements and wind model data were available. Single spectra at 12 Range Cells (RCs), spaced by 1 km, were recorded and averaged every 10 min, using CODAR proprietary software (SeaSonde Radial Suite R7u2) [6]. A unique record is averaged along each single RC, integrating the spectral energy over the first-order region of the spectrum. The directional distribution of the Bragg waves is assumed as homogeneous over each RC, consequently measurements are not georeferenced. The algorithm used to obtain wind direction is described in [20], and is here used from an end-user perspective. SeaSonde systems extract wind direction measurements from the first-order echo, i.e., the same part of the signal used to measure the surface current [51]. Data acquisition depends on the sea surface characteristics along the cell. Therefore, the percentage of data recorded might differ among RCs. The performance of HFrs is limited by uncertainty sources, as discussed by [52], including environmental noise, radio-frequency interferences and undesired echoes. Additional errors may also be due to interpretation methods (integral inversion and model fitting) and to limitations when wave heights exceed a limiting value defined by the radar frequency. These errors decrease the accuracy of raw measurements, especially at far distances where radar signals are weak [53].
To assess the accuracy of HFr measurements, HFr-retrieved wind directions were compared with in situ wind observations collected by a weather station managed by the ISPRA located in the port of Naples (Molo del Carmine; latitude: 40.840°N; longitude: 14.275°E; anemometric sensor height: 10 m a.m.s.l.; data freely downloadable at http://www.mareografico.it/; access date: 19 May 2015) (Figure 1). The station was equipped with wind speed (SIAP + MICROS, mod. T006 TVV) and direction (SIAP + MICROS, mod. T007 TDV) transducers and with a barometric sensor (SIAP + MICROS, mod. PA9880). Hourly-averaged data were used in the analysis.
In order to compare local and basin-scale wind features, we also used 10 m a.m.s.l. velocities produced by the SKIRON atmospheric model based on the Eta version [54,55,56] developed at the University of Athens. SKIRON/Eta model implemented on the Mediterranean basin ha a spatial resolution of 0.10° (10 Km) and 32 vertical levels (http://forecast.uoa.gr/forecastnewinfo.php; access date: 12 September 2017). The FINE version receives initial and lateral boundary conditions from the COARSE version of the model implemented on the whole region of the Mediterranean Sea with a spatial resolution of 0.24° (25 km) [57]. We used a forecast dataset from SKIRON/Eta Regional Forecast Europe—Mediterranean Sea with the local analysis prediction system (LAPS), a 3D data assimilation package (https://poseidon.hcmr.gr/components/forecasting-components/meteo; access date: 12 September 2017). In this investigation, we focused on the grid point (latitude: 40.801°N; longitude: 14.302°E, see Figure 1), closest to the ISPRA weather station and the PORT HFr site in order to specifically concentrate on the sub-basin of interest. Model data were available with a sampling time of one hour. To avoid any potential artifact, the 10 m a.m.s.l. records from the weather stations and the model were used without any conversion.
In this study, we compared the wind measurements from three wind data sources over two time intervals, a winter period (2 February–6 March) and a summer month (1–31 August) of the year 2009. This reference year was selected as the HFr dataset was calibrated and validated in different applications in GoN [26,27,28,31]. These periods allowed the evaluation of the reliability of the HFr in two distinct scenarios associated with recurrent seasonal patterns [27,28,58]. Owing to the specific sampling rates of each instrument, wind directions from the HFrs were subsampled at 1 h intervals. To compare HFr observations with the ISPRA and SKIRON/Eta datasets, descriptive and numerical statistics were employed. For angular variables like wind direction data, the statistics developed for the analysis of linear data is not directly applicable. As such, to investigate the coherency of wind field measurements from the different platforms we applied circular statistics parameters, [59] as suggested by [60].
The comparison between different wind direction datasets was carried out with the mean directional difference ) defined as:
where , and n indicates the number of observations considered.
The datasets correlation was performed with the circular correlation coefficient index ():
spanned in the ±1 range, where +1 (−1) indicates perfect correlation (anti-correlation) for two investigated time series, while 0 indicates no correlation [61]. The Matlab toolbox “CircStat” (http://www.jstatsoft.org/v31/i10; access date: 23 November 2017) for statistical analysis of circular and directional data was used to calculate these parameters [62].
Finally, the root mean square error (RMSE) of the wind direction retrieved by HFr, anemometer and model output was computed, in order to compare our results with previous studies in the Mediterranean area [21]. The RMSE is the standard deviation of the residuals:
Equations (1)–(3) are written for HF data and in situ measurements; to have the analogues for model data, it is sufficient to just replace with . The comparison between in situ measurements, model and HFr wind data relative to the RC5 (i.e., the RC positioned 5 km from the antenna) will be shown. RC5 represents the HFr closest to the SKIRON/Eta model point and ISPRA position (see red semi-circle in Figure 1). This RC has also been used in previous assessments of HFr wave measurements at the PORT site [6,26,31,32,33,34], covering an area close enough to the coast to receive sufficient echo intensity.
Previous studies on HFr wind direction retrieval using different procedures demonstrate that the effectiveness of inversion methods from radar backscatter measurements is critically dependent on the wind intensity [15,16,17,18,19,20,21]. Thus, under preliminary sensitivity tests and based on literature indications, we set a lower wind speed threshold at 5 m/s for the comparisons among platforms [15,16,17,18,19,20,21]. Comparisons between all the 12 RCs, in situ measurements and model data were additionally conducted to determine the difference of HFr wind direction retrieval along RCs.
4. Results
Wind Direction under Different Wind Conditions
Comparison between the ISPRA weather station data and the SKIRON/Eta model outputs showed differences in wind intensity mainly in the winter period. In Figure 2, the time series of wind speed U (m/s) acquired by ISPRA and simulated by SKIRON/Eta for winter and summer periods are presented. Over the period 2 February–6 March 2009 (Figure 2a) both datasets captured stronger wind events, but SKIRON/Eta data showed an underestimation with respect to ISPRA in situ observations. In August 2009 (Figure 2b), the same diurnal variability associated with the breeze regime was present in both datasets. As expected, based on the typical climatology of the basin, in summer only few samples (10.4% for ISPRA weather station; 6.25% for SKIRON/Eta) scored speed values U > 5 m/s. In the winter months the wind speed exceeded the threshold more often, and the percentage of U > 5 m/s was 19.7% (22.9%) in the ISPRA weather station (SKIRON/Eta) dataset. This was typically associated with the presence of storms acting in the basin. A similar remark on the criticality of measurements carried out under stable conditions applies to waves as well: in the study area usually in summer, even if the station works correctly, no wave acquisition is possible for a long period, even for the entire August month [6]. Such limitations in wave and wind retrieval thus appear as critical issues in the performance of HFr.
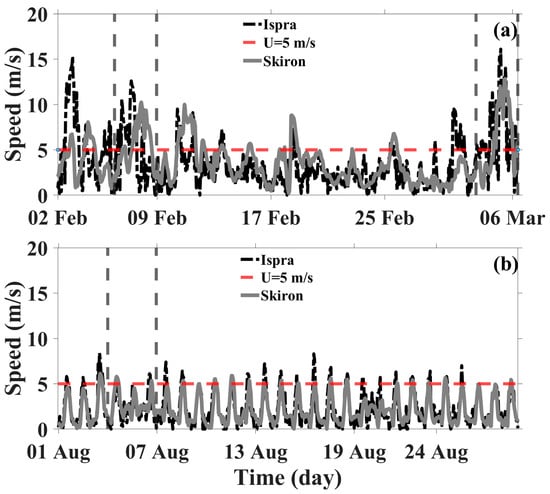
Figure 2.
Time series of wind speed (m/s) observed by the ISPRA weather station (dash-and-dot black line) and simulated by the SKIRON/Eta model (solid grey line) for the winter (upper) and summer (lower) periods. The red dashed line identifies the threshold value of wind speed set at 5 m/s (see text). The grey dashed vertical lines show the periods analyzed: (a) from 00:00 of 6 February to 23:00 of 8 February; from 10:00 of 3 March to 09:00 of 6 March; (b) from 00:00 of 4 August to 23:00 August.
Figure 3 shows a wind rose diagram relative to the analyzed periods. The highest frequencies were recorded from N-NE alternated with S-SW ones during winter, whereas daily-alternating SW and NE directions were recognizable in the summer for both datasets. The comparison showed that the wind variability and dominant directions were realistically simulated by SKIRON/Eta in the GoN during the periods under consideration. However, the data acquired by ISPRA often recorded higher intensities than the SKIRON/Eta simulation results. Such a discrepancy might be ascribed to the model resolution limitations near the coast, where the model grid can be negatively affected by land contamination. Differences in the direction recorded mainly during August in the second (N-E) and third (W-S) quadrants (see Figure 3b) were likely due to the ISPRA station position and the different exposure of the SKIRON/Eta output point (see Figure 1). Nonetheless, the SKIRON/Eta data allowed the estimation of the wind field on the sea surface, which was fundamental for our purposes. As such, both wind datasets were used as a benchmark to test the reliability of HFr measurements, provided that their peculiarities were taken into account.
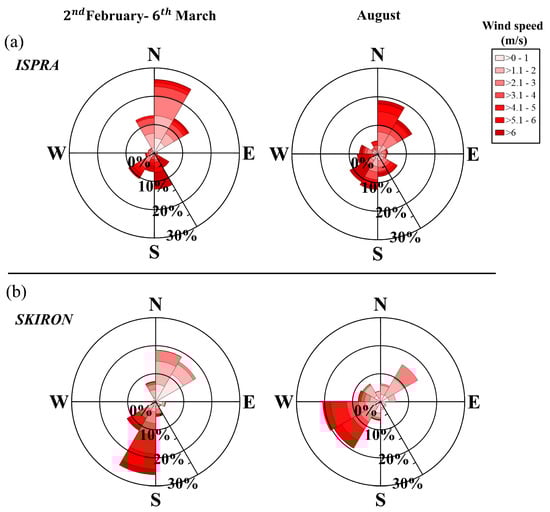
Figure 3.
Wind rose diagrams relative to ISPRA (a) and SKIRON/Eta (b) wind data for the periods 2 February–6 March and August 2009.
In weak wind periods (with speeds typically below the 5 m/s threshold), the comparison resulted statistically not significant, confirming the inaccuracy of the inversion of the HFr wind field under such conditions (statistics not shown). Considering only the values U > 5 m/s, the statistical analysis of wind direction yielded a RMSE of 43.5° (52.4°) and circular correlation coefficient of 0.82 (0.29) in winter for the ISPRA weather station (SKIRON/Eta), respectively. In the summer period for the ISPRA weather station (SKIRON/Eta) the RMSE was 63.8° (65.2°) and equaled 0.26 (0.53) (Table 1). The lower RMSE values obtained in the winter period were likely associated to the more energetic wind events associated with the low-pressure systems acting over the basin during the analyzed period.

Table 1.
Statistical skill metrics (RMSE and ) of the comparisons between HFr, ISPRA weather station and SKIRON/Eta model related to wind direction relative to the entire winter and summer datasets with U > 5 m/s.
Based on these first indications, we performed a more in-depth analysis by selecting shorter periods displaying typical thunderstorm events during winter, when the wind speed exceeded the 5 m/s threshold several times over a period of 72 h. This time window corresponds to a good compromise in terms of event duration and sea state evolution, as discussed in [31] for storm events in the GoN. In addition, a 72 h summer event during which wind speed trespassed the 5 m/s threshold was selected to compare the response of the HFr observations under different wind conditions.
The first 72-h event analyzed occurred in February 2009 (Figure 4). As expected, all the parameters reflected the winter seasonality of the study area with an atmospheric pressure minimum of 993 hPa (Figure 4a) and maximum wind speeds of 14 m/s (Figure 4b). The qualitative comparison of wind direction between ISPRA, SKIRON/Eta and HFr revealed consistency between the platforms (Figure 4c). This was confirmed by the statistical analysis (Table 2): it is worth noticing that was greater for the comparison between HFr data and ISPRA (0.70) and slightly lower for HFr and SKIRON/Eta (0.67). This was possibly due to the coarse spatial resolution of the model. Accordingly, the direction difference of wind directions was lower in the HFr-ISPRA comparison (−8.25°) than in the HFr-SKIRON/Eta one (−14.17°). Finally, the RMSE on direction was 63.5° for HFr-ISPRA comparison and 55.2° in the HFr-SKIRON/Eta.
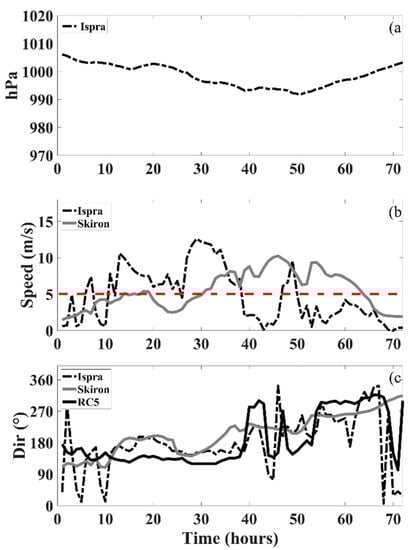
Figure 4.
Time series of HFr, ISPRA weather station observations and SKIRON/Eta model data during the storm event occurred during 6–8 February 2009. The panels show: (a) atmospheric pressure (hPA), (b) wind speed (m/s) and (c) wind direction (°).
Table 2.
Statistical skill metrics (RMSE, ϴ and ) of the comparisons between HFr, ISPRA weather station and SKIRON/Eta model related to the selected events: 6–8 February 2009, 3–6 March 2009 and 4–6 August 2009.
The second event, occurred in March 2009, was characterized by an atmospheric pressure minimum of 973 hPa (Figure 5a) and a wind speed of 16 m/s (Figure 5b). The wind direction acquired along the RC5 confirmed the consistency with in situ measurement (Figure 5c), with of 0.71 (ISPRA/HFr), direction difference of −15.16° and RMSE of 55.1°. A of 0.65, direction difference of −15.69° and an RMSE of 53.7° were found between HFr and SKIRON/Eta directions.
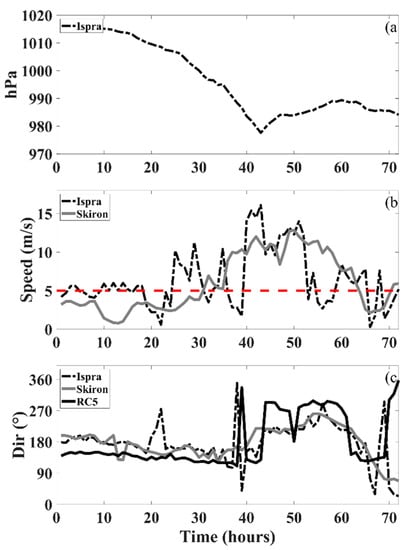
Figure 5.
Time series of ISPRA, HFr and SKIRON/Eta model data during the storm event occurred during 3–6 March 2009. The panels show: (a) atmospheric pressure (hPA), (b) wind speed (m/s) and (c) wind direction (°).
The event relative to 4–6 August 2009 (Figure 6), on the other hand, showed the typical conditions of the summer period: atmospheric pressure mean of 1014 hPa (Figure 6a) and maximum wind speed of 6 m/s (Figure 6b). In this context, the comparison results were statistically not significant (Figure 6c), with a general anticorrelation ( = −0.30 for HFr-ISPRA; = −0.47 for HFr-SKIRON/Eta), high direction difference values (94.17° and 33.72° for HFr-ISPRA and HFr-SKIRON/Eta, respectively), and high RMSE (99.8° for HFr-ISPRA and 88.5° for HFr_SKIRON/Eta) thus confirming the poor performance of the HFr under calm wind conditions.
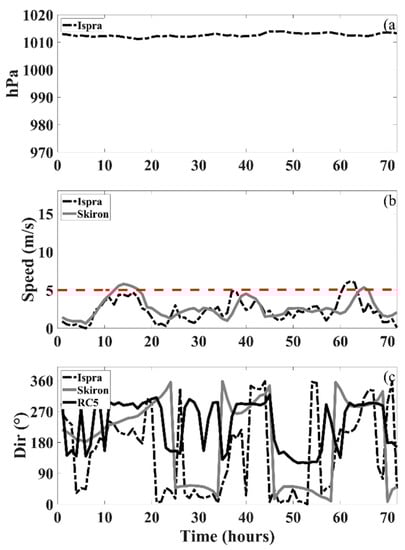
Figure 6.
Time series of ISPRA, HFr and SKIRON/Eta model data during the event occurred on 4–6 August 2009 with occasional gusts > 5 m/s. The panels show: (a) atmospheric pressure (hPA), (b) wind speed (m/s) and (c) wind direction (°).
Finally, in order to assess the difference of HFr wind direction accuracy along the 12 different RCs, we analyzed the evolution of and RMSE for each RC during the selected events (Figure 7 and Figure 8, respectively). The statistical results confirmed a reasonable agreement during winter events especially at intermediate distances, between 4 and 10 km from the coast (Figure 7a,b), with values of > 0.5 indicating a reasonable correlation between the measurements [61] and lower RMSE from the RC4 (Figure 8a,b), while near the coast and far off-shore the statistical results degraded. During the summer event 4–6 August 2009, was always anticorrelated regardless of the distance from the coast (Figure 7c), and the RMSE values were similar among the RCs (Figure 8c). In particular, for the intermediate RCs the value of inverse correlation was higher than −0.6, while RMSE was always > 80°. This result showed an inverse relationship between the two variables, with higher values of one dataset being correlated with lower values of the other.
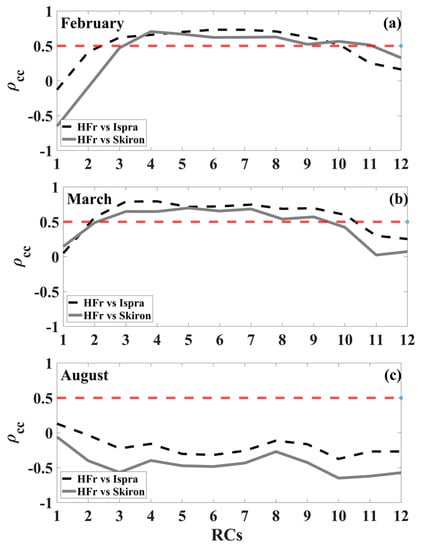
Figure 7.
relative to the comparison between HFr and ISPRA data (black dot-and-dashed line) and between HFr and SKIRON/Eta data (grey solid line) for the different RCs shown for the first winter event occurred during 6–8 February 2009 (a), the second winter event during 3–6 March 2009 (b) and the summer event 4–6 August 2009 (c). The red dashed lines correspond to ρcc equal to 0.5.
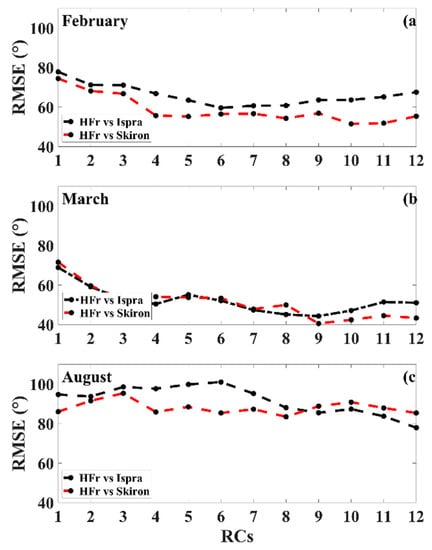
Figure 8.
RMSE relative to the comparison between HFr and ISPRA data (black dashed line) and between HFr and SKIRON/Eta data (red dashed line) for the different RCs shown for the first winter event occurred during 6–8 February 2009 (a), the second winter event during 3–6 March 2009 (b) and the summer event 4–6 August 2009 (c).
5. Discussion
HFrs are currently recognized as powerful monitoring systems due to their ability to provide simultaneous measurements of currents, waves and wind directions [63,64]. The skill of these systems to resolve the surface current and wave field is well proven [6,7,26,27,28,29,30,31,32,33,34], and this has been pivotal in the implementation of observation systems [2] and in operational applications [1,65]. However, the use of backscattered echoes to determine the direction of wind blowing over the sea surface is relatively underexplored for SeaSonde systems [20,21]. The present study investigated the performance of the HFr installed in the GoN in terms of wind direction retrieval by comparing radar measurements with in situ anemometer records and model outputs. The requirement of precise wind observations is particularly demanding in basins like the GoN, where coastlines are mostly surrounded by mountains that strongly affect the local wind circulation [41,42].
Previous studies on wind direction measurements using different HFr systems have shown the inaccuracy of inversion methods in conditions of low wind speed corresponding to calm sea surface conditions [20,21,22,23,24]. Based on such evidence and on preliminary comparisons, a wind speed threshold at 5 m/s was set for the comparisons. In the GoN, such a condition is often found in the winter months in association with the transit of low pressure systems affecting the study area. On the contrary in summer, when high pressures are predominant, at the synoptic scale, for long time periods (Azores and African anticyclones), the wind speed rarely exceeds 5 m/s. Another aspect that should not be underestimated is the duration of the meteorological event. In the summer, although some observations exceeded the 5 m/s threshold, the results in statistical terms do not return appreciable agreement between the measurements, as instead happens for winter events. This can be linked to the development of resonant waves: under strong wind conditions, the resonant waves (short and longer) are both fully developed, and wind direction measurements are more reliable [21]. However, under calm wind conditions, the short resonant waves are fully developed while the longer ones are not, affecting the accuracy of the wind direction measurement [20]. As such, other critical physical effects, such as wind duration and fetch, the assumption of direction homogeneity along the RCs, or the adjustment of wind measurement from 10 m a.m.s.l. to sea surface, should be included in the evaluation of the radar inversion performance.
Under these conditions, in our study two events were selected in the winter months and one in the summer period. All the events lasted 72 h but, owing to the typical climatology of the GoN, the wind speed exceeded the 5 m/s threshold for several hours only in winter episodes, while in the summer event the wind speed reached 6 m/s only in occasional gusts.
In winter, the comparison of wind directions measured by the radar along the RC5 was statistically more robust considering the in situ anemometer than the model (Table 2). This is likely due to the coarse resolution of the model. The wintertime RMSEs for wind direction recorded in the GoN are moreover in line with previous experiments carried out in the Ligurian Sea with a dataset yielding a similar percentage of wind measurements over 5 m/s, although in that case the system (a phased array) operated at a lower frequency (13 MHz) [21].
On the other hand, in the summer period the correlation between the HFr and the other platforms was completely lost, with an inverse correlation denoting two variables that change in opposite directions. This result was validated by all statistical skill parameters used in the study, indicating a failure of the inversion method to properly resolve the wind field when the atmospheric conditions were characterized by stable high pressures and low breeze. This result confirms the inappropriateness of HFr wind measurements with wind velocity lower than 5 m/s, as reported in the literature [6].
The accuracy of HFr wind measurements along all 12 RCs operational at the PORT site was also investigated. In all the events, the RCs near the coast and the offshore ones yielded lower statistical agreement compared to the central RCs. This is due to shallow water effect in the first case, and to weakening of the signal in the latter [53]. Further investigations on noise interference in the returned signal with the inversion method of wind direction are suggested, and possible coast-induced changes in the wind field.
The encouraging statistical results obtained during the winter season and the opposite result in the summer season for the GoN system confirms the first indications found in the literature on the overall performance expected in HFr wind comparison [19,21]. The limitations in wind retrieval in this study for SeaSonde HFr are comparable to those reported for WERA systems under similar atmospheric conditions [21]. In particular, for phased-array radars for which wind measurement has been subject of many validations and has been accepted as a reliable measurement, accurate wind directions are available when the first-order Bragg waves can be expected to be locally wind-driven [22]. Recent implementations of inversion techniques [13,14,15,16], including the use of neural networks [19,66,67], may improve the working capability of HFrs even in presence of calm conditions, enlarging the potential applications of these systems even in operational contexts.
6. Conclusions
An investigation of the accuracy of wind direction data retrieved by a SeaSonde HFr system was presented. A comparison with in situ measurements and data from meteorological model (SKIRON/Eta) has been employed: the approach used in the present paper is, to the best of the authors’ knowledge, the first one for a 25 MHz SeaSonde HFr in the Mediterranean area. The results confirm that the reliability of wind direction strictly depends on wind speed. In fact, the GoN wind field is strongly linked to seasonal patterns and most of the wind speed observations are, especially in the summer season, below the threshold of 5 m/s. As such, HFr wind direction measurements become robust only in presence of strongly energetic episodes (e.g., wintertime storms), whereas the performance of the system is poor under calm conditions (e.g., summertime breeze). Additionally, the investigation of the correlation along the RCs shows that the best performance was obtained between RC4 and RC9, confirming the potential of wind direction measurement with these systems over more than one range cell.
Author Contributions
Conceptualization, S.S.; Data curation, S.S., G.E. and R.D.L.; Funding acquisition, E.Z. and M.U.; Methodology, S.S., G.E., R.D.L. and P.d.R.; Project administration, M.U. and E.Z.; Software, S.S., G.E. and R.D.L.; Supervision, M.U. and E.Z.; Validation, S.S., G.E., R.D.L. and P.d.R.; Visualization, S.S. and G.E.; Writing—original draft, S.S.; Writing—review and editing, S.S., G.E., R.D.L., P.d.R., M.U., S.P., P.F., B.B., D.C. and E.Z. All authors have read and agreed to the published version of the manuscript.
Funding
This study was supported by the project PO FEAMP 2014/2020 (Misura 2.51) funded by Regione Campania, Italy. S. P. and E. Z. acknowledge partial support from the Parthenope University of Naples (D.R. 953/2016, Project DSTE315B and Individual Research Fund).
Institutional Review Board Statement
Not applicable.
Informed Consent Statement
Not applicable.
Data Availability Statement
The data presented in this study are openly available in the links provided in the text.
Acknowledgments
The Department of Science and Technology of the Parthenope University of Naples operates the HF radar system on behalf of the AMRA consortium (formerly CRdC AMRA), a regional competence center for the analysis and monitoring of environmental risks. Our radar remote sites are hosted by the ENEA Centre of Portici, the Villa Angelina Village of High Education and Professional Training and La Villanella resort in Massa Lubrense, and the Fincantieri shipyard in Castellammare di Stabia, whose hospitality is gratefully acknowledged. Mention of trade names or commercial products does not constitute endorsement or recommendation. Technical support by Giovanni Zambardino provided invaluable support to the proper functioning of the HF radar system. SKIRON/Eta modeling data was provided by G. Kallos of the National and Kapodistrian University of Athens. The authors thank the Editor and the two anonymous Reviewers for constructive feedback. This work was stimulated by discussions in the framework of the EuroGOOS HFR Task Team.
Conflicts of Interest
The authors declare no conflict of interest.
References
- Rubio, A.; Mader, J.; Corgnati, L.; Mantovani, C.; Griffa, A.; Novellino, A.; Quentin, C.; Wyatt, L.; Schulz-Stellenfleth, J.; Horstmann, J.; et al. HF radar activity in European coastal seas: Next steps toward a pan-European HF radar network. Front Mar. Sci. 2017, 4, 8. [Google Scholar] [CrossRef]
- Roarty, H.; Cook, T.; Hazard, L.; George, D.; Harlan, J.; Cosoli, S.; Wyatt, L.; Alvarez Fanjul, E.; Terrill, E.; Otero, M.; et al. The global high frequency radar network. Front. Mar. Sci. 2019, 6, 164. [Google Scholar] [CrossRef]
- Wyatt, L.R. Wave mapping with HF radar. In Proceedings of the 2011 IEEE/OES—Current, Waves and Turbulence Measurements (CWTM), Monterey, CA, USA, 20–23 March 2011; p. 2. [Google Scholar] [CrossRef]
- Lipa, B.; Nyden, B. Directional wave information from the SeaSonde. IEEE J. Ocean. Eng. 2005, 30, 221–231. [Google Scholar] [CrossRef]
- Gurgel, K.-W.; Antonischki, G.; Essen, H.-H.; Schlick, T. Wellen Radar WERA: A new ground-wave HF radar for ocean remote sensing. Coast. Eng. 1999, 37, 219–234. [Google Scholar] [CrossRef]
- Saviano, S.; Kalampokis, A.; Zambianchi, E.; Uttieri, M. A year-long assessment of wave measurements retrieved from an HF radar network in the Gulf of Naples (Tyrrhenian Sea, Western Mediterranean Sea). J. Oper. Oceanogr. 2019, 12, 1–15. [Google Scholar] [CrossRef]
- Orasi, A.; Picone, M.; Drago, A.; Capodici, F.; Gauci, A.; Nardone, G.; Inghilesi, R.; Azzopardi, J.; Galea, A.; Ciraolo, G.; et al. HF Radarfor Wind Waves Measurements in the Malta-Sicily Channel. Measurements 2018, 128, 446–454. [Google Scholar]
- Lorente, P.; Lin-Ye, J.; García-León, M.; Reyes, E.; Fernandes, M.; Sotillo, M.G.; Espino, M.; Ruiz, M.I.; Gracia, V.; Perez, S.; et al. On the performance of high frequency radar in the western Mediterranean: During the record-breaking storm Gloria. Front. Mar. Sci. 2021, 8, 645762. [Google Scholar] [CrossRef]
- Basañez, A.; Lorente, P.; Montero, P.; Álvarez-Fanjul, E.; Pérez-Muñuzuri, V. Quality assessment and practical interpretation of the wave parameters estimated by HF Radars in NW Spain. Remote. Sens. 2020, 12, 598. [Google Scholar] [CrossRef]
- Long, A.E.; Trizna, D.B. Measurements and Preliminary Interpretation of hf Radar Doppler Spectra from the Sea-Echo of an Atlantic Storm; Naval Research Laboratory: Washinghton, DC, USA, 1972; p. 7456. [Google Scholar]
- Zeng, Y.; Zhou, H.; Lai, Y.; Wen, B. Wind-direction mapping with a modified wind spreading function by broad-beam high-frequency radar. IEEE Geosci. Remote. Sens. Lett. 2018, 15, 679–683. [Google Scholar] [CrossRef]
- Gurgel, K.W.; Essen, H.H.; Schlick, T. An empirical method to derive ocean waves from second-order Bragg scattering: Prospects and limitations. IEEE J. Ocean. Eng. 2006, 31, 804–811. [Google Scholar] [CrossRef]
- Heron, M.L. Applying a unified directional wave spectrum to the remote sensing of wind wave directional spreading. Can. J. Remote. Sens. 2002, 28, 346–353. [Google Scholar] [CrossRef]
- Huang, W.; Gill, E.; Wu, S.; Wen, B.; Yang, Z.; Hou, J. Measuring surface wind direction by monostatic HF ground-wave radar at the eastern China sea. IEEE J. Ocean. Eng. 2004, 29, 1032–1037. [Google Scholar] [CrossRef]
- Chu, X.; Zhang, J.; Ji, Y.; Wang, Y.; Yang, L. Extraction of wind direction from the HF hybrid sky-surface wave radar sea echoes. IEEE Aerosp. Electron. Syst. Mag. 2018, 33, 42–47. [Google Scholar] [CrossRef]
- Shen, W.; Gurgel, K.W.; Voulgaris, G.; Schlick, T.; Stammer, D. Wind-speed inversion from HF radar first-order backscatter signal. Ocean Dyn. 2012, 62, 105–121. [Google Scholar] [CrossRef]
- Hisaki, Y. Sea surface wind correction using HF ocean radar and its impact on coastal wave prediction. J. Atmos. Ocean. Technol. 2017, 34, 2001–2020. [Google Scholar] [CrossRef]
- Kirincich, A. Remote sensing of the surface wind field over the coastal ocean via direct calibration of HF radar backscatter power. J. Atmospheric Ocean. Technol. 2016, 33, 1377–1392. [Google Scholar] [CrossRef]
- Zeng, Y.; Zhou, H.; Roarty, H.; Wen, B. Wind speed inversion in high frequency Radar based on neural network. Int. J. Antennas Propag. 2016, 2016, 1–8. [Google Scholar] [CrossRef]
- Lipa, B.; Barrick, D.; Alonso-Martirena, A.; Fernandes, M.; Ferrer, M.I.; Nyden, B. Brahan project high frequency radar ocean measurements: Currents, winds, waves and their interactions. Remote. Sens. 2014, 6, 12094–12117. [Google Scholar] [CrossRef]
- Shen, W.; Gurgel, K.-W. Wind direction inversion from narrow-beam HF Radar backscatter signals in low and high wind conditions at different radar frequencies. Remote. Sens. 2018, 10, 1480. [Google Scholar] [CrossRef]
- Wyatt, L.R.; Green, J.J.; Middleditch, A.; Moorhead, M.D.; Howarth, J.; Holt, M.; Keogh, S. Operational wave, current, and wind measurements with the Pisces HF Radar. IEEE J. Ocean. Eng. 2006, 31, 819–834. [Google Scholar] [CrossRef]
- Wyatt, L.R. A comparison of scatterometer and HF radar wind direction measurements. J. Oper. Oceanogr. 2018, 11, 54–63. [Google Scholar] [CrossRef]
- Heron, M.L.; Prytz, A. Wave height and wind direction from the HF coastal ocean surface radar. Can. J. Remote. Sens. 2002, 28, 385–393. [Google Scholar] [CrossRef]
- Long, A.; Trizna, D. Mapping of North Atlantic winds by HF radar sea backscatter interpretation. IEEE Trans. Antennas Propag. 1973, 21, 680–685. [Google Scholar] [CrossRef]
- Falco, P.; Buonocore, B.; Cianelli, D.; De Luca, L.; Giordano, A.; Iermano, I.; Kalampokis, A.; Saviano, S.; Uttieri, M.; Zambardino, G.; et al. Dynamics and sea state in the Gulf of Naples: Potential use of high-frequency radar data in an operational oceanographic context. J. Oper. Oceanogr. 2016, 9, S33–S45. [Google Scholar] [CrossRef]
- Cianelli, D.; Falco, P.; Iermano, I.; Mozzillo, P.; Uttieri, M.; Buonocore, B.; Zambardino, G.; Zambianchi, E. Inshore/o shore water exchange in the Gulf of Naples. J. Mar. Syst. 2015, 145, 37–52. [Google Scholar] [CrossRef]
- Uttieri, M.; Cianelli, D.; Nardelli, B.B.; Buonocore, B.; Falco, P.; Colella, S.; Zambianchi, E. Multiplatform observation of the surface circulation in the Gulf of Naples (Southern Tyrrhenian Sea). Ocean Dyn. 2011, 61, 779–796. [Google Scholar] [CrossRef]
- Cianelli, D.; D’Alelio, D.; Uttieri, M.; Sarno, D.; Zingone, A.; Zambianchi, E.; d’Alcalà, M.R. Disentangling physical and biological drivers of phytoplankton dynamics in a coastal system. Sci. Rep. 2017, 7, 15868. [Google Scholar] [CrossRef]
- Bagaglini, L.; Falco, P.; Zambianchi, E. Eddy detection in HF radar-derived surface currents in the Gulf of Naples. Remote. Sens. 2019, 12, 97. [Google Scholar] [CrossRef]
- Saviano, S.; Cianelli, D.; Zambianchi, E.; Conversano, F.; Uttieri, M. An integrated reconstruction of the multiannual wave pattern in the Gulf of Naples (South-Eastern Tyrrhenian Sea, Western Mediterranean Sea). J. Mar. Sci. Eng. 2020, 8, 372. [Google Scholar] [CrossRef]
- Saviano, S.; De Leo, F.; Besio, G.; Zambianchi, E.; Uttieri, M. HF Radar Measurements of Surface Waves in the Gulf of Naples (Southeastern Tyrrhenian Sea): Comparison With Hindcast Results at Different Scales. Front. Mar. Sci. 2020, 7. [Google Scholar] [CrossRef]
- de Leo, F.; Besio, G.; Saviano, S.; Zambianchi, E.; Uttieri, M. Evaluation of HF-radar wave measures in the Gulf of Naples. In Proceedings of the IMEKO TC19 InternationalWorkshop on Metrology for the Sea: Learning to Measure Sea Health Parameters (MetroSea 2019), Genova, Italy, 3–5 October 2019. [Google Scholar]
- Saviano, S.; Cianelli, D.; Zambianchi, E.; Conversano, F.; Uttieri, M. Multiple year characterization of the wave field in the Gulf of Naples by multi-platform measurements. In Proceedings of the IMEKO TC19 InternationalWorkshop on Metrology for the Sea: Learning to Measure Sea Health Parameters (MetroSea 2019), Genova, Italy, 3–5 October 2019. [Google Scholar]
- Zecchetto, S.; Cappa, C. The spatial structure of the Mediterranean Sea winds revealed by ERS-1 scatterometer. Int. J. Remote. Sens. 2001, 22, 45–70. [Google Scholar] [CrossRef]
- Lavagnini, A.; Sempreviva, A.M.; Transerici, C.; Accadia, C.; Casaioli, M.; Mariani, S.; Speranza, A. Offshore wind climatology over the Mediterranean basin. Wind. Energy 2006, 9, 251–266. [Google Scholar] [CrossRef]
- Mesinger, F. A method of construction of second order accuracy difference schemes permitting no false two-grid interval wave in the height field. Tellus 1973, 25, 444–458. [Google Scholar] [CrossRef]
- Schaeffer, A.; Garreau, P.; Molcard, A.; Fraunié, P.; Seity, Y. Influence of high resolution wind forcing on hydrodynamic modeling of the Gulf of Lions. Ocean Dyn. 2011, 61, 1823–1844. [Google Scholar] [CrossRef]
- Kara, A.B.; Wallcraft, A.J.; Huelbert, H.E. A correction for land contamination of atmospheric variables near land-sea boundaries. J. Phys. Oceanogr. 2007, 37, 803–818. [Google Scholar] [CrossRef]
- Amante, C.; Eakins, B.W. ETOPO1 1 Arc-Minute Global Relief Model: Procedures, Data Sources and Analysis; NOAA Technical Memorandum NESDIS NGDC-24; National Geophysical Data Center, NOAA: Boulder, CO, USA, 2009. [CrossRef]
- Menna, M.; Mercatini, A.; Uttieri, M.; Buonocore, B.; Zambianchi, E. Wintertime transport processes in the Gulf of Naples investigated by HF radar measurements of surface currents. Nuovo Cimento C 2007, 30, 605–622. [Google Scholar]
- Prati, M.V.; Costagliola, M.A.; Quaranta, F.; Murena, F. Assessment of ambient air quality in the port of Naples. J. Air Waste Manag. Assoc. 2015, 65, 970–979. [Google Scholar] [CrossRef] [PubMed]
- Montuori, A.; de Ruggiero, P.; Migliaccio, M.; Pierini, S.; Spezie, G. X-band COSMO- SkyMedc wind field retrieval, with application to coastal circulation modeling. Ocean Sci. 2013, 9, 121–132. [Google Scholar] [CrossRef]
- de Ruggiero, P. 2013: A high-resolution ocean circulation model of the Gulf of Naples and adjacent areas. Nuovo Cim. C 2013, 36, 143–150. [Google Scholar]
- Hatzaki, M.; Flocas, H.A.; Simmonds, I.; Kouroutzoglou, J.; Keay, K.; Rudeva, I. Seasonal aspects of an objective climatology of anticyclones affecting the Mediterranean. J. Clim. 2014, 27, 9272–9289. [Google Scholar] [CrossRef]
- de Ruggiero, P.; Esposito, G.; Napolitano, E.; Iacono, R.; Pierini, S.; Zambianchi, E. Modelling the marine circulation of the Campania coastal system (Tyrrhenian Sea) for the year 2016: Analysis of the dynamics. J. Mar. Syst. 2020, 210, 103388. [Google Scholar] [CrossRef]
- de Ruggiero, P.; Napolitano, E.; Iacono, R.; Pierini, S.; Spezie, G. A baroclinic coastal trapped wave event in the Gulf of Naples (Tyrrhenian Sea). Ocean Dyn. 2018, 68, 1683–1694. [Google Scholar] [CrossRef]
- Castagno, P.; De Ruggiero, P.; Pierini, S.; Zambianchi, E.; De Alteris, A.; De Stefano, M.; Budillon, G. Hydrographic and dynamical characterisation of the Bagnoli-Coroglio Bay (Gulf of Naples, Tyrrhenian Sea). Chem. Ecol. 2020, 36, 598–618. [Google Scholar] [CrossRef]
- De Maio, A.; Moretti, M.; Sansone, E.; Spezie, G.; Vultaggio, M. Outline of marine currents in the Bay of Naples and some considerations on pollutant transport. II Nuovo Cimento C 1985, 8, 955–969. [Google Scholar] [CrossRef]
- Cianelli, D.; Uttieri, M.; Buonocore, B.; Falco, P.; Zambardino, G.; Zambianchi, E. Dynamics of a Very Special Mediterranean Coastal Area: The Gulf of Naples, in Mediterranean Ecosystems: Dynamics, Management and Conservation; Williams, G., Ed.; Nova Science Publishers: New York, NY, USA, 2012; pp. 129–150. [Google Scholar]
- Lipa, B.; Daugharty, M.; Fernandes, M.; Barrick, D.; Alonso-Martinera, A.; Roarty, H.; Whelan, C. Developments in compact HF-radar ocean wave measurement. Adv. Sens. Rev. 2018, 5, 469–495. [Google Scholar]
- Laws, K.; Paduan, J.D.; Vesecky, J. Estimation and assessment of errors related to antenna pattern distortion in CODAR SeaSonde high-frequency radar ocean current measurements. J. Atmospheric Ocean. Technol. 2010, 27, 1029–1043. [Google Scholar] [CrossRef]
- Lipa, B.; Nyden, B.; Barrick, D.; Kohut, J. HF radar sea-echo from shallow water. Sensors 2008, 8, 4611–4635. [Google Scholar] [CrossRef]
- Mesinger, F. Forward–backward scheme and its use in a limited area model. Contrib. Atmos. Phys. 1977, 50, 200–210. [Google Scholar]
- Janjic, Z.I. A stable centered difference scheme free of the two-grid-interval noise. Mon. Wea. Rev. 1974, 102, 319–323. [Google Scholar] [CrossRef]
- Janjic, Z.I. Forward–backward scheme modified to prevent two-grid-interval noise and its application in sigma coordinate models. Contrib. Atmos. Phys. 1979, 52, 69–84. [Google Scholar]
- Papadopoulos, A.; Katsafados, P.; Kallos, G. Regional weather forecasting for marine application. GAOS 2002, 8, 219–237. [Google Scholar]
- De Ruggiero, P.; Napolitano, E.; Iacono, R.; Pierini, S. A high-resolution modelling study of the circulation along the Campania coastal system, with a special focus on the Gulf of Naples. Cont. Shelf Res. 2016, 122, 85–101. [Google Scholar] [CrossRef]
- Ranalli, M.; Lagona, F.; Picone, M.; Zambianchi, E. Segmentation of sea current fields by cylindrical hidden Markov models: A composite likelihood approach. J. R. Stat. Soc. Ser. C Appl. Stat. 2017, 67, 575–598. [Google Scholar] [CrossRef]
- Bowers, J.; Morton, I.; Mould, G. Directional statistics of the wind and waves. Appl. Ocean Res. 2000, 22, 13–30. [Google Scholar] [CrossRef]
- Fisher, N.I.; Lee, A.J. A correlation-coefficient for circular data. Biometrika 1983, 70, 327–332. [Google Scholar] [CrossRef]
- Berens, P. CircStat: A Matlab Toolbox for Circular Statistics. J. Stat. Softw. 2009, 31. Available online: http://www.jstatsoft.org/v31/i10 (accessed on 23 November 2017). [CrossRef]
- Ludeno, G.; Uttieri, M. Editorial for Special Issue “Radar technology for coastal areas and open sea monitoring”. J. Mar. Sci. Eng. 2020, 8, 560. [Google Scholar] [CrossRef]
- Paduan, J.D.; Washburn, L. High-Frequency radar observations of ocean surface currents. Annu. Rev. Mar. Sci. 2013, 5, 115–136. [Google Scholar] [CrossRef]
- Iermano, I.; Moore, A.; Zambianchi, E. Impacts of a 4-dimensional variational data assimilation in a coastal ocean model of southern Tyrrhenian Sea. J. Mar. Syst. 2016, 154, 157–171. [Google Scholar] [CrossRef]
- Hardman, R.L.; Wyatt, L.R. Inversion of HF radar Doppler spectra using a neural network. J. Mar. Sci. Eng. 2019, 7, 255. [Google Scholar] [CrossRef]
- Mathew, T.E.; Deo, M.C. Inverse estimation of wind from the waves measured by high-frequency radar. Int. J. Remote. Sens. 2011, 33, 2985–3003. [Google Scholar] [CrossRef]
Publisher’s Note: MDPI stays neutral with regard to jurisdictional claims in published maps and institutional affiliations. |
© 2021 by the authors. Licensee MDPI, Basel, Switzerland. This article is an open access article distributed under the terms and conditions of the Creative Commons Attribution (CC BY) license (https://creativecommons.org/licenses/by/4.0/).