Analysis of Vegetative Cover Vulnerability in Rohingya Refugee Camps of Bangladesh Utilizing Landsat and Per Capita Greening Area (PCGA) Datasets
Abstract
1. Introduction
2. Related Work
3. Materials and Methods
3.1. Study Area
3.2. Data Collection and Satellite Image Processing
3.3. Image Classification
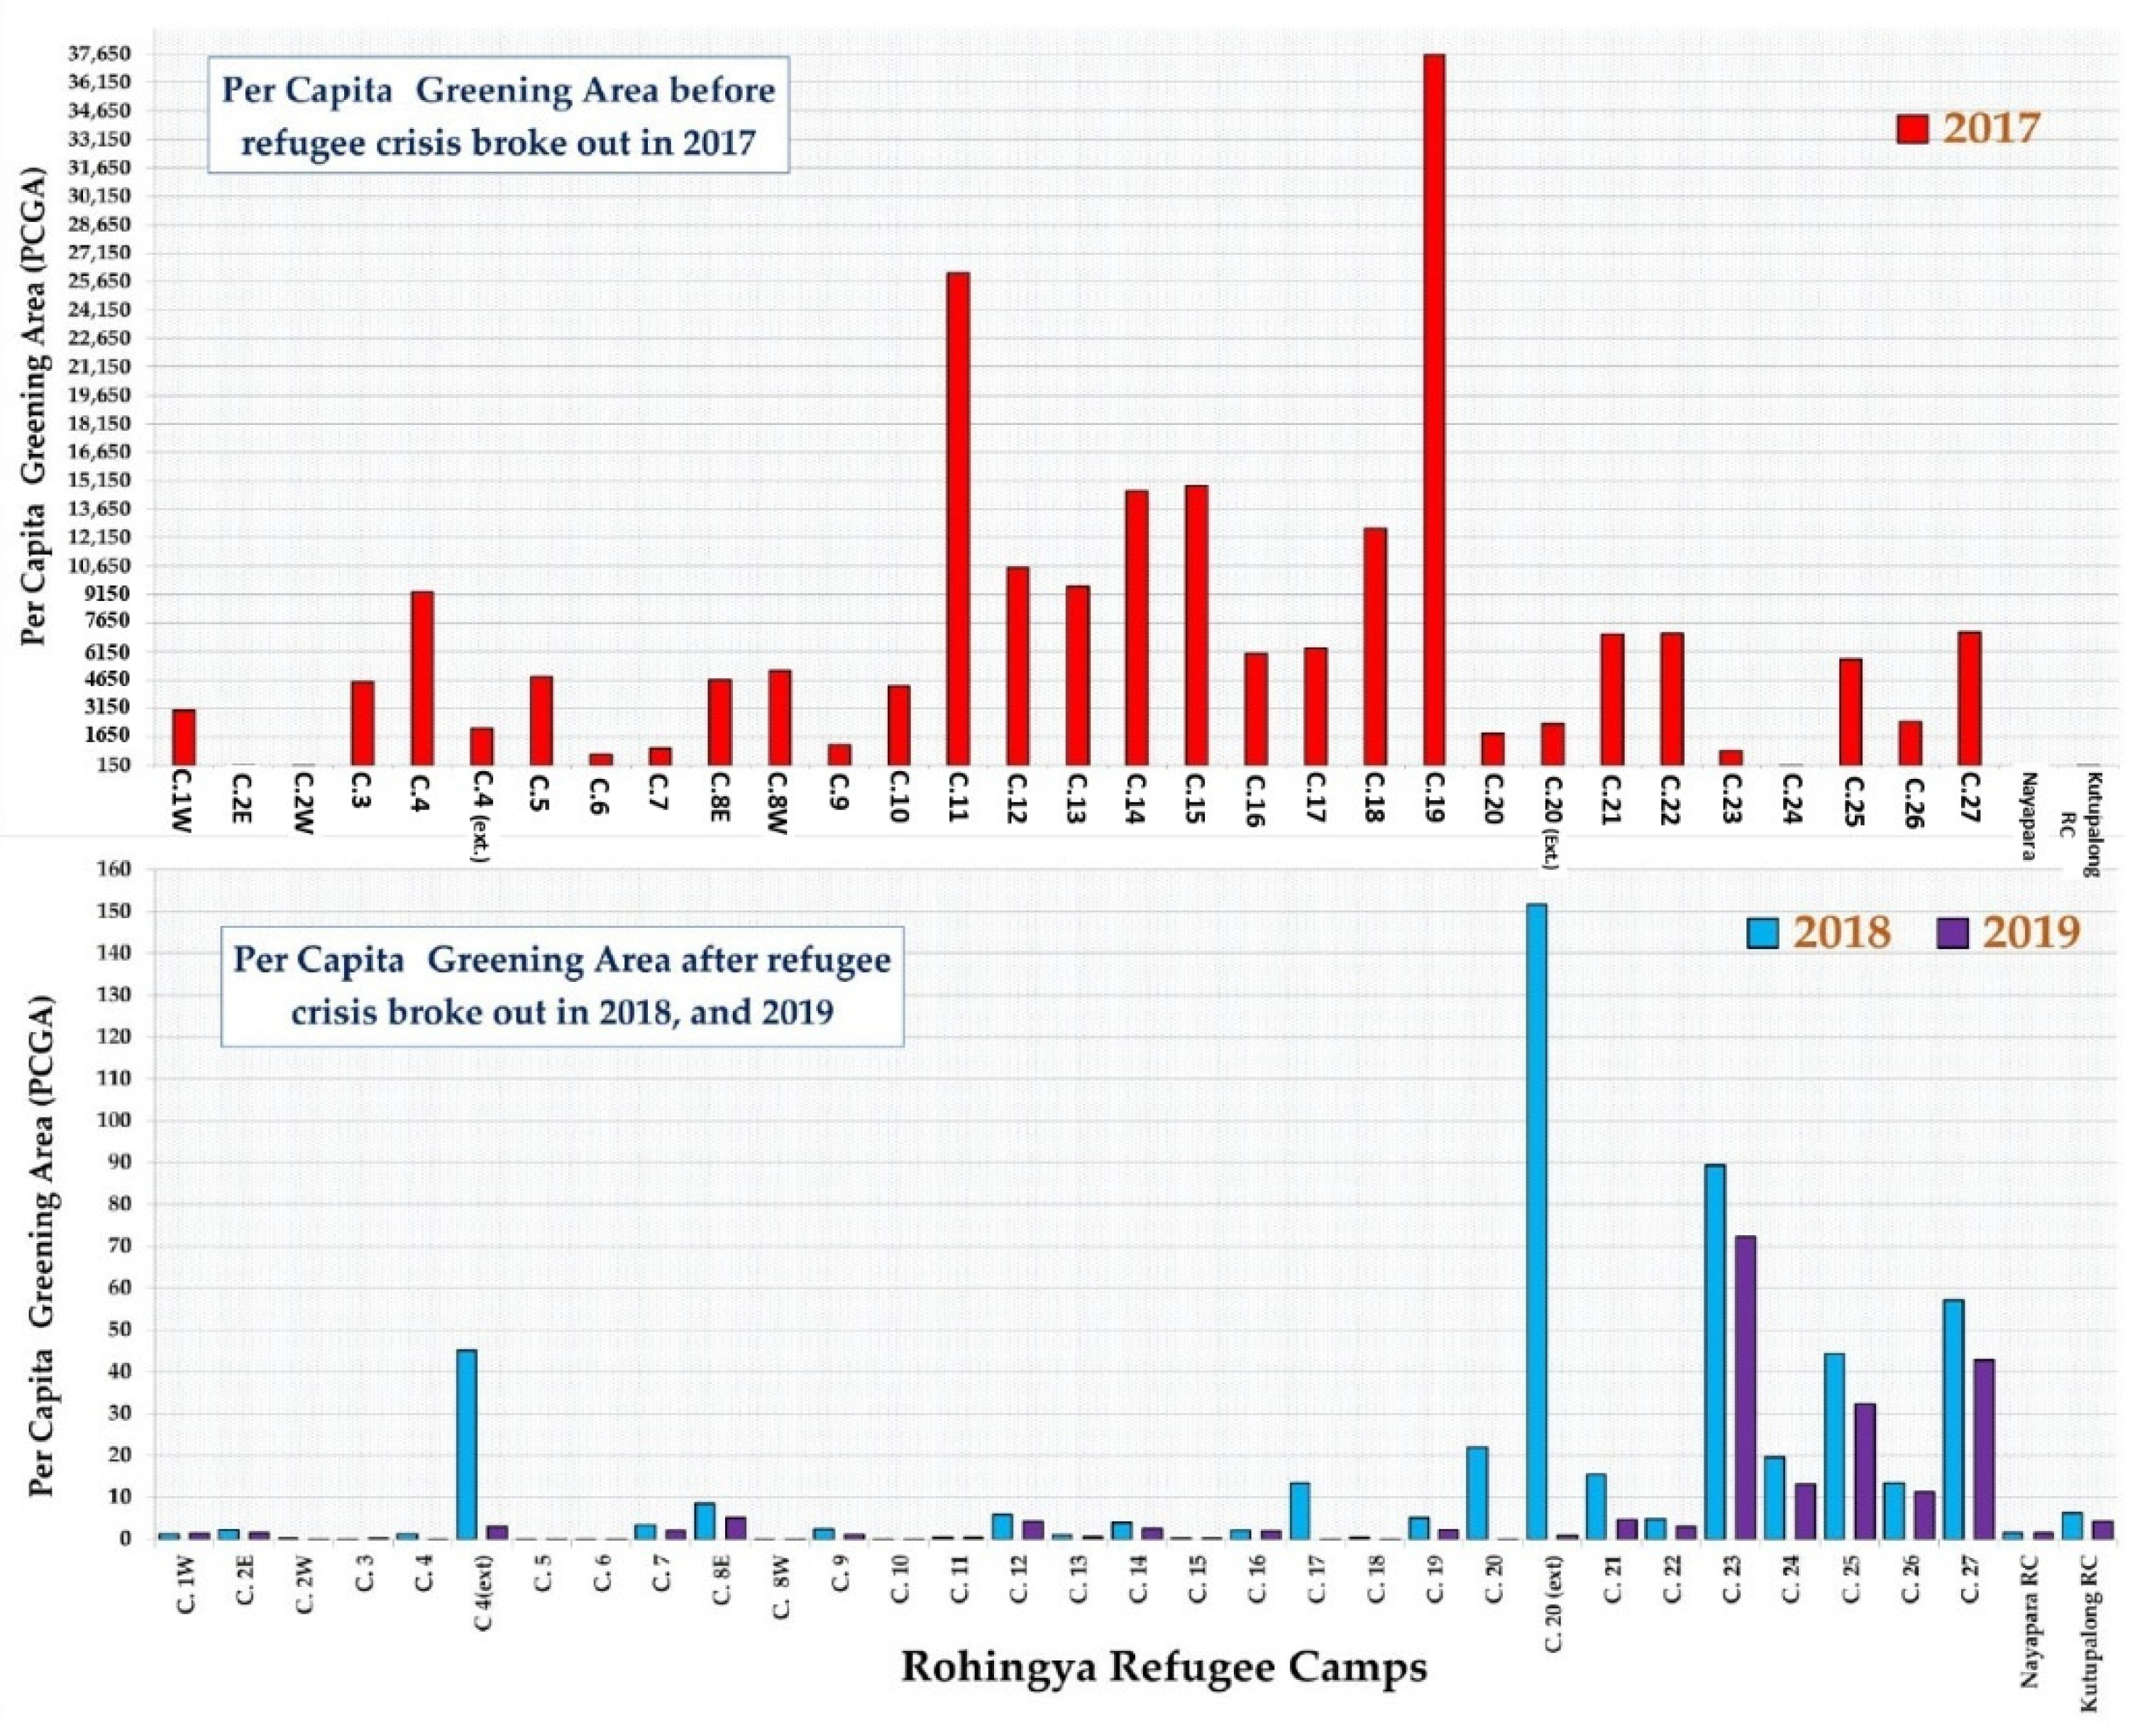
3.4. Per Capital Greening Area (PCGA)
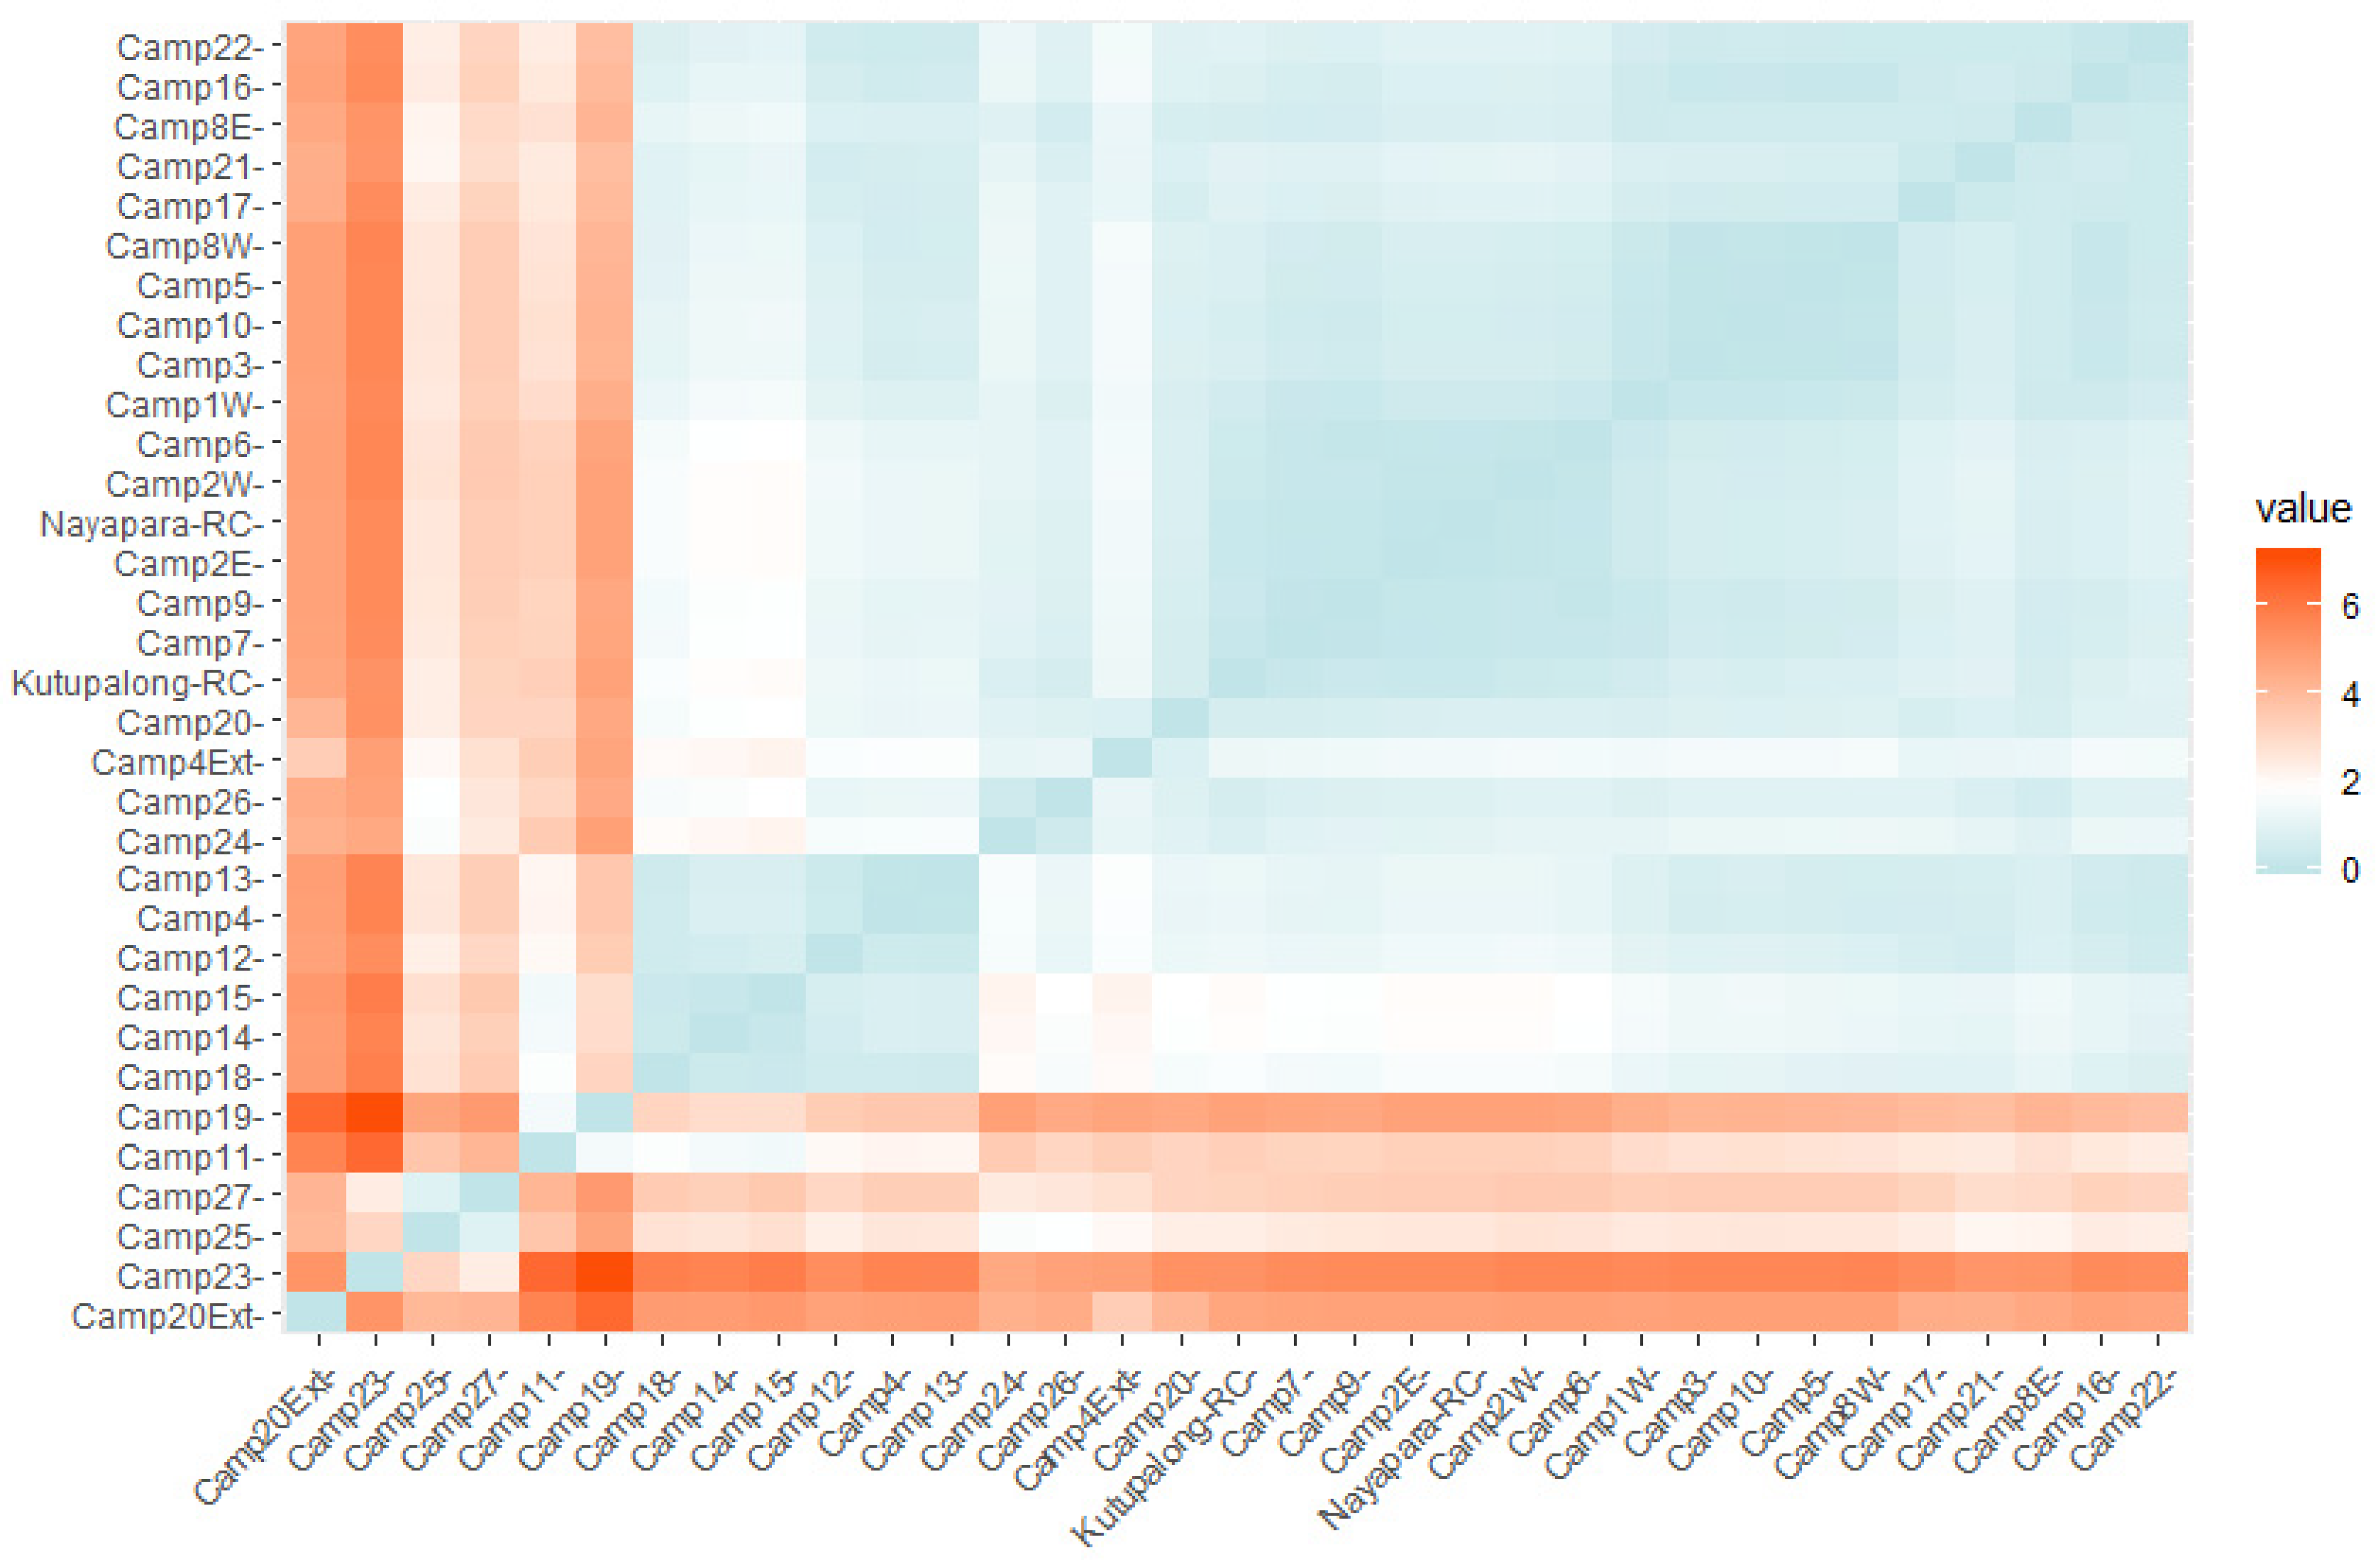
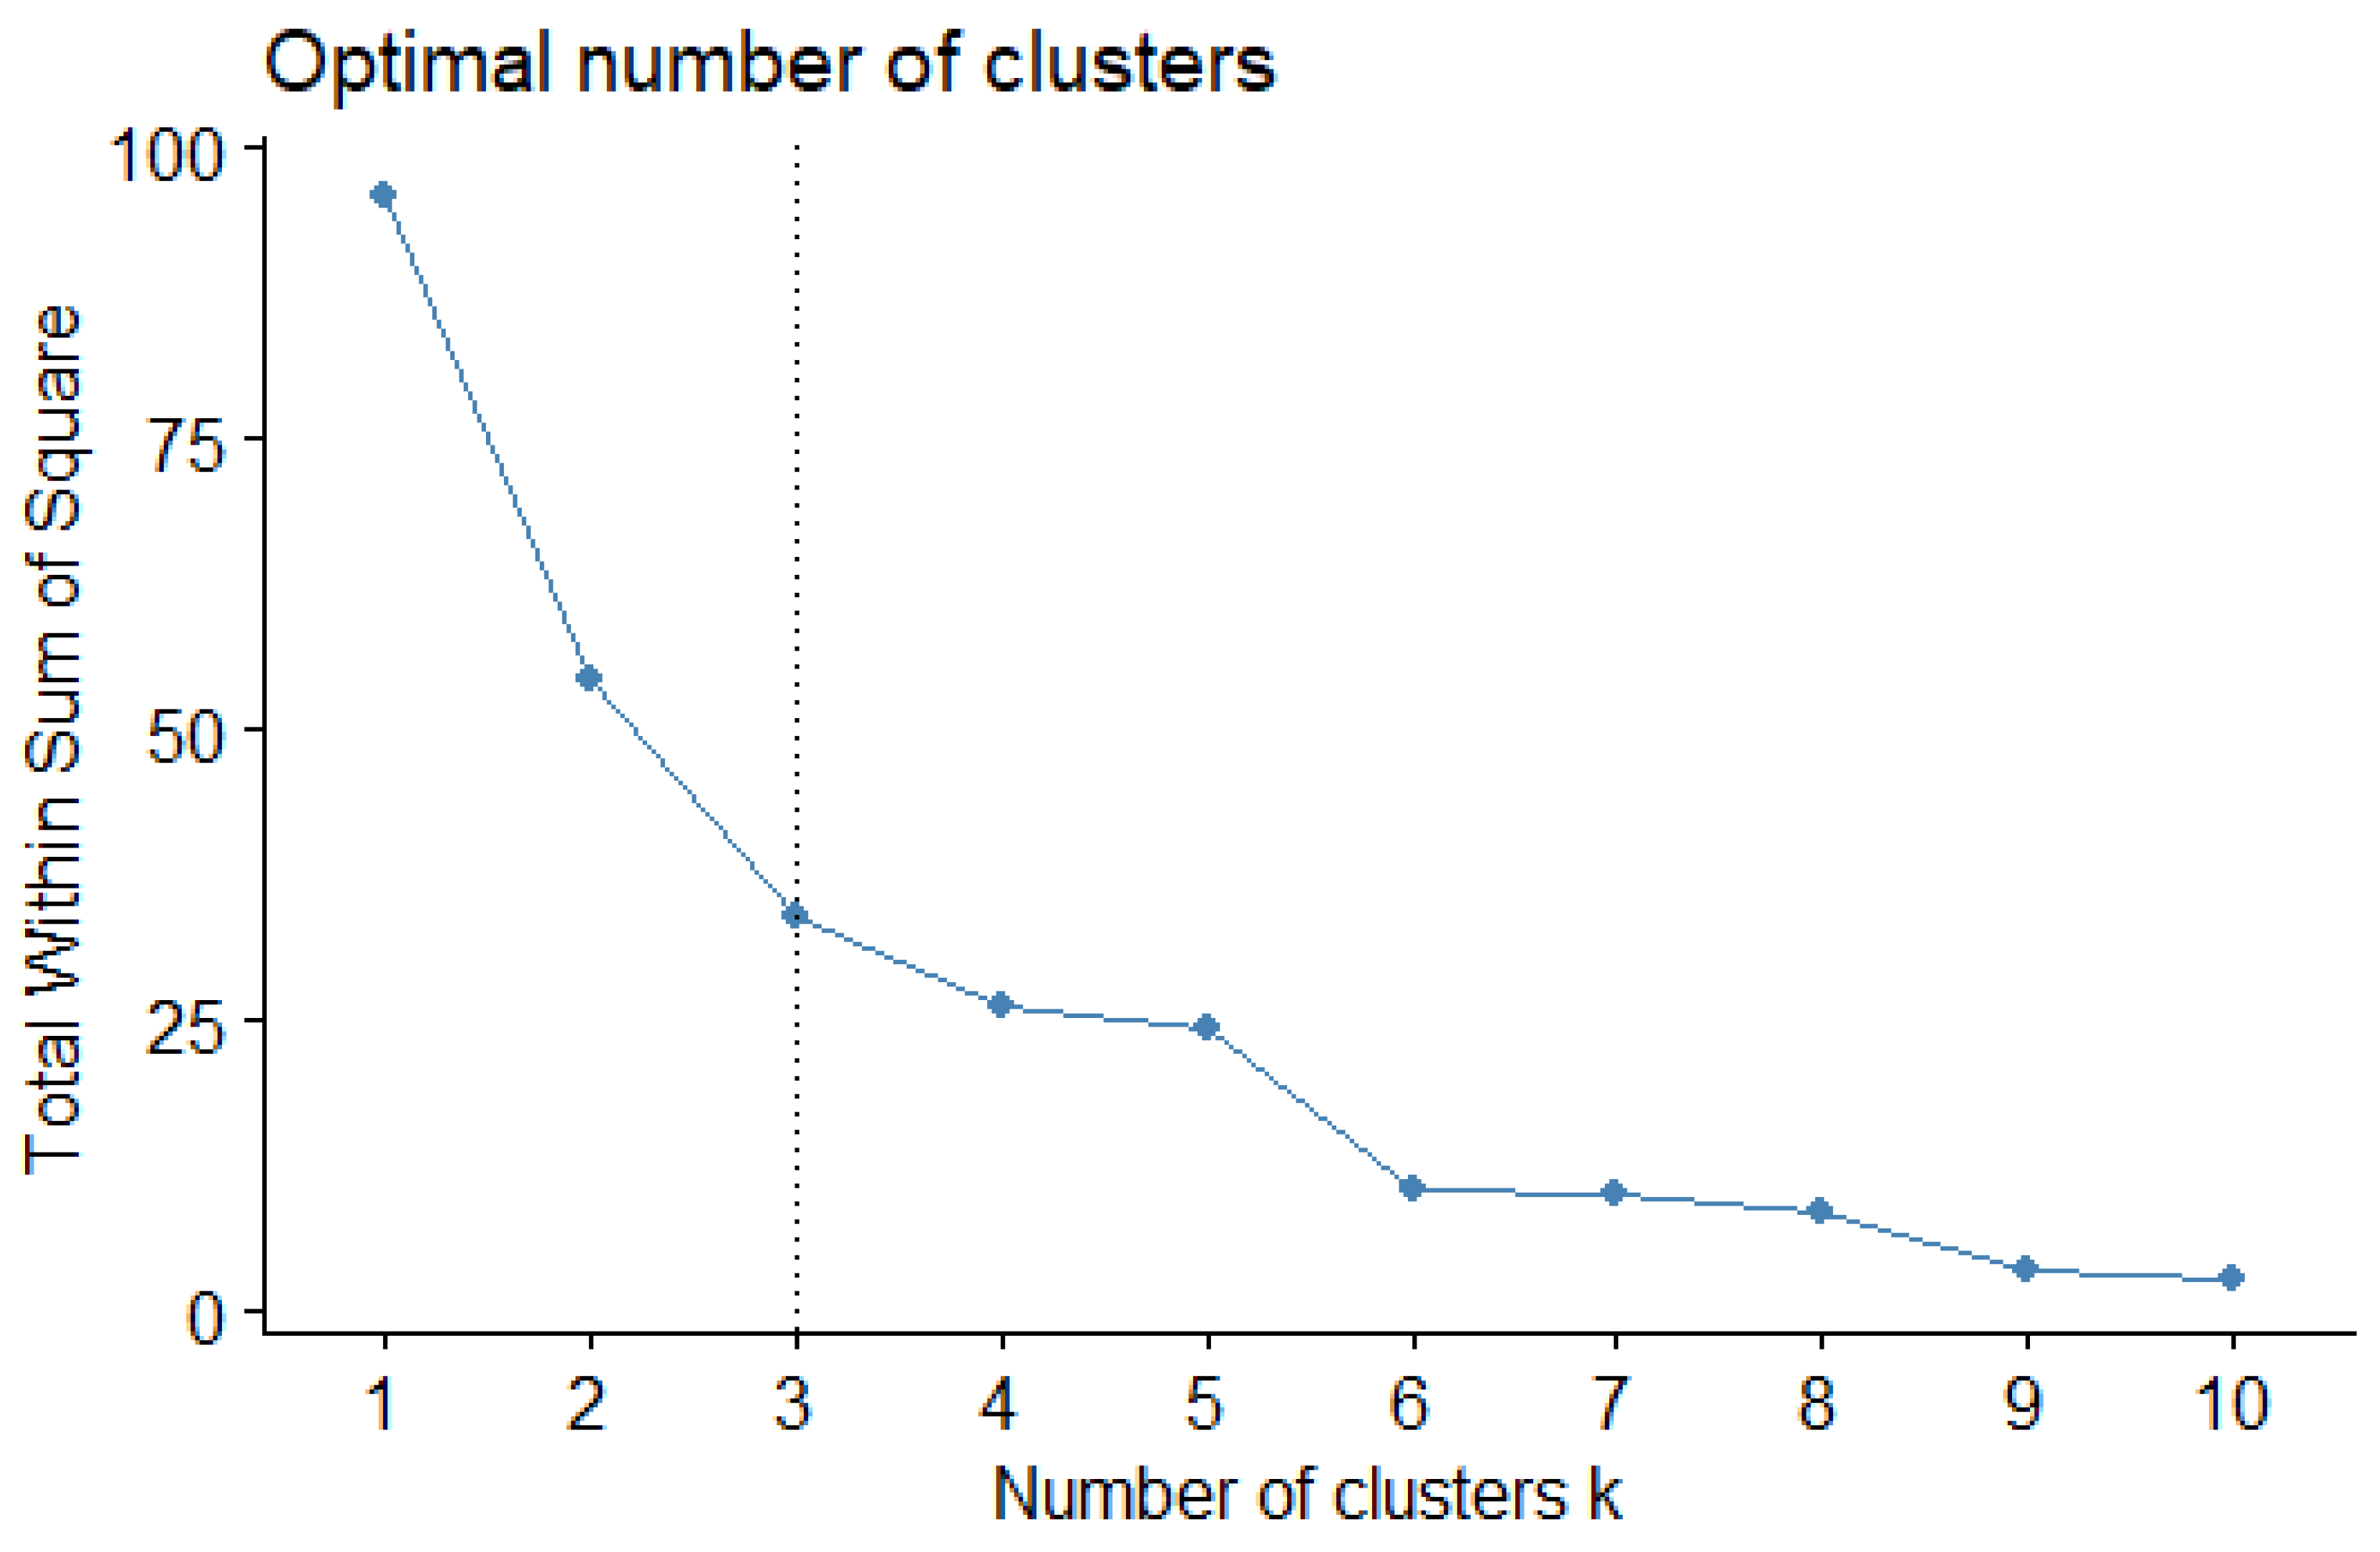
3.5. Vegetative Vulnerable Refugee Camp Identification Based on PCGA Dataset Using K-Means Classification
4. Results
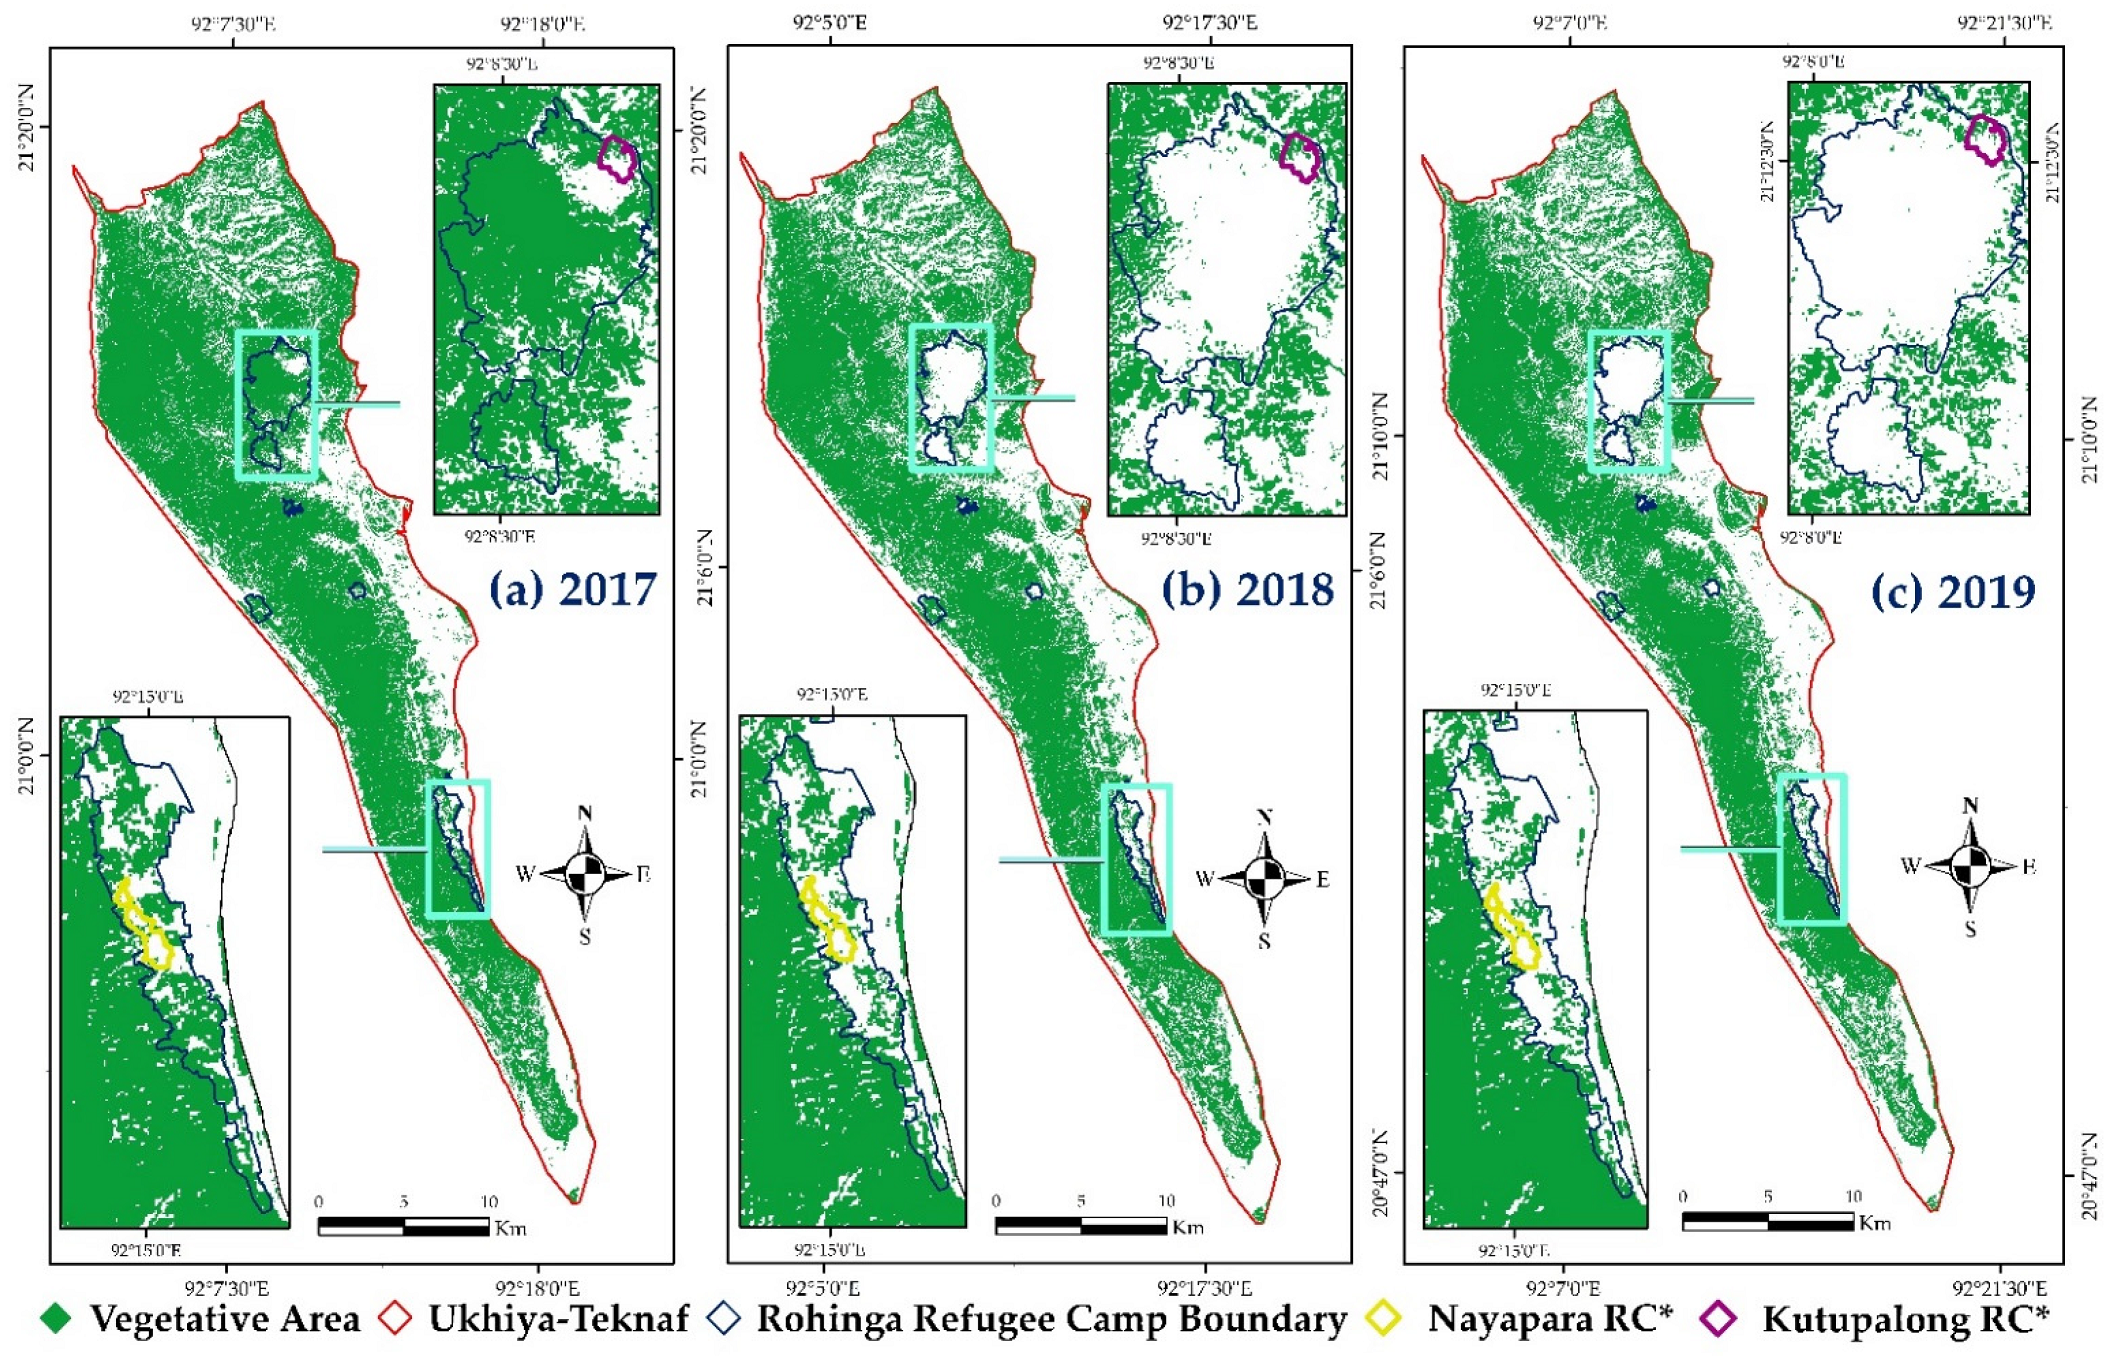
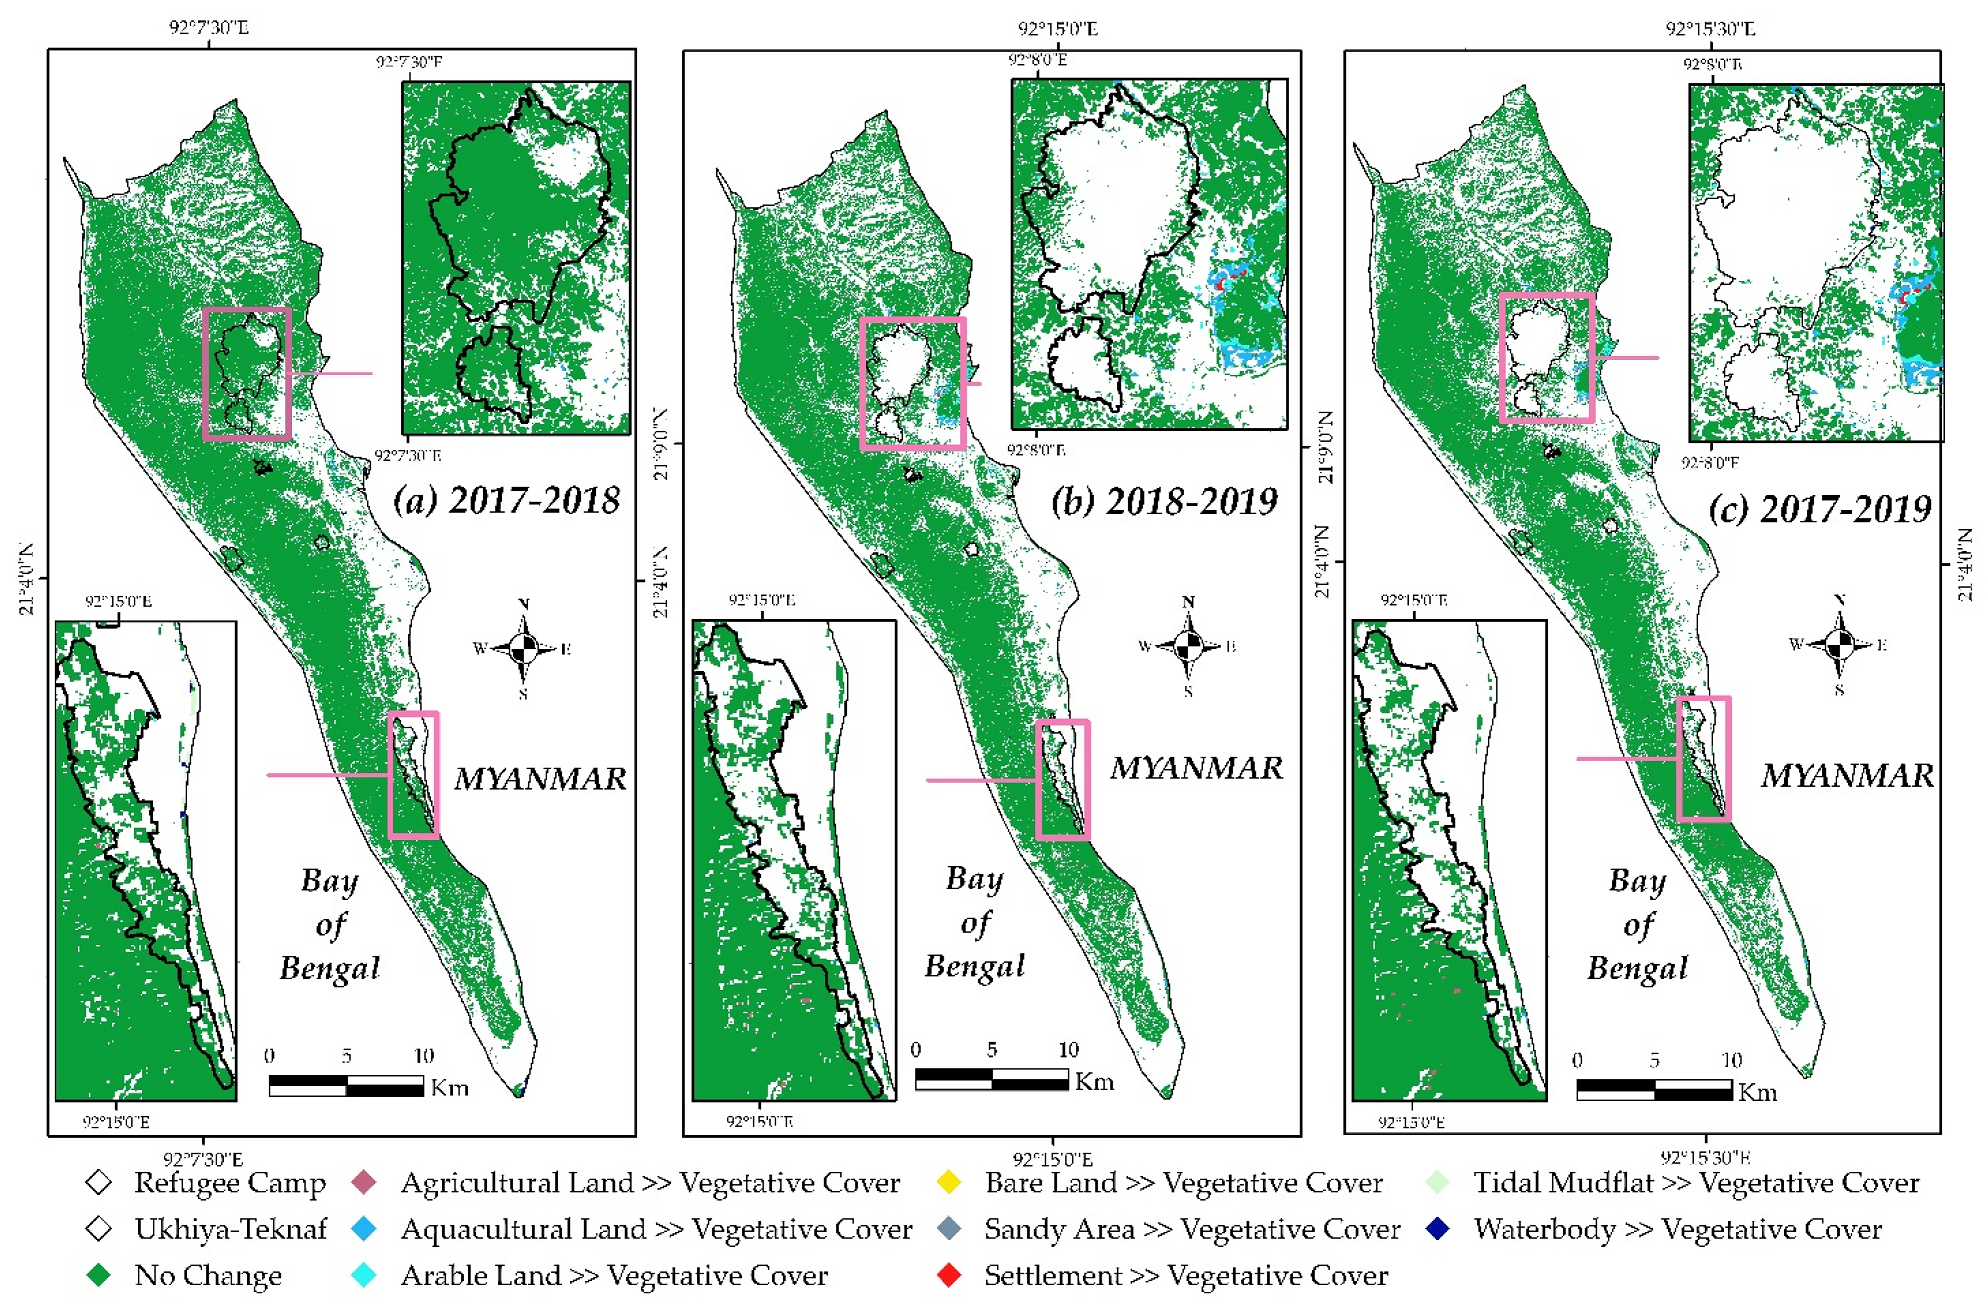
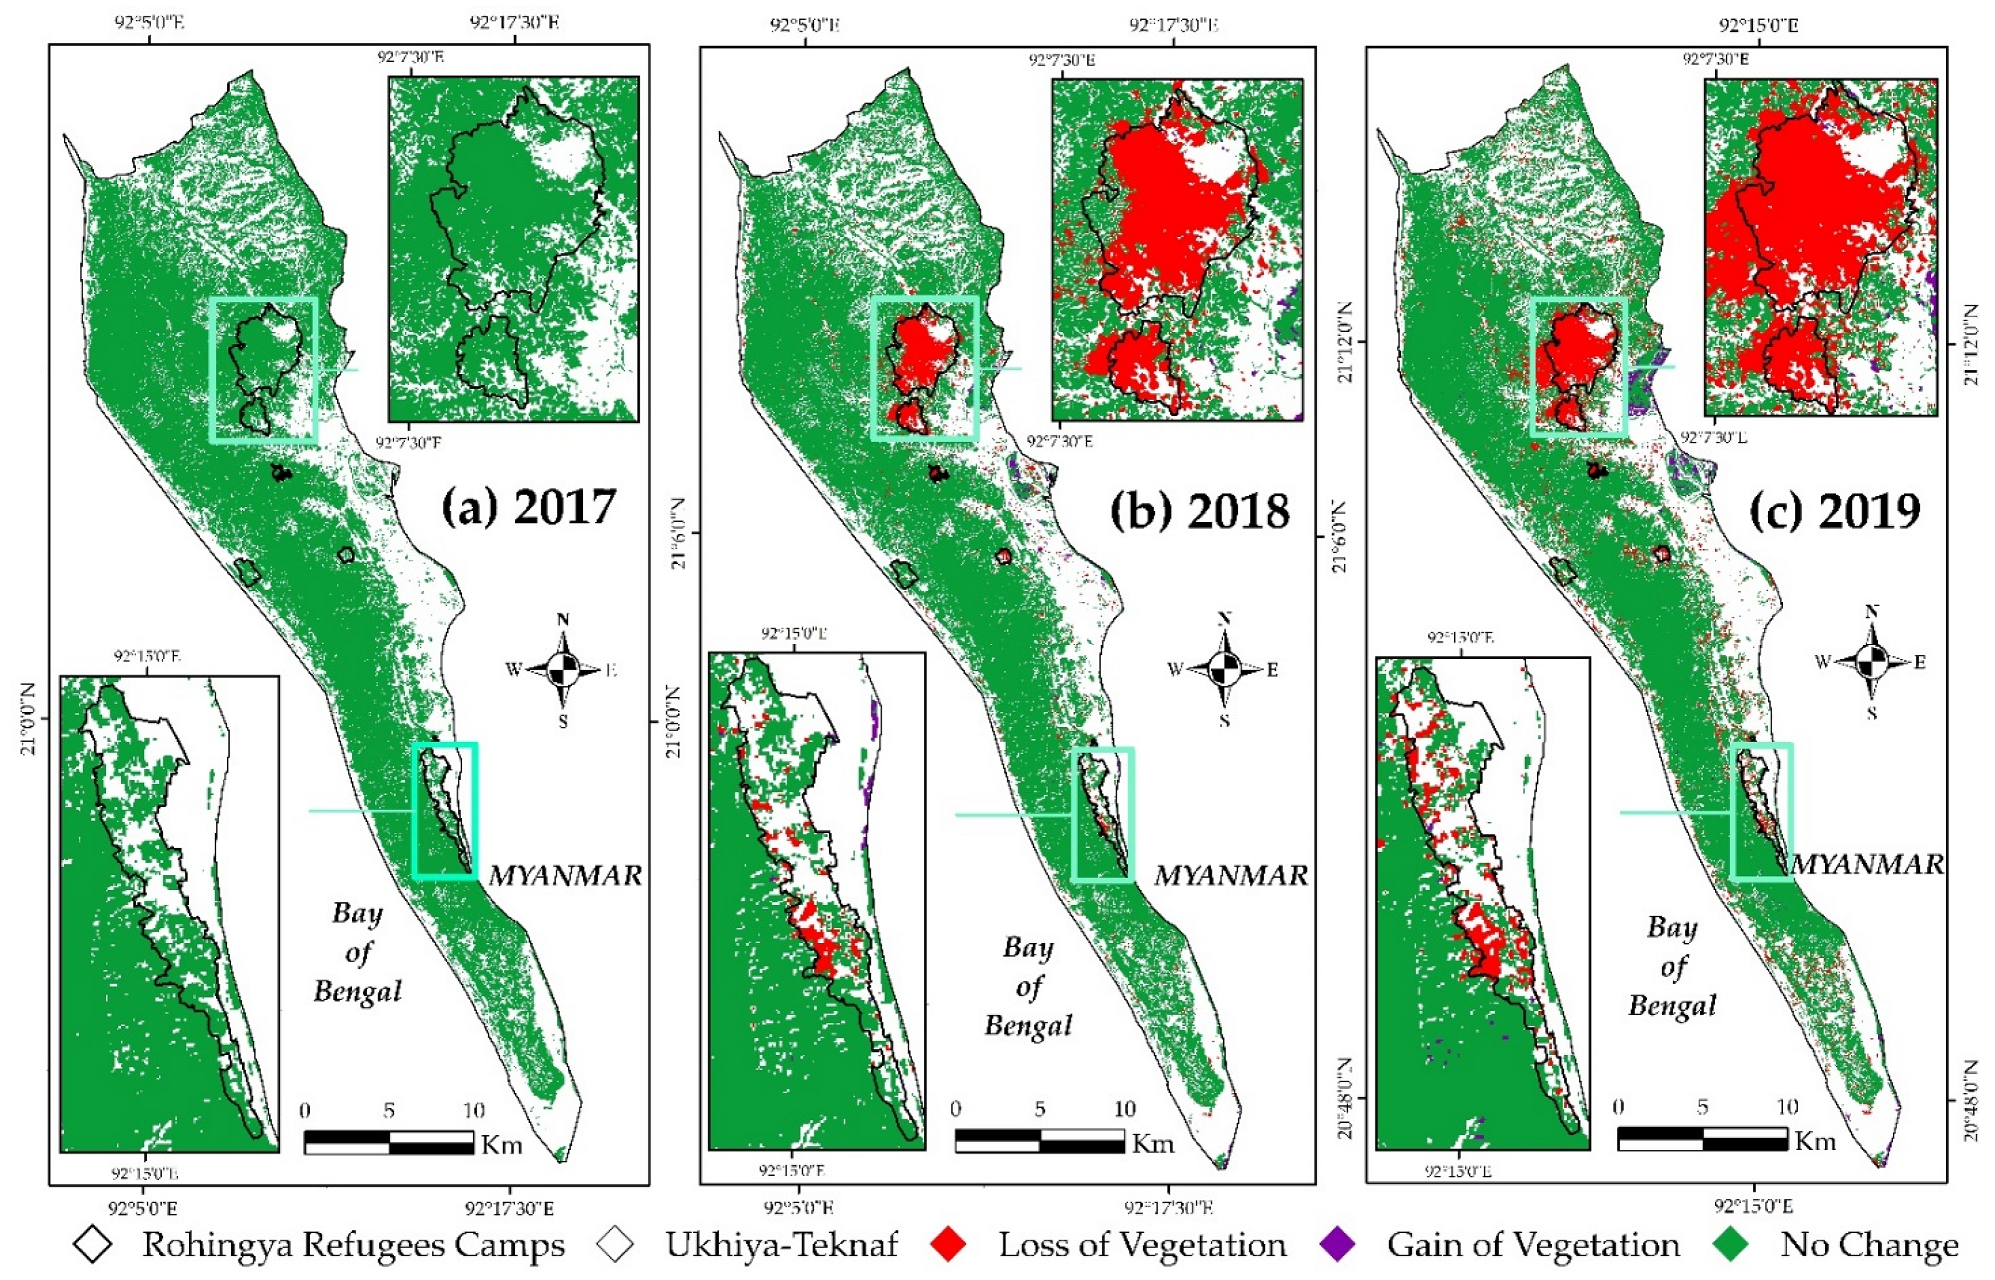
4.1. Rapid Declining of Vegetative Cover and Increased Settlement and Bare Land in Ukhiya-Teknaf, the Situation of Pre and Post Rohingya Refugee Crisis, 2017–2019
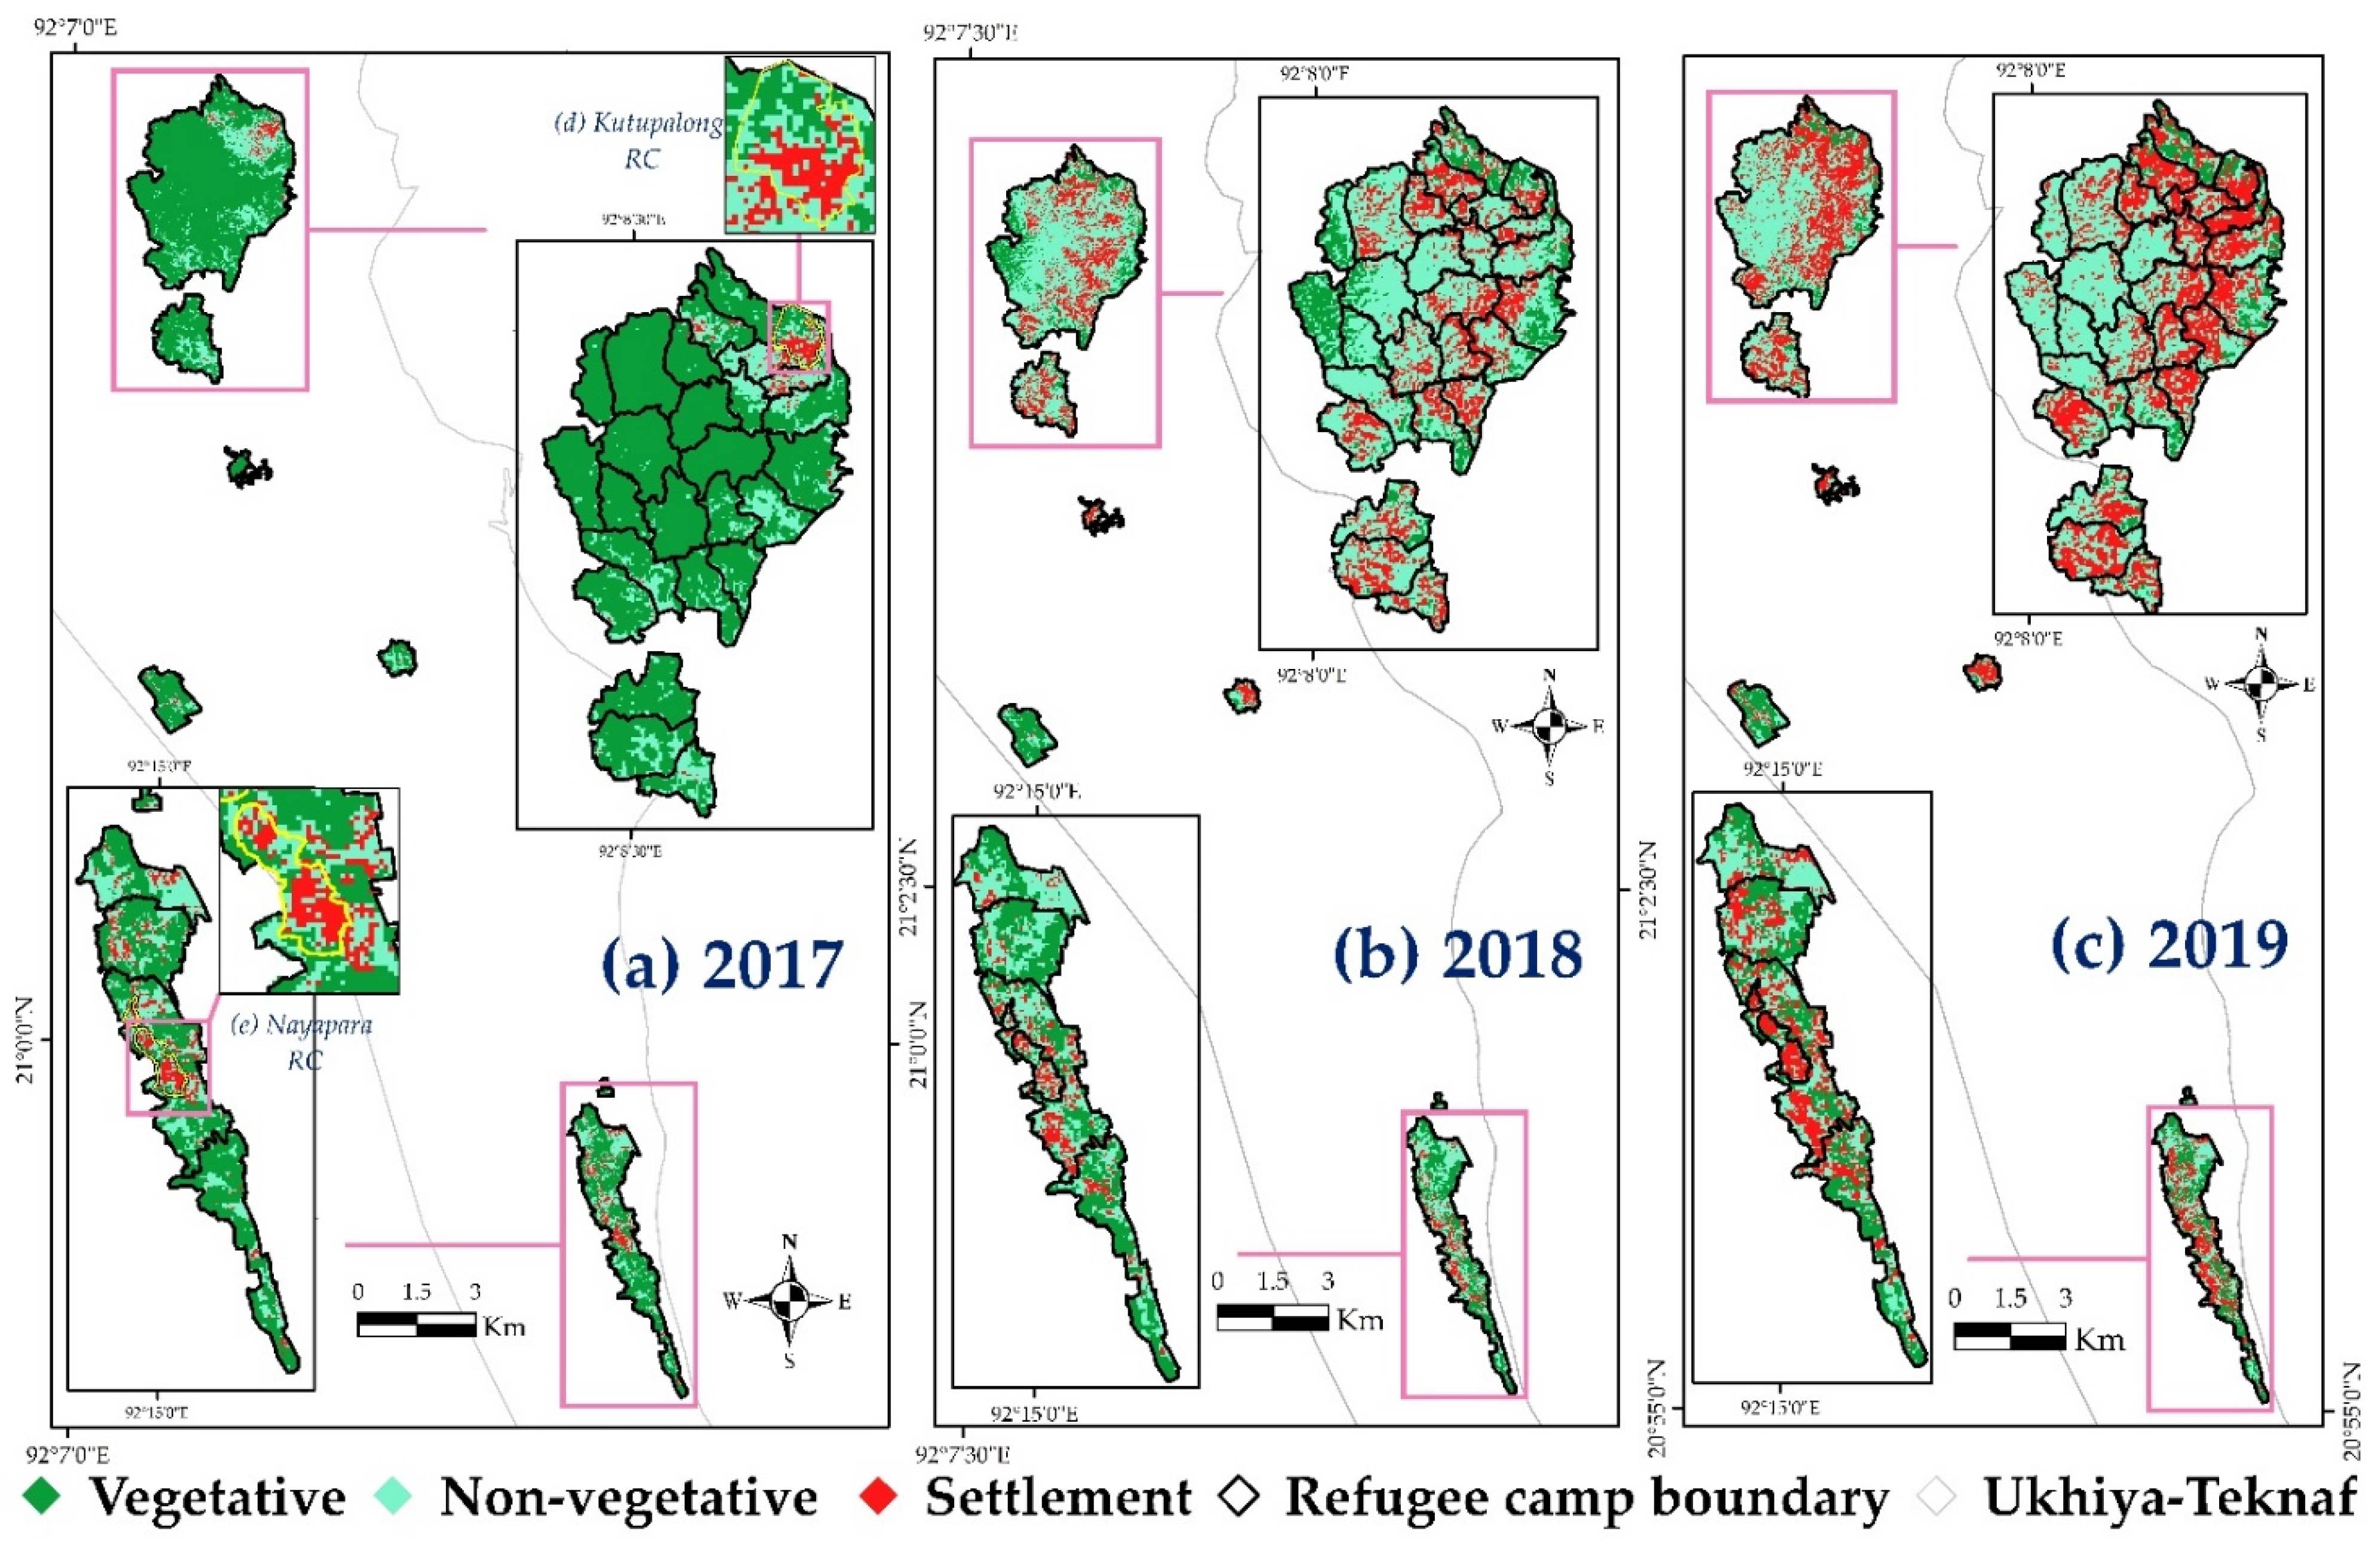
4.2. Expansion of Rohingya Refugee Settlement and Decline of Vegetative Cover among All Thirty-Four Refugee Camp Areas, the Situation of Pre and Post Rohingya Refugee Crisis, 2017–2019
4.3. Vegetative Cover Vulnerable Rohingya Refugee Camp Identification Using K-Means Classification
5. Discussion
5.1. Land with Vegetative Cover Is the Primary Source of the Newly Increased Settlement and Bare Areas
5.2. Nearly 82% of Rohingya Refugee Camps Land with Vegetative Covers Are Highly Vulnerable
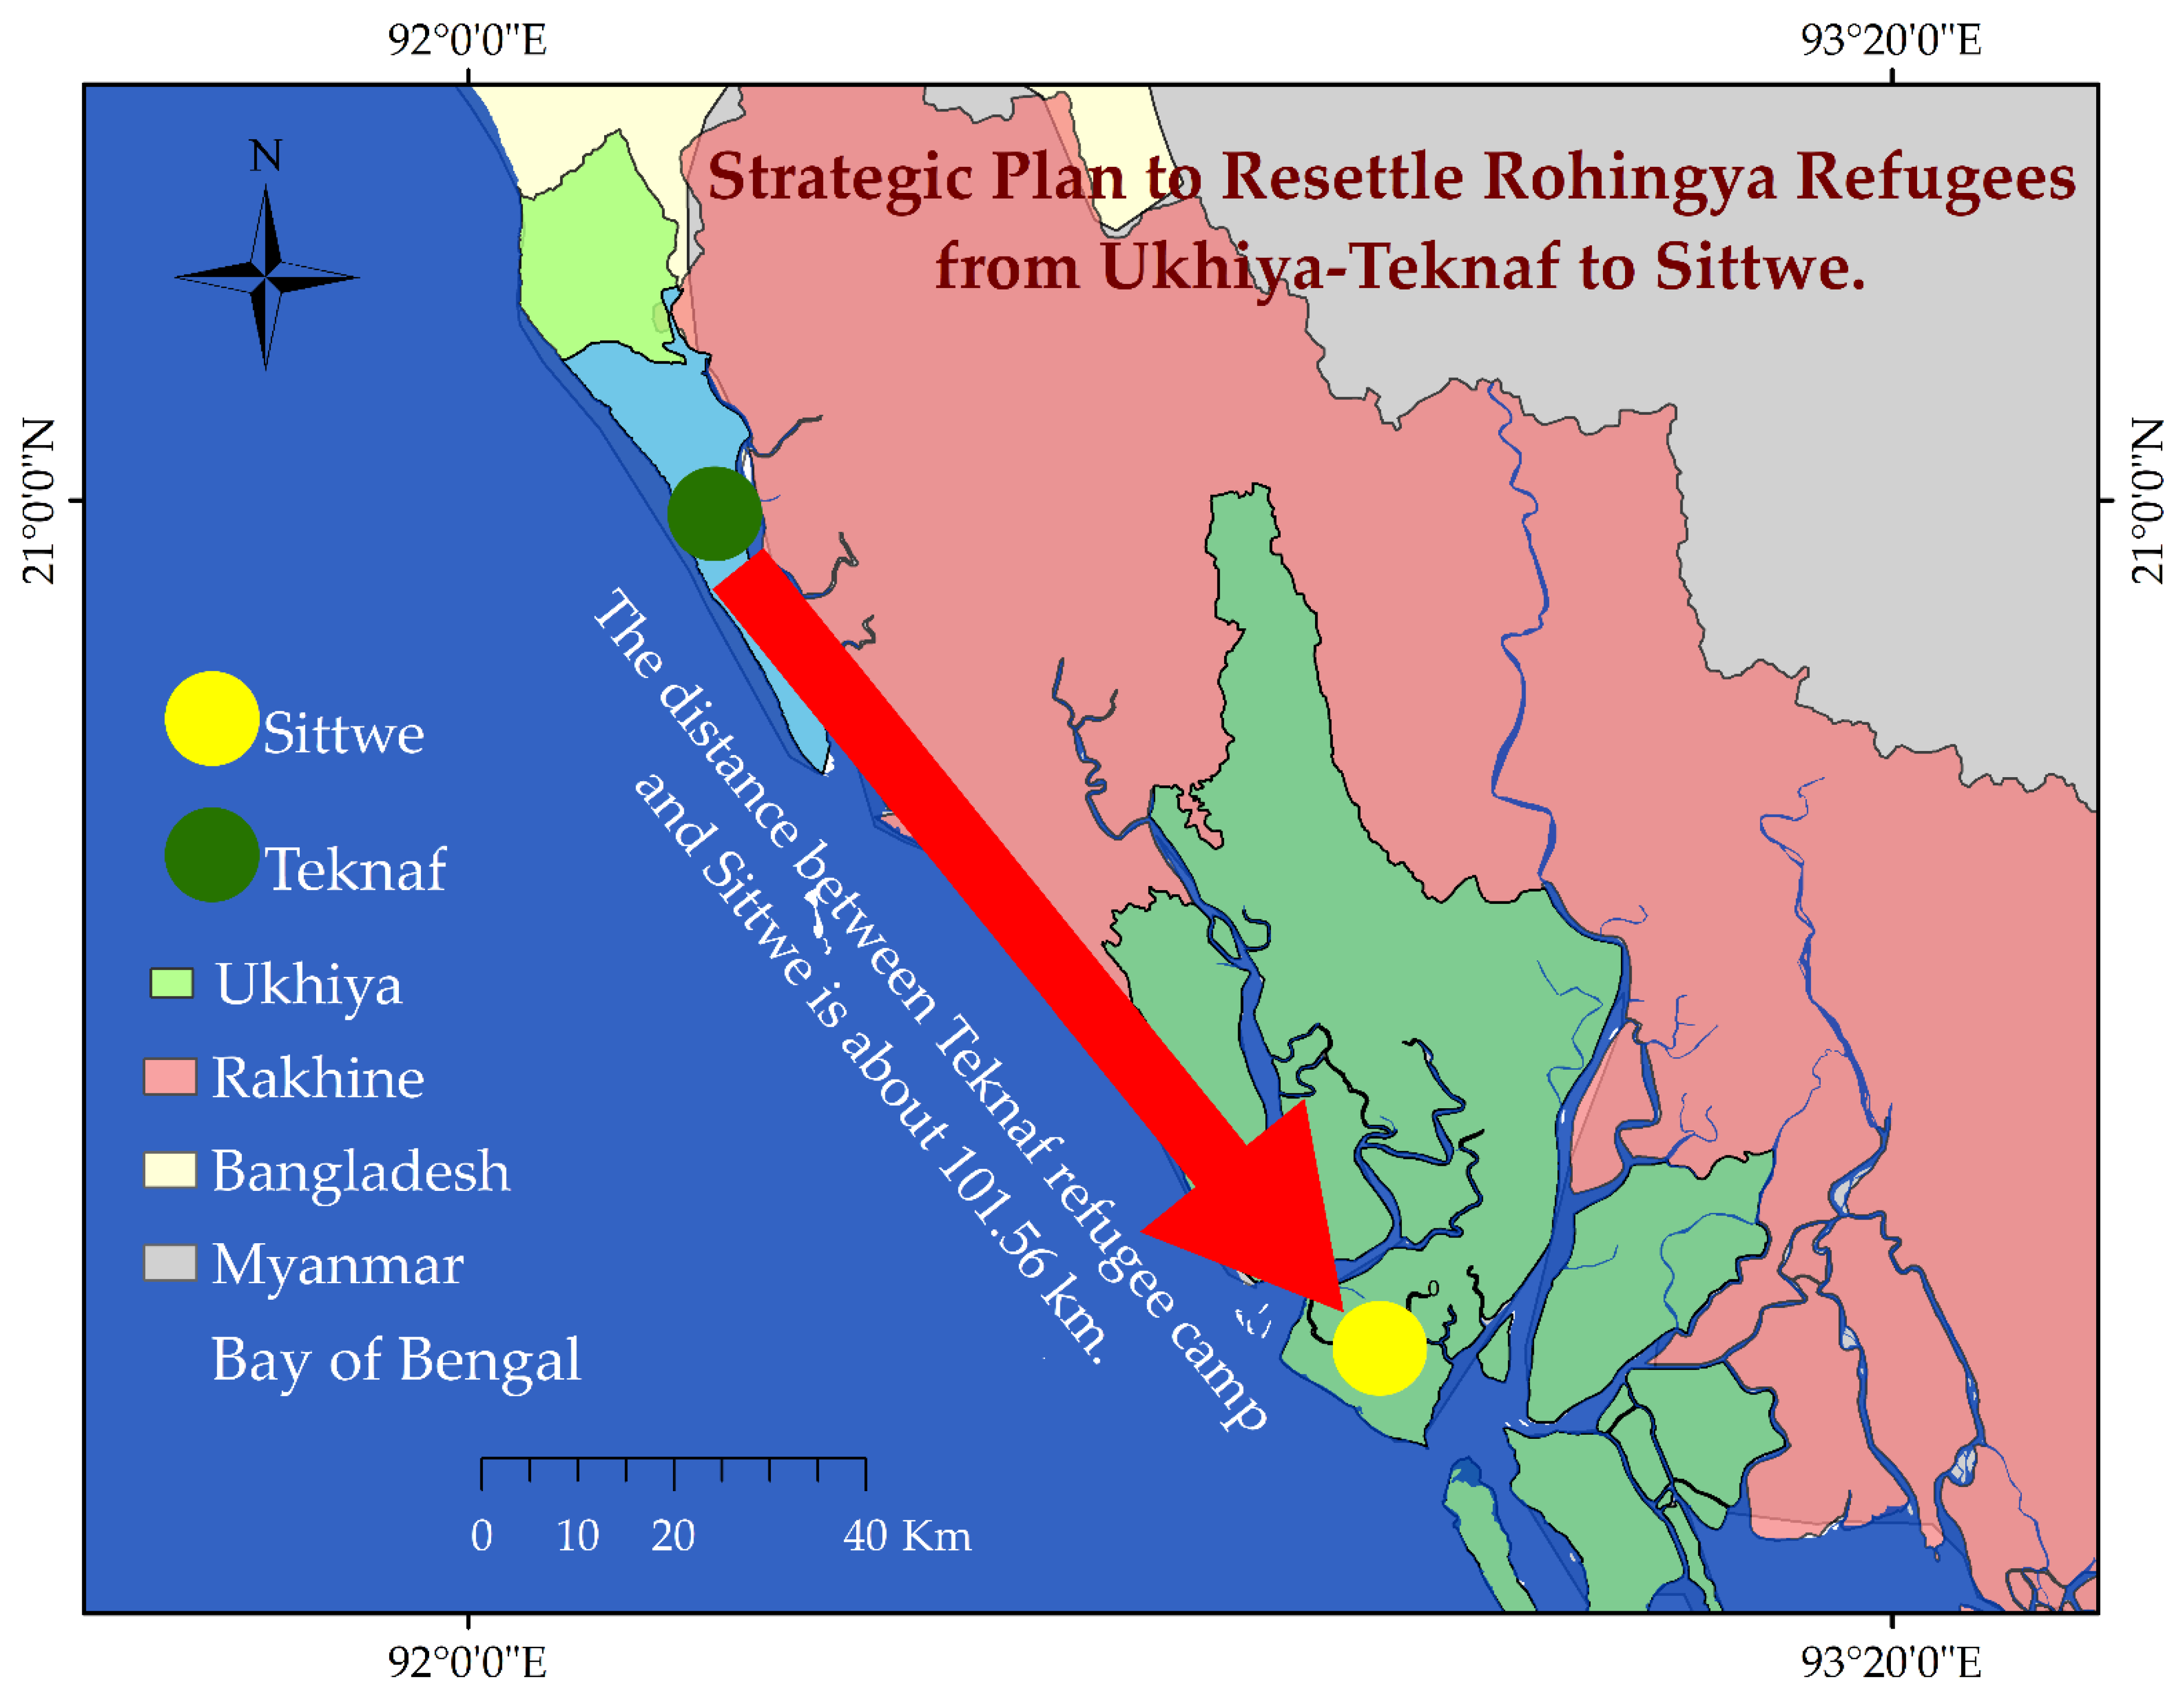
5.3. The Bangladesh Government Might Relocate the Rohingya Refugees to the Sittwe and Take Initiatives to Establish the Whole Refugee Settlement Area as an “Ecological Park” Justifying Proper Guidelines and Protocols/Land Use Policy Recommendations
6. Conclusions
Author Contributions
Funding
Institutional Review Board Statement
Informed Consent Statement
Acknowledgments
Conflicts of Interest
Appendix A
| Camp No | 2017(ha) | 2019(ha) | Net Change by Class (ha) | Net Change in All Refugee Camp Area (NCARC) | ||||||
|---|---|---|---|---|---|---|---|---|---|---|
| V | R.C | N.V | V | R.C | N.V | NVCC | NRCC | NNVCC | ||
| C. 1W | 32.49 | 4.23 | 17.64 | 5.49 | 33.93 | 14.94 | −27 | 29.7 | −2.7 | Camp Area +729.99 ha Vegetative Cover −1502.56 ha Non-Vegetative +760.89 ha |
| C. 1E | 58.5 | 0.27 | 7.22 | 27 | 20.7 | 17.28 | −31.5 | 20.43 | 10.06 | |
| C. 2W | 3.06 | 5.31 | 31.95 | 0.27 | 22.5 | 17.55 | −2.79 | 17.19 | −14.4 | |
| C. 2E | 7.11 | 6.3 | 26.55 | 4.59 | 27 | 8.37 | −2.52 | 20.7 | −18.18 | |
| C. 3 | 44.82 | 0.36 | 1.17 | 0.8 | 21.6 | 23.94 | −44.02 | 21.24 | 22.77 | |
| C. 4 | 117 | 0.18 | 0.18 | 0.45 | 29.43 | 87.48 | −116.55 | 29.25 | 87.3 | |
| C. 4 (Ext.) | 48.87 | 0 | 0.72 | 1.8 | 5.4 | 42.39 | −47.07 | 5.4 | 41.67 | |
| C. 5 | 62.1 | 0 | 0.63 | 0.18 | 9.54 | 53.01 | −61.92 | 9.54 | 52.38 | |
| C. 6 | 18.27 | 0.18 | 18.81 | 0 | 22.5 | 14.76 | −18.27 | 22.32 | −4.05 | |
| C. 7 | 48.24 | 1.98 | 22.23 | 8.1 | 34.92 | 29.43 | −40.14 | 32.94 | 7.2 | |
| C. 8W | 78.12 | 0.09 | 0.09 | 0 | 33.21 | 45.03 | −78.12 | 33.12 | 44.94 | |
| C. 8E | 79.29 | 1.44 | 16.38 | 15.57 | 37.08 | 43.86 | −63.72 | 35.64 | 27.48 | |
| C. 9 | 38.34 | 0.09 | 27.27 | 3.96 | 34.29 | 27.46 | −34.38 | 34.2 | 0.19 | |
| C. 10 | 41.4 | 0.18 | 8.64 | 0 | 24.75 | 25.47 | −41.40 | 24.57 | 16.83 | |
| C. 11 | 39.15 | 0.09 | 8.91 | 0.9 | 27.09 | 20.16 | −38.25 | 27 | 11.25 | |
| C. 12 | 51.75 | 0 | 12.06 | 9.99 | 17.37 | 36.45 | −41.76 | 17.37 | 24.39 | |
| C. 13 | 57.42 | 0.9 | 17.55 | 2.25 | 35.55 | 38.07 | −55.17 | 34.65 | 20.52 | |
| C. 14 | 80.28 | 0 | 6.93 | 7.92 | 25.11 | 44.18 | −72.36 | 25.11 | 37.25 | |
| C. 15 | 74.52 | 0.27 | 24.39 | 0.81 | 49.77 | 48.6 | −73.71 | 49.5 | 24.21 | |
| C. 16 | 27.72 | 0.81 | 25.2 | 4.14 | 18.81 | 30.78 | −23.58 | 18 | 5.58 | |
| C. 17 | 96.75 | 0 | 1.35 | 0.0001 | 7.02 | 91.08 | −96.75 | 7.02 | 89.73 | |
| C. 18 | 74.52 | 0 | 1.8 | 0 | 22.05 | 54.27 | −74.52 | 22.05 | 52.47 | |
| C. 19 | 56.43 | 0.27 | 21.06 | 4.68 | 12.69 | 60.39 | −51.75 | 12.42 | 39.33 | |
| C. 20 | 47.52 | 0 | 1.98 | 0.001 | 3.06 | 46.44 | −47.519 | 3.06 | 44.46 | |
| C. 20 (Ext) | 76.14 | 0 | 1.71 | 0.36 | 9.81 | 67.68 | −75.78 | 9.81 | 65.97 | |
| C. 21 | 40.32 | 0 | 1.62 | 5.67 | 18.27 | 18 | −34.65 | 18.27 | 16.38 | |
| C. 22 | 38.34 | 1.26 | 16.92 | 6.57 | 28.62 | 21.33 | −31.77 | 27.36 | 4.41 | |
| C. 23 | 105.3 | 5.85 | 25.65 | 79.2 | 15.39 | 42.21 | −26.1 | 9.54 | 16.56 | |
| C. 24 | 73.44 | 12.96 | 32.58 | 44.19 | 29.16 | 45.63 | −29.25 | 16.2 | 13.05 | |
| C. 25 | 48.6 | 9.72 | 56.16 | 30.6 | 19.44 | 64.43 | −18 | 9.72 | 8.27 | |
| C. 26 | 100.71 | 16.83 | 58.86 | 45.99 | 64.26 | 66.15 | −54.72 | 47.43 | 7.29 | |
| C. 27 | 101.79 | 4.77 | 29.43 | 60.93 | 28.71 | 46.35 | −40.86 | 23.94 | 16.92 | |
| Kutupalong RC | 10.17 | 13.05 | 15.75 | 7.47 | 21.33 | 10.17 | −2.7 | 8.28 | −5.58 | |
| Nayapara RC | 7.92 | 13.68 | 11.25 | 3.96 | 20.7 | 8.19 | −3.96 | 7.02 | −3.06 | |
| Standardized per Capital Greening Area (PCGA) Dataset | |||
|---|---|---|---|
| Camp No. | 2017 | 2018 | 2019 |
| Camp 1W | −0.44 | −0.46 | −0.34 |
| Camp 2E | −0.82 | −0.43 | −0.33 |
| Camp 2W | −0.82 | −0.50 | −0.42 |
| Camp 3 | −0.25 | −0.50 | −0.42 |
| Camp 4 | 0.36 | −0.46 | −0.42 |
| Camp 4 Ext. | −0.56 | 0.93 | −0.23 |
| Camp 5 | −0.21 | −0.50 | −0.43 |
| Camp 6 | −0.73 | −0.50 | −0.43 |
| Camp 7 | −0.69 | −0.39 | −0.29 |
| Camp 8E | −0.23 | −0.23 | −0.09 |
| Camp 8W | −0.17 | −0.50 | −0.43 |
| Camp 9 | −0.67 | −0.43 | −0.36 |
| Camp 10 | −0.27 | −0.50 | −0.43 |
| Camp 11 | 2.48 | −0.49 | −0.41 |
| Camp 12 | 0.52 | −0.31 | −0.15 |
| Camp 13 | 0.39 | −0.47 | −0.39 |
| Camp 14 | 1.03 | −0.38 | −0.26 |
| Camp 15 | 1.07 | −0.49 | −0.42 |
| Camp 16 | −0.06 | −0.44 | −0.30 |
| Camp 17 | −0.02 | −0.07 | −0.43 |
| Camp 18 | 0.78 | −0.49 | −0.43 |
| Camp 19 | 3.94 | −0.34 | −0.28 |
| Camp 20 | −0.59 | 0.19 | −0.43 |
| Camp 20 Ext. | −0.53 | 4.32 | −0.38 |
| Camp 21 | 0.08 | −0.01 | −0.12 |
| Camp 22 | 0.08 | −0.35 | −0.23 |
| Camp 23 | −0.70 | 2.33 | 4.40 |
| Camp 24 | −0.81 | 0.12 | 0.45 |
| Camp 25 | −0.10 | 0.90 | 1.73 |
| Camp 26 | −0.51 | −0.08 | 0.32 |
| Camp 27 | 0.09 | 1.31 | 2.43 |
| Nayapara RC * | −0.82 | −0.45 | −0.33 |
| Kutupalong RC * | −0.82 | −0.30 | −0.15 |
| 2017 | |||||||||||
|---|---|---|---|---|---|---|---|---|---|---|---|
| LULC Classes | Veg. | Sett. | Wat. | Agri. | Aqua. | Arab. | Tidal. | Sand. | Bare. | C.T | |
| 2018 | Veg. | 344.06 | 0.41 | 1.09 | 3.16 | 4.33 | 3.74 | 1.15 | 0.02 | 0.06 | 358.02 |
| Sett. | 3.91 | 2.87 | 0.04 | 0.06 | 2.77 | 1.61 | 0.42 | 0.79 | 0.32 | 12.78 | |
| Wat. | 0.69 | 0.02 | 10.86 | 0 | 0.45 | 0.02 | 3.67 | 0.04 | 0 | 15.74 | |
| Agri. | 9.07 | 0.14 | 0.03 | 7.63 | 0.1 | 3.17 | 0 | 0 | 0.26 | 20.4 | |
| Aqua. | 7.82 | 2.22 | 1.12 | 0.04 | 38.91 | 2.69 | 5.78 | 0.15 | 0.09 | 58.83 | |
| Arab. | 21.49 | 6.35 | 0.05 | 1.12 | 7.51 | 35.34 | 0.1 | 0.46 | 2.07 | 74.5 | |
| Tidal. | 0.53 | 0.29 | 2.27 | 0 | 3.25 | 0.06 | 12.81 | 0.32 | 0 | 19.54 | |
| Sand. | 0.36 | 0.77 | 0.19 | 0.01 | 0.3 | 0.11 | 2.44 | 6.55 | 0.03 | 10.77 | |
| Bare. | 3.68 | 0.14 | 0 | 0.17 | 0.38 | 1.05 | 0.03 | 0.03 | 0.94 | 6.43 | |
| C.T | 391.61 | 13.21 | 15.65 | 12.2 | 58.01 | 47.79 | 26.38 | 8.38 | 3.78 | 0 | |
| 2018 | |||||||||||
|---|---|---|---|---|---|---|---|---|---|---|---|
| LULC Class | Veg. | Sett. | Wat. | Agri. | Aqua. | Arab. | Tidal. | Sand. | Bare. | C.T | |
| 2019 | Veg. | 317.83 | 0.23 | 0.54 | 7.11 | 5.74 | 4.58 | 0.67 | 0.04 | 0.03 | 336.79 |
| Sett. | 2.31 | 7.71 | 0.07 | 0.07 | 5.43 | 8.44 | 0.9 | 1.18 | 1.47 | 27.57 | |
| Wat. | 0.64 | 0.05 | 11.02 | 0 | 0.88 | 0.07 | 1.6 | 0.15 | 0 | 14.4 | |
| Agri. | 5.78 | 0.04 | 0 | 6.85 | 0.04 | 1.78 | 0 | 0 | 0.02 | 14.51 | |
| Aqua. | 1.36 | 0.86 | 0.04 | 0.04 | 25.02 | 2.23 | 0.82 | 0.02 | 0.05 | 30.43 | |
| Arab. | 26.95 | 2.04 | 0.01 | 6 | 6.09 | 53.57 | 0.16 | 0.08 | 1.56 | 96.44 | |
| Tidal. | 2.22 | 0.55 | 3.76 | 0 | 15.13 | 0.76 | 12.36 | 0.39 | 0 | 35.17 | |
| Sand. | 0.1 | 0.81 | 0.29 | 0 | 0.44 | 0.49 | 3.03 | 8.91 | 0.08 | 14.15 | |
| Bare. | 0.85 | 0.47 | 0 | 0.32 | 0.07 | 2.58 | 0 | 0.02 | 3.21 | 7.53 | |
| C.T | 358.02 | 12.78 | 15.74 | 20.4 | 58.83 | 74.5 | 19.54 | 10.77 | 6.43 | 0 | |
| 2017 | |||||||||||
|---|---|---|---|---|---|---|---|---|---|---|---|
| LULC Class | Veg. | Sett. | Wat. | Agri. | Aqua. | Arab. | Tidal. | Sand. | Bare. | C.T | |
| 2019 | Veg. | 322.51 | 0.4 | 0.66 | 4.39 | 5.57 | 2.44 | 0.7 | 0.04 | 0.09 | 336.79 |
| Sett. | 8.73 | 4.67 | 0.07 | 0.12 | 7.96 | 3.65 | 0.82 | 1.05 | 0.51 | 27.57 | |
| Wat. | 0.41 | 0.03 | 10.16 | 0 | 0.54 | 0 | 3.16 | 0.1 | 0 | 14.4 | |
| Agri. | 7.01 | 0.12 | 0.02 | 5.14 | 0.07 | 1.96 | 0 | 0 | 0.18 | 14.51 | |
| Aqua. | 2.51 | 1.39 | 0.14 | 0.03 | 23.53 | 1.82 | 0.83 | 0.1 | 0.07 | 30.43 | |
| Arab. | 43.03 | 4.97 | 0.07 | 2.31 | 7.44 | 36.23 | 0.1 | 0.2 | 2.08 | 96.44 | |
| Tidal. | 2.1 | 0.6 | 4 | 0 | 11.88 | 0.33 | 16.09 | 0.16 | 0.01 | 35.17 | |
| Sand. | 0.34 | 0.85 | 0.52 | 0.01 | 0.78 | 0.23 | 4.67 | 6.69 | 0.05 | 14.15 | |
| Bare. | 4.98 | 0.18 | 0 | 0.19 | 0.23 | 1.13 | 0 | 0.03 | 0.79 | 7.53 | |
| C.T. | 391.61 | 13.21 | 15.65 | 12.2 | 58.01 | 47.79 | 26.38 | 8.38 | 3.78 | 0 | |
References
- ISCG. Monitoring Report: Rohingya Refugee Crisis Response Plan. no. October, 2017; pp. 1–48. Available online: https://reliefweb.int/report/bangladesh/2017-monitoring-report-rohingya-refugee-crisis-response-plan (accessed on 4 April 2019).
- Hassan, M.; Smith, A.; Walker, K.; Rahman, M.; Southworth, J. Rohingya Refugee Crisis and Forest Cover Change in Teknaf, Bangladesh. Remote Sens. 2018, 10, 689. [Google Scholar] [CrossRef]
- World Health Organization. Rohingya Refugee Crisis in Cox’s Bazar, Bangladesh: Health Sector Bulletin. 2018. Available online: http://www.searo.who.int/bangladesh/healthsectorcxbbanbulletinno3.pdf (accessed on 6 April 2019).
- Imtiaz, S. Ecological impact of Rohingya refugees on forest resources: Remote sensing analysis of vegetation cover change in Teknaf Peninsula in Bangladesh. Ecocycles 2018, 4, 16–19. [Google Scholar] [CrossRef]
- XCHANGE-FOUNDATION. ‘The Rohingya Amongst Us’: Bangladeshi Perspectives on the Rohingya Crisis Survey. 2018. Available online: http://xchange.org/bangladeshi-perspectives-on-the-rohingya-crisis-survey/ (accessed on 3 April 2019).
- UNHCR. ROHINGYA REFUGEE CRISIS Camp Settlement and Protection Profiling Cox’s Bazar, Bangladesh. 2018. Available online: https://www.unocha.org/rohingya-refugee-crisis (accessed on 15 April 2019).
- ISCG. Situation Report Rohingya Refugee Crisis. 2018. Available online: https://reliefweb.int/report/bangladesh/iscg-situation-report-rohingya-refugee-crisis-cox-s-bazar-13-december-2018-0 (accessed on 13 December 2018).
- UNICEF. Influx of Rohingya refugees in Bangladesh- Bangladesh Revised Response Plan October 2017. 2017. Available online: https://reliefweb.int/report/bangladesh/unicef-bangladesh-revised-response-plan-rohingya-crisis-october-2017 (accessed on 5 April 2019).
- International Organization for Migration. JRP for Rohingya Humanitarian Crisis. 2019. Available online: https://www.unocha.org/sites/unocha/files/JRP for Rohingya Humanitarian Crisis 2018.PDF (accessed on 1 May 2019).
- UNHCR. Bangladesh Refugee Emergency Population Factsheet (as of 31 December 2018). 2018. Available online: https://reliefweb.int/sites/reliefweb.int/files/resources/67447.pdf (accessed on 20 April 2019).
- U. SaveTheChildrean, BRAC, WorldVision, WFP. Self-reliance Situation of Host Communities in Cox’s Bazar, 2018. Available online: https://fscluster.org/sites/default/files/documents/self_reliance_assessment_report-final.pdf (accessed on 4 April 2019).
- ALLARD K. LOWENSTEIN INTERNATIONAL HUMAN RIGHTS CLINIC, YALE LAW SCHOOL. Persecution of the Rohingya Muslims: Is Genocide Occuring in Myanmar’s Rakhine State. Dec. 2015. Available online: https://www.fortifyrights.org/downloads/Yale_Persecution_of_the_Rohingya_October_2015.pdf (accessed on 1 September 2021).
- GFDRR. Rohingya Crisis 2017–2018 Draft Rapid Impact, Vulnerability and Needs Assessment. 2018. Available online: https://www.gfdrr.org/sites/default/files/Rohingya crisis exec summary-2.pdf (accessed on 7 April 2019).
- Tani, M.; Rahman, A. Deforestation in the Teknaf Peninsula of Bangladesh; Springer: Singapore, 2018. [Google Scholar] [CrossRef]
- Labib, S.M.; Hossain, N.; Patwary, S.H. Environmental Cost of Refugee Crisis: Case Study of Kutupalong Balukhali Rohingya Camp Site A Remote Sensing Approach. In Proceedings of the 26th Annual GIScience Research UK (GISRUK 2018), Leicester, UK, 17–20 April 2018. [Google Scholar] [CrossRef]
- Pielke Sr, R.A.; Pitman, A.; Niyogi, D.; Mahmood, R.; McAlpine, C.; Hossain, F.; Goldewijk, K.K.; Nair, U.; Betts, R.; Fall, S.; et al. Land use/land cover changes and climate: Modeling analysis and observational evidence. Wiley Interdiscip. Rev. Clim. Chang. 2011, 2, 828–850. [Google Scholar] [CrossRef]
- Ali, M.Z.; Qazi, W.; Aslam, N. A comparative study of ALOS-2 PALSAR and landsat-8 imagery for land cover classification using maximum likelihood classifier. Egypt. J. Remote Sens. Space Sci. 2018, 21, S29–S35. [Google Scholar] [CrossRef]
- Ayele, G.T.; Tebeje, A.K.; Demissie, S.S.; A Belete, M.; A Jemberrie, M.; Teshome, W.M.; Mengistu, D.T.; Teshale, E.Z. Time Series Land Cover Mapping and Change Detection Analysis Using Geographic Information System and Remote Sensing, Northern Ethiopia. Air Soil Water Res. 2018, 11, 1–18. [Google Scholar] [CrossRef]
- Rimal, B.; Zhang, L.; Stork, N.; Sloan, S.; Rijal, S. Urban expansion occurred at the expense of agricultural lands in the Tarai region of Nepal from 1989 to 2016. Sustainability 2018, 10, 1341. [Google Scholar] [CrossRef]
- Phiri, D.; Morgenroth, J.; Xu, C.; Hermosilla, T. Effects of pre-processing methods on Landsat OLI-8 land cover classification using OBIA and random forests classifier. Int. J. Appl. Earth Obs. Geoinf. 2018, 73, 170–178. [Google Scholar] [CrossRef]
- Pelizari, P.A.; Spröhnle, K.; Geiß, C.; Schoepfer, E.; Plank, S.; Taubenböck, H. Multi-sensor feature fusion for very high spatial resolution built-up area extraction in temporary settlements. Remote Sens. Environ. 2018, 209, 793–807. [Google Scholar] [CrossRef]
- Yoo, C.; Han, D.; Im, J.; Bechtel, B. Comparison between convolutional neural networks and random forest for local climate zone classification in mega urban areas using Landsat images. ISPRS J. Photogramm. Remote Sens. 2019, 157, 155–170. [Google Scholar] [CrossRef]
- Topaloğlu, R.H.; Sertel, E.; Musaoğlu, N. Assessment of classification accuracies of sentinel-2 and landsat-8 data for land cover / use mapping. ISPRS—Int. Arch. Photogramm. Remote Sens. Spat. Inf. Sci. 2016, XLI-B8, 1055–1059. [Google Scholar] [CrossRef]
- Yousefi, S.; Mirzaee, S.; Tazeh, M.; Pourghasemi, H.; Karimi, H. Comparison of different algorithms for land use mapping in dry climate using satellite images: A case study of the Central regions of Iran. Desert 2015, 20, 1–10. Available online: https://jdesert.ut.ac.ir/article_54077_a03ba2904e5acfaea28503c6a535198d.pdf (accessed on 5 December 2018).
- Hannv, Z.; Qigang, J.; Jiang, X. Coastline extraction using support vector machine from remote sensing image. J. Multimed. 2013, 8, 175–182. [Google Scholar] [CrossRef]
- Rudrapal, D.; Subhedar, M. Land Cover Classification using Support Vector Machine. Int. J. Eng. Res. 2015, 9, 584–588. [Google Scholar] [CrossRef]
- Srivastava, P.K.; Han, D.; Rico-Ramirez, M.A.; Bray, M.; Islam, T. Selection of classification techniques for land use/land cover change investigation. Adv. Space Res. 2012, 50, 1250–1265. [Google Scholar] [CrossRef]
- Deilmai, B.R.; Ahmad, B.b.; Zabihi, H. Comparison of two Classification methods (MLC and SVM) to extract land use and land cover in Johor Malaysia. In Proceedings of the IOP Conference Series: Earth and Environmental Science, 7th IGRSM International Remote Sensing & GIS Conference and Exhibition, Kuala Lumpur, Malaysia, 22–23 April 2014; Volume 20. [Google Scholar] [CrossRef]
- Celebi, M.E.; Kingravi, H.A.; Vela, P.A. A comparative study of efficient initialization methods for the k-means clustering algorithm. Expert Syst. Appl. 2013, 40, 200–210. [Google Scholar] [CrossRef]
- Karim, M.F.; Zhang, X.; Li, R. Dynamics of Shrimp Farming in the Southwestern Coastal Districts of Bangladesh Using a Shrimp Yield Dataset (SYD) and Landsat Satellite Archives. Sustainability 2019, 11, 4635. [Google Scholar] [CrossRef]
- Agarwal, J.; Nagpal, R.; Sehgal, R. Crime Analysis using K-Means Clustering. Int. J. Comput. Appl. 2013, 83, 1–4. [Google Scholar] [CrossRef]
- Zou, H.; Zou, Z.; Wang, X. An enhanced K-Means algorithm for water quality analysis of the haihe river in China. Int. J. Environ. Res. Public Health 2015, 12, 14400–14413. [Google Scholar] [CrossRef]
- University of Chinchinnati. K-means Cluster Analysis. UC Business Analytics R Programming Guide. Available online: https://uc-r.github.io/kmeans_clustering (accessed on 28 November 2018).
- Mariño, M.A.; Rezende, C.A.; Tasic, L. A multistep mild process for preparation of nanocellulose from orange bagasse. Cellulose 2018, 25, 5739–5750. [Google Scholar] [CrossRef]
- UNICEF. Bangladesh Humanitarian Situation Report No.30 (Rohingya Influx). 2018. Available online: https://reliefweb.int/sites/reliefweb.int/files/resources/UNICEF Bangladesh Humanitarian Situation Report No. 30%2C 22 April 2018 _original.pdf (accessed on 15 April 2019).
- BBS (Bangladesh Bureau of Statistics). District Statistics 2011 Cox’s Bazar. 2013. Available online: http://www.bbs.gov.bd/site/page/2888a55d-d686-4736-bad0-54b70462afda/District-Statistics (accessed on 1 September 2021).
- Khana, M.A.S.A.; Mukul, S.A.; Uddin, M.S.; Kibria, M.G.; Sultana, F. The use of medicinal plants in healthcare practices by Rohingya refugees in a degraded forest and conservation area of Bangladesh. Int. J. Biodivers. Sci. Manag. 2009, 5, 76–82. [Google Scholar] [CrossRef][Green Version]
- Rahman, H. Rohingya refugee crisis and human vs. elephant (Elephas maximus) c onflicts in Cox’s Bazar district of Bangladesh. J. Wildl. Biodivers. 2019, 3, 10–21. [Google Scholar] [CrossRef]
- Hardy, E.E.; Anderson, J.R. A Land Use Classification System for Use with Remote-Sensor Data. In LARS Symposia; Purdue University: West Lafayette, IN, USA, 1973; pp. 1–8. Available online: http://docs.lib.purdue.edu/lars_symp%5Cnhttp://docs.lib.purdue.edu/lars_symp/2 (accessed on 19 April 2019).
- Mihai, B.; Rujoiu-mare, M.; Nistor, C. Science of the Total Environment Recent forest cover changes (2002–2015) in the Southern Carpathians: A case study of the Iezer Mountains, Romania. Sci. Total Environ. 2017, 600, 2166–2174. [Google Scholar] [CrossRef]
- Oommen, T.; Misra, D.; Twarakavi, N.K.C.; Prakash, A.; Sahoo, B.; Bandopadhyay, S. An Objective Analysis of Support Vector Machine Based Classification for Remote Sensing. Math. Geosci. 2008, 40, 409–424. [Google Scholar] [CrossRef]
- Mountrakis, G.; Im, J.; Ogole, C. Support vector machines in remote sensing: A review. ISPRS J. Photogramm. Remote Sens. 2011, 66, 247–259. [Google Scholar] [CrossRef]
- Pham, D.T.; Dimov, S.S.; Nguyen, C.D. Selection of K in K -means clustering. Proc. Inst. Mech. Eng. Part C J. Mech. Eng. Sci. 2005, 219, 103–119. [Google Scholar] [CrossRef]
- Vinet, L.; Zhedanov, A. A “Missing” Family of Classical Orthogonal Polynomials; Manning Publications Co.: Bristol, UK, 2011; Volume 44. [Google Scholar] [CrossRef]
- Gentle, J.E.; Kaufman, L.; Rousseuw, P.J. Finding Groups in Data; John Wiley & Sons, Inc.: Hoboken, NJ, USA, 2008; Volume 47. [Google Scholar] [CrossRef]
- Henits, L.; Jürgens, C.; Mucsi, L. Seasonal multitemporal land-cover classification and change detection analysis of Bochum, Germany, using multitemporal Landsat TM data. Int. J. Remote Sens. 2016, 37, 3439–3454. [Google Scholar] [CrossRef]
- Martin, W. Strategic Recommendations for Shelter Upgrade in Response to the Rohingya Humanitarian Crisis: Findings and Results of the Emergency Market Mapping Analysis (Emma) on Bamboo and Timber Market Chains in Cox’s Bazar District, Bangladesh. 2017. Available online: https://www.crs.org/sites/default/files/tools-research/bangladesh-shelter-case-study-rohingya-crisis.pdf (accessed on 21 April 2019).
- Checchi, F.; Stewart, B.T.; Palmer, J.J.; Grundy, C. Validity and feasibility of a satellite imagery-based method for rapid estimation of displaced populations. Int. J. Health Geogr. 2013, 12, 4. [Google Scholar] [CrossRef]
- Human Rights Watch (Organization). “An Island Jail in the Middle of the Sea”: Bangladesh’s Relocation of Rohingya Refugees to Bhasan Char. Available online: https://www.hrw.org/sites/default/files/media_2021/06/bangladesh0621_web.pdf (accessed on 29 November 2021).
- Uddin, M.Z.; Alam, F.; Rhaman, A.; Hassan, A. Diversity in angiosperm flora of teknaf wildlife sanctuary, bangladesh. Bangladesh J. Plant Taxon. 2013, 20, 145–162. [Google Scholar] [CrossRef]
- Howell, J.A.; Pollak, T. Wildlife Habitat Analysis for Alcatraz Island, Golden Gate National Recreation Area, California. Available online: http://npshistory.com/publications/alca/wild-hab-analysis.pdf (accessed on 8 August 2021).
- Nath, T.K.; Alauddin, M. Sitakunda Botanical Garden and Eco-park, Chittagong, Bangladesh: Its impacts on a rural community. Int. J. Biodivers. Sci. Manag. 2006, 2, 1–11. [Google Scholar] [CrossRef]
- Moses, F.; Kengatharan, S. Bringing rohingya refugees off-track of long-term economic vulnerability in bangladesh. J. Nusant. Stud. (JONUS) 2018, 3, 42. [Google Scholar] [CrossRef]


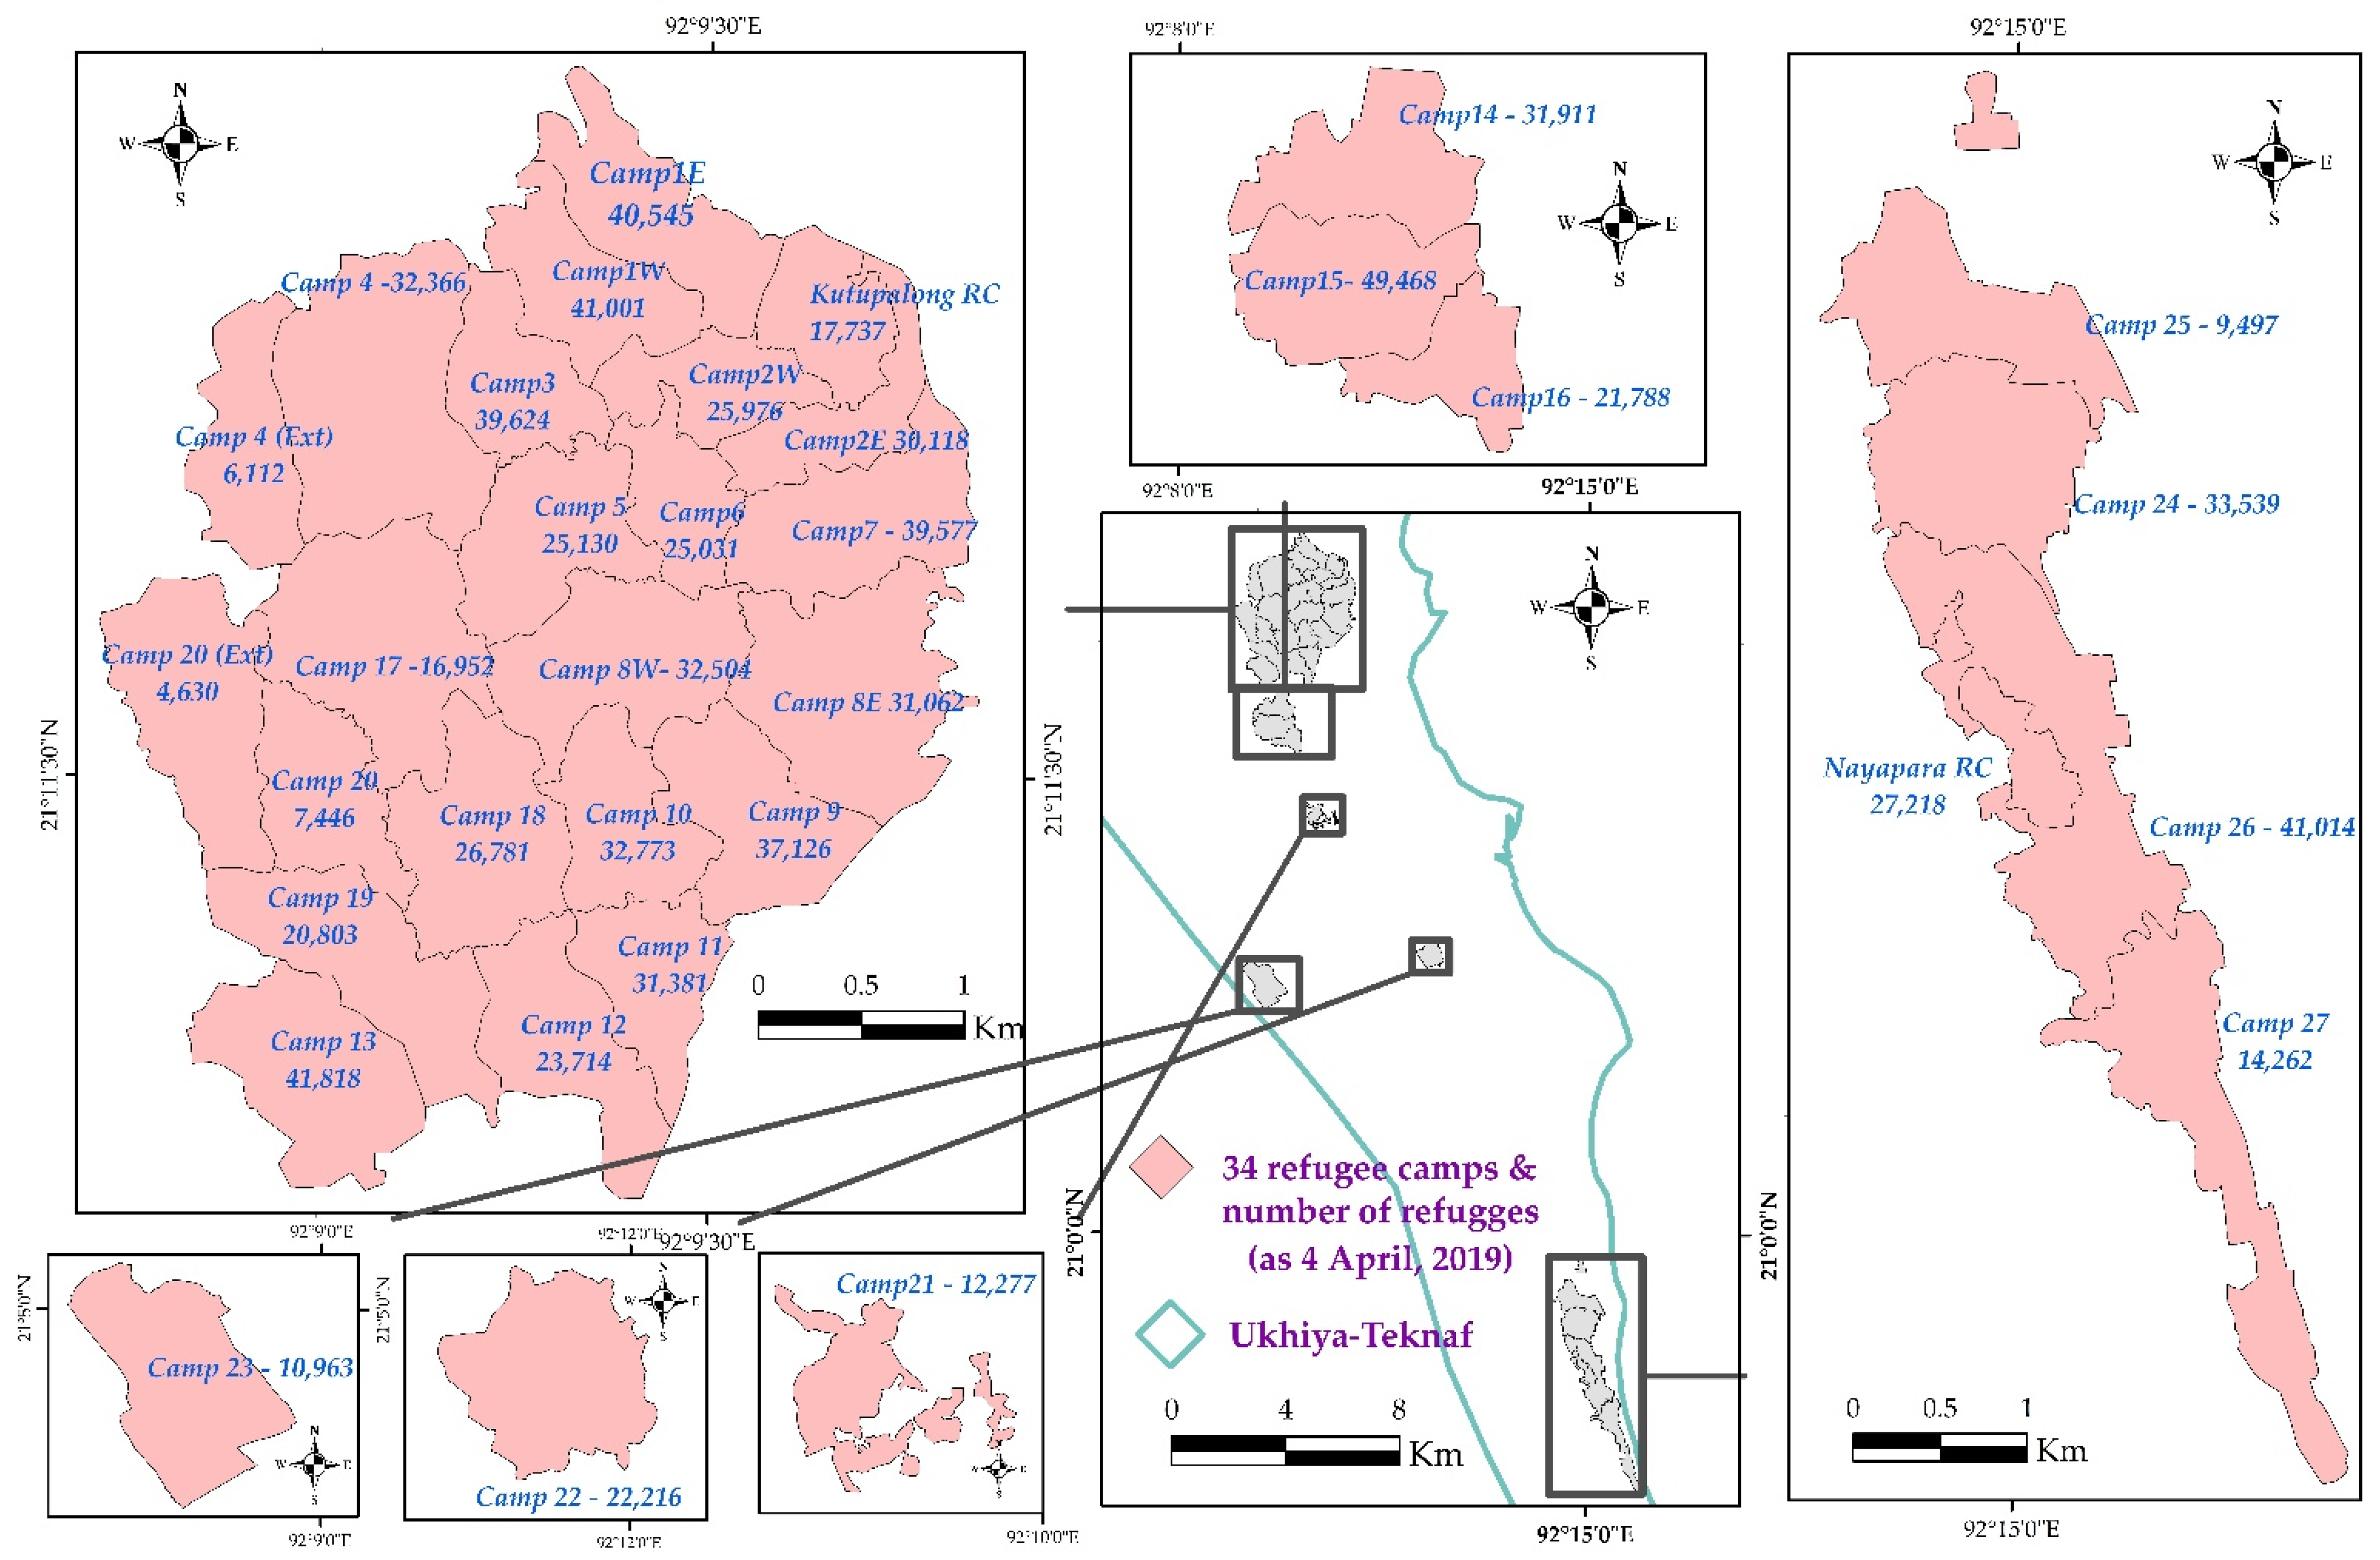
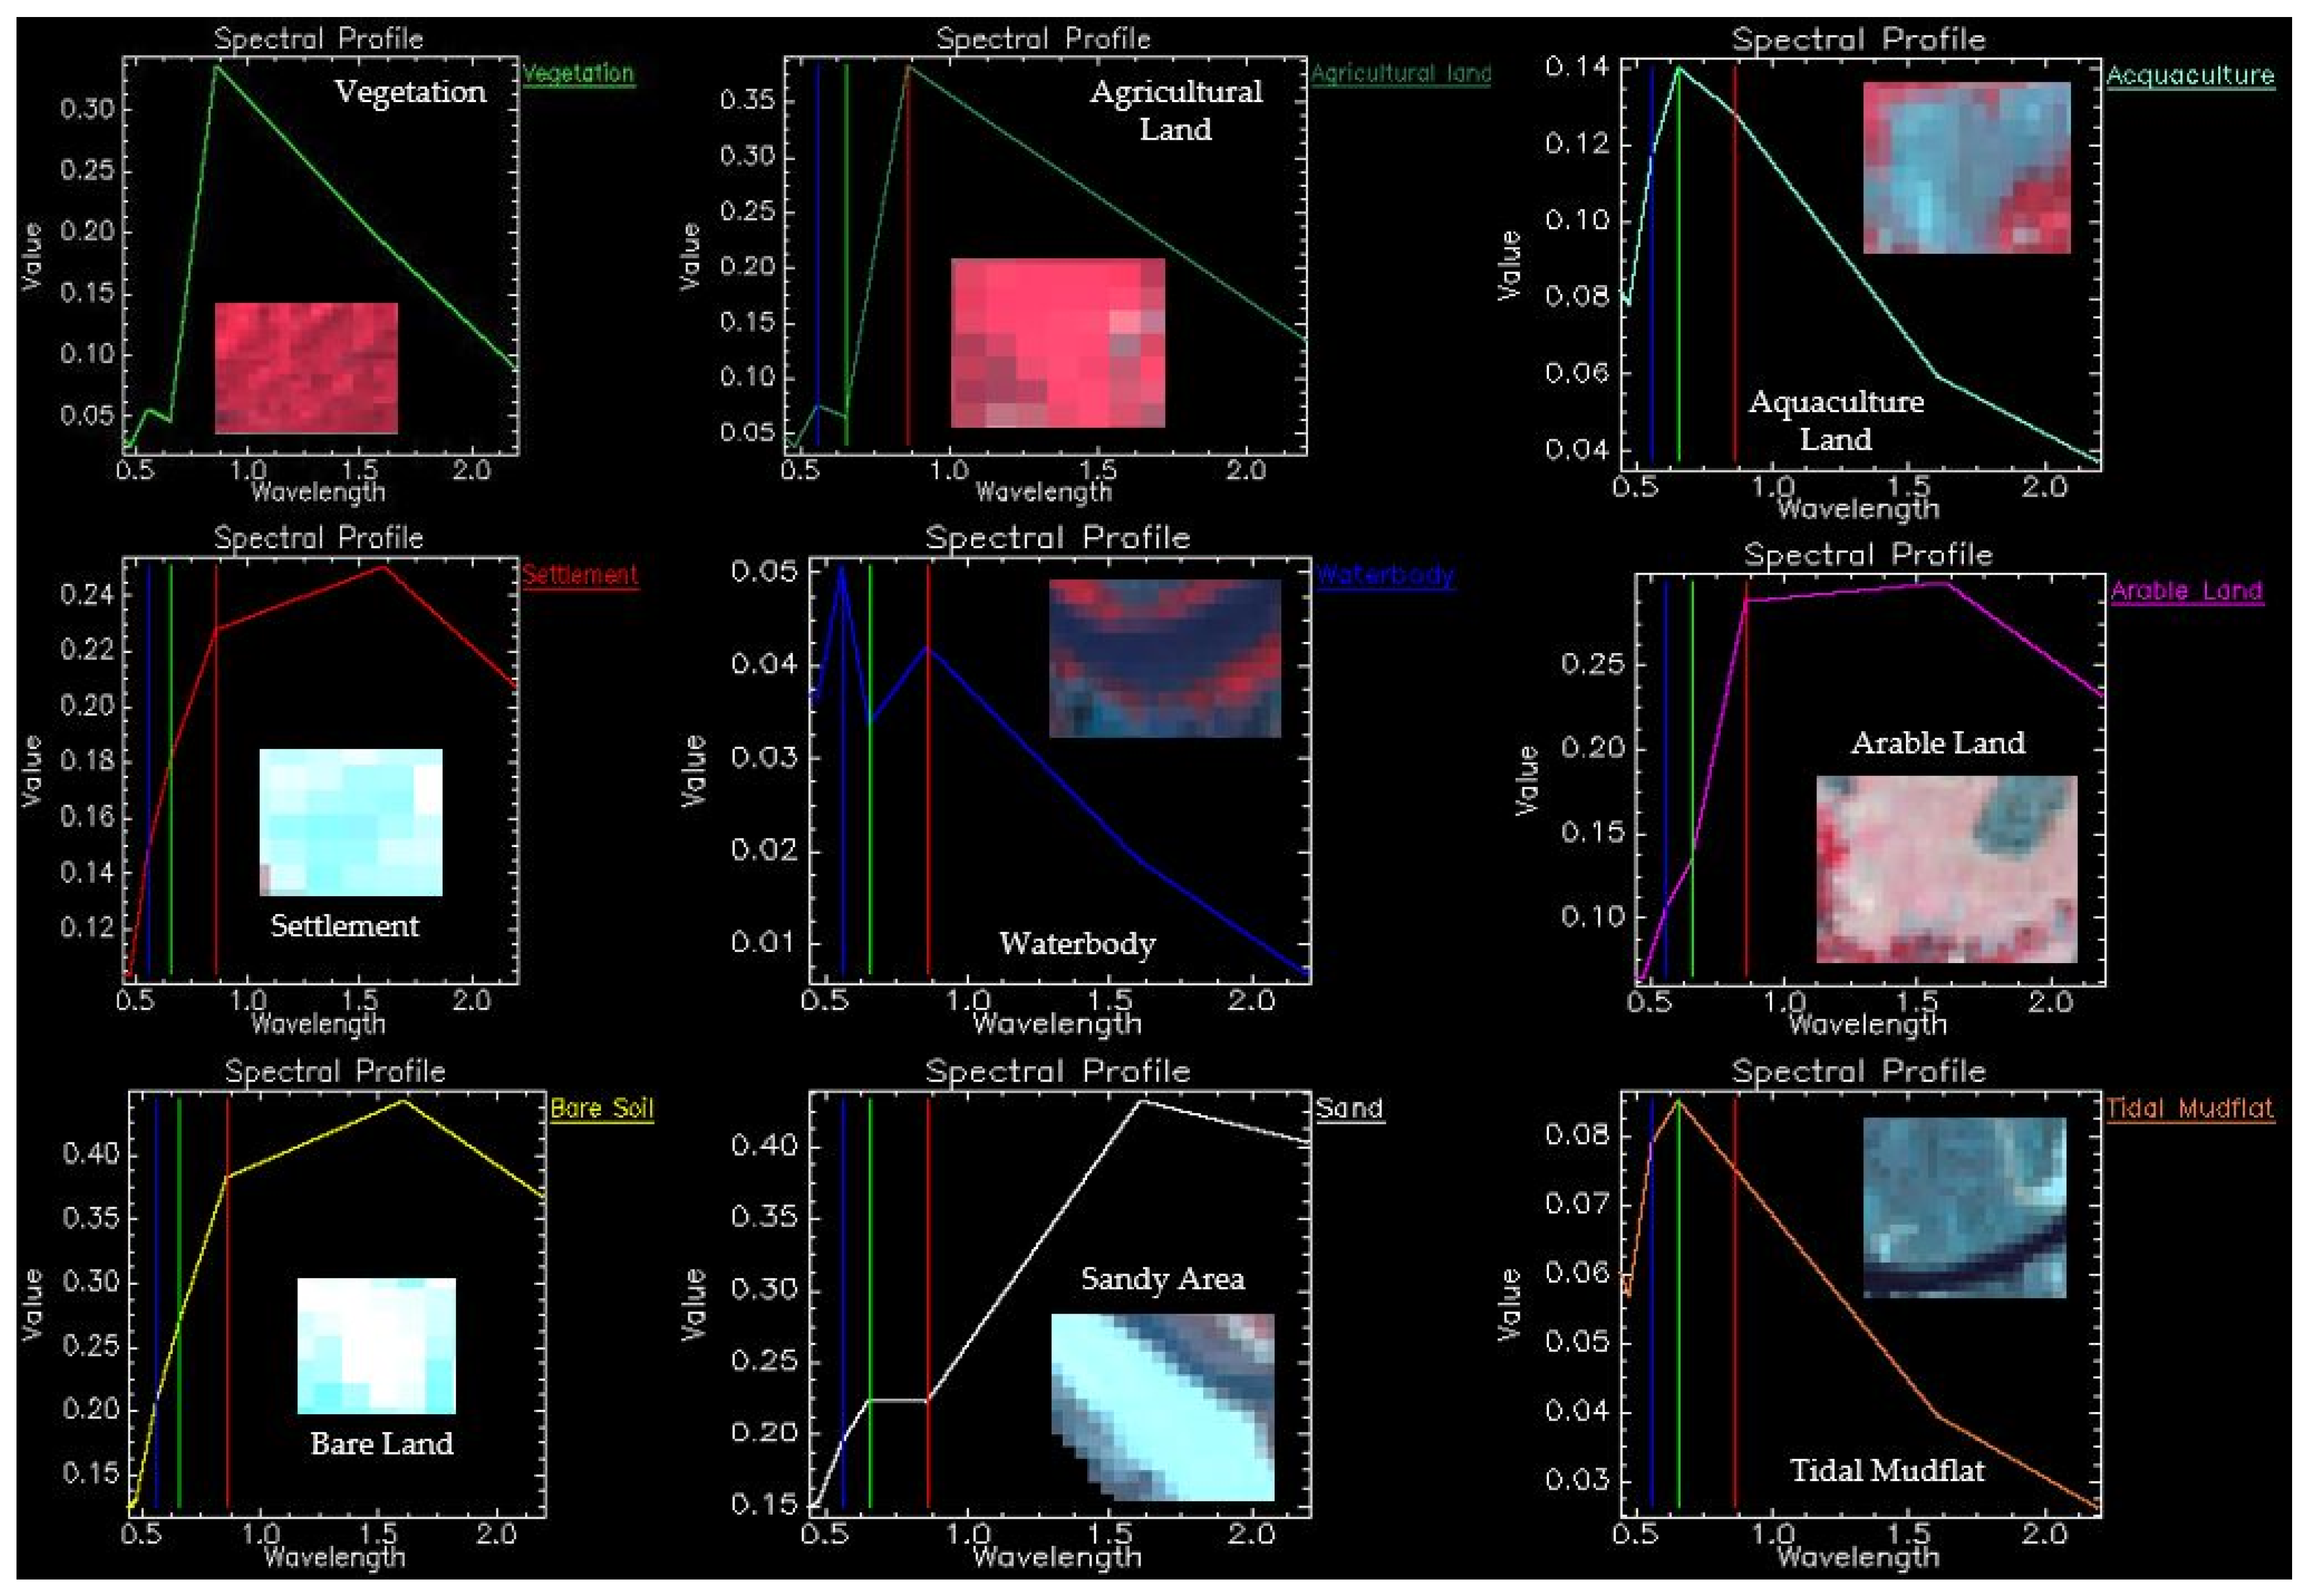
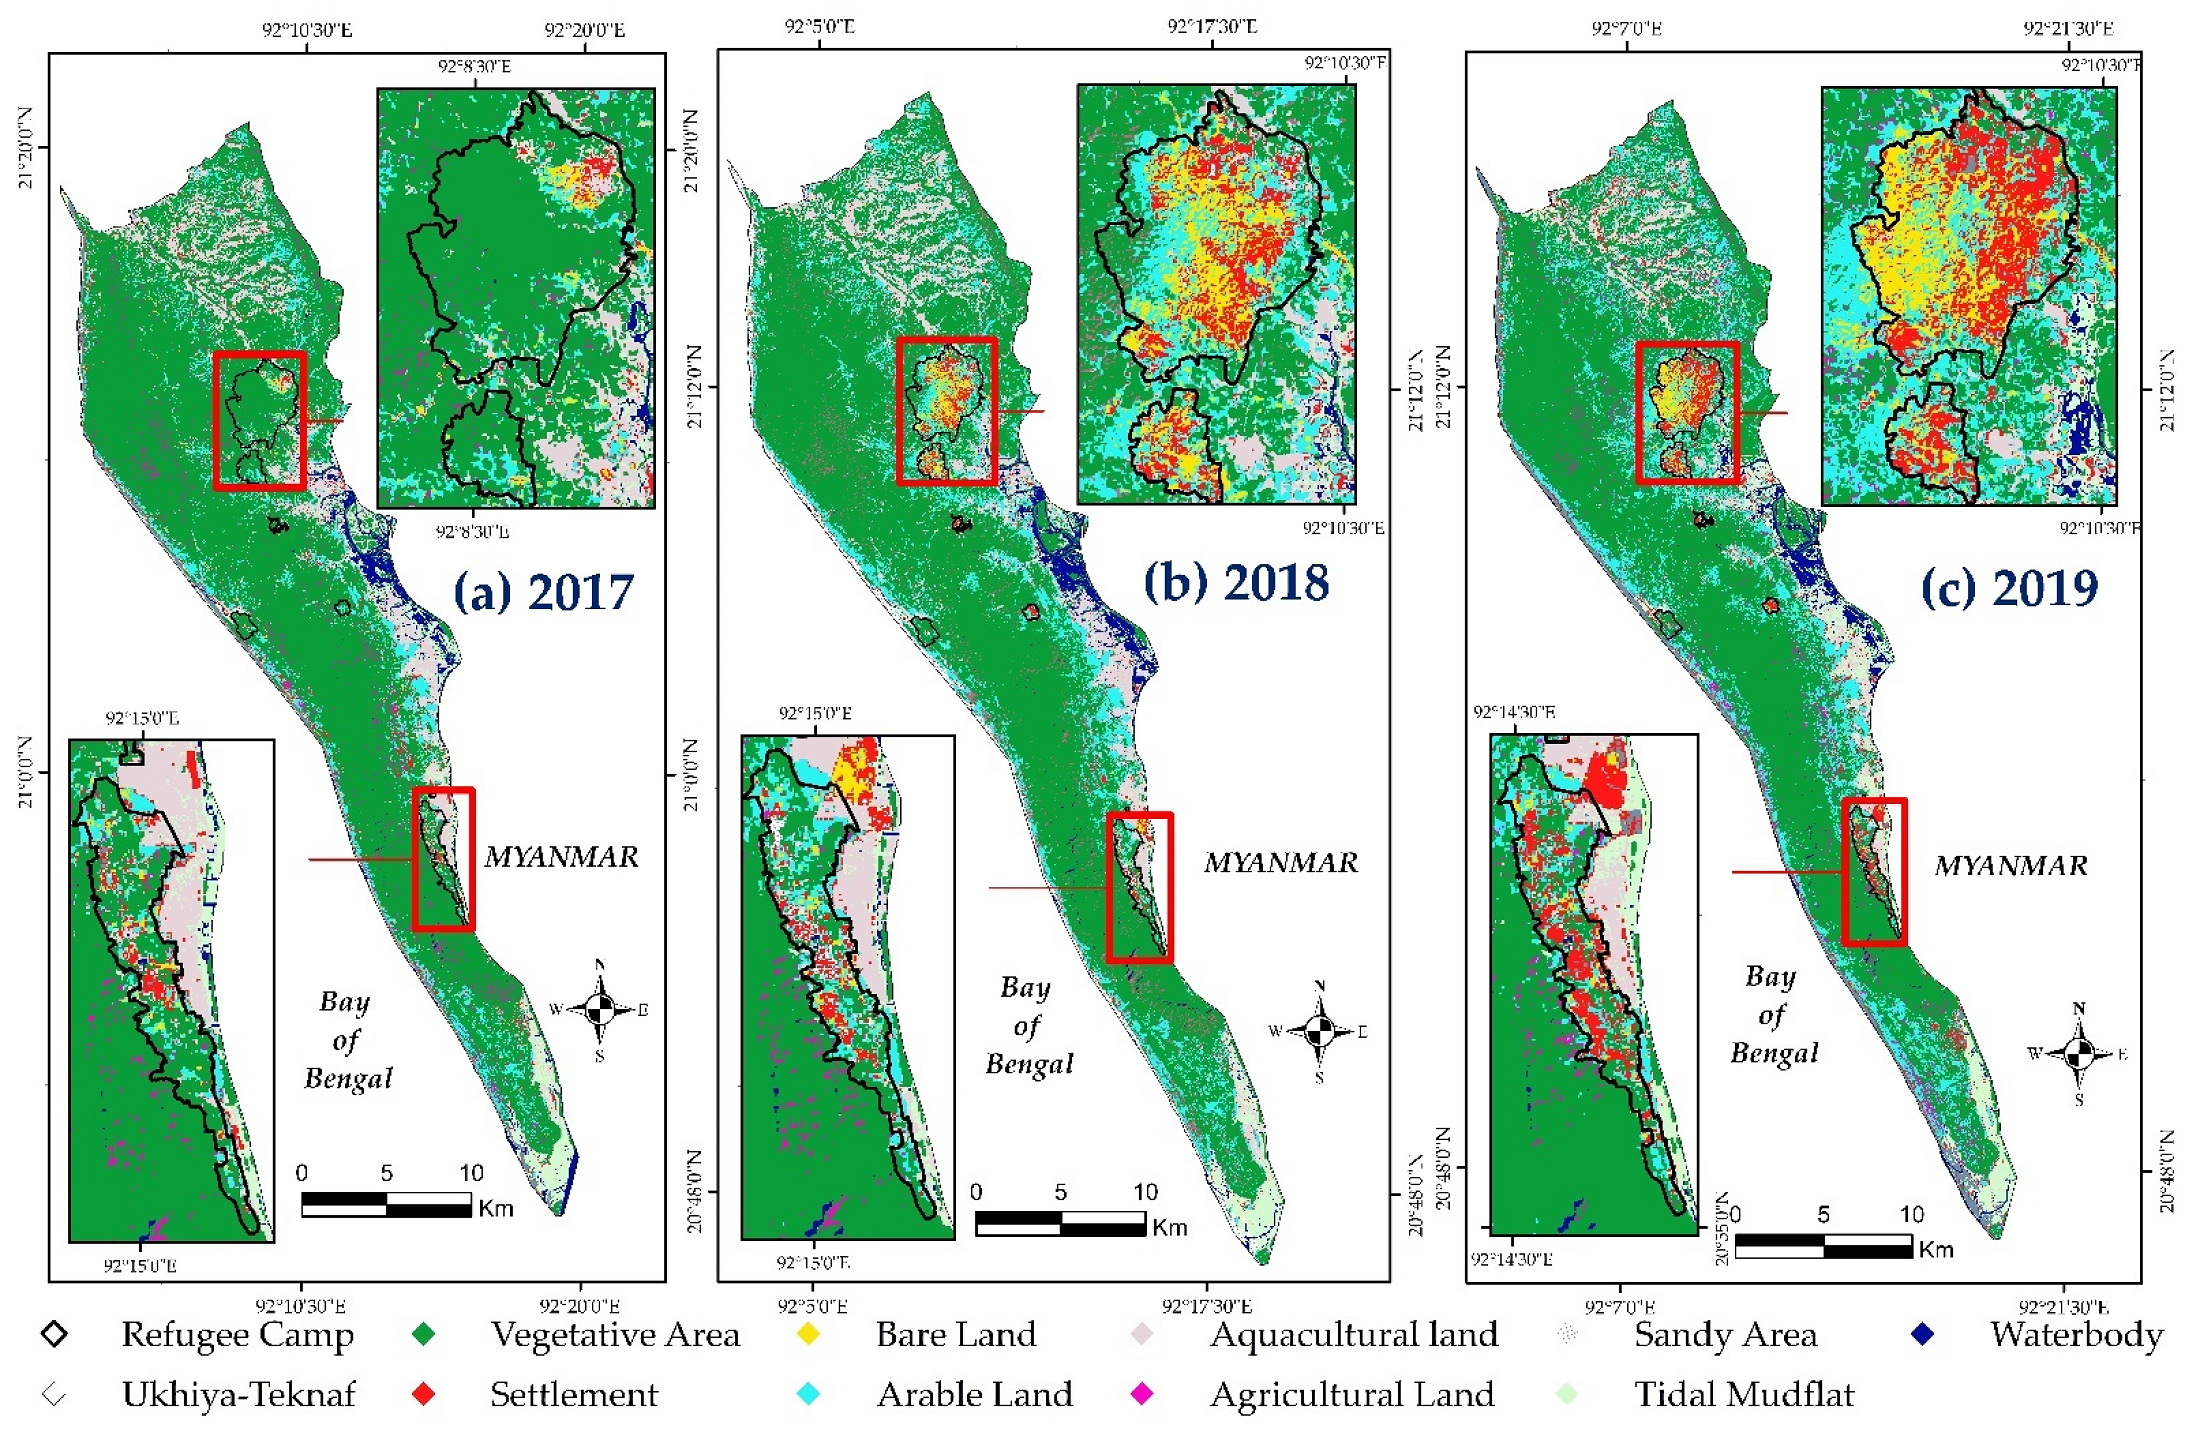

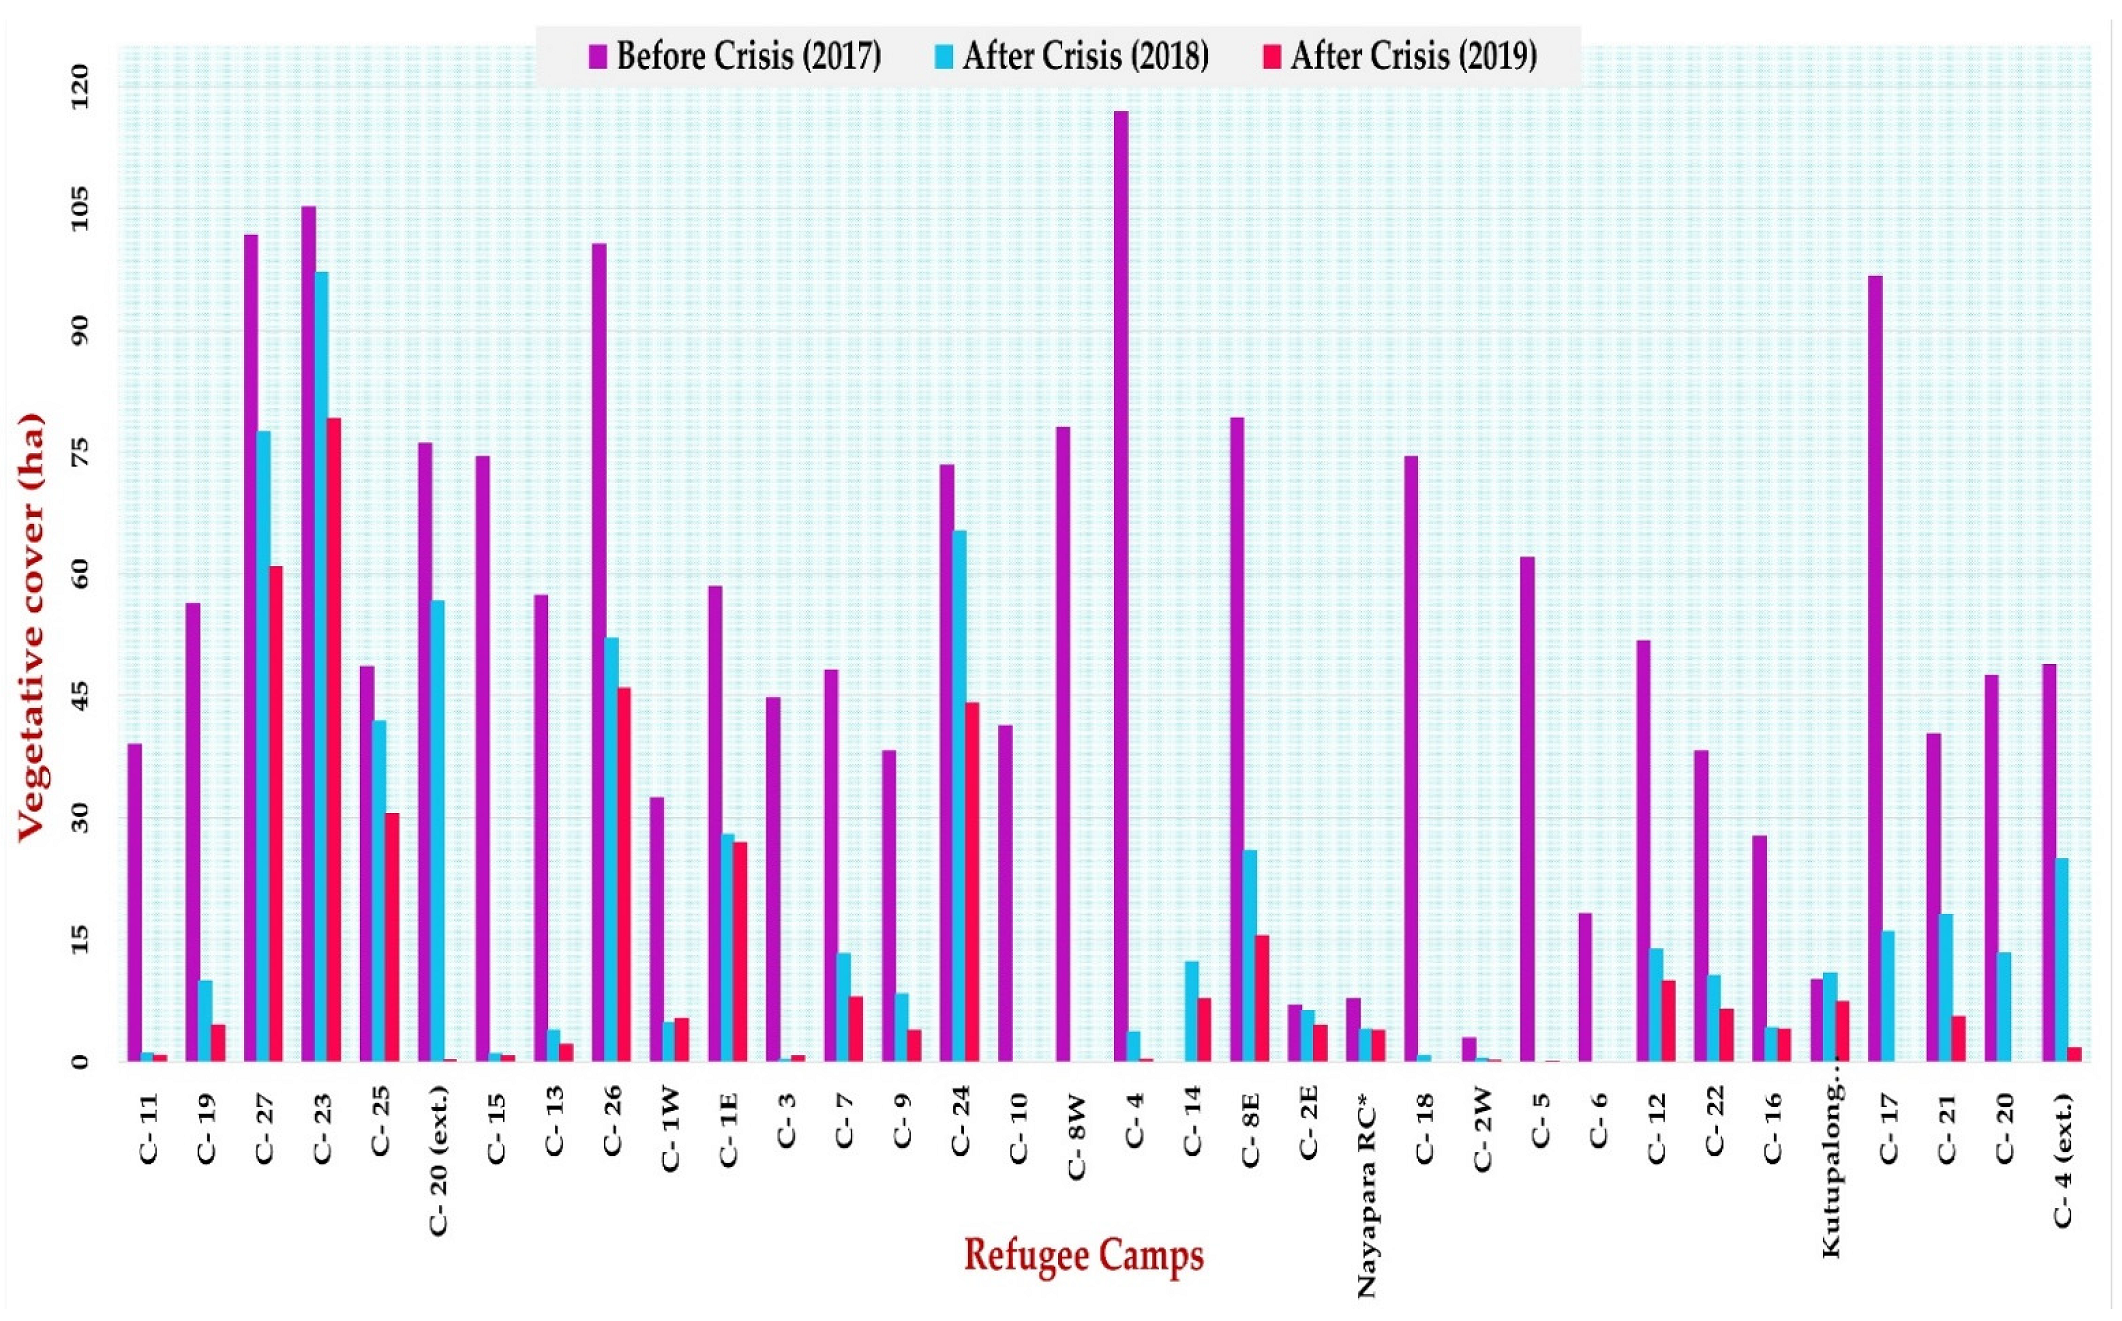


| Data | Acquired Date/Year | Producer |
|---|---|---|
| Landsat 8 (OLI/TRIS) | 27 January 2017 | USGS global land cover Facilities (http://glovis.usgs.gov/) accessed date 5 March 2019 |
| 3 January 2018 | ||
| 4 February 2019 | ||
| Geospatial data (Administrative boundary of Ukhiya-Teknaf, Camp location) | 2019 | Humanitarian Data Exchange (HDX) (https://data.humdata.org/) accessed date 15 April 2019 |
| Google Earth Historical Imageries | 13 February 2017,13 February 2018 | Digital Globe |
| Refugee Counts | ISCG, UNHCR,2017, 2018, and 2019 | United Nation (UN) (https://www.unhcr.org/) accessed date 20 April 2019 |
| Vegetation Area Counts | Classified Image of 2017, 2018, and 2019 | Support Vector Machine (SVM) Supervised Classification |
| N | Land Cover Type | Description |
|---|---|---|
| 1 | Vegetation | Scattered forest, mixed forest, sparse low-density forest, degraded forest, the mix of trees and other natural grass covers, homestead vegetation. |
| 2 | Agricultural land | Wet and dry crop fields, paddy fields, fallow lands. |
| 3 | Aquaculture land | Marine aquaculture, brackish water shrimp farming area containing saline. |
| 4 | Settlement | Isolated and clustered small and large buildings, roads. |
| 5 | Water-bodies | Rivers, canals, permanent open water, ponds, reservoirs. |
| 6 | Arable land | Land capable of being ploughed, pasture land, temporary fallow land. |
| 7 | Bare land | Exposed soils and barren areas influenced by human impact. |
| 8 | Sandy area | Land covered with sand, sea beaches. |
| 9 | Tidal mudflat | Coastal wetlands that form when the mud is deposited by tides. |
| LULC Classes | 2017 | 2018 | 2019 | |||
|---|---|---|---|---|---|---|
| PA (%) | UA (%) | PA (%) | UA (%) | PA (%) | UA (%) | |
| Vegetation | 98.92 | 97.58 | 98.99 | 98.99 | 100 | 99.39 |
| Settlement | 95.59 | 98.48 | 76.38 | 97.98 | 94.49 | 92.31 |
| Water-body | 99.8 | 99.8 | 100 | 100 | 100 | 99.57 |
| Agricultural land | 84.62 | 92.63 | 93.92 | 93.92 | 93.33 | 100 |
| Aquaculture | 98.46 | 99.22 | 99.1 | 100 | 95.83 | 96.99 |
| Arable land | 100 | 97.92 | 100 | 94.81 | 100 | 98.77 |
| Tidal mudflat | 99.11 | 99.11 | 99.69 | 100 | 96.54 | 96.88 |
| Sandy area | 100 | 99.3 | 99.74 | 95.98 | 97.75 | 98.09 |
| Bare land | 94.12 | 100 | 99.07 | 100 | 98.02 | 99.5 |
| Overall Accuracy | 98.51% | 98.16% | 96.36% | |||
| Kappa Coefficient | 0.98 | 0.97 | 0.98 | |||
| LULC Classes | 2017–2018 | 2018–2019 | 2017–2019 | |||
|---|---|---|---|---|---|---|
| Area | % | Area | % | Area | % | |
| Vegetative | −3359 | −8.58 | −2123.2 | −5.93 | −5482.2 | −14 |
| Settlement | 356.9 | 27.02 | 1079.4 | 64.33 | 1436.3 | 108.74 |
| Waterbody | 9.5 | 0.61 | −134 | −8.51 | −124.5 | −7.96 |
| Agricultural Land | 419.7 | 34.4 | −189 | −11.53 | 230.7 | 18.91 |
| Aquaculture land | 81.9 | 1.41 | −2840.2 | −48.28 | −2758.3 | −47.55 |
| Arable land | 2670.8 | 55.88 | 2194.4 | 29.46 | 4865.2 | 101.8 |
| Tidal mudflat | −683.4 | −25.91 | 1563.4 | 80.01 | 880 | 33.36 |
| Sandy area | 238.8 | 28.5 | 338.4 | 31.43 | 577.2 | 68.89 |
| Bare land | 264.9 | 70.15 | 111 | 17.28 | 375.9 | 99.55 |
| LULC Classes | 2017 (ha) | (%) | 2019 (ha) | (%) | Class Change (ha) | Growth/Decline Rate (%) | Net Change in Camp Area (ha) |
|---|---|---|---|---|---|---|---|
| Vegetative | 1866.33 | 74.36 | 381.33 | 15.19 | −1485 | −79.57 | −1502.6 |
| Settlement | 100.62 | 4.01 | 822.06 | 32.75 | 721 | 717 | 729.99 |
| Non-Vegetative | 543.06 | 21.64 | 1306.62 | 52.06 | 763 | 958.93 | 760.89 |
| Cluster | 2017 (Mean) | 2018 (Mean) | 2019 (Mean) | Average (Mean) | Clustering Vector |
|---|---|---|---|---|---|
| 2 | −0.31 | 2.22 | 2.05 | 1.32 | Camp23, Camp27, Camp25, Camp20 (extension) |
| 1 | 3.21 | −0.42 | −0.34 | 0.82 | Camp19, Camp11 |
| 3 | −0.19 | −0.30 | −0.28 | −0.26 | Camp 1E, Camp 1W, Camp 2E, Camp 2W, Camp 3, Camp 4, Camp 4 (extension), Camp 5, Camp 6, Camp 7, Camp 8E, Camp 8W, Camp 9, Camp 10, Camp 12, Camp 13, Camp 14, Camp 15, Camp 16, Camp 17, Camp 18, Camp 20, Camp 21, Camp 22, Camp 24, Camp 26, Nayapara-RC, and Kutupalong-RC |
Publisher’s Note: MDPI stays neutral with regard to jurisdictional claims in published maps and institutional affiliations. |
© 2021 by the authors. Licensee MDPI, Basel, Switzerland. This article is an open access article distributed under the terms and conditions of the Creative Commons Attribution (CC BY) license (https://creativecommons.org/licenses/by/4.0/).
Share and Cite
Karim, M.F.; Zhang, X. Analysis of Vegetative Cover Vulnerability in Rohingya Refugee Camps of Bangladesh Utilizing Landsat and Per Capita Greening Area (PCGA) Datasets. Remote Sens. 2021, 13, 4922. https://doi.org/10.3390/rs13234922
Karim MF, Zhang X. Analysis of Vegetative Cover Vulnerability in Rohingya Refugee Camps of Bangladesh Utilizing Landsat and Per Capita Greening Area (PCGA) Datasets. Remote Sensing. 2021; 13(23):4922. https://doi.org/10.3390/rs13234922
Chicago/Turabian StyleKarim, Md Fazlul, and Xiang Zhang. 2021. "Analysis of Vegetative Cover Vulnerability in Rohingya Refugee Camps of Bangladesh Utilizing Landsat and Per Capita Greening Area (PCGA) Datasets" Remote Sensing 13, no. 23: 4922. https://doi.org/10.3390/rs13234922
APA StyleKarim, M. F., & Zhang, X. (2021). Analysis of Vegetative Cover Vulnerability in Rohingya Refugee Camps of Bangladesh Utilizing Landsat and Per Capita Greening Area (PCGA) Datasets. Remote Sensing, 13(23), 4922. https://doi.org/10.3390/rs13234922


