Article

Attention-Guided Siamese Fusion Network for Change Detection of Remote Sensing Images

1
The Key Laboratory of Intelligent Perception and Image Understanding of Ministry of Education, School of Artificial Intelligence, Xidian University, Xi’an 710071, China
2
General Design Department No. 5, Xi’an Electronic Engineering Research Institute, Xi’an 710071, China
3
National Key Laboratory of Science and Technology on Remote Sensing Information and Image Analysis, National Nuclear Corp Beijing Research Institute of Uranium Geology, Beijing 100029, China
*
Author to whom correspondence should be addressed.
Remote Sens. 2021, 13(22), 4597; https://doi.org/10.3390/rs13224597
Submission received: 6 October 2021 / Revised: 3 November 2021 / Accepted: 9 November 2021 / Published: 16 November 2021

Abstract

:
Change detection for remote sensing images is an indispensable procedure for many remote sensing applications, such as geological disaster assessment, environmental monitoring, and urban development monitoring. Through this technique, the difference in certain areas after some emergencies can be determined to estimate their influence. Additionally, by analyzing the sequential difference maps, the change tendency can be found to help to predict future changes, such as urban development and environmental pollution. The complex variety of changes and interferential changes caused by imaging processing, such as season, weather and sensors, are critical factors that affect the effectiveness of change detection methods. Recently, there have been many research achievements surrounding this topic, but a perfect solution to all the problems in change detection has not yet been achieved. In this paper, we mainly focus on reducing the influence of imaging processing through the deep neural network technique with limited labeled samples. The attention-guided Siamese fusion network is constructed based on one basic Siamese network for change detection. In contrast to common processing, besides high-level feature fusion, feature fusion is operated during the whole feature extraction process by using an attention information fusion module. This module can not only realize the information fusion of two feature extraction network branches, but also guide the feature learning network to focus on feature channels with high importance. Finally, extensive experiments were performed on three public datasets, which could verify the significance of information fusion and the guidance of the attention mechanism during feature learning in comparison with related methods.

Graphical Abstract

1. Introduction

The development of remote sensing techniques increases the sensory ability of humans to their living environment without the limitations of space and time. Remote sensing sensors can be installed in satellites or airplanes to obtain multi-scale observation data of the Earth’s surface to satisfy the different requirements of some applications. Identifying changes in our living environment using remote sensing data is a necessary task for humans. With the rise of artificial intelligence, change detection in remote sensing images is becoming the most common technology, surpassing human detection. Monitoring the development of urban areas is currently the biggest application area of change detection, by which unapproved construction projects, changes in land use and development trends of urban areas can be obtained. In [1], the authors propose the use of a classification method combined with spectral indices of some common landcovers to identify trends in urban growth. In [2], the authors propose the use of the landcover classification method to achieve the three levels of urban change detection, namely, pixel level, grid level and city block level. The assessment of post-disaster damage is also a significant application of change detection. As with earthquakes, floods and debris flow, disasters can evoke a huge change in landscapes. The change detection technique could quickly and precisely find changes in a landscape to provide powerful support for relief workers [3,4]. In addition, the change detection technique can also be applied in environmental monitoring, such for oil spills in the ocean and industrial pollution. In [5], the authors provide a review of change detection methods in ecosystem monitoring. Although multiple change detection methods have been tested and applied in many real applications, a long research period is still required for wide and credible applications of change detection in realistic situations.
There are many intrinsic factors that disturb the application of change detection methods to real problems. Although we know that the aim of change detection is the quantitative analysis and determination of surface changes from remote sensing images over multiple distinct periods, this research direction is not an easy subject due to inherent problems with remote sensing images. First, remote sensing images contain too many classes of landcover, and there is significant similarity between classes and diversity in the same class. Second, remote sensing images obtained from different remote sensors may be distinct due to the interference of the sensing system or imaging environment. Furthermore, the presentation of the same landcover, such as vegetation, varies with the seasons. The above reasons make it difficult to distinguish real changed landcovers from unchanged landcovers.
In recent decades, many researchers have proposed change detection methods to push the technological development of this domain via different technical routes. Due to the variety of change detection methods, there are many different criteria of group change detection methods [6,7,8,9]. In [9], according to the research element, change detection methods can be segmented into pixel- and object-based methods. Pixel-based methods are classical change detection methods, where each pixel is treated as a basic analysis unit. There are abundant pixel-based methods, such as unsupervised direct comparison methods [10], transformation methods [11,12,13,14], classification-based methods [15,16] and machine learning-based methods [17,18,19]. Pixel-based methods usually suffer from noise effects, leading to isolated changed results, and the deficiency of contextual information gives rise to many challenges in pixel-based methods for very high resolution (VHR) imagery [9,20,21]. Object-based methods first divide the remote sensing images into a group of objects as the analysis unit for the next processing step, which can deal with the above problems of pixel-based methods to a certain degree [22,23]. Object-based methods can be divided into post-classification comparison methods [24,25] and multitemporal images object analysis methods [26,27], which also suffer from problems such as the effect of segmentation/classification results and the limitation of object representation features [28]. Aiming to overcome the weaknesses of pixel- and object-based methods, several hybrid methods are proposed [29,30,31].
As the proposed method is a pixel-based method, here, we focus on pixel-based methods. The processing of change detection should be divided into four common procedures, namely, preprocessing, feature learning, the generation of different maps and the generation of binary change detection maps. The change detection results can be obtained by using change vector analysis (CVA) [32,33], fuzzy c-means Clustering [34] or Markov Random Field [35,36], etc. Among the above procedures, feature learning has been the focus of more research than other methods. The goal of feature learning in change detection is to find an appropriate feature representation space in which the difference between changed pixel pairs and unchanged pixel pairs is more obvious than in the original feature space. Transformation methods, such as principal component analysis (PCA) [13], independent component analysis (ICA) [37] and multivariate alteration detection (MAD) [38], have been successfully applied for change detection. However, these methods are too simple for real change detection requirements. In [39], slow feature analysis (SFA) can suppress the difference in unchanged pixels by finding the most temporally invariant component. Additionally, dictionary learning and sparse representation are also applied to construct the final feature space [40].
Recently, the neural network has become the most important research topic in the information technology domain and has achieved remarkable effectiveness in machine vision [41,42,43]. In fact, neural network-based change detection methods also have proliferated in recent years [44,45,46,47], and the growth trend is obvious [8]. Unsupervised neural network-based change detection methods aim to reduce the distance between two temporal images’ feature spaces by using a neural network to learn new feature spaces [44,45,46,47,48,49,50]. Considering the power of label information for change detection, many unsupervised methods introduce some pseudo-label information obtained by pre-classification methods into the feature learning network, to improve the discriminant ability of the new feature space [45,46,49,50].
Although unsupervised methods cannot consider the data annotation problem, the obtained change detection results are difficult to use in real applications, where too many unconcerned change types are detected.
In contrast to unsupervised methods, supervised neural network-based methods utilize label information to improve the final classification, which only focuses on distinguishing specific change types from a whole scene. For this kind of method, change detection is mainly treated as a pixel classification problem or semantic segmentation problem. In [51], a new GAN architecture based on W-Net is constructed to generate a change detection map directly from an input image pair. The combination of the spatial characteristics of convolutional networks and temporal characteristics of recurrent networks could improve the efficiency of high-level features for change detection [52,53,54]. The Siamese network structure is usually considered as the basic network structure to extract high-level features of temporal images [54,55,56]. In addition, the attentional mechanism [57] is also introduced to the neural network to improve its performance. In [58], authors combined the convolutional neural network with the CBAM attention mechanism to improve the performance of feature learning for SAR image change detection. In [59], based on the Unet++ framework, an up-sampling attention unit replaced the original up-sampling unit to enhance the guidance of attention in both the spatial space and channel space. However, these methods simply add an attentional block into the network similarly to common operations and do not generate a deep chemical reaction between the attentional mechanism and change detection.
In this paper, the attention-guided Siamese fusion network is proposed for the change detection of remote sensing images. Although the Siamese network structure can extract high-level features of two temporal images, respectively, which could preserve the feature integrality of each image, it ignores the importance of information interaction between those two feature flows during the feature learning process. However, verified by our experiments, this information interaction of feature flows can improve the final performance. Therefore, here, we dexterously combine an attention mechanism with our basic Siamese network, which not only places more focus on important features, but also realizes the information interaction of two feature flows. The innovations of our work can be summarized as three points.
(1)
The attention information fusion module (AIFM) is proposed. In contrast to common operations, which directly insert an attention block into a neural network to guide the feature learning process, ALFM utilizes an attention block as an information bridge of two feature learning networks to realize their information fusion.
(2)
Based on the ALFM structure and ResNet32, the attention-guided Siamese fusion network is constructed. The integration of multiple ALFMs can extend the influence of ALFM into a whole feature learning process and fuse the information of two feature learning network branches comprehensively and thoroughly.
(3)
We apply the attention-guided Siamese fusion network (Atten-SiamNet) to the change detection problem and experimentally validate the performance of the Atten-SiamNet-based change detection method.
The following contents are organized as follows. The second section provides a detailed theoretical introduction of the proposed method. The third section shows the experiments designed to verify the availability and superiority of the proposed method. The final section is a conclusion of this work.

2. The Proposed Method

In the proposed change detection framework, two different temporal images for a certain area are discussed to detect the changes between them, which are denoted as I_1 and I_2, with the size as H × W. To train the fusion network, some pixels are labeled as changed or unchanged to construct the training sample set, such as D t r a i n = { ( x 1 , y 1 , l 1 ) , ( x 2 , y 2 , l 2 ) , , ( x n , y n , l n ) } , where x i and y i represent the row- and column-coordinates of the i-th training sample, respectively, and l i { 0 , 1 } is the label; 0 denotes an unchanged pixel, and 1 denotes a changed pixel. The rest of the pixels of the image pair are treated as the testing set for the fusion network. After the training and testing processes, the probability of each index being a changed pixel is obtained, which can also be denoted as a different map. The final change detection result can be easily achieved by using a simple method to split the different map into a changed pixel set and an unchanged pixel set, such as threshold segmentation.
Many abbreviations are used in this section to make the description more concise. Therefore, an abbreviations list is shown in Table 1 with their full descriptions.

2.1. Basic Siamese Fusion Network

ResNet is a classical network for classification, which demonstrates significant performance in many visual applications [60]. The most representative ResNet networks are ResNet50 and ResNet101, which involve a mass of parameters. Compared to the natural scene, the remote sensing scene is simpler, and the labeled samples are limited. Therefore, in our research work, one simple ResNet (ResNet32) structure was selected as the basic network framework. The specific structure of ResNet32 is shown in Table 2.
When the change detection problem is treated as a pixel classification problem, the simplest scheme is to treat the concatenation of the patch pair of the center pixel in the temporal images as the input, and the probability of being a changed pixel or an unchanged pixel as the output of the network. Here, ResNet32 was used as the network of feature learning and classification, of which a simple schematic diagram is shown in Figure 1. This change detection method is denoted as ResNet-CD.
In ResNet-CD, the information of two temporal images is fused before feature extraction processing, which is the common operation of data-level fusion. Based on this fusion, the following feature learning procedure is primitive, where the intrinsic difference is not considered. As we know, information fusion can be divided into three levels, namely, data-level fusion, feature-level fusion and decision-level fusion [61]. For change detection, decision-level fusion is not possible as there is only one output of two input images. Therefore, feature-level fusion is another selectable method, which could also conduct feature extraction for two input images and fuse their high-level features.
The Siamese network structure is selected to satisfy the requirement of feature-level fusion in change detection. Different temporal images complete feature extraction from different network branches. After obtaining the high-level features, they are combined to import into a full connection layer, which maps features to two-dimensional output, indicating the probability of being changed or unchanged. The final change detection map is obtained by using the segmentation of the changed probability map. The basic Siamese fusion network for change detection is also built on the ResNet32, which is denoted as Siam-ResNet-CD. The structure schematic diagram of Siam-ResNet-CD is shown in Figure 2. The structures of these two network branches are consistent. The parameters of one branch are updated during the back-propagation processing, and another branch simply copies the parameters from that branch without any computation. In this situation, the network is symmetrical. There is another situation where the structure of the network is symmetrical, but the values of the parameters are not the same, and two branches are updated during back-propagation processing, which is called the Pseudo-Siamese network. In the experiment, we verified that the efficiency of the Siamese network was close to that of the Pseudo-Siamese network but had a lower computation cost. Therefore, in the proposed attention-guided Siamese fusion network, the real Siamese network is chosen as a basic network framework.

2.2. The Attention-Guided Siamese Fusion Network (Atten-SiamNet)

In Siam-ResNet-CD, although high-level features of two image patches from different temporal images are extracted to form the Siamese network, it is obvious that the two branches are totally isolated without any information interaction between them. In other words, the intrinsic differences of two temporal images are considered, but the correlation between them is not considered in Siam-ResNet-CD. The temporal images are different observations of an identical region; there must be a large amount of shared relevant information. Therefore, the correlation should not be ignored during feature learning processing.
Here, the attention mechanism is chosen to realize the interaction of two feature learning branches based on their correlation, and conducts information fusion throughout the whole feature learning process, not just the final step. The attentional mechanism has been widely used in deep learning to improve the final performance [59]. Through parameter learning, the attention block could adaptively compute the importance of feature channels to guide the learning processing to pay more attention to channels or positions with high importance scores. Aiming to realize the interaction, an attention block is inserted into Siam-ResNet-CD in an unfamiliar way to improve the final performance. The attention information fusion module is the key procedure, where feature flows influence each other, and more important features receive more attention during learning processing.

2.2.1. Attention Information Fusion Module (AIFM)

The attention information fusion module is constructed as an information bridge of two feature learning branches. The features obtained by two branches are inputted into one attention mechanism network. Then, the computation of the importance score of feature channels is the information fusion of two branches as the full connection layer maps whole features into a new space adaptively. Therefore, the final importance scores are not obtained from two feature branches in isolation; they are the information fusion results from two feature flows. This is why we denoted it as the attention information fusion module.
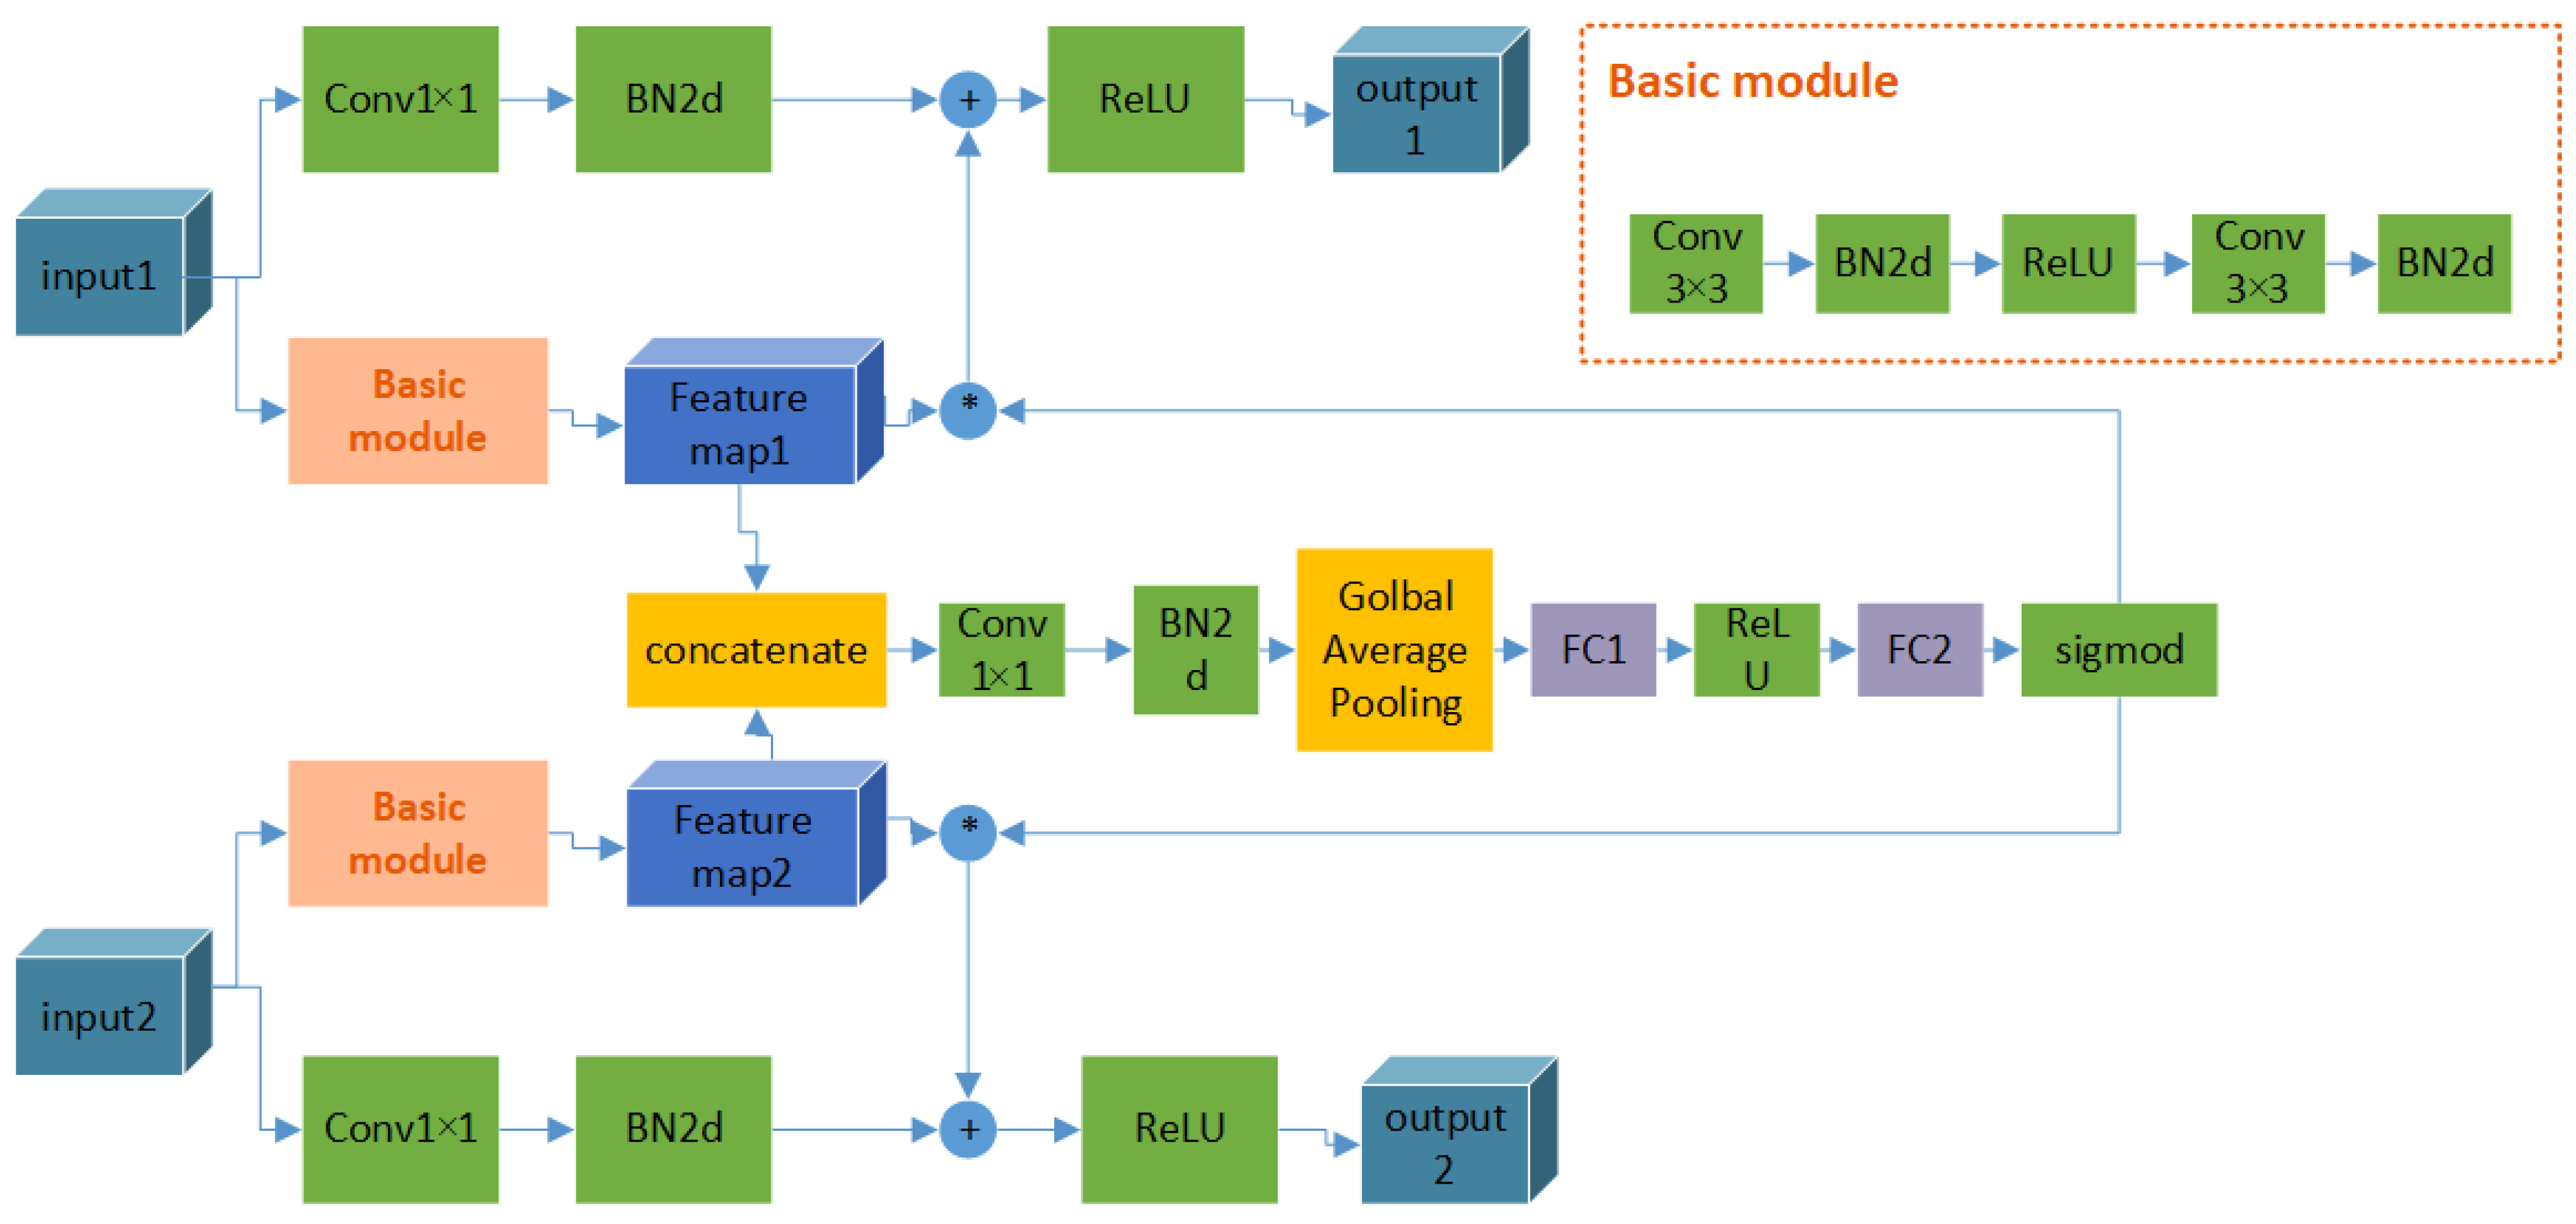
In this module, there are two inputs and two outputs, where the inputs are the feature blocks from the front feature extraction layer of two branches and the outputs are the inputs of the next feature extraction layer of two branches. The structure of the attention fusion block is related to the SE attention mechanism [62], which is well known and applied in computer vision. In Figure 3, the schematic diagram of the attention information fusion module is shown. This module is constructed on the basic residual module; two inputs obtained new feature maps through the basic module independently, these new feature maps are imported into the attention block. The concatenation first fuses the feature maps together, and two full connection layers combine two branch feature maps. Finally, through the Sigmod activation function, a vector in the range from 0 to 1 can be obtained, of which one element measures the importance of one feature map. These feature maps are multiplied by the vector, in which one feature map corresponds to one element. Then, the feature maps with more importance would be more valuable than other maps.
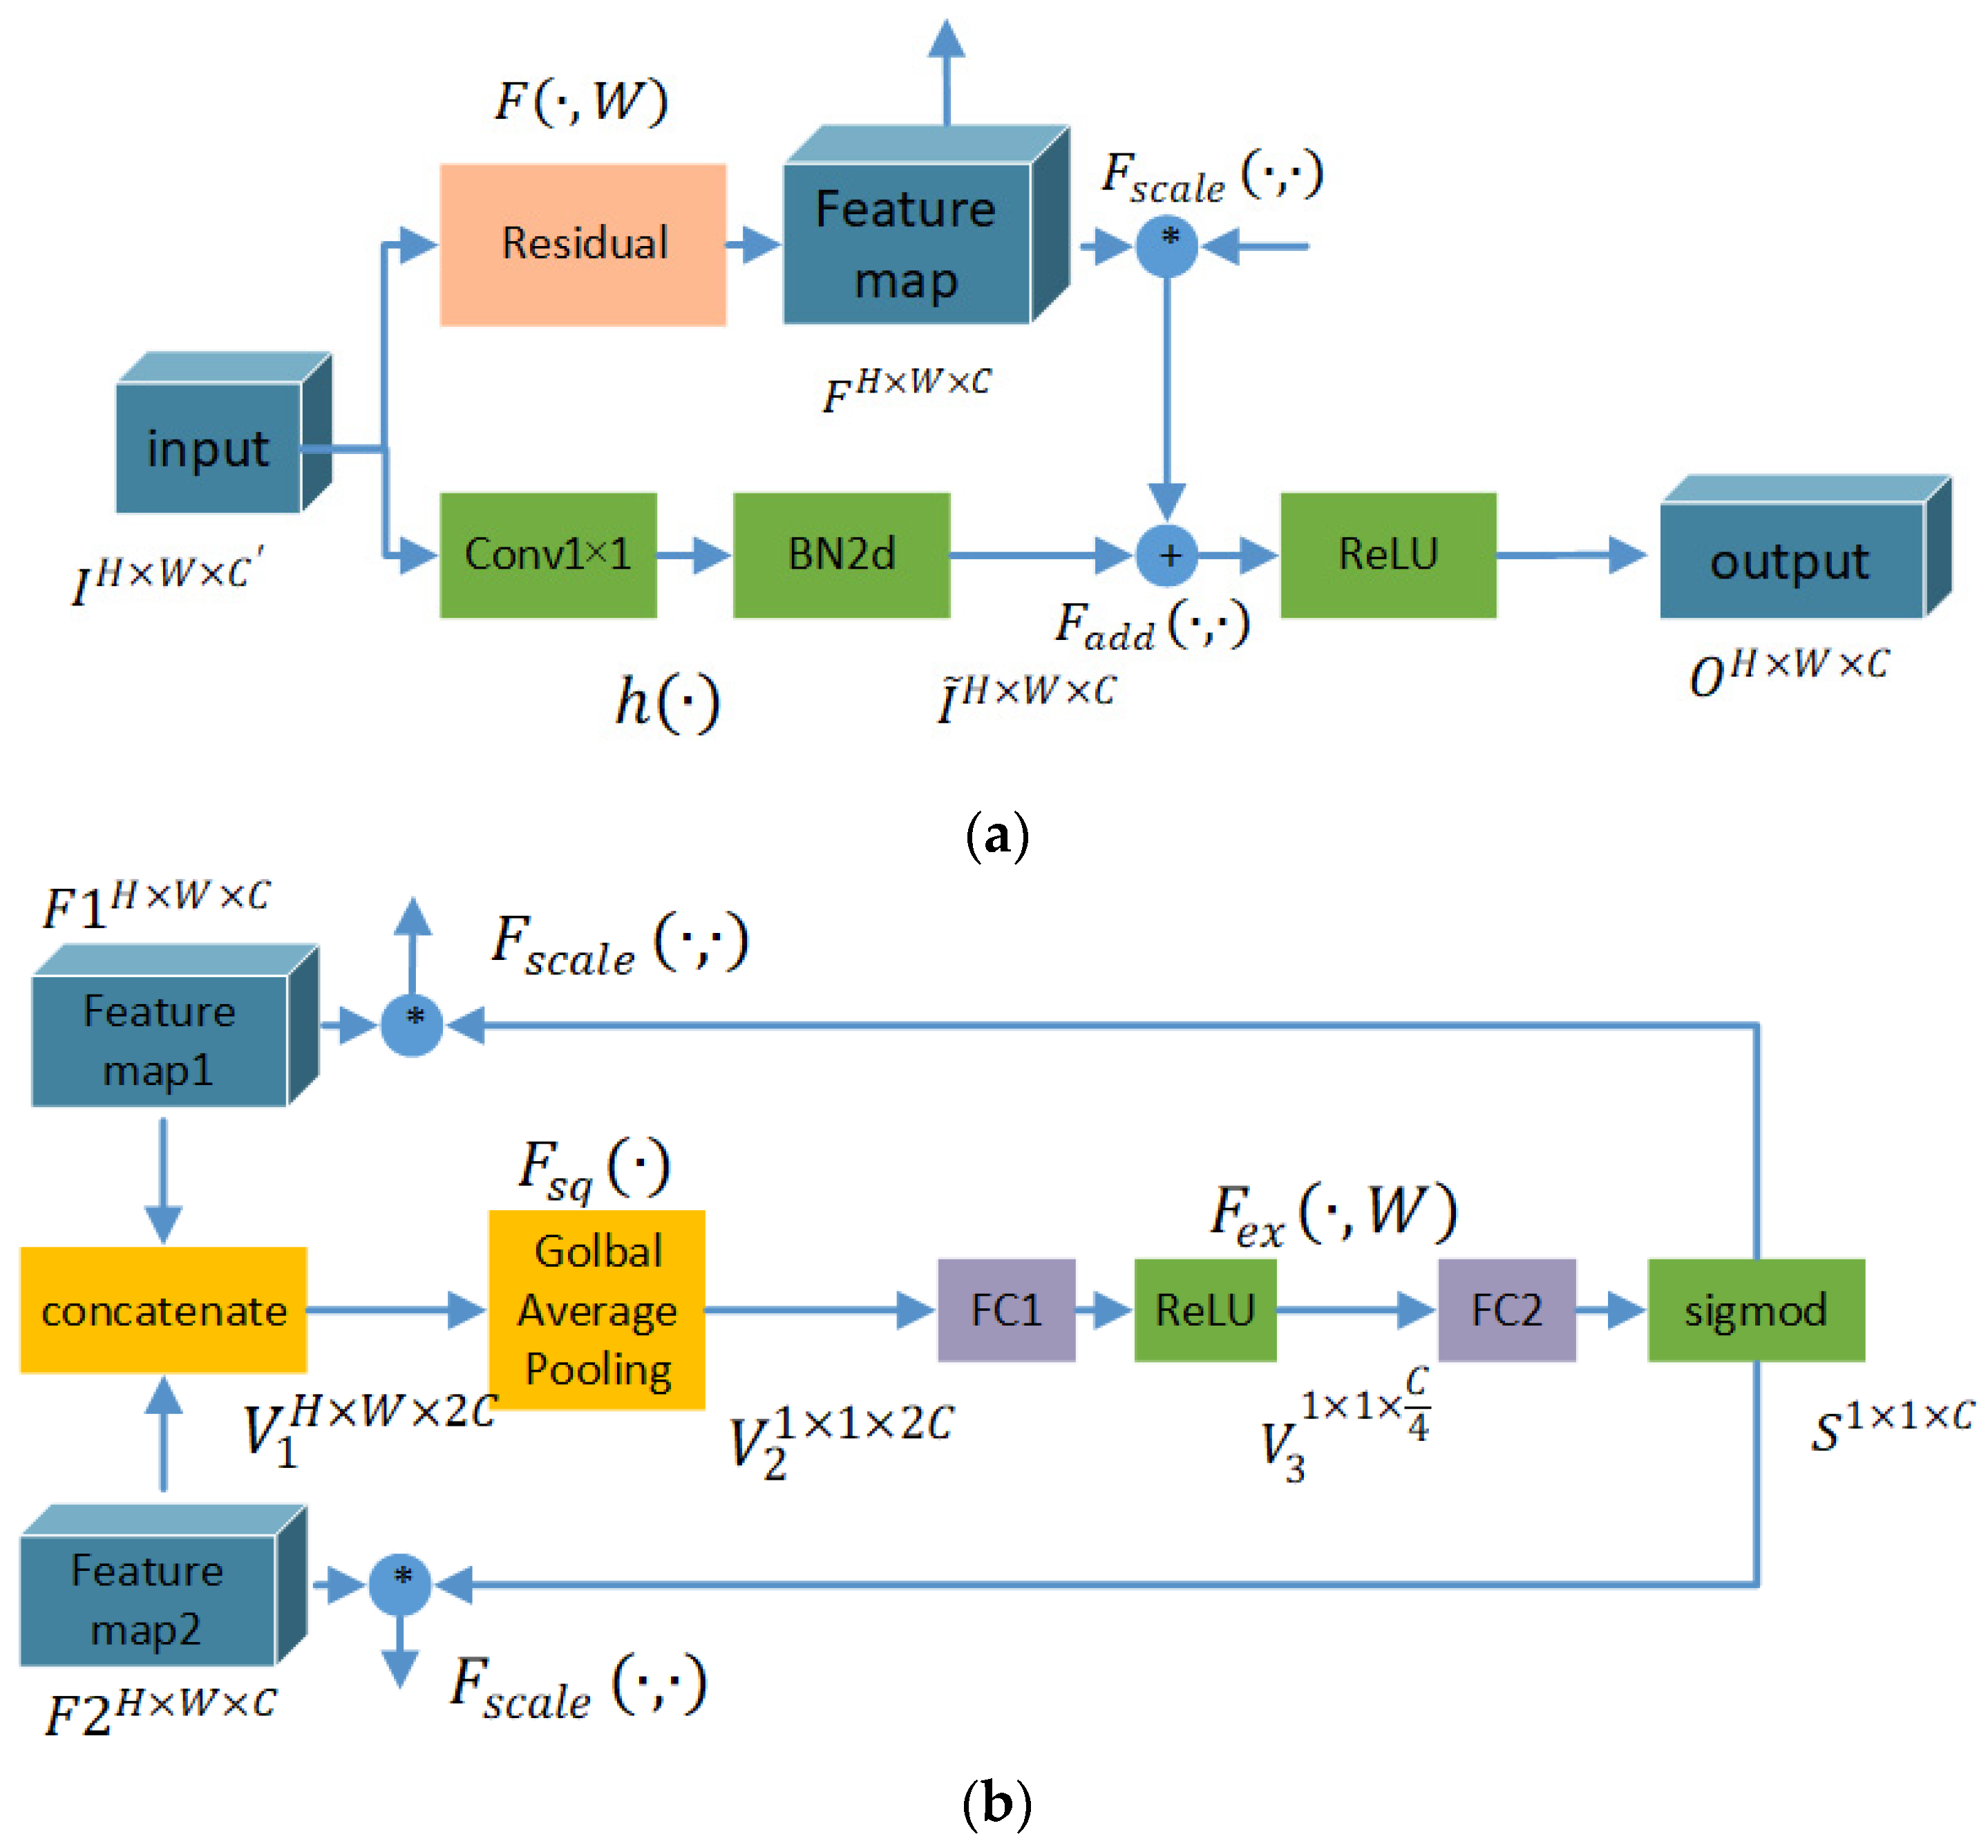
For a better understanding of this module, it can be divided into two parts, namely, the common residual part, shown in Figure 4a, and the attention fusion part, shown in Figure 4b. The common residual part assures the basic feature learning performance of each branch. As the traditional residual module, the feature map ( R H × W × C ) is entered into a convolutional residual neural network and mapped into an output feature map ( R H × W × C ). In the attention fusion part, the feature maps obtained by the convolutional neural network ( F ( · , W ) ) of the Siamese branch in the same layer, such as F 1 H × W × C and F 2 H × W × C , are entered and concatenated as whole feature maps ( V 1 H × W × 2 C ). Then, V 1 is squeezed into one sequence of 2C length through global average pooling. Furthermore, the excitation processing contains two full connection layers, of which the mapping function is denoted as f e x ( · , W ) . Through this processing, the connection of two branches is constructed and shrinks the length of the sequence from 2C to C. The output of excitation processing ( F s c a l e ( · , · ) ) fuses the information of the Siamese branches and displays the importance of the feature channel for the final task as a weight vector. The weights of each channel are fed back into the branches, respectively, to enhance the influence of the important channel and reduce the influence of the less important channel for the following feature extraction processing. The parameters of f e x ( · , W ) are adaptively learned from the training data, which reflect the information interaction of whole 2C channels. Through the attention information fusion module, the information interaction of two branches and the import of the attention mechanism are both completed.

2.2.2. Network Architecture of Atten-SiamNet-CD

Attention-guided Siamese fusion network-based change detection (Atten-SiamNet-CD) is a high-order version of Siam-ResNet-CD, as introduced clearly in Section 2.1. ResNet32 is also a basic network framework like Siam-ResNet-CD. Multiple AIFMs are integrated into the middle network part (Layer1, Layer2 and Layer3) of Siam-ResNet-CD. In ResNet 32, each layer contains 5 residual modules. In Atten-SiamNet-CD, five residual modules are replaced by five attention information fusion modules, as shown in Figure 5. Aiming to reduce the size of the feature map, the stride of the convolutional layer of Block 2 and Block 3 is set to 2, by which the output feature maps are reduced to one half of their original size.
Like other pixel-level change detection methods [18,19,20], the image patch (k × k) around the center pixel is sampled as the original feature of the center pixel. Compared with the signal pixel, image patches contain more structural information on the scene, which is beneficial for change detection. As shown in Figure 5, image patches of a certain pixel in two temporal images are inputted into the network in pairs. After the attention-guided Siamese fusion network, high-level features are extracted and mapped into the final labels, which indicates if the pixel pairs are changed or unchanged. One-hot encoding is used here, and the cross-entropy loss is used to measure the distance of the label and predicted label, and guide the learning processing. Training data are sampled from labeled data containing some changed pixels and unchanged pixels.
Two temporal remote sensing images are predicted through the trained attention-guided Siamese fusion network. The result can be represented as a tensor, D I   R H × W × 2 . The value of this tensor denotes the difference in the pixel pairs, where D I : , : , 1 is the probability of pixel pairs being changed and D I : , : , 2 is the probability of pixel pairs being unchanged. Furthermore, D I : , : , 1 and D I : , : , 2 are complementary, of which the sum is 1. Therefore, only D I : , : , 1 is used as the difference map in the following processing. Aiming to verify the feature learning performance of the attention-guided Siamese fusion network, the simple threshold segmentation method is used to obtain the final change detection results. These pixels, of which the difference values are larger than the threshold, are defined as changed pixels, and others are unchanged pixels. The threshold is set to be 0.6 based on multiple experiments.

3. Experimental Results

In the above section, the proposed attention-guided Siamese fusion network was clearly introduced. This section describes the many experiments that were designed to verify its performance—correctness and superiority. First, the datasets and experimental setting are introduced. The experimental analysis of important parameters is described. Finally, the experimental results of multiple change detection methods on experimental datasets are shown and analyzed to prove the superiority of the proposed method.

3.1. Introduction of Datasets and Experimental Setting

To ensure the equitability and reliability of the experimental results, temporal image pairs were selected to form three public change detection datasets. Ground truthing conducted by humans tends to mark the changes to nature made by humans, such as industrial development and housing construction, which is very important for urban development monitoring or the research of land use. Although there are multiple kinds of changes in one image pair, we focused only on labeled changes in the ground truthing and ignored unlabeled changes. In total, six image pairs were tested here, and the characteristics of each image pair varied considerably. In the following introductions, their characteristics are discussed.
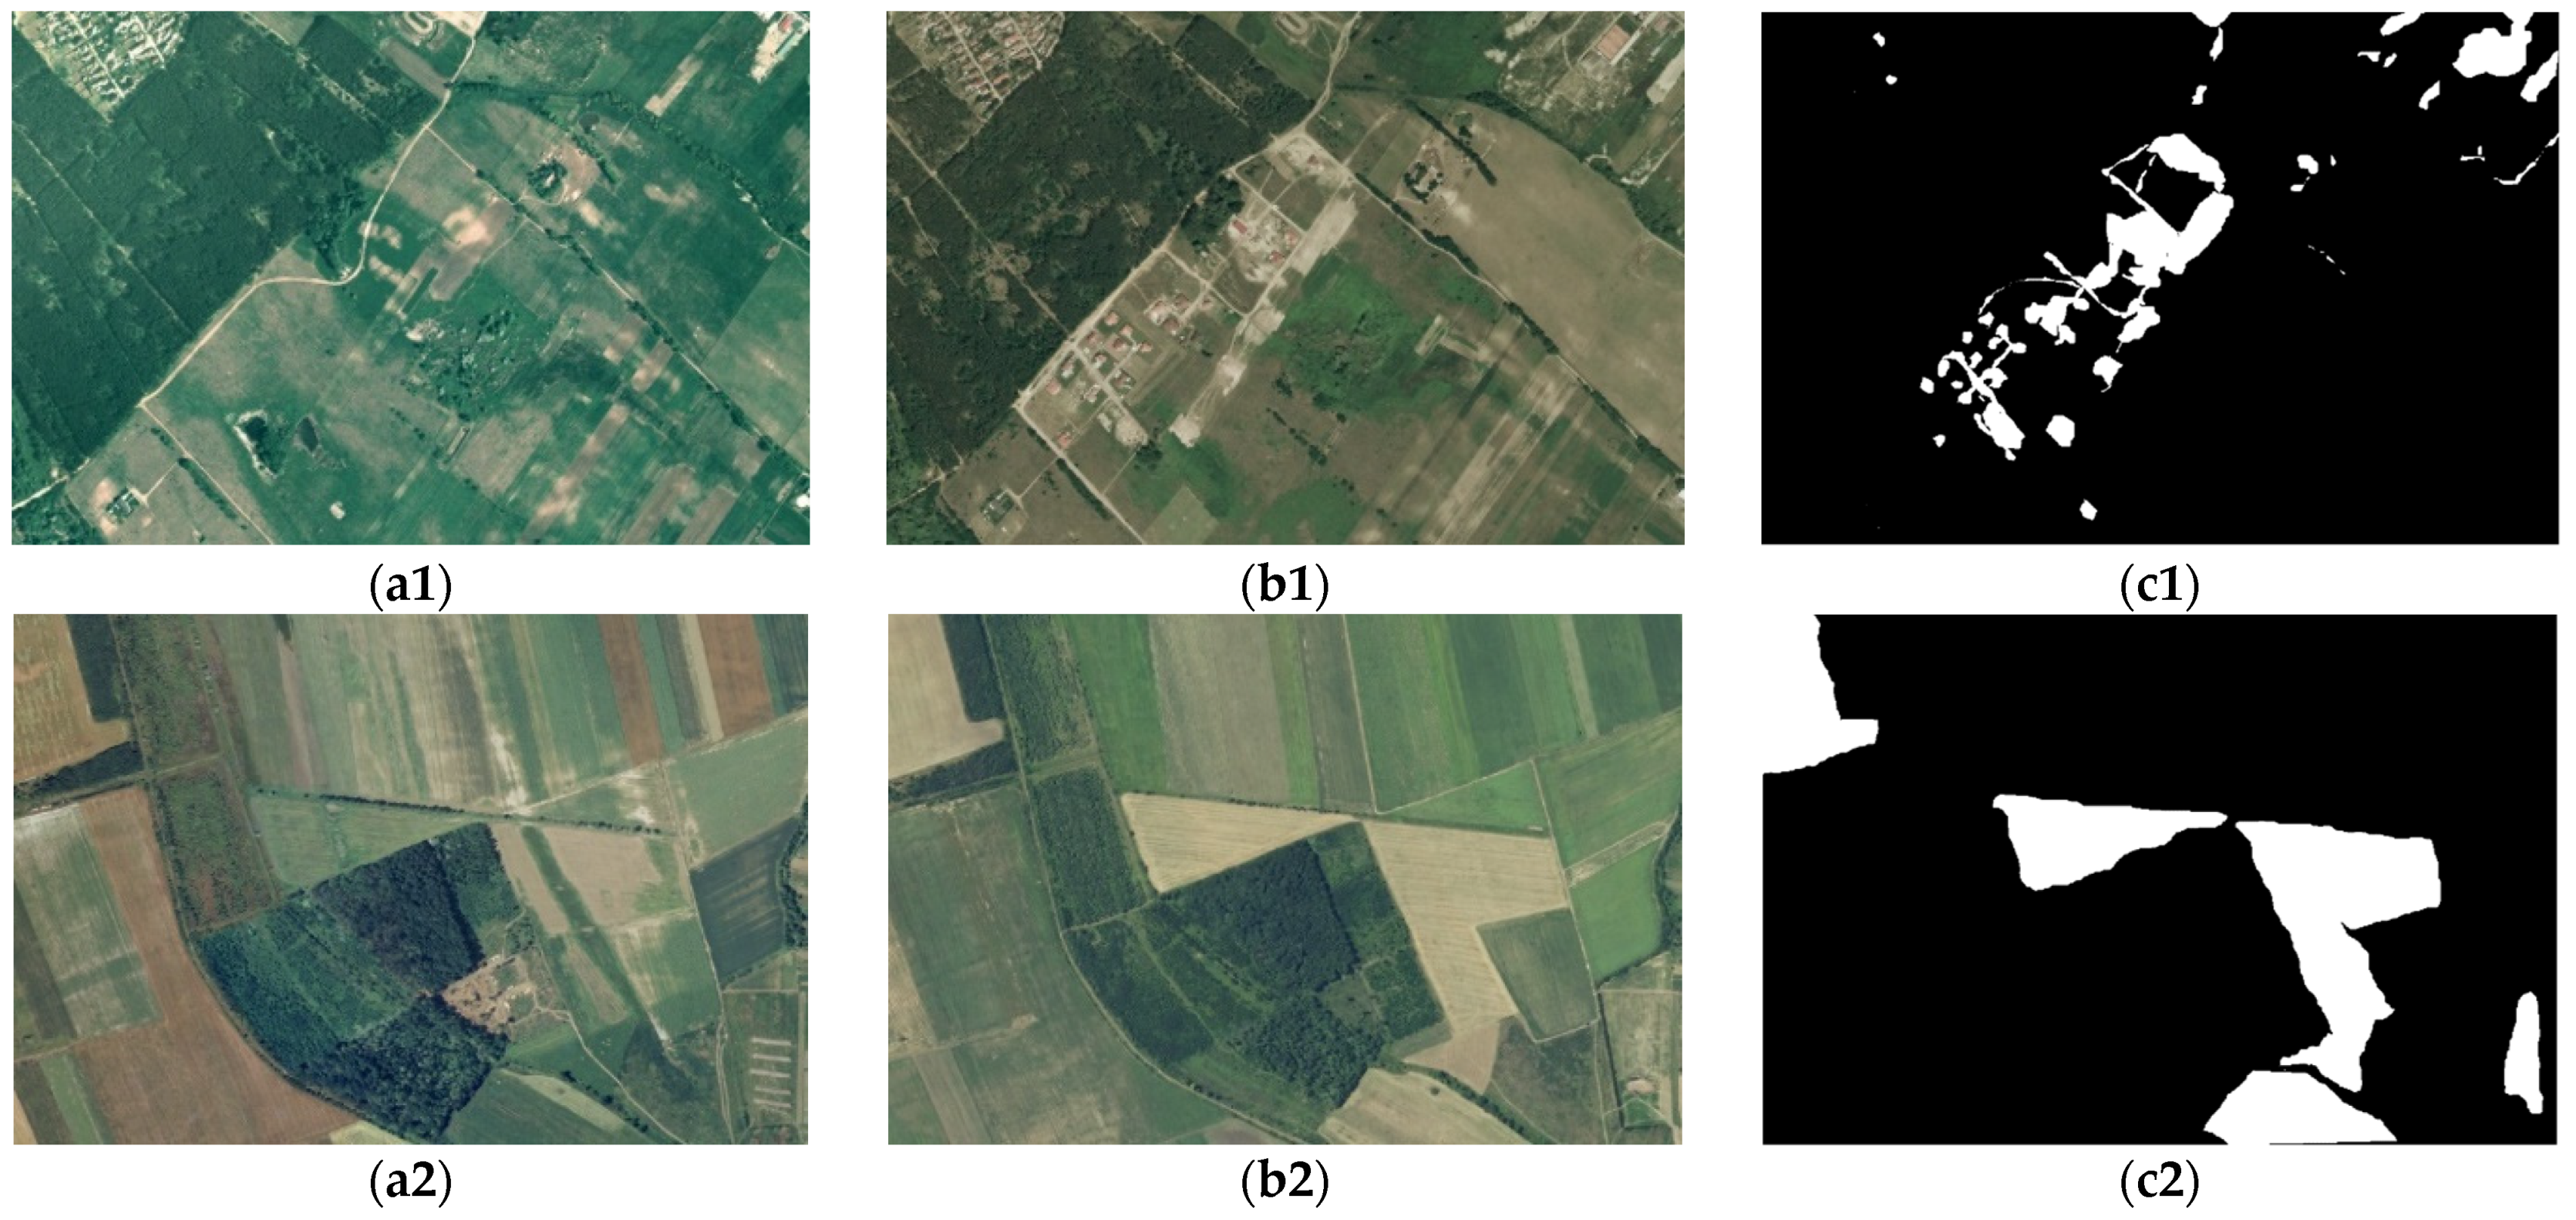
The first dataset was SZTAKI AirChange Benchmark, which contained 13 image pairs with sizes of 952 × 640. The spatial resolution of this dataset was 1.5 m, and the labels were manually annotated. The label information concentrated only on certain changes, such as new urban areas, construction sites, new vegetation and new farmland. However, the labels only indicated which pixels were changed or unchanged without the change class. In this experimental section, Szada/2 and Tiszadob/3 were chosen as experimental data, which are shown in Figure 6. Szada/2 and Tiszadob/3 both showed the change in vegetation areas. However, Szada/2 only labeled areas changing from vegetation to human-made ones, such as roads, buildings and places. Tiszadob/3 displayed the areas changing from one kind of vegetation to another, which is obvious in two images.
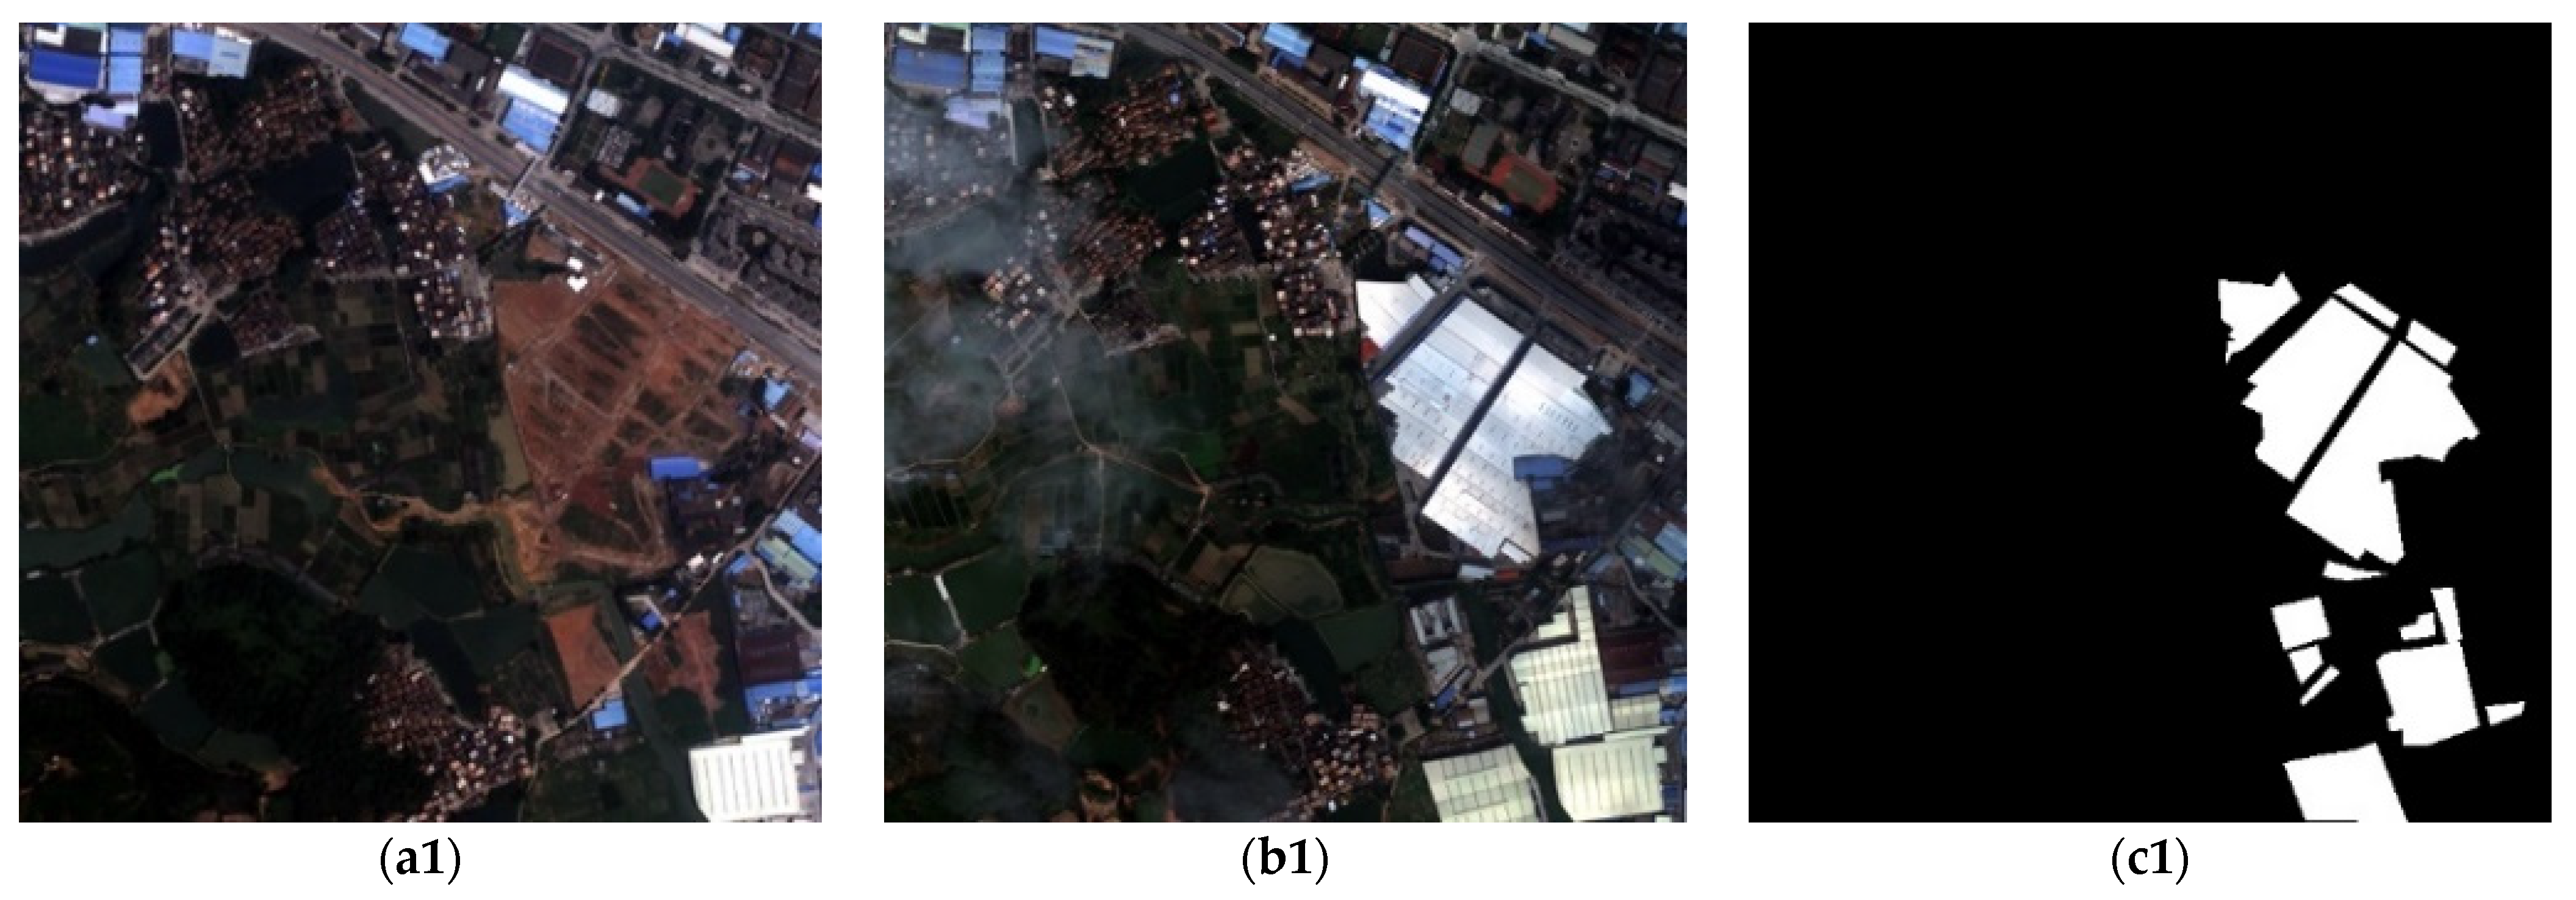
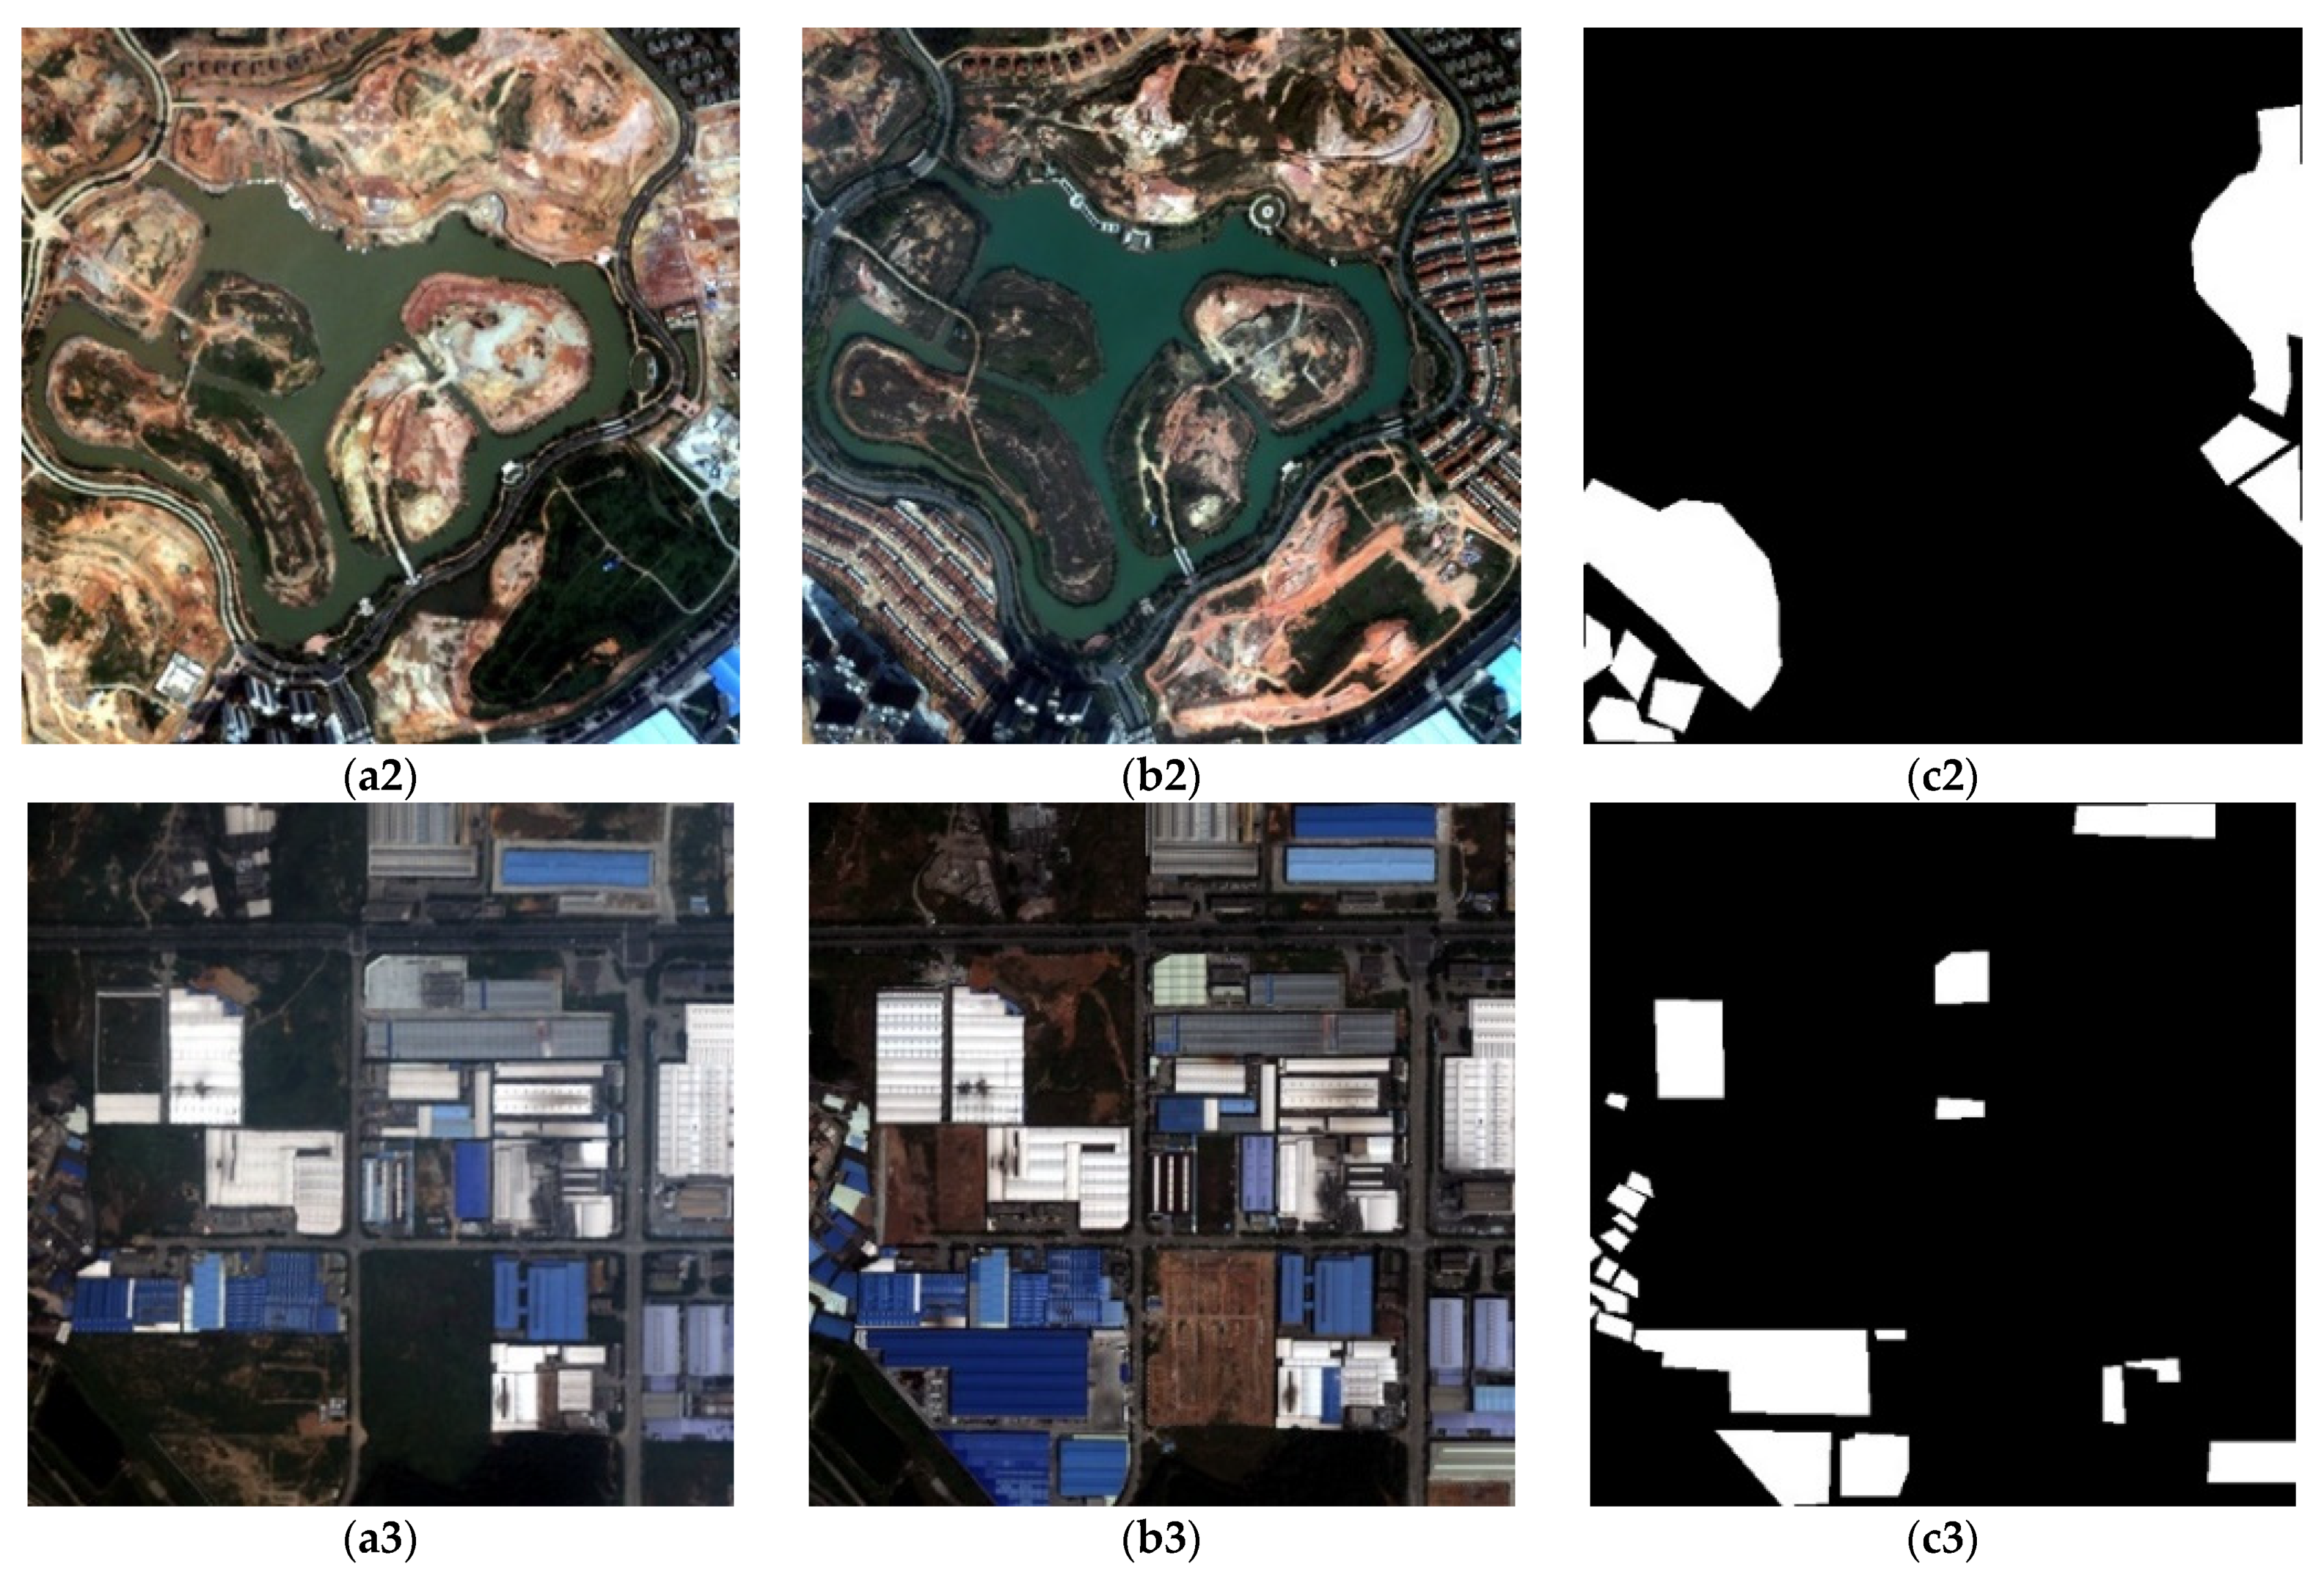
The second dataset was the QuickBird dataset provided by the Data Innovation Competition of Guangdong Government, which was captured in 2015 and 2017. In this experimental section, three image pairs were selected from this dataset, each of which contained 512 × 512 pixels. The source images contained four bands, which were converted to one-band images through the average of four-band images. Their schematic diagrams are shown in Figure 7. The ground truthing of these three image pairs showed an increase in buildings in the fixed area. QuickBird-1 and QuickBird-3 focused on the changes in factory buildings and ignored other changes. QuickBird-2 showed an increase in residential buildings around the lake. The structures of residential buildings and factory buildings were very different, and the original landcovers were also different.
The third dataset was made up of heterogeneous data captured from an optical sensor and SAR in Shu Guang village in 2012 and 2008. The size of data was 921 × 593 pixels. The labeled changed area was construction built on farmland. Their schematic diagrams are shown in Figure 8. In contrast to the above two datasets, both obtained by optical sensors, this dataset contained two kinds of remote sensing images. In the visual sense, there were huge differences between these two images. From the imaging mechanism, the information reflected by each pixel was also different. Therefore, overcoming the intrinsic difference of different data sources is a challenge of change detection.
For each image pair, the training data in experiments were sampled randomly from labeled data, where there were 400 changed pixel pairs and 1600 unchanged pixel pairs, from which image patch pairs around the center pixels were split from the original image pairs as the original features inputted into the neural network. The size of patches is one important factor that may affect the final performance. Here, 22 × 22 was chosen as the patch size based on experimental experience, which was confirmed in the subsequent experiments. During the model training processing, the initial learning rate was set to be 0.001 and reduced to 10% per 80 iterations. The total iteration was 200. The Adam method [63], which is the one of most famous optimization algorithms, was chosen to optimize the objective function. The initialization of the convolutional layer was applied by using the Kaiming initialization [64]. The scale factor and the shift factor were initialized as 1 and 0, respectively. The batch size was set to be 128. The final results shown in this section are the average of 10 random experiments. The experiments were built on PyTorch 0.4.1 version provided by Facebook AI Research and the Lenovo Y7000P with NVIDIA GeForce RTX2060.

3.2. Experiments about Network Architecture

In this subsection, the experiments that were designed for the verification are described, and the experimental results are shown and analyzed. The experiments were divided into two parts: first, the analysis of the influence of patch size on the change detection performance; second, the analysis of the difference between the Pseudo-Siamese structure and the Siamese structure.
Aiming to measure the performance of change detection results in all respects, five numerical indices were used in this section. Precision rate (Pre) denotes the ratio of real changed pixels to whole pixels in the predicted changed pixel set. Recall rate (Rec) denotes the ratio of predicted real changed pixels to the whole real changed pixels. Accuracy rate (Acc) denotes the ratio of pixels classified correctly to whole pixels, considered both changed pixels and unchanged pixels. The Kappa coefficient (Kappa) is a more reasonable classification index than Acc, in which the higher value represents a high classification result. The F1 coefficient is a harmonic mean of Pre and Rec, which contradict each other. Each index may concentrate on the performance of specific change detection methods, which may not be equitable.

3.2.1. Analysis of Image Patch Size

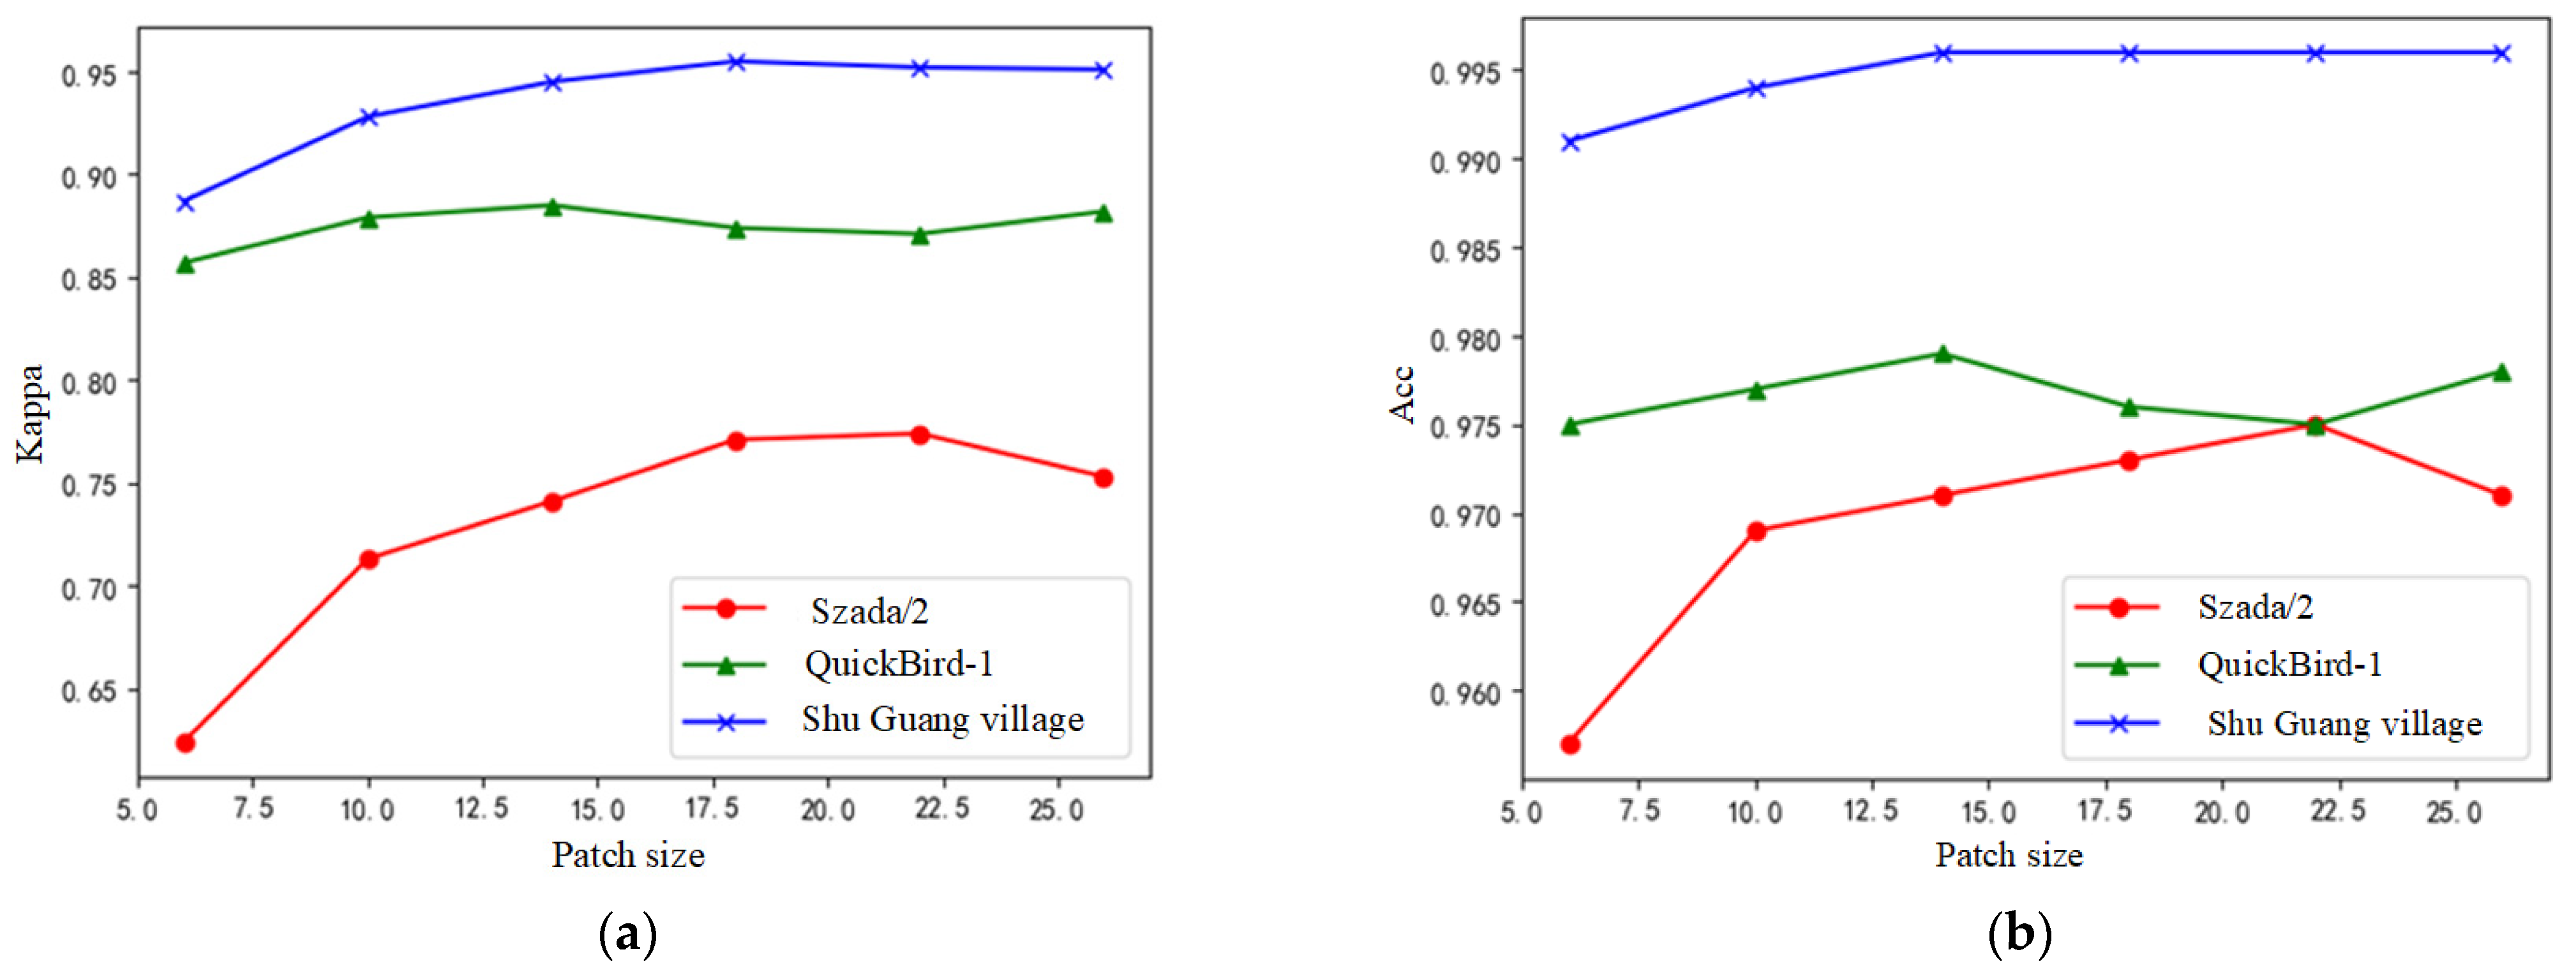
Image patch size is an important factor in data sampling, which decides the neighbor information of the center pixel. When the size is too large, the neighbor information is too plentiful to affect the judgment of the center pixel’s situation. However, an overly small size may also affect it due to the limitation of neighbor information. In this subsection, the influence of different image patch sizes on the final results is discussed. In experiments, the patch size was set to be 6 × 6, 10 × 10, 14 × 14, 18 × 18, 22 × 22 and 26 × 26. Under the unique experimental setting, the experiments were performed on the Szada/2, QuickBird-1 and Shu Guang village data. In Figure 9, the Kappa and Acc of different patch sizes are shown, from which the quantitative analysis of performance influence could be realized.
From the results shown in Figure 9, there is an obvious variance in the performance of different patch sizes for the three datasets. With the increase in the patch size, the results also demonstrated a growth trend. However, when the patch size reached a certain value, such as 22 × 22, the results began to decrease or stabilize. This phenomenon verifies that the patch size should not be too big or too small in this situation. Although there were small differences in the variances of the results with patch size in different data, 22 × 22 could approximately satisfy the performance requirement of these data.
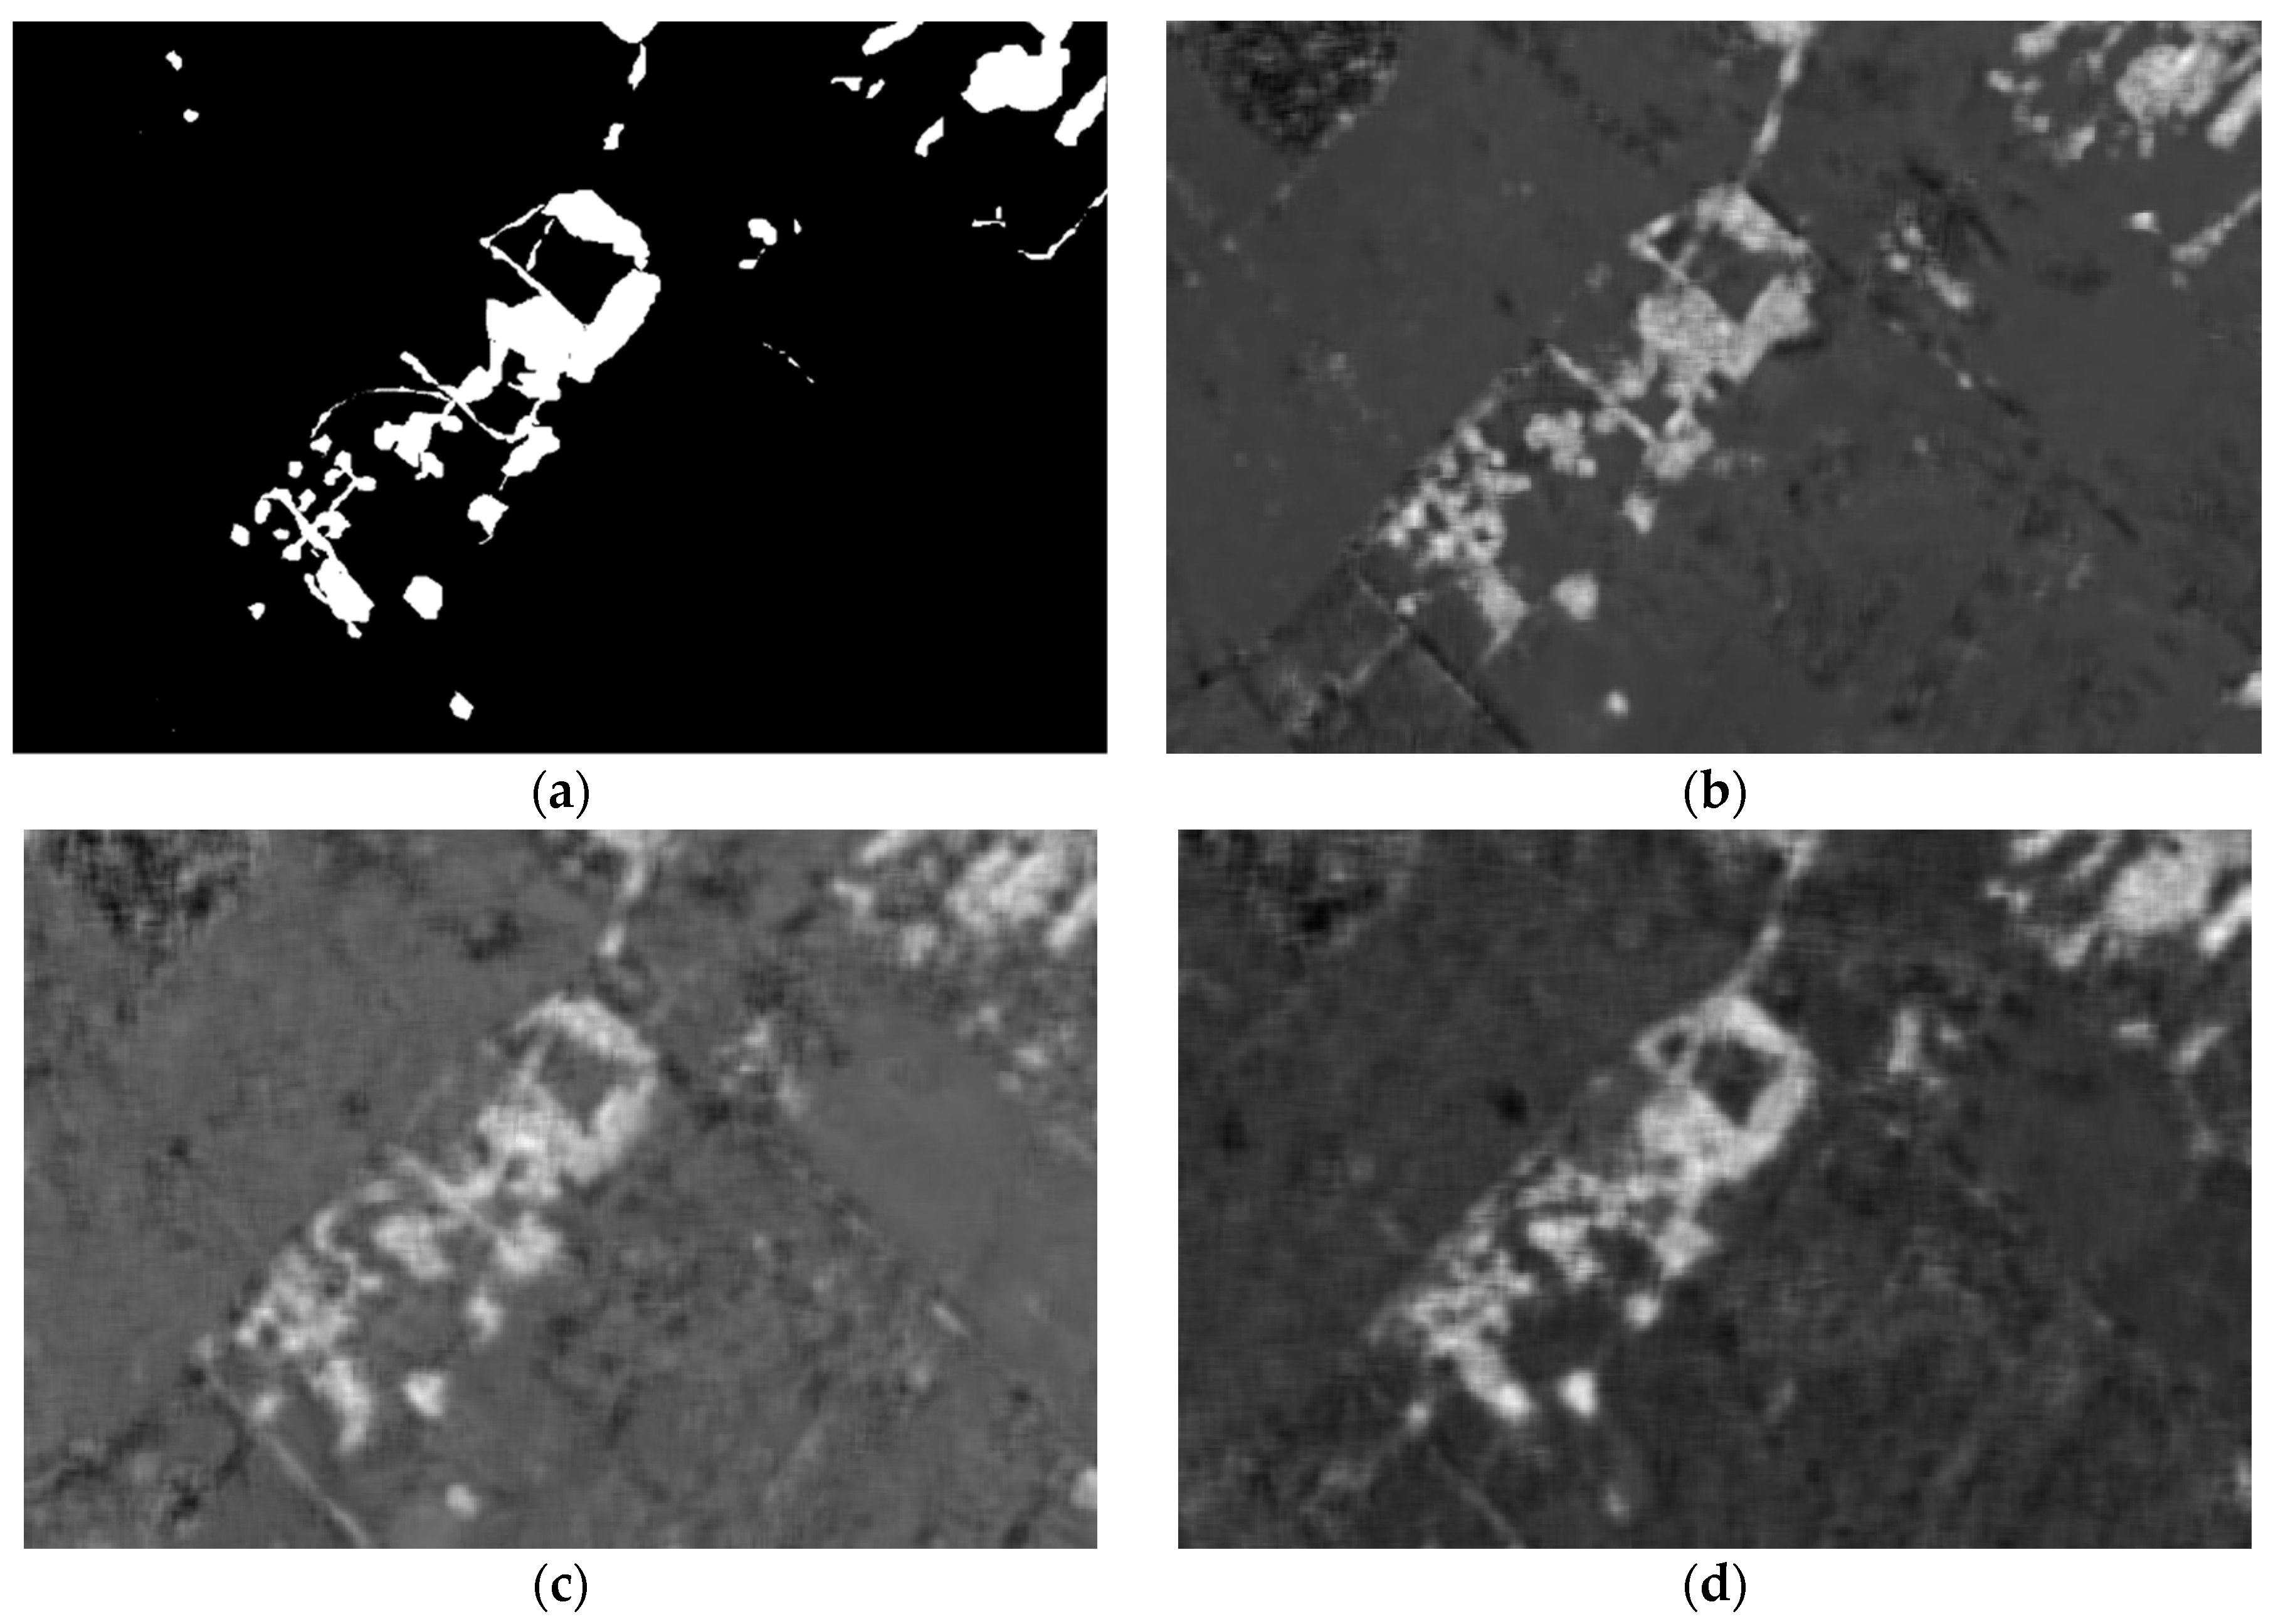
Additionally, in Figure 10, some difference maps for different patch sizes are shown, which were predicted by the proposed fusion model using Szada/2 data. In the visual sense, the difference maps showed some variances, which resulted from the learning and predicting processes of the neural network. Although the contrast ratio in Figure 10b,d is higher than that in Figure 10c, which did not have a large effect during the final threshold segmentation process, considering the details of the labeled region in the ground truthing, some regions were detected to be smaller than those in the ground truthing in Figure 10b, and some regions we detected to be larger than those in the ground truthing in Figure 10d. Figure 10c shows that the change detection results are better than others.
This can also be supported by theoretical analysis. The path size can determine which scale of neighborhood information is introduced into the feature learning process. In the proposed method, pixels in the neighborhood are all treated as the original features of the center pixel. If these neighbor pixels are in the same class as the center pixel, it will help the center pixel to be classified into the true class. On the other hand, if some of the neighborhood pixels do not belong to the same class as the center pixels, the value of those pixels will reduce the probability of being correctly classified. This influence on the margin of the changed area becomes significant. A low value means less neighborhood information and a value that is too large means a high influence of neighbor pixels. Therefore, this parameter could not be too large or too small.
This parameter is usually determined by experiments for certain applications. Through our experiments, 22 × 22 was found to be the appropriate patch size, which was fixed in the following experiments.

3.2.2. Analysis of Pseudo-Siamese and Siamese Network

In this section, we analyzed the performance difference between the Pseudo-Siamese and Siamese networks. The experiments were performed on three datasets, namely, Szada/2, QuickBird-1 and Shu Guang village data, as in the above subsection. The main difference between the Pseudo-Siamese and Siamese networks is whether the parameters’ shared mechanism is applied during the network training process. The Siamese network only updates these parameters on one branch during network training and duplicates these parameters to another branch. In contrast, the Pseudo-Siamese network updates whole parameters of two branches during network training. Here, all experimental settings were consolidated. The final change detection results for these three datasets are shown in Table 3.
In Table 3, the bold text indicates the better value of the comparison. From these results, it is clear that the Siamese network obtained results that are comparative to those of the Pseudo-Siamese network from the three datasets. However, as the Siamese network uses the parameters’ shared mechanism, the parameter quantity of the Siamese network is much lower than that of the Pseudo-Siamese network, which is supported by the statistical result shown in Table 4. Considering both the performance and computation cost, the Siamese network structure is more suitable for the proposed method than the Pseudo-Siamese network structure. Therefore, the Siamese network was chosen in our research work.

3.3. Comparison with Other Methods

Aiming to certify the performance of the proposed method in change detection, some related change detection methods were chosen as comparison methods. DNN-CD [20] and CNN-LSTM [52] are two typical change detection methods based on neural networks. DNN-CD utilizes the deep RBM network as the classification network for change detection based on the label data obtained through pre-classification. CNN-LSTM combines the CNN network with the LSTM network to extract spectral–spatial–temporal features. Additionally, the basic models of the proposed methods, namely, ResNet-CD and Siam-ResNet-CD, were also considered to verify the performance of the proposed method. These methods were trained under the same experimental setting to achieve the best results for comparison, except DNN-CD trained the network to use whole labeled samples obtained through pre-classification.

3.3.1. Results for SZTAKI AirChange Benchmark

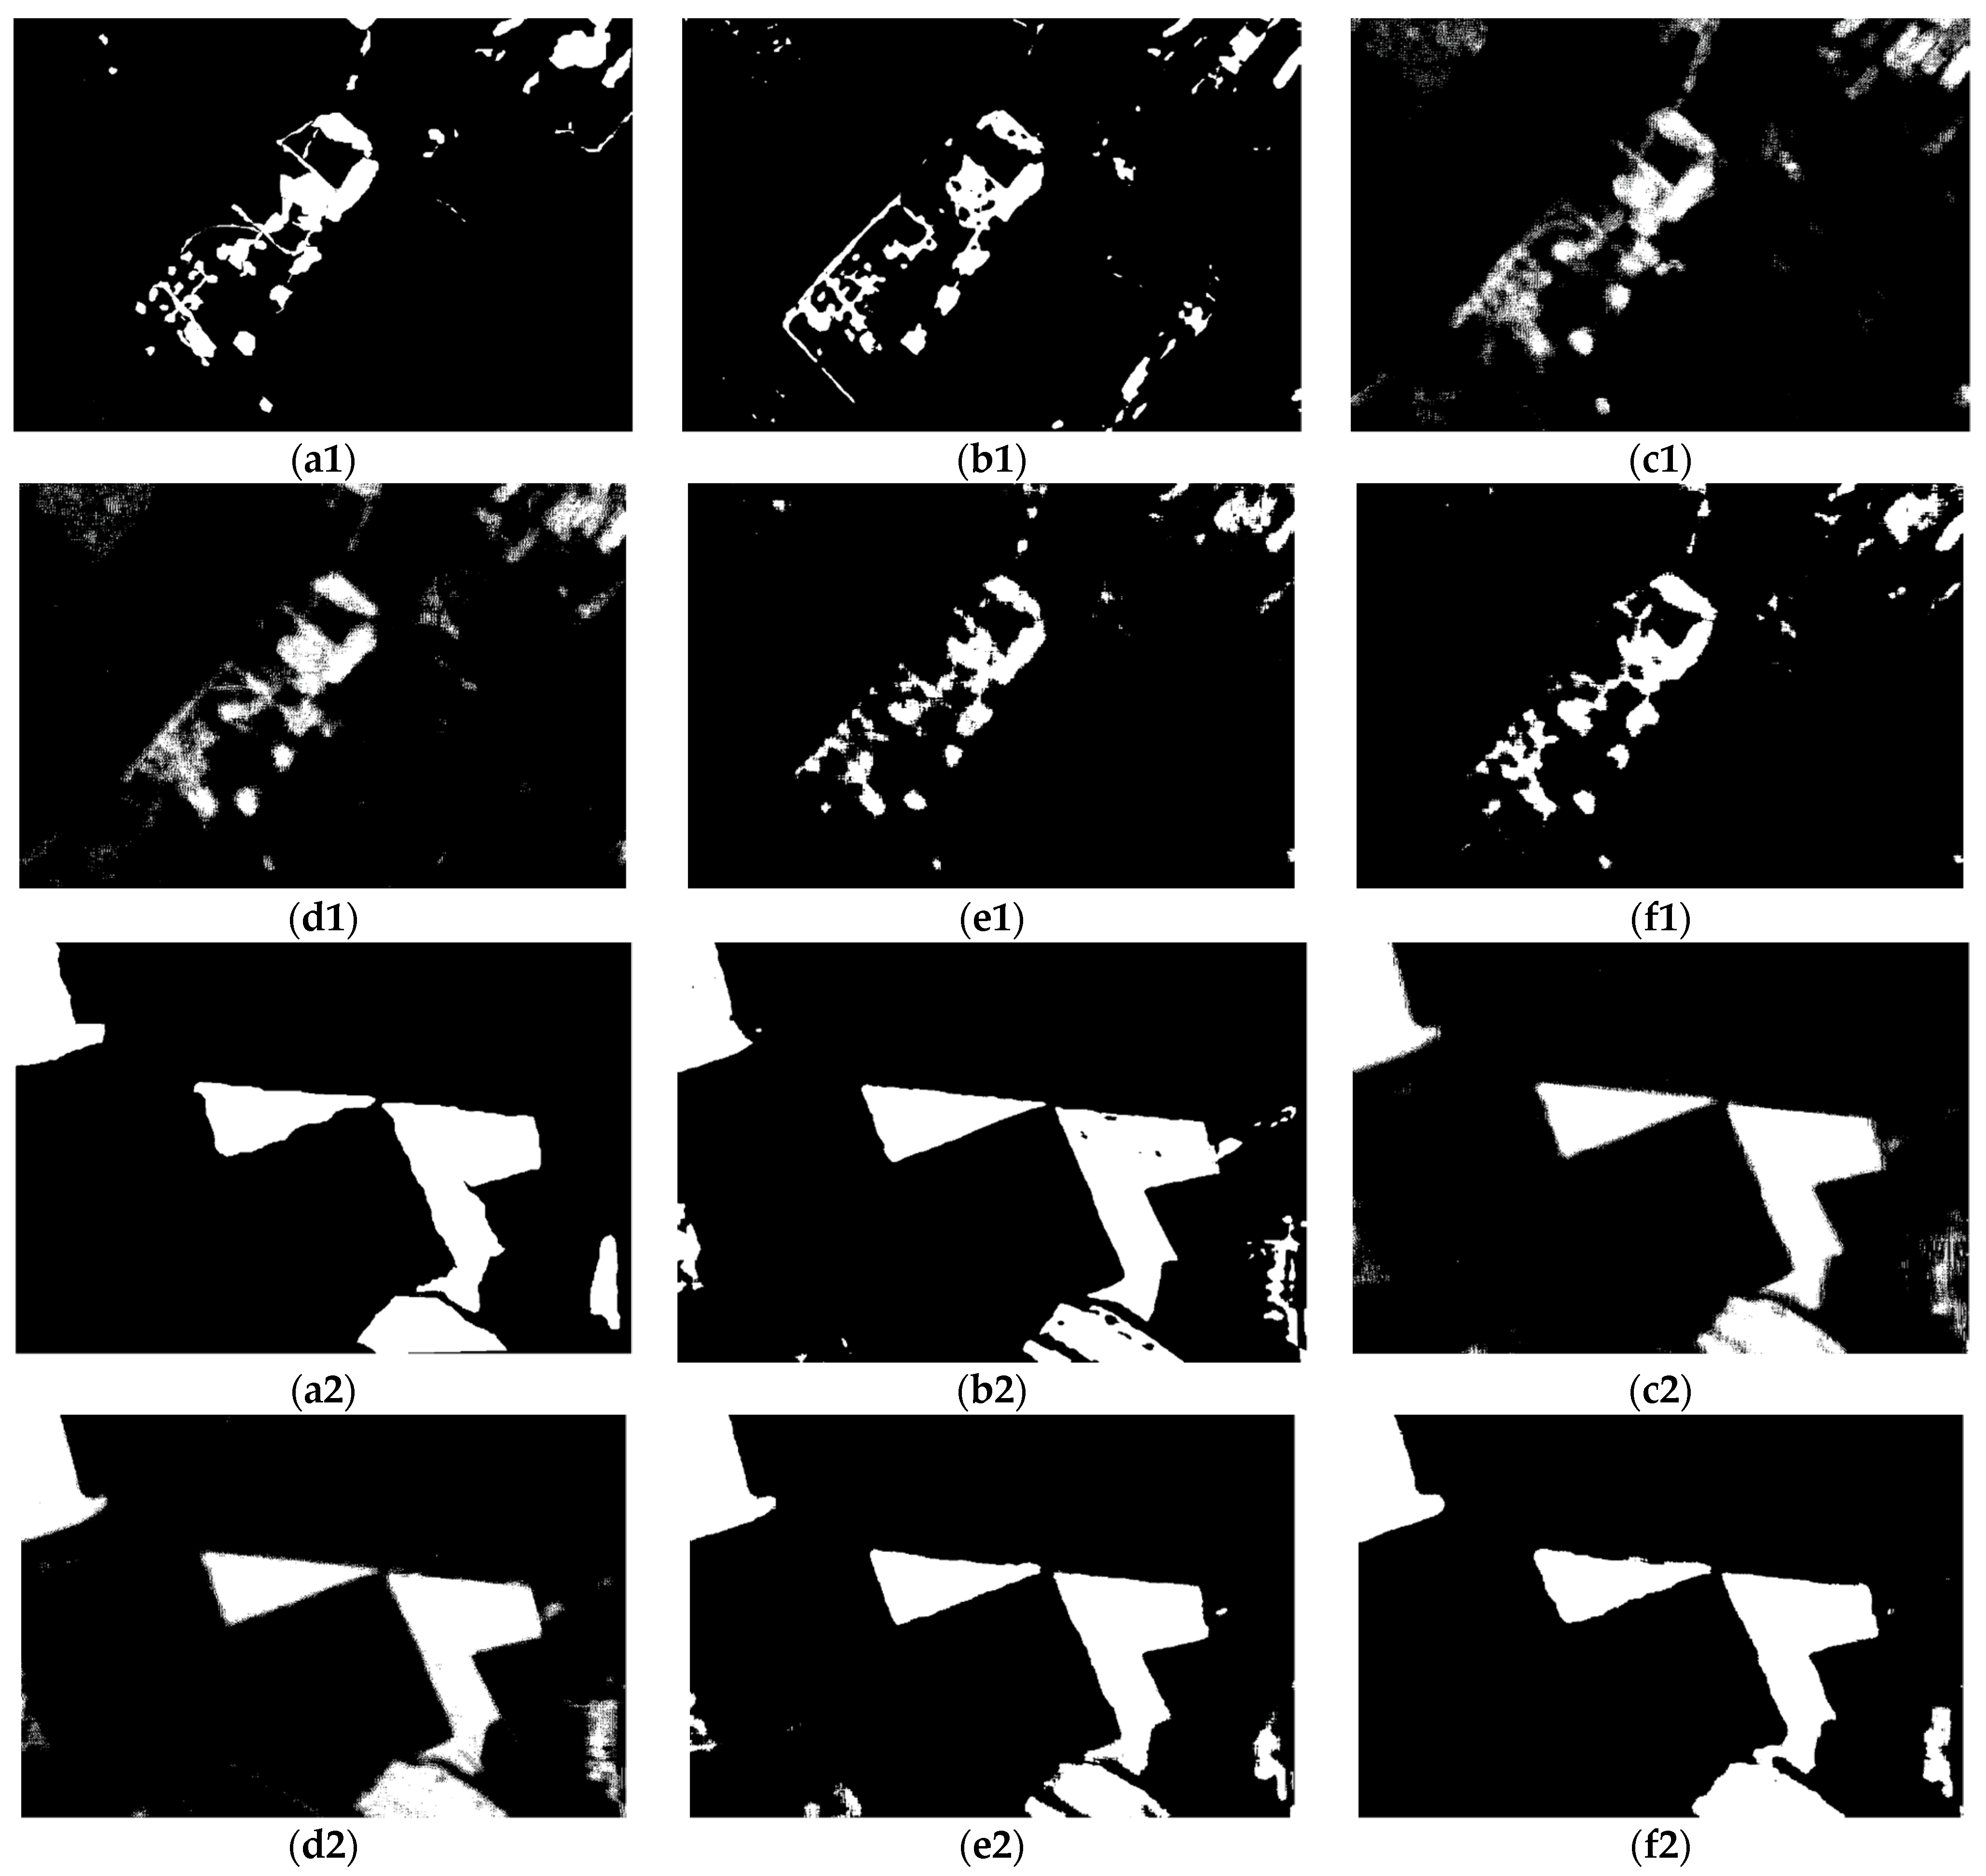
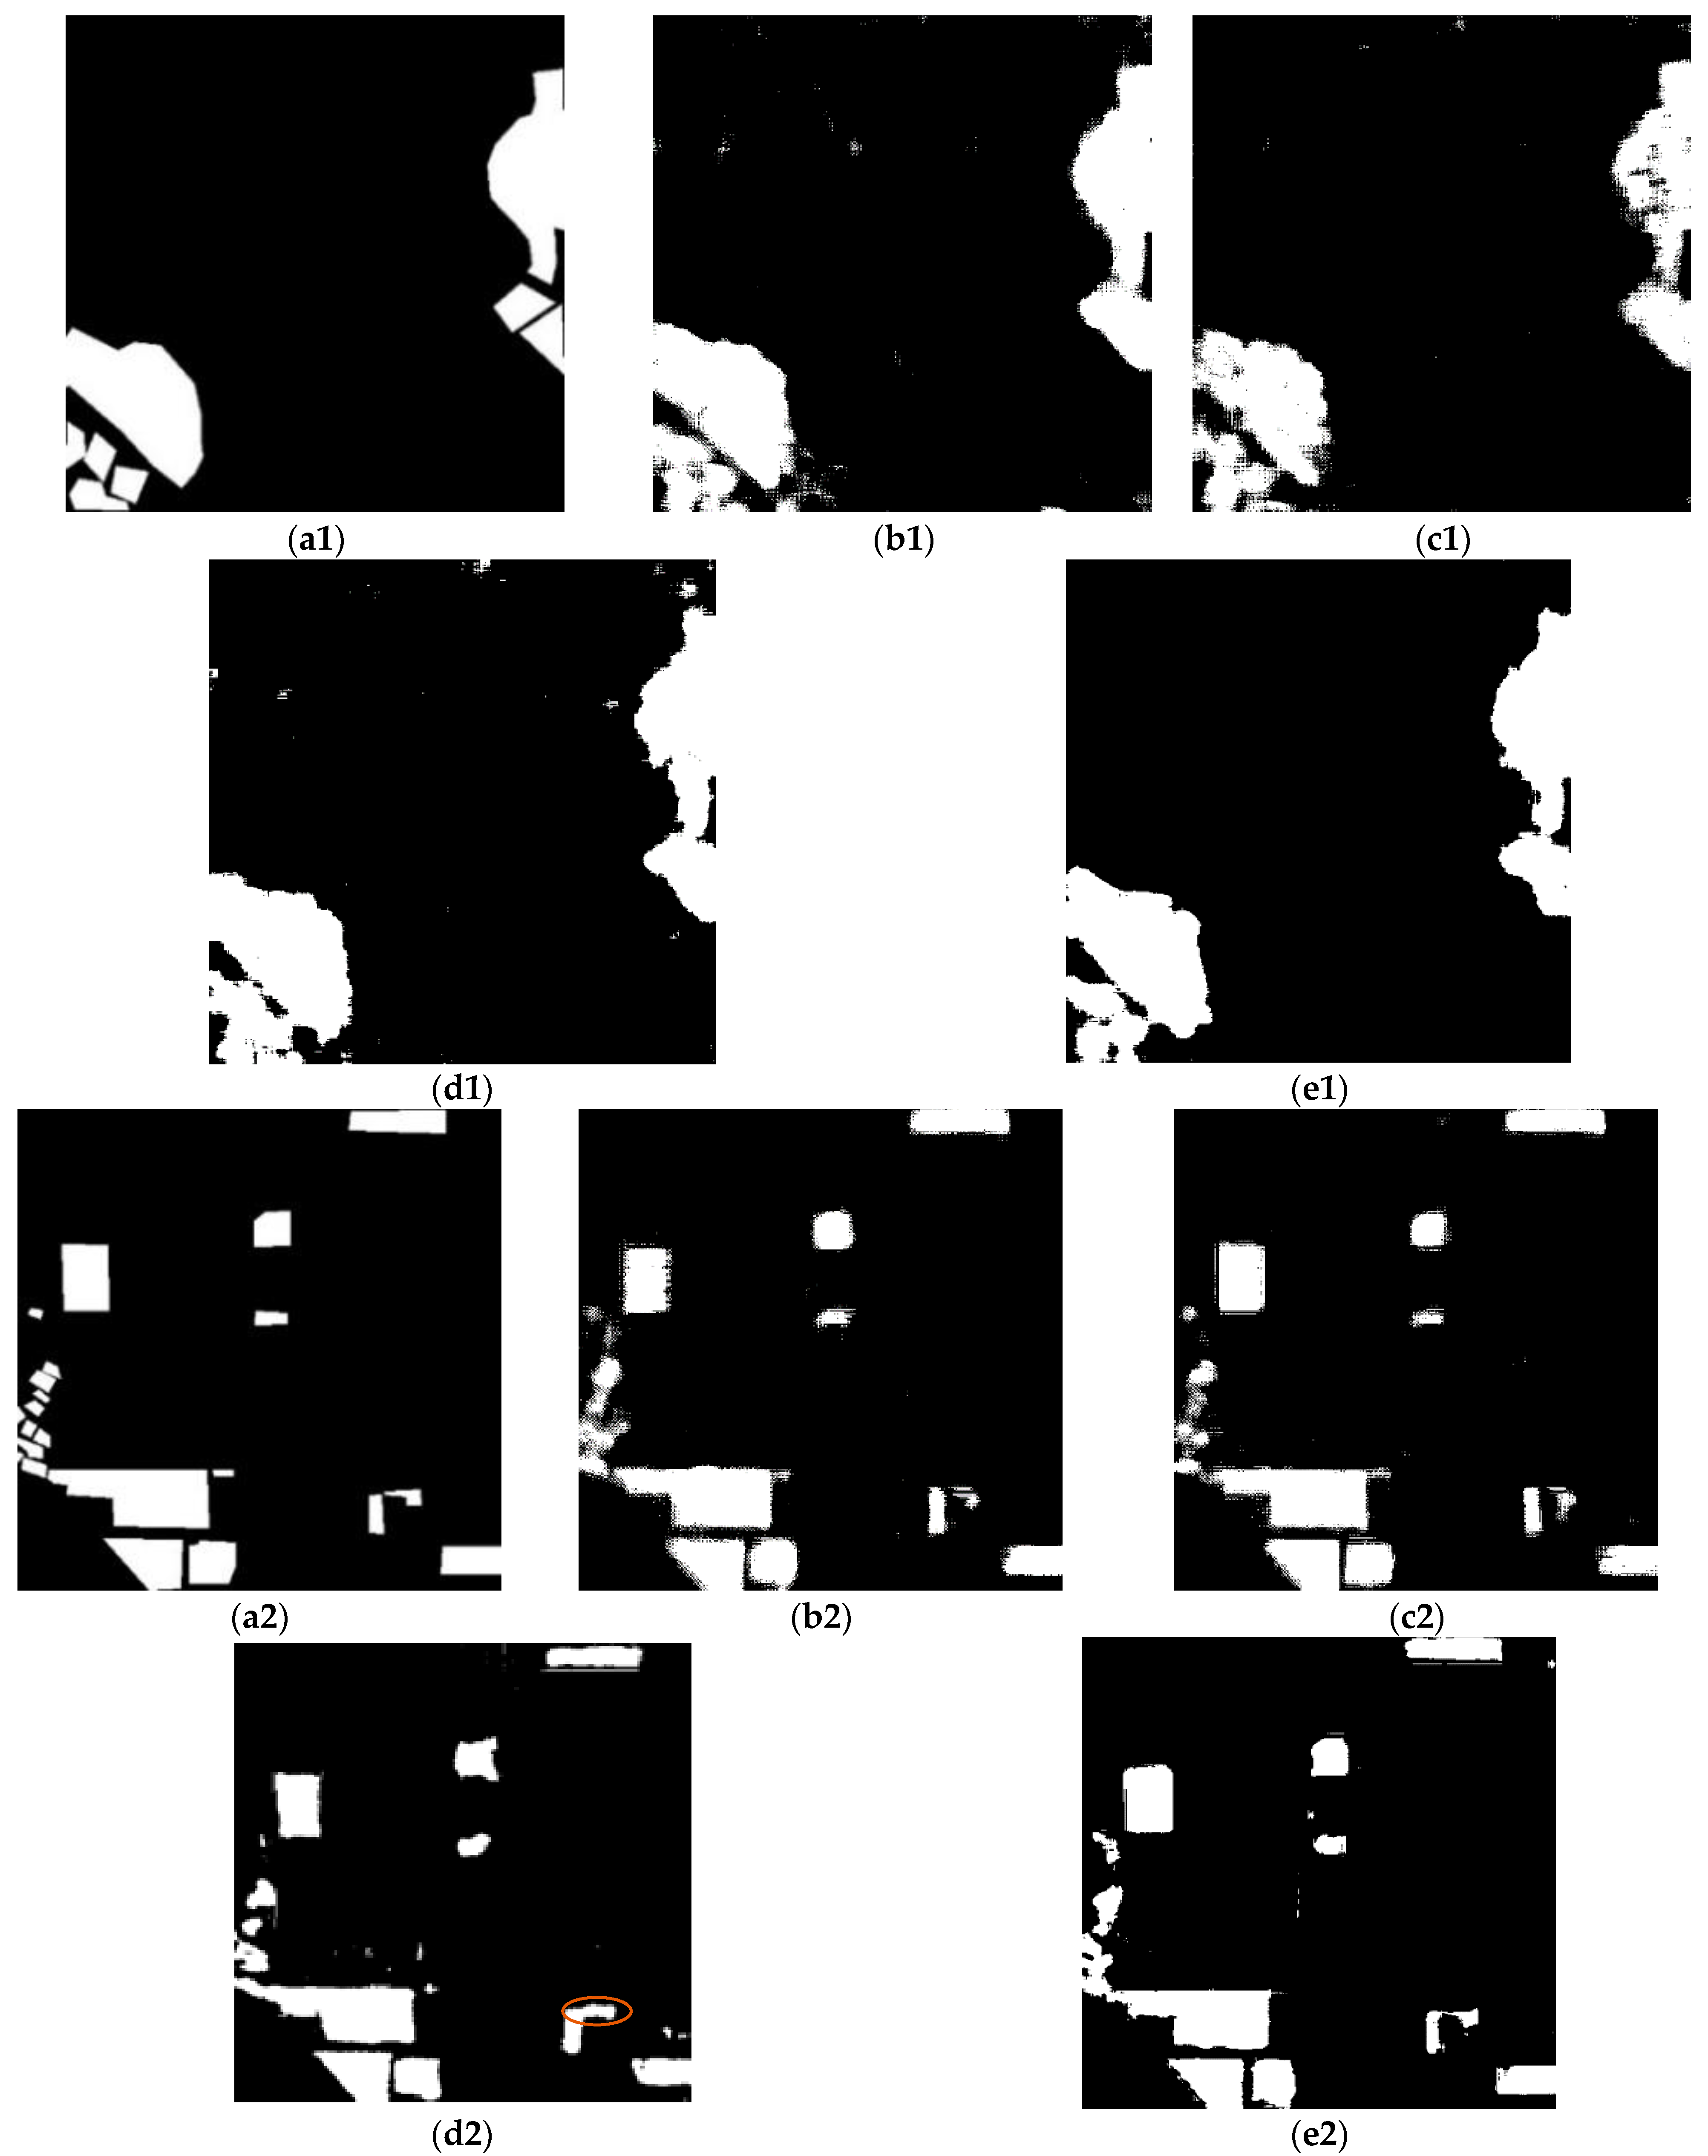
Figure 11 shows the change detection results obtained by different methods in SZTAKI AirChange Benchmark, and their numerical indices are shown in Table 5, where the indices in bold are the best results. Figure 11(b1–f1) show the results of Szada/2 data. Figure 11(b1) shows the results of DNN-CD; there are obvious mistake detection areas in the lower right corner. The results of CNN-LSTM-CD and ResNet-CD are shown in Figure 11(c1,d1), which detect the main change areas, but the details are not precise. The detection map of Siam-ResNet-CD in Figure 11(e1) and the detection map of Atten-SiamNet-CD are better than those of other methods. However, the integrality of the detection map of Atten-SiamNet-CD is better than that of Siam-ResNet-CD. Analyzing the numerical indices of those methods, similar results to the detection maps can be obtained. Although the result of Siam-ResNet-CD is close to that of the proposed method on Pre, the proposed Atten-SiamNet-CD achieved a remarkable improvement in Rec, Kappa and F1.
Figure 11(b2–f2) show the results for Tiszadob/3 data. Compared with the Szada/2 data, these data are simpler, as there are less types of change in the labeled area. Therefore, whole methods obtained decent detection results both in terms of the detection maps and the numerical indices. However, the proposed Atten-SiamNet-CD achieved the best results. Other methods have more or less problems in certain aspects, which is also verified by the numerical results.

3.3.2. Results of QuickBird Dataset

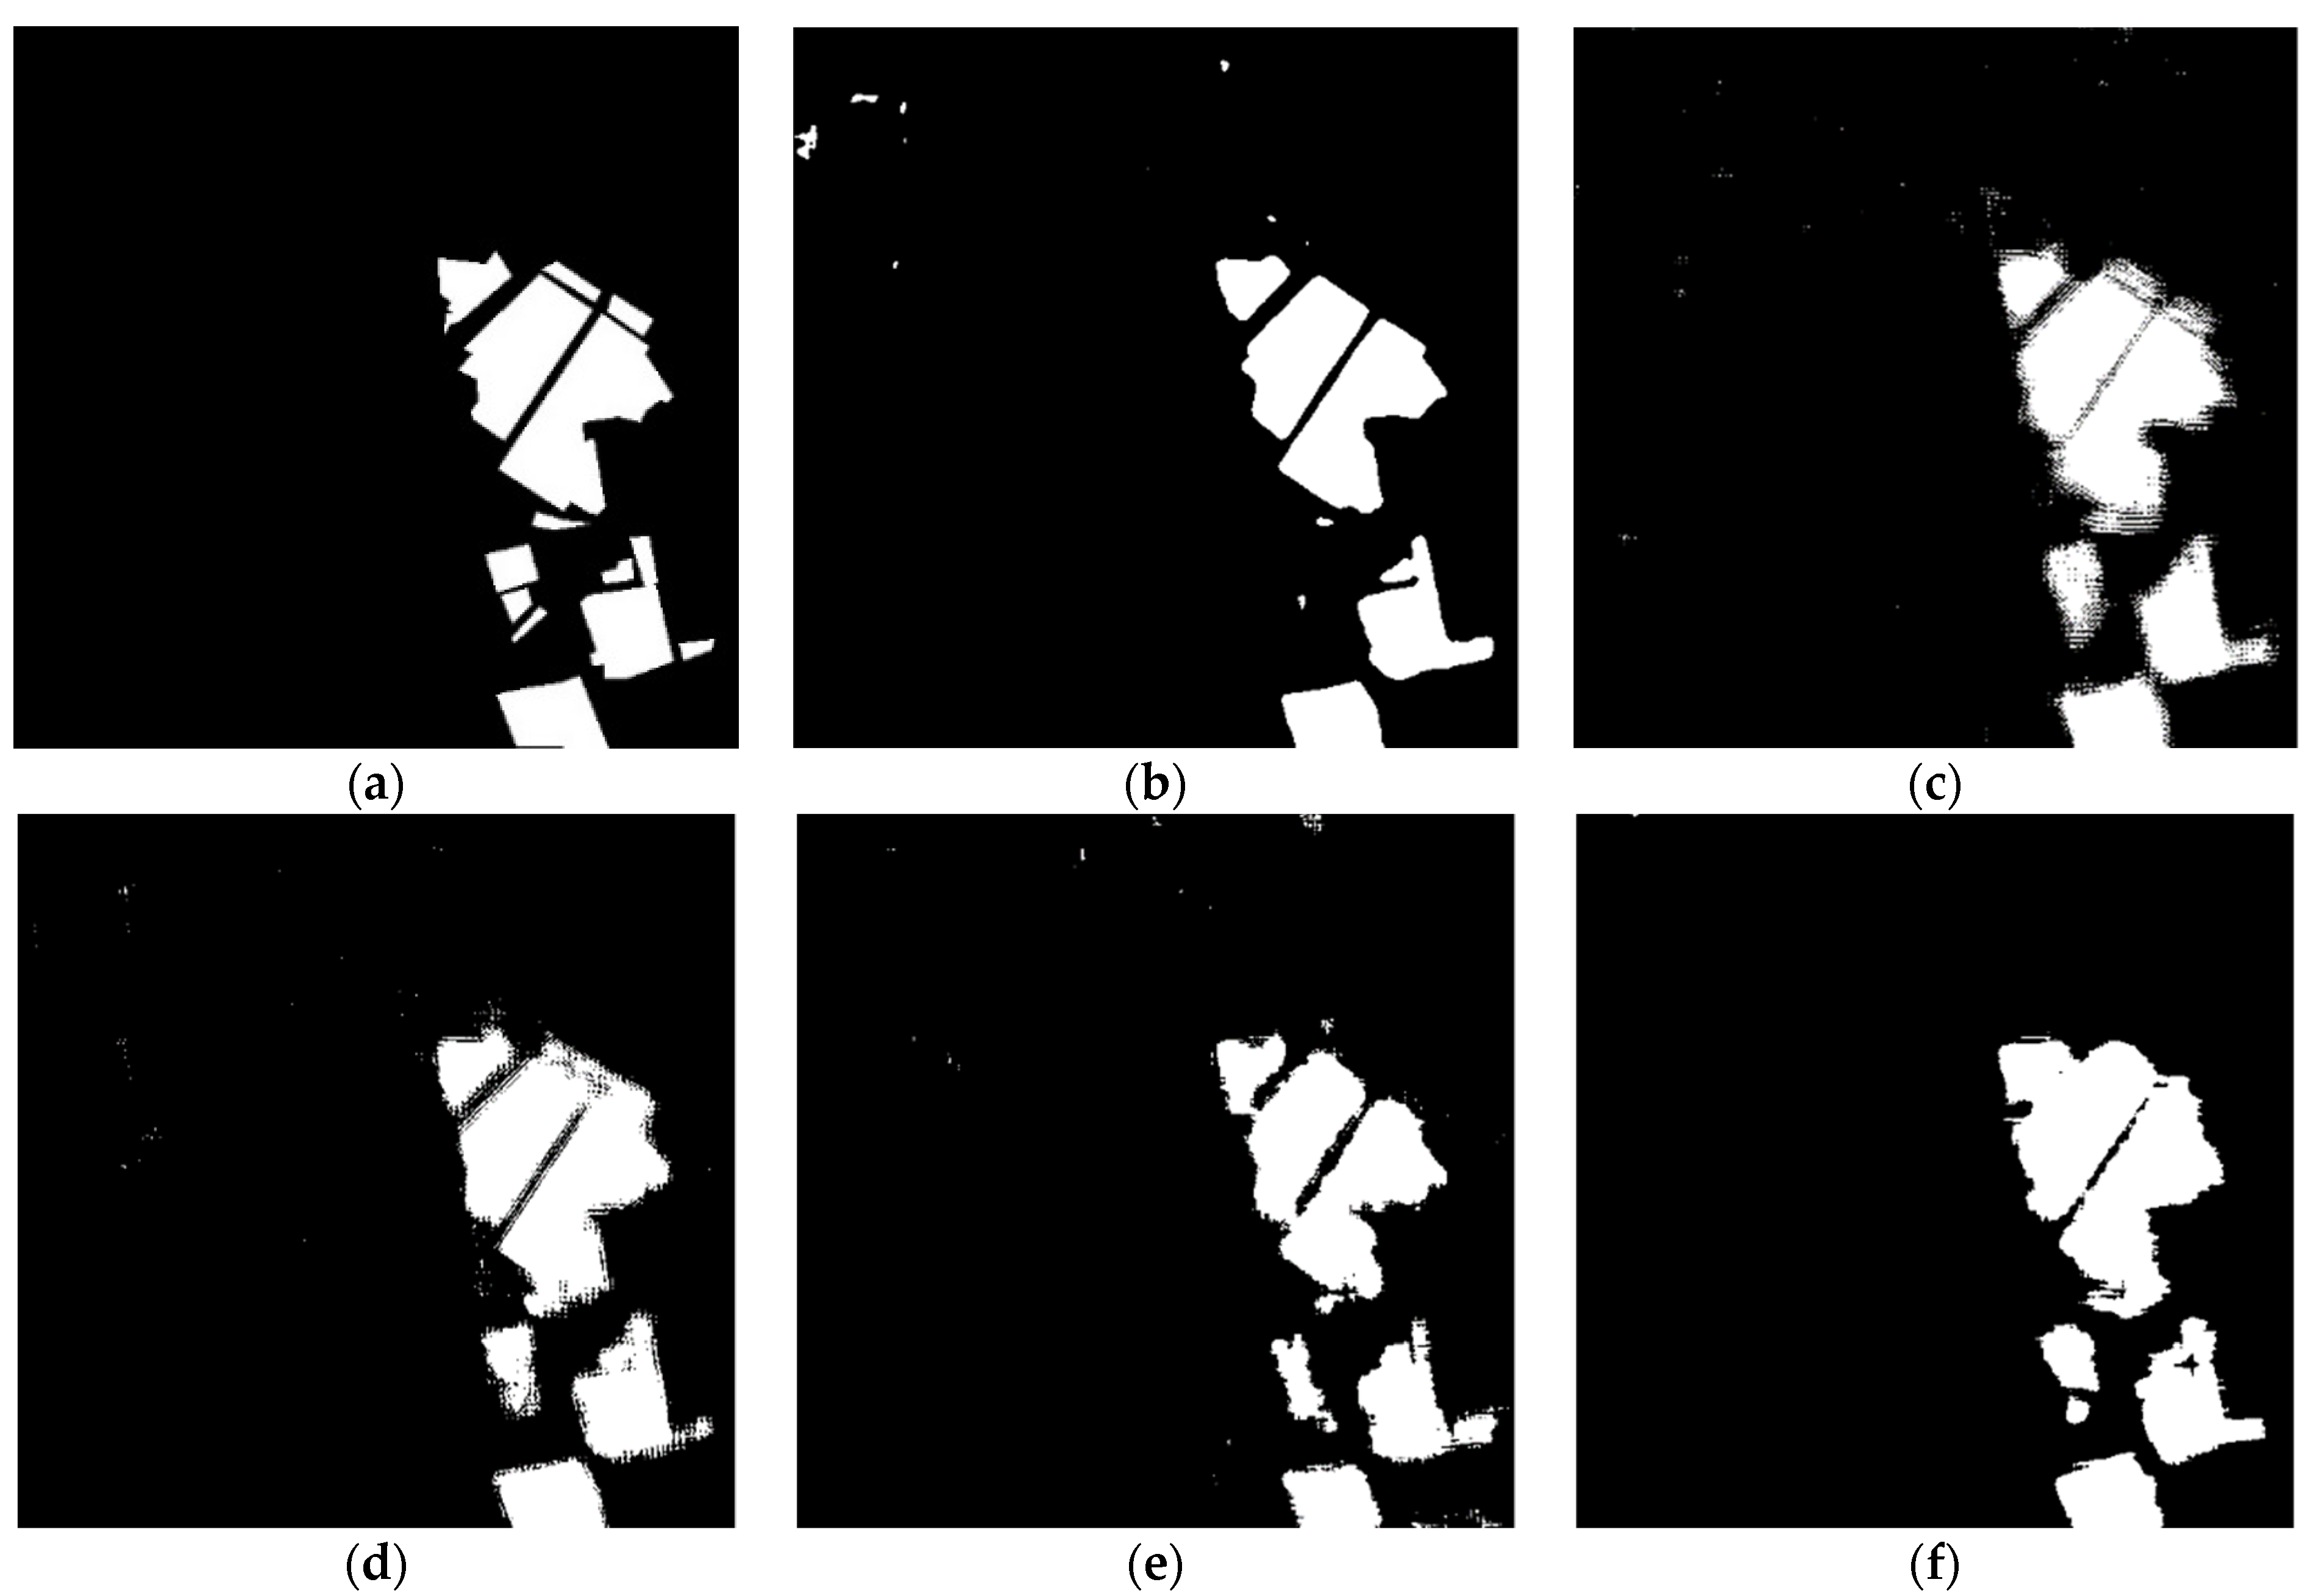
Figure 12 and Figure 13 show the change detection maps obtained by different methods for the QuickBird dataset, with their numerical indices are shown in Table 6. As shown in Figure 12, the change detection map of DNN-CD seems better than others in the visual sense, as there is obscurity at the edge of the changed area and unchanged area. However, there are also some errors, such as error detection in the top left area and leak detection in the lower area. Therefore, although the values of Pre and Acc obtained by DNN-CD are high, the values of Rec, Kappa and F1 are not higher than others. The proposed Atten-SiamNet-CD achieved the best results for Rec, Acc, Kappa and F1.
For QuickBird-2 data and QuickBird-3 data, the results of DNN-CD are not shown in Figure 13 and Table 6, as they are much lower than others. The main reason for this is that the label data obtained by pre-classification are not consistent with the ground truthing. In contrast to QuickBird-1 data, the change categories existing in the whole scene are very complex, and the ground truthing only annotates some areas of concern.
In QuickBird-2, the change detection map of Atten-SiamNet-CD is much closer to ground truthing. Compared with other methods, it also obtained best results for Acc, Kappa and F1, which are close to the best results for Pre and Rec.
As shown in Table 6, for these data, all methods obtained adjacent results for the numerical indices, namely, Precision, Acc, Kappa and F1. However, Atten-SiamNet-CD obtained a significant improvement in Recall, which means that this method should correctly detect more changed areas than other methods. This result can also be verified by the change detection maps shown in Figure 13. All methods could detect the main changed areas, but also showed some defects, such as the small building in the left corner. The results of Siam-ResNet-CD are not precise, as shown by the building marked by a red circle in Figure 13(d2). In both of above problems, Atten-SiamNet-CD has more precise results than others.

3.3.3. Results for Shu Guang Village Data

Shu Guang village data contain two heterogeneous remote sensing images; one is an SAR image and the another an optical image. The difference in the imaging mechanism enlarges the variations between them. In these data, we focused only on the change from farmland to buildings. However, there was a large discrepancy in the unchanged areas. For DNN-CD, this affected the accuracy of the labeled data. Therefore, the result of DNN-CD is not listed here.
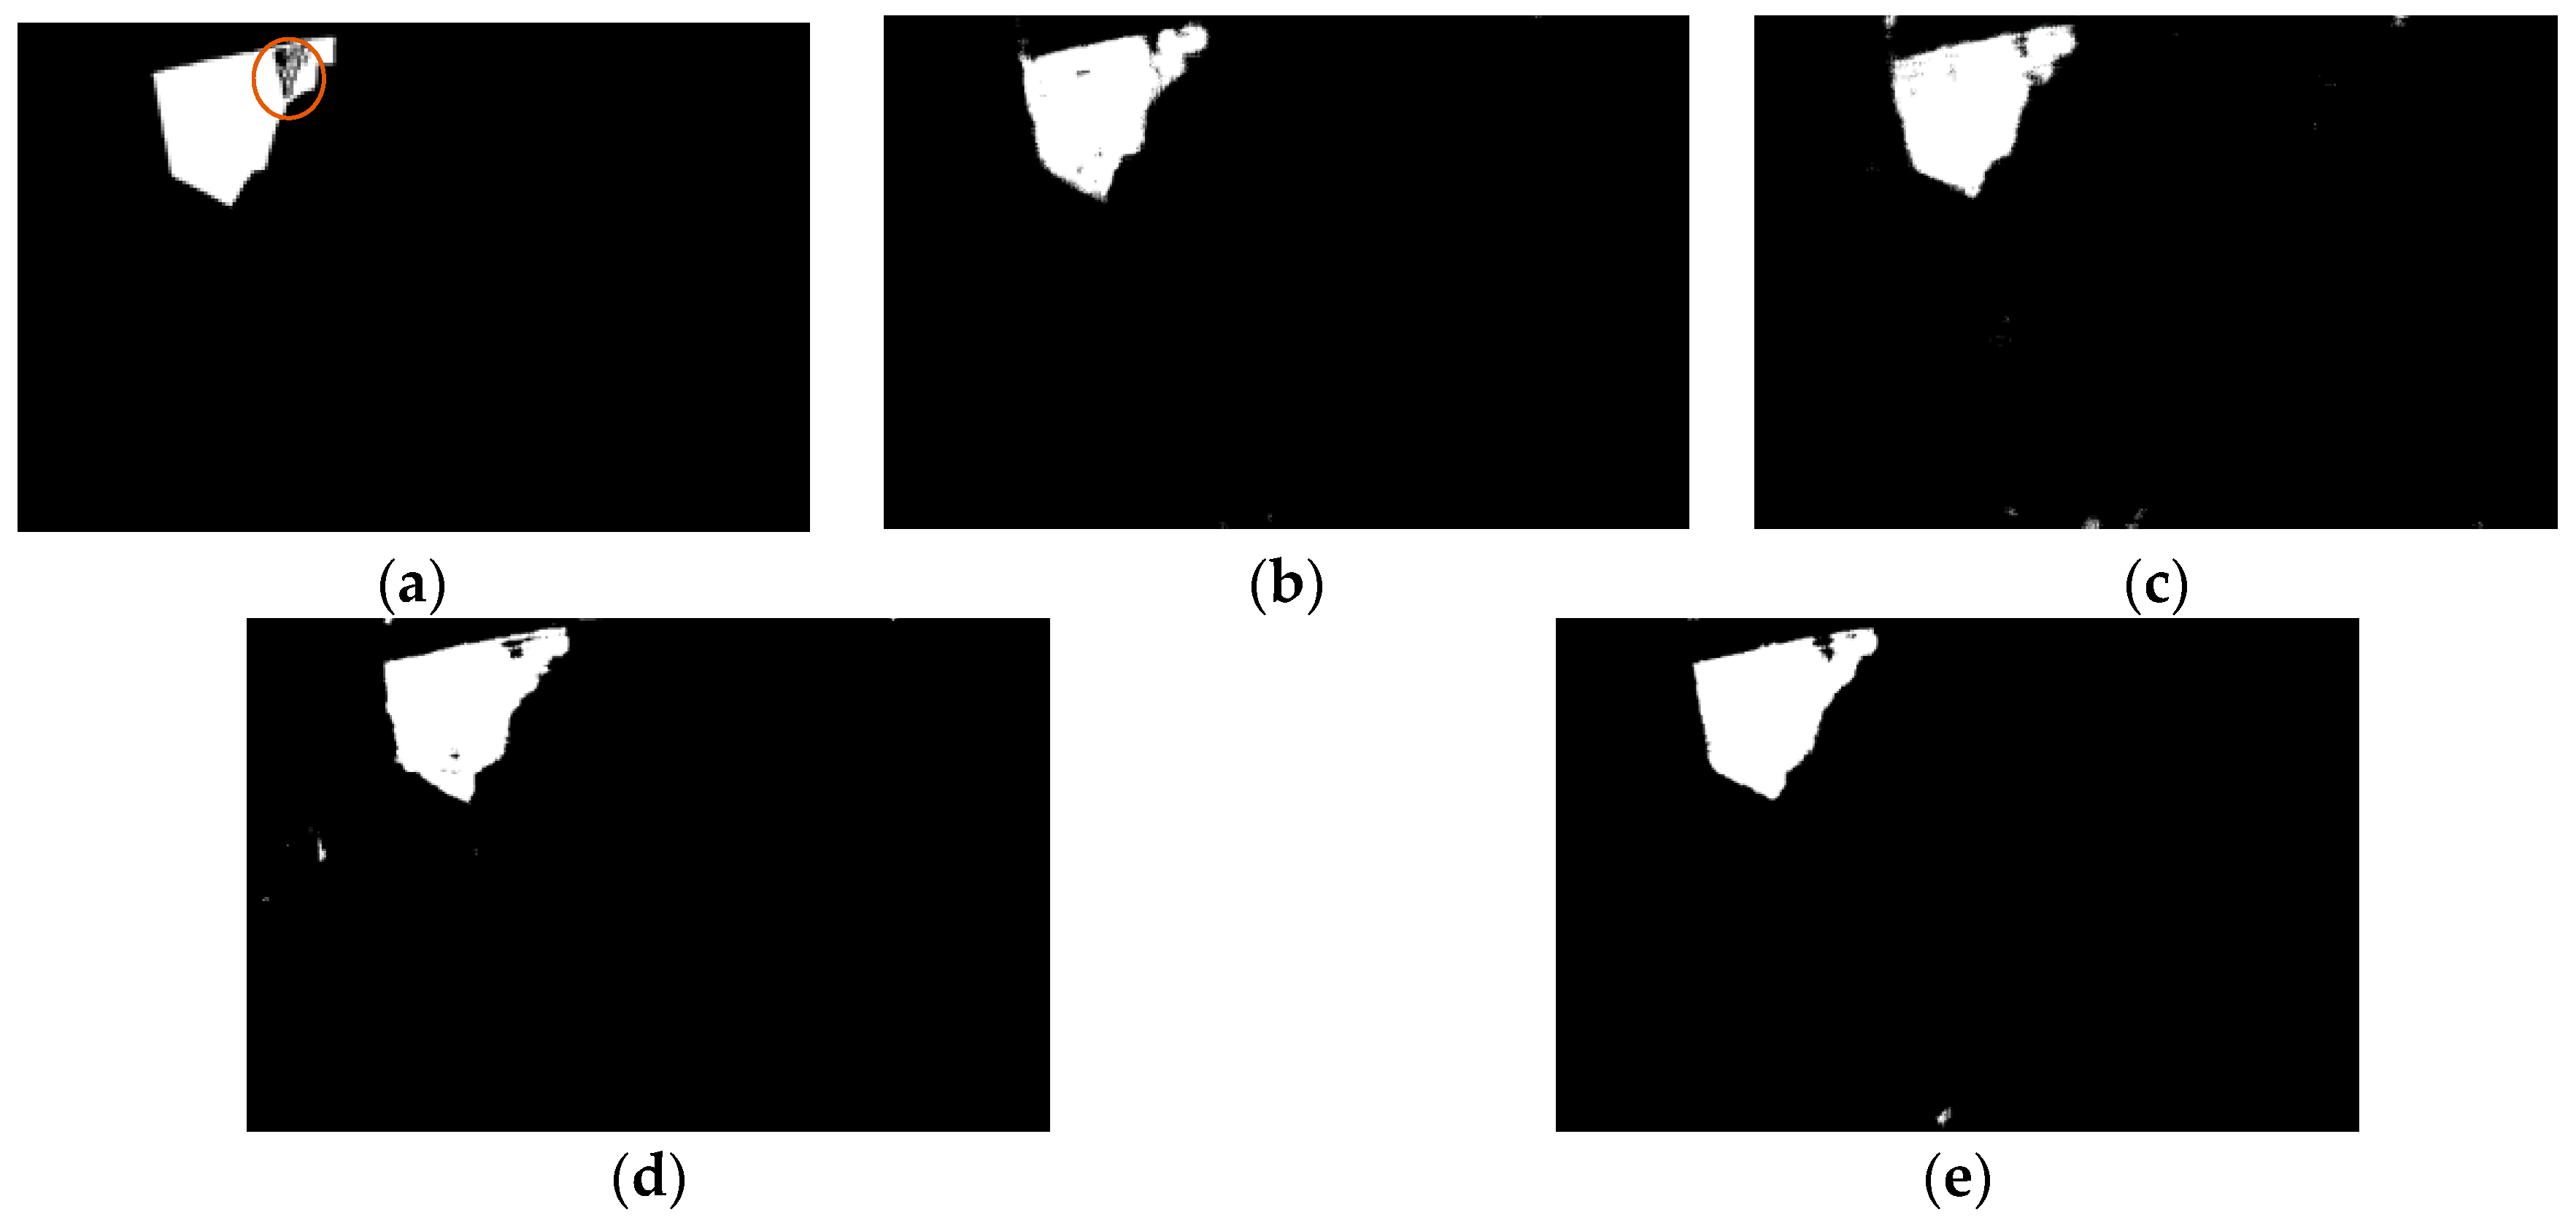
Figure 14 shows the change detection results obtained by different methods for Shu Guang village data. Comparing the change detection results obtained by different methods, there is very little difference. Whole methods could not obtain good results, as shown in the area marked by a red circle in Figure 14a. The main reason for this is that the intrinsic difference is too large to affect the determination. However, in the numerical indices shown in Table 7, Atten-SiamNet-CD improved Pre, Acc, Kappa and F1.

3.3.4. Summary of Experiments

In the above subsection, the change detection results of different methods for six temporal image pairs are shown. The comparison of ResNet-CD and Siam-ResNet-CD demonstrated that the Siamese structure is more suitable for addressing change detection problems than the combination of two temporal image patches as input, which was supported by almost all the experiments. Analysis of the results of Siam-ResNet-CD and Atten-SiamNet-CD verifies the importance of information interaction between different branches during feature learnings. This provides strong experimental support for our findings.
In comparison with CNN-LSTM-CD, the proposed Atten-SiamNet-CD showed obvious advantages for SZTAKI AirChange Benchmark, QuickBird-1 and QuickBird-2. The results of the other two data are similar. As CNN-LSTM-CD uses two kinds of neural network to construct the two feature learning branches, besides spatial–spectral features, it can also extract temporal features. However, this method is a typical Siamese structure like Siam-ResNet-CD; it does not consider the interaction of two branches and the importance of each feature. This is the main reason that the proposed Atten-SiamNet-CD could perform better.
The performance of DNN-CD is highly dependent on the accuracy of labeled samples obtained by pre-classification. If the scene is complex, the labeled samples may involve a large amount of interference in the training processing and generate inaccurate change detection results. This is the main limitation of this method. Additionally, DNN-CD methods use the RBM as a basic network block; the image patches are rearranged into vectors inputted into the network, which could lose the spatial structural information during feature learning processing.
In summary, the proposed method is effective for change detection. Using the attention information fusion module to realize the interaction of two feature extraction branches can improve the final change detection results. In comparison with DNN-CD and CNN-LSTM-CD, the proposed Atten-SiamNet-CD has both performance and theoretical advantages.

4. Conclusions

The change detection of remote sensing images is a useful and significant research topic, which is promising for applications in practical problems. However, there are still many obstacles regarding the practical application of change detection in larger society. Besides these influences caused by imaging processing, the main challenge is the imbalance between the complexity of the scene and the limited cognition of the scene. It is impossible to annotate a mass of samples to train a perfect network for arbitrary scenes and arbitrary images. Commonly, only a few change types are considered in practice, although there are many change types in certain scenes. Thus, people only label some changed samples they find interesting. In the limited training set, the network structure is the key factor for better results. In this work, we focused on constructing a new network structure suitable for change detection. By analyzing the problems of basic networks such as ResNet-CD and Siam-ResNet-CD, an attention-guided information fusion network was constructed for change detection. In contrast to the common use of the attention mechanism, the attention block was integrated with double feature networks to realize the information interaction and fusion of two branches and also to guide feature learning processing. Of course, our experimental results also verified that the above procedure could perform better. Although exploring a more suitable network structure could improve the change detection results, it could not completely solve the practical application problem of change detection. In change detection, there are always a few labeled changed areas, and the rest of the areas are treated as unchanged. Therefore, the effect of unchanged areas cannot be ignored. Utilizing the information hidden in unchanged areas via some unsupervised methods to improve the effectiveness of supervised learning may be a good solution for change detection. In future works, we plan to explore this research direction.

Author Contributions

Conceptualization, P.C. and L.G.; methodology, P.C.; software, P.C.; validation, K.Q., L.G. and X.Z.; formal analysis, L.G.; investigation, K.Q.; resources, L.J.; data curation, L.J.; writing—original draft preparation, P.C.; writing—review and editing, P.C., L.G. and X.Z.; visualization, W.M.; supervision, L.J.; project administration, P.C.; funding acquisition, K.Q. All authors have read and agreed to the published version of the manuscript.

Funding

This research was funded by the National Natural Science Foundation of China under Grant (no. 61902298 and 61806156), the Key Scientific Research Program of Education Department in Shaanxi Province of China (no. 20JY023), the China Postdoctoral Science Foundation Funded Project (no. 2017M613081), the 2018 Postdoctoral Foundation of Shaanxi Province (no. 2018BSHEDZZ46) and Fundamental Research Funds for the Central University (no. XJS201901).

Institutional Review Board Statement

Not applicable.

Informed Consent Statement

Not applicable.

Acknowledgments

We would like to thank the researchers who contributed their research achievements. We would also like to thank the editors and reviewers for providing relevant suggestions to improve the quality of this manuscript. Furthermore, this work was supported by the National Natural Science Foundation of China under Grant (no. 61902298 and 61806156), the Key Scientific Research Program of Education Department in Shaanxi Province of China (no. 20JY023), the China Postdoctoral Science Foundation Funded Project (no. 2017M613081), the 2018 Postdoctoral Foundation of Shaanxi Province (no. 2018BSHEDZZ46) and Fundamental Research Funds for the Central University (no. XJS201901).

Conflicts of Interest

The authors declare no conflict of interest.

References

  1. Viana, C.M.; Oliveira, S.; Oliveira, S.C.; Rocha, J. Land Use/Land Cover Change Detection and Urban Sprawl Analysis, in Spatial Modeling in GIS and R for Earth and Environmental Sciences; Pourghasemi, H.R., Gokceoglu, C., Eds.; Elsevier: Amsterdam, The Netherlands, 2019; pp. 621–651. [Google Scholar]
  2. Huang, J.L.R.X.; Wen, D. Multi-level monitoring of subtle urban changes for the megacities of China using high-resolution multi-view satellite imagery. Remote Sens. Environ. 2017, 56, 56–75. [Google Scholar] [CrossRef]
  3. Bovolo, F.; Bruzzone, L. A split-based approach to unsupervised change detection in large-size multitemporal images: Application to tsunami-damage assessment. IEEE Trans. Geosci. Remote Sens. 2007, 45, 1658–1670. [Google Scholar] [CrossRef]
  4. Yan, Z.; Huazhong, R.; Desheng, C. The Research of Building Earthquake Damage Object-Oriented Change Detection Based on Ensemble Classifier with Remote Sensing Image. In Proceedings of the IGARSS 2018—2018 IEEE International Geoscience and Remote Sensing Symposium, Valencia, Spain, 22–27 July 2018; pp. 4950–4953. [Google Scholar]
  5. Coppin, P.; Jonckheere, I.; Nackaerts, K.; Muys, B.; Lambin, E. Review Article Digital change detection methods in ecosystem monitoring: A review. Int. J. Remote Sens. 2004, 25, 1565–1596. [Google Scholar] [CrossRef]
  6. Zhang, D.; Zhou, G. Estimation of Soil Moisture from Optical and Thermal Remote Sensing: A Review. Sensors 2016, 16, 1308. [Google Scholar] [CrossRef] [PubMed] [Green Version]
  7. Liu, S.; Marinelli, D.; Bruzzone, L.; Bovolo, F. A Review of Change Detection in Multitemporal Hyperspectral Images: Cur-rent Techniques, Applications, and Challenges. IEEE Geosci. Remote Sens. Mag. 2019, 7, 140–158. [Google Scholar] [CrossRef]
  8. Khelifi, L.; Mignotte, M. Deep Learning for Change Detection in Remote Sensing Images: Comprehensive Review and Me-ta-Analysis. IEEE Access 2020, 8, 126385–126400. [Google Scholar] [CrossRef]
  9. Hussain, M.; Chen, D.; Cheng, A.; Wei, H.; Stanley, D. Change detection from remotely sensed images: From pixel-based to object-based approaches. ISPRS J. Photogramm. Remote Sens. 2013, 80, 91–106. [Google Scholar] [CrossRef]
  10. Coppin, P.R.; Bauer, M.E. Digital change detection in forest ecosystems with remote sensing imagery. Remote Sens. Rev. 1996, 13, 207–234. [Google Scholar] [CrossRef]
  11. Johnson, R.D.; Kasischke, E.S. Change vector analysis: A technique for the multispectral monitoring of land cover and condition. Int. J. Remote Sens. 1998, 19, 411–426. [Google Scholar] [CrossRef]
  12. Chen, J.; Gong, P.; He, C.; Pu, R.; Shi, P. Land-Use/Land-Cover Change Detection Using Improved Change-Vector Analysis. Photogramm. Eng. Remote Sens. 2003, 69, 369–379. [Google Scholar] [CrossRef] [Green Version]
  13. Celik, T. Unsupervised Change Detection in Satellite Images Using Principal Component Analysis and $k$-Means Clustering. IEEE Geosci. Remote Sens. Lett. 2009, 6, 772–776. [Google Scholar] [CrossRef]
  14. Schwartz, C.; Ramos, L.P.; Duarte, L.T.; Pinho, M.D.S.; Machado, R. Change detection in UVB SAR images based on robust principal component analysis. Remote Sens. 2020, 12, 1916. [Google Scholar] [CrossRef]
  15. Ghosh, A.; Mishra, N.S.; Ghosh, S. Fuzzy clustering algorithms for unsupervised change detection in remote sensing images. Inf. Sci. 2011, 181, 699–715. [Google Scholar] [CrossRef]
  16. Yuan, F.; Sawaya, K.E.; Loeffelholz, B.C.; Bauer, M.E. Land cover classification and change analysis of the Twin Cities (Minnesota) Metropolitan Area by multitemporal Landsat remote sensing. Remote Sens. Environ. 2005, 98, 317–328. [Google Scholar] [CrossRef]
  17. Volpi, M.; Tuia, D.; Bovolo, F.; Kanevski, M.; Bruzzone, L. Supervised change detection in VHR images using contextual information and support vector machines. Int. J. Appl. Earth Obs. Geoinf. 2013, 20, 77–85. [Google Scholar] [CrossRef]
  18. Im, J.; Jensen, J.R. A change detection model based on neighborhood correlation image analysis and decision tree classification. Remote Sens. Environ. 2005, 99, 326–340. [Google Scholar] [CrossRef]
  19. Gong, M.; Zhao, J.; Liu, J.; Miao, Q.; Jiao, L. Change Detection in Synthetic Aperture Radar Images Based on Deep Neural Networks. IEEE Trans. Neural Netw. Learn. Syst. 2016, 27, 125–138. [Google Scholar] [CrossRef]
  20. Bontemps, S.; Bogaert, P.; Titeux, N.; Defourny, P. An object-based change detection method accounting for temporal dependences in time series with medium to coarse spatial resolution. Remote Sens. Environ. 2008, 112, 3181–3191. [Google Scholar] [CrossRef]
  21. Niemeyer, I.; Marpu, P.R.; Nussbaum, S. Change Detection Using Object Features. In Object-Based Image Analysis: Spatial Concepts for Knowledge-Driven Remote Sensing Applications; Springer: Berlin/Heidelberg, Germany, 2008; pp. 185–201. [Google Scholar]
  22. Addink, E.A.; Coillie, F.; Jong, S.M.D. Introduction to the GEOBIA 2010 special issue: From pixels to geographic objects in remote sensing image analysis. Int. J. Appl. Earth Obs. Geoinf. 2012, 15, 1–6. [Google Scholar] [CrossRef]
  23. Wang, X.; Liu, S.; Du, P.; Liang, H.; Xia, J.; Li, Y. Object-based change detection in urban areas from high spatial resolution images based on mul-tiple features and ensemble learning. Remote Sens. 2018, 10, 276. [Google Scholar] [CrossRef] [Green Version]
  24. Stow, D. Geographic object-based image change analysis. In Handbook of Applied Spatial Statistics; Fischer, M.M., Getis, A., Eds.; Springer: Berlin/Heidelberg, Germany, 2010; Volume 4, pp. 565–582. [Google Scholar]
  25. Ma, L.; Li, M.; Blaschke, T.; Ma, X.; Tiede, D.; Liang, C.; Chen, Z.; Chen, D. Object-based CD in urban areas: The effects of segmentation strategy, scale, and feature space on unsupervised methods. Remote Sens. 2016, 8, 761. [Google Scholar] [CrossRef] [Green Version]
  26. Desclée, B.; Bogaert, P.; Defourny, P. Forest change detection by statistical object-based method. Remote Sens. Environ. 2006, 102, 1–11. [Google Scholar] [CrossRef]
  27. Chehata, N.; Orny, C.; Boukir, S.; Guyon, D.; Wigneron, J.P. Object-based CD in wind storm-damaged forestusing high-resolution multispectral images. Int. J. Remote Sens. 2014, 35, 4758–4777. [Google Scholar] [CrossRef]
  28. Song, A.; Kim, Y.; Han, Y. Uncertainty Analysis for Object-Based Change Detection in Very High-Resolution Satellite Images Using Deep Learning Network. Remote Sens. 2020, 12, 2345. [Google Scholar] [CrossRef]
  29. Zhang, Y.; Peng, D.; Huang, X. Object-Based Change Detection for VHR Images Based on Multiscale Uncertainty Analysis. IEEE Geosci. Remote Sens. Lett. 2017, 15, 13–17. [Google Scholar] [CrossRef]
  30. Dou, F.Z.; Sun, H.C.; Sun, X.; Diao, W.H.; Fu, K. Remote Sensing Image Change Detection Method Based on DBN and Object Fusion. Comput. Eng. 2018, 44, 294–298, 304. [Google Scholar]
  31. Xu, L.; Jing, W.; Song, H.; Chen, G. High-resolution remote sensing image change detection combined with pixel-level and object-level. IEEE Access 2019, 7, 78909–78918. [Google Scholar] [CrossRef]
  32. Malila, W.A. Change Vector Analysis: An Approach for Detecting Forest Changes with Landsat. Available online: https://docs.lib.purdue.edu/cgi/viewcontent.cgi?article=1386&context=lars_symp (accessed on 3 November 2021).
  33. Bovolo, F.; Bruzzone, L. A Theoretical Framework for Unsupervised Change Detection Based on Change Vector Analysis in the Polar Domain. IEEE Trans. Geosci. Remote Sens. 2006, 45, 218–236. [Google Scholar] [CrossRef] [Green Version]
  34. Krinidis, S.; Chatzis, V. A Robust Fuzzy Local Information C-Means Clustering Algorithm. IEEE Trans. Image Process. 2010, 19, 1328–1337. [Google Scholar] [CrossRef]
  35. Gu, W.; Lv, Z.; Hao, M. Change detection method for remote sensing images based on an improved Markov random field. Multimedia Tools Appl. 2015, 76, 17719–17734. [Google Scholar] [CrossRef]
  36. Touati, R.; Mignotte, M.; Dahmane, M. Multimodal Change Detection in Remote Sensing Images Using an Unsupervised Pixel Pairwise Based Markov Random Field Model. IEEE Trans. Image Process. 2019, 29, 1. [Google Scholar] [CrossRef] [PubMed]
  37. Zhong, J.; Wang, R. Multi-temporal remote sensing change detection based on independent component analysis. Int. J. Remote Sens. 2006, 27, 2055–2061. [Google Scholar] [CrossRef]
  38. Nielsen, A.A.; Conradsen, K.; Simpson, J.J. Multivariate alteration detection (MAD) and MAF postprocessing in multispec-tral, bitemporal image data: New approaches to change detection studies. Remote Sens. Environ. 1998, 64, 1–19. [Google Scholar] [CrossRef] [Green Version]
  39. Wu, C.; Du, B.; Zhang, L. Slow Feature Analysis for Change Detection in Multispectral Imagery. IEEE Trans. Geosci. Remote Sens. 2014, 52, 2858–2874. [Google Scholar] [CrossRef]
  40. Gong, M.; Zhang, P.; Su, L.; Liu, J. Coupled Dictionary Learning for Change Detection From Multisource Data. IEEE Trans. Geosci. Remote Sens. 2016, 54, 7077–7091. [Google Scholar] [CrossRef]
  41. Deng, L.; Yu, D. Deep learning: Methods and applications. Found. Trends Signal Process. 2014, 7, 197–387. [Google Scholar] [CrossRef] [Green Version]
  42. Garcia-Garcia, A.; Orts-Escolano, S.; Oprea, S.; Villena-Martinez, V.; Martinez-Gonzalez, P.; Garcia-Rodriguez, J. A survey on deep learning techniques for image and video semantic segmentation. Appl. Soft Comput. 2018, 70, 41–65. [Google Scholar] [CrossRef]
  43. Liu, L.; Ouyang, W.; Wang, X.; Fieguth, P.; Chen, J.; Liu, X.; Pietikäinen, M. Deep Learning for Generic Object Detection: A Survey. Int. J. Comput. Vis. 2020, 128, 261–318. [Google Scholar] [CrossRef] [Green Version]
  44. Fan, J.; Lin, K.; Han, M. A Novel Joint Change Detection Approach Based on Weight-Clustering Sparse Autoencoders. IEEE J. Sel. Top. Appl. Earth Obs. Remote Sens. 2019, 12, 685–699. [Google Scholar] [CrossRef]
  45. Liu, J.; Gong, M.; Qin, K.; Zhang, P. A Deep Convolutional Coupling Network for Change Detection Based on Heterogeneous Optical and Radar Images. IEEE Trans. Neural Networks Learn. Syst. 2018, 29, 545–559. [Google Scholar] [CrossRef]
  46. Niu, X.; Gong, M.; Zhan, T.; Yang, Y. A Conditional Adversarial Network for Change Detection in Heterogeneous Images. IEEE Geosci. Remote Sens. Lett. 2018, 16, 45–49. [Google Scholar] [CrossRef]
  47. Lyu, H.; Lu, H.; Mou, L. Learning a Transferable Change Rule from a Recurrent Neural Network for Land Cover Change Detection. Remote Sens. 2016, 8, 506. [Google Scholar] [CrossRef] [Green Version]
  48. Luppino, L.T.; Hansen, M.A.; Kampffmeyer, M.; Bianchi, F.M.; Anfinsen, S.N. Code-aligned autoencoders for unsupervised change detection in multimodal remote sensing images. arXiv 2020, arXiv:2004.07011. [Google Scholar]
  49. Liu, G.; Yuan, Y.; Zhang, Y.; Dong, Y.; Li, X. Style transformation-based spatial-spectral feature learning for unsupervised change detection. IEEE Trans. Geosci. Remote. Sens. 2020, 1–15. [Google Scholar] [CrossRef]
  50. Dong, H.; Ma, W.; Wu, Y.; Gong, M.; Jiao, L. Local descriptor learning for change detection in synthetic aperture radar images via convolutional neural networks. IEEE Access 2018, 7, 15389–15403. [Google Scholar] [CrossRef]
  51. Hou, B.; Liu, Q.; Wang, H.; Wang, Y. From W-Net to CDGAN: Bitemporal Change Detection via Deep Learning Techniques. IEEE Trans. Geosci. Remote Sens. 2019, 58, 1790–1802. [Google Scholar] [CrossRef] [Green Version]
  52. Mou, L.; Bruzzone, L.; Zhu, X.X. Learning Spectral-Spatial-Temporal Features via a Recurrent Convolutional Neural Network for Change Detection in Multispectral Imagery. IEEE Trans. Geosci. Remote Sens. 2019, 57, 924–935. [Google Scholar] [CrossRef] [Green Version]
  53. Liu, R.; Cheng, Z.; Zhang, L.; Li, J. Remote Sensing Image Change Detection Based on Information Transmission and Attention Mechanism. IEEE Access 2019, 7, 156349–156359. [Google Scholar] [CrossRef]
  54. Chen, H.; Wu, C.; Du, B.; Zhang, L.; Wang, L. Change Detection in Multisource VHR Images via Deep Siamese Convolutional Multiple-Layers Recurrent Neural Network. IEEE Trans. Geosci. Remote Sens. 2020, 58, 2848–2864. [Google Scholar] [CrossRef]
  55. Zhan, Y.; Fu, K.; Yan, M.; Sun, X.; Wang, H.; Qiu, X. Change Detection Based on Deep Siamese Convolutional Network for Optical Aerial Images. IEEE Geosci. Remote Sens. Lett. 2017, 14, 1845–1849. [Google Scholar] [CrossRef]
  56. Wang, M.; Tan, K.; Jia, X.; Wang, X.; Chen, Y. A deep siamese network with hybrid convolutional feature extraction module for change detection based on multi-sensor remote sensing images. Remote. Sens. 2020, 12, 205. [Google Scholar] [CrossRef] [Green Version]
  57. Fu, J.; Liu, J.; Tian, H.; Li, Y.; Bao, Y.; Fang, Z.; Lu, H. Dual Attention Network for Scene Segmentation. In Proceedings of the IEEE/CVF Conference on Computer Vision and Pattern Recognition (CVPR), Long Beach, CA, USA, 16–20 June 2019; pp. 3141–3149. [Google Scholar]
  58. Wang, D.; Gao, F.; Dong, J.; Wang, S. Change Detection in Synthetic Aperture Radar Images based on Convolutional Block Attention Module. In Proceedings of the 2019 10th International Workshop on the Analysis of Multitemporal Remote Sensing Images (MultiTemp), Shanghai, China, 5–7 August 2019; pp. 1–4. [Google Scholar]
  59. Peng, X.; Zhong, R.; Li, Z.; Li, Q. Optical remote sensing image change detection based on attention mechanism and image difference. IEEE Trans. Geosci. Remote. Sens. 2021, 59, 7296–7307. [Google Scholar] [CrossRef]
  60. Wu, Z.; Shen, C.; Hengel, A.V.D. Wider or Deeper: Revisiting the ResNet Model for Visual Recognition. Pattern Recognit. 2019, 90, 119–133. [Google Scholar] [CrossRef] [Green Version]
  61. Foo, P.H.; Ng, G.W. High-level information fusion: An overview. J. Adv. Inf. Fusion 2013, 8, 33–72. [Google Scholar]
  62. Hu, J.; Shen, L.; Sun, G. Squeeze-and-Excitation Networks. In Proceedings of the IEEE Conference on Computer Vision and Pattern Recognition (CVPR), Salt Lake City, UT, USA, 18–23 June 2018; pp. 7132–7141. [Google Scholar]
  63. Ruder, S. An overview of gradient descent optimization algorithms. arXiv 2016, arXiv:1609.04747. [Google Scholar]
  64. He, K.; Zhang, X.; Ren, S.; Sun, J. Delving Deep into Rectifiers: Surpassing Human-Level Performance on ImageNet Classification. In Proceedings of the 2015 IEEE International Conference on Computer Vision (ICCV), Santiago, Chile, 7–13 December 2015; pp. 1026–1034. [Google Scholar] [CrossRef] [Green Version]
Figure 1. The schematic diagram of ResNet-CD.
Remotesensing 13 04597 g001
Figure 2. The structure schematic diagram of Siam-ResNet-CD.
Remotesensing 13 04597 g002
Figure 3. Schematic diagram of attention information fusion module.
Remotesensing 13 04597 g003
Figure 4. The detailed structures of attention information fusion module: (a) the common residual part; (b) the attention fusion part.
Remotesensing 13 04597 g004
Figure 5. The structure schematic diagram of Atten-SiamNet-CD.
Remotesensing 13 04597 g005
Figure 6. The schematic diagrams of SZTAKI AirChange Benchmark. The first row is Szada/2 data, and the second row is Tiszadob/3 data. (a1,a2) and (b1,b2) are images obtained in different time, and (c1,c2) is the corresponding ground truthing.
Remotesensing 13 04597 g006
Figure 7. The schematic diagrams of QuickBird dataset. The first row is the QuickBird-1 data, the second row is the QuickBird-2 data and the third row is the QuickBird-3 data. (a1a3) and (b1b3) are images obtained in different time, and (c1c3) is the corresponding ground truthing.
Remotesensing 13 04597 g007aRemotesensing 13 04597 g007b
Figure 8. The schematic diagrams of Shu Guang village data: (a) the SAR image obtained in 2008, (b) the optical image obtained in 2012 and (c) the ground truthing.
Remotesensing 13 04597 g008
Figure 9. The change detection results with different patch sizes: (a) the Kappa value; (b) the Acc value.
Remotesensing 13 04597 g009
Figure 10. The difference maps obtained by using different patch sizes: (a) the ground truthing, (b) the difference map obtained by using 18 × 18, (c) the difference map obtained by using 22 × 22 and (d) the difference map obtained by using 26 × 26.
Remotesensing 13 04597 g010
Figure 11. The change detection results for SZTAKI AirChange Benchmark. The first two rows are results for Szada/2 and the last two rows are results for Tiszadob/3 data. For both data, (a1,a2) ground truthing, (b1,b2) the result of DNN-CD, (c1,c2) the result of CNN-LSTM-CD, (d1,d2) the result of ResNet-CD, (e1,e2) the result of Siam-ResNet-CD and (f1,f2) the result of Atten-SiamNet-CD.
Remotesensing 13 04597 g011
Figure 12. The change detection maps for QuickBird-1 data: (a) the ground truthing, (b) the result of DNN-CD, (c) the result of CNN-LSTM-CD, (d) the result of ResNet-CD, (e) the result of Siam-ResNet-CD, and (f) the result of Atten-SiamNet-CD.
Remotesensing 13 04597 g012
Figure 13. The change detection maps for QuickBird-2 data and QuickBird-3 data. The first two lines are results for QuickBird-2 data, and the last two lines are results for QuickBird-3 data. For both data, (a1,a2) the ground truthing, (b1,b2) the result of CNN-LSTM-CD, (c1,c2) the result of ResNet-CD, (d1,d2) the result of Siam-ResNet-CD, and (e1,e2) the result of Atten-SiamNet-CD.
Remotesensing 13 04597 g013
Figure 14. The change detection maps for QuickBird-3 data: (a) the ground truthing, (b) the result of CNN-LSTM-CD, (c) the result of ResNet-CD, (d) the result of Siam-ResNet-CD, and (e) the result of Atten-SiamNet-CD.
Remotesensing 13 04597 g014
Table 1. The list of abbreviations.
AbbreviationFull Description
ResNetResidual Network
ResNet-CDChange Detection based on ResNet
Siam-ResNet-CDChange Detection based on Siamese ResNet
Atten-SiamNetAttention-Guided Siamese Fusion Network
AIFMAttention Information Fusion Module
Atten-SiamNet-CDChange Detection based on Attention-Guided Siamese Fusion Network
Table 2. The specific structure of ResNet32.
Layer NameOutput SizeResNet 32
Conv1 r × r × 16 [ 3 × 3 , 16], stride 1, padding 1
Layer1 r × r × 16 [ 3 × 3 ,   16 3 × 3 ,   16 ] × 5
Layer2 r 2 × r 2 × 32 [ 3 × 3 ,   32 3 × 3 ,   32 ] × 5
Layer3 r 4 × r 4 × 64 [ 3 × 3 ,   64 3 × 3 ,   64 ] × 5
Pooling 1 × 1 × 64 Global average pooling
Output 1 × 2 FC, softmax
Table 3. The detection results for Szada/2 data, QuickBird-1 data and Shu Guang village data and the bold text indicates the best results of the comparison.
DataAtten-SiamNet-CDPreRecAccKappaF1
Szada/2 dataSiamese0.7710.7960.9740.7830.769
Pseudo-Siamese0.7850.7890.9750.7870.774
QuickBird-1 dataSiamese0.8770.9030.9770.8900.877
Pseudo-Siamese0.8650.9050.9750.8840.871
Shu Guang village dataSiamese0.9280.9730.9960.9490.947
Pseudo-Siamese0.9540.9550.9970.9540.953
Table 4. The parameter quantities of Siamese network and Pseudo-Siamese network.
Atten-SiamNet-CDParameter Quantity
Siamese1.85 MB
Pseudo-Siamese3.67 MB
Table 5. The numerical indices of SZTAKI AirChange Benchmark; the bold text indicates the best results of the comparison.
DataMethodsPreRecAccKappaF1
Szada/2 dataDNN-CD0.6060.6240.9550.6150.591
CNN-LSTM-CD0.5990.7000.9560.6460.622
ResNet-CD0.6290.7040.9590.6650.643
Siam-ResNet-CD0.7870.7150.9720.7490.735
Atten-SiamNet-CD0.7710.7960.9750.7830.770
Tiszadob/3 dataDNN-CD0.9010.8950.9710.8980.881
CNN-LSTM-CD0.9180.9280.9780.9230.910
ResNet-CD0.9340.9210.9790.9270.915
Siam-ResNet-CD0.9250.9180.9770.9220.908
Atten-SiamNet-CD0.9510.9540.9860.9520.944
Table 6. The numerical indices on QuickBird dataset; the bold text indicates the best results of the comparison.
DataMethodsPreRecAccKappaF1
QuickBird-1DNN-CD0.9560.7710.9720.8530.838
CNN-LSTM-CD0.8680.8850.9740.8760.862
ResNet-CD0.8710.9050.9760.8880.874
Siam-ResNet-CD0.9090.8100.9720.8570.841
Atten-SiamNet-CD0.8770.9030.9770.8900.877
QuickBird-2CNN-LSTM-CD0.8590.9520.9740.9030.888
ResNet-CD0.9120.8480.9700.8790.862
Siam-ResNet-CD0.8670.9530.9750.9080.894
Atten-SiamNet-CD0.8980.9410.9790.9190.907
QuickBird-3CNN-LSTM-CD0.8840.8710.9740.8780.863
ResNet-CD0.8980.8760.9760.8870.874
Siam-ResNet-CD0.8970.8750.9760.8860.872
Atten-SiamNet-CD0.8970.9000.9780.8980.886
Table 7. The numerical indices for Shu Guang village data. Those bolder numbers indicate the best results in each index.
MethodsPreRecAccKappaF1
CNN-LSTM-CD0.9320.9560.9950.9430.941
ResNet-CD0.9080.9650.9950.9350.933
Siam-ResNet-CD0.9110.9770.9950.9430.941
Atten-SiamNet-CD0.9330.9760.9960.9540.952
Publisher’s Note: MDPI stays neutral with regard to jurisdictional claims in published maps and institutional affiliations.