Abstract
In recent years, high-resolution remote sensing semantic segmentation based on data fusion has gradually become a research focus in the field of land classification, which is an indispensable task of a smart city. However, the existing feature fusion methods with bottom-up structures can achieve limited fusion results. Alternatively, various auxiliary fusion modules significantly increase the complexity of the models and make the training process intolerably expensive. In this paper, we propose a new lightweight model called top-down pyramid fusion network (TdPFNet) including a multi-source feature extractor, a top-down pyramid fusion module and a decoder. It can deeply fuse features from different sources in a top-down structure using high-level semantic knowledge guiding the fusion of low-level texture information. Digital surface model (DSM) data and open street map (OSM) data are used as auxiliary inputs to the Potsdam dataset for the proposed model evaluation. Experimental results show that the network proposed in this paper not only notably improves the segmentation accuracy, but also reduces the complexity of the multi-source semantic segmentation model.
1. Introduction
The generation of high-resolution remote sensing images (RSI) has provided more convenient and detailed data sources for many civil applications, such as land classification, urban planning, and environmental monitoring. Most existing land classification methods are timeconsuming and expensive, and difficult to apply to fully explore the potential value of big remote sensing data. Therefore, the classification methods using machine learning or deep learning tools have gradually become the mainstream approaches to high-resolution remote sensing semantic segmentation.
Due to the limitation in computing power, traditional image segmentation algorithms [1,2,3] usually focus on the characterization of the image pixels and mathematical modeling of local features for clustering or segmentation. They require only regional spatial information and do not use high-level semantic information. Therefore, the segmentation often resulted in information loss and thus accuracies. In 2015, the birth of the fully convolutional network (FCN) [4] was a major breakthrough in semantic segmentation representing the era of deep learning. As a result, a large number of excellent end-to-end single-source semantic segmentation models have sprung up. Networks such as SegNet [5], U-Net [6], PSPNet [7] and DeepLab series [8,9,10,11] have achieved excellent segmentation results with a single input source.
However, the lack of sufficient information due to single sensing source input makes it difficult for semantic segmentation models to distinguish some similar instances such as buildings and roads with same colour. Data fusion refers to information processing technology that automatically analyzes and synthesizes a number of observational source inputs obtained under certain criteria to complete the required decision-making and evaluation tasks. Data fusion normally leads to significant performance improvement of image segmentation. Generally, such technologies based on deep learning mainly adopts multiple feature-level or decision-level fusion. Hence, it is natural to use the features extracted by the convolutional neural network (CNN) [12] for further processing such as fusion for segmentation. Moreover, different application scenarios have different choices of fusion objects (auxiliary data). Hazirbas et al. proposed a fusion network (FuseNet) [13], which uses depth information to assist RGB information in achieving better semantic segmentation results in indoor scenes. Sun et al. used digital surface model (DSM) [14] to provide height information for high-resolution remote sensing. The introduction of multi-source data once again broke through the upper bound of the segmentation accuracy of traditional methods.
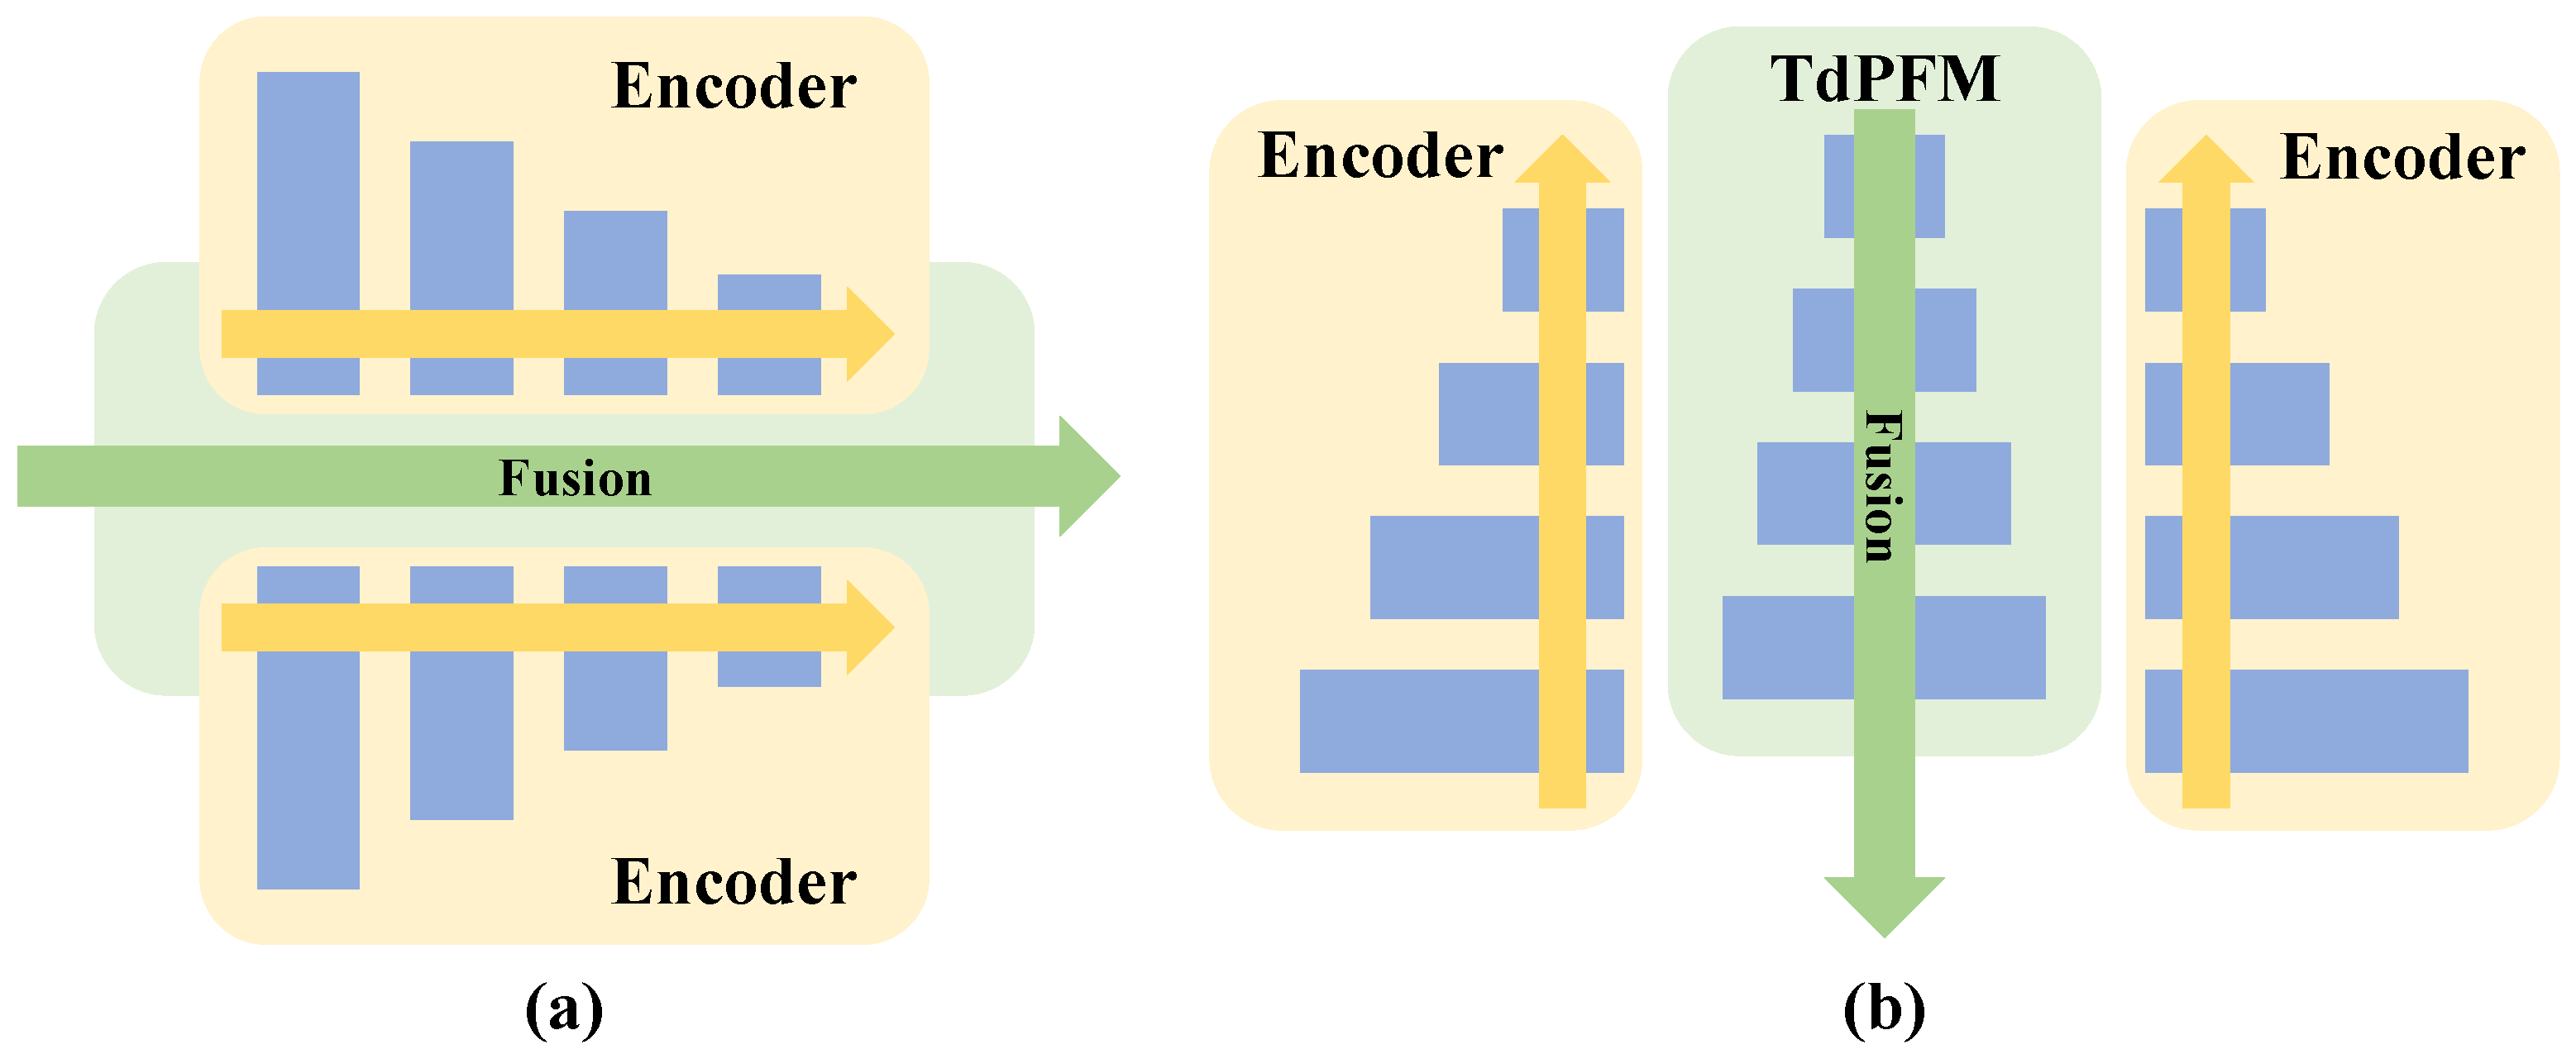
The current semantic segmentation models based on data fusion technology still has two problems. Firstly, most works [13,15] use channel merging or parallel encoders methods for data fusion, which all belong to bottom-up fusion structures. It can be seen from Figure 1a. As the fusion goes deeper, the feature maps usually become smaller and smaller and it is difficult to restore and take advantage of the high-level semantic knowledge in a high-resolution image [4]. Secondly, more and more auxiliary structures are added to fusion models to improve the results, leading to much increased difficulty in modeling training. We need to strike a balance between high quality results and low model complexity. To address these problems, we propose a novel top-down pyramid fusion network (TdPFNet) for high-resolution remote sensing semantic segmentation. As shown in Figure 1b, the network adopts a top-down fusion mode, in which high-level semantic knowledge guides low-level texture information to complete the fusion. The new approach ensures not only high accuracy of the segmentation results, but also reduces the complexity of the model. The specific contributions of this paper are as follows.
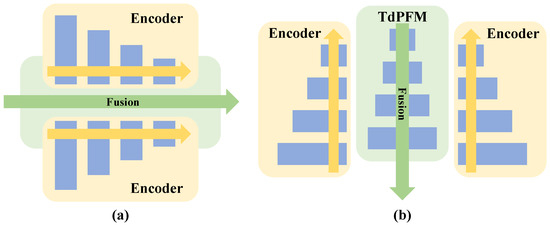
Figure 1.
Two kinds of fusion methods, which include (a) bottom-up fusion and (b) top-down fusion.
- We construct a top-down network called TdPFNet for multi-source semantic segmentation. The top-down fusion module can use high-level knowledge to guide low-level information to fuse the complementary features for more accurate segmentation.
- We compare two different auxiliary inputs, which include DSM and OSM. DSM data contain the height information that RGB image lacks, and the OSM data contain rich building and road information. We demonstrate that fusing OSM data with RSI can achieve better segmentation results than DSM.
- The experimental results show that our method successfully fuses the information from different sources with a lightweight structure. Moreover, TdPFNet proposed in this paper achieves competitive results with other state-of-the-art methods on Potsdam dataset.
The remainder of this paper is organized as follows. Section 2 introduces the related work of semantic segmentation. Section 3 introduces our proposed method in detail. Section 4 details the experimental results along with in-depth analysis. Section 5 further discusses and summarizes the advantages, limitations and potential improvements of the proposed model. Section 6 provides the conclusions and our future work perspectives.
2. Related Work
Semantic segmentation is a classic problem of computer vision. It involves taking some raw data (such as remote sensing images) as input and converting them into a mask with a highlighted area of interest, where each pixel is assigned a unique category ID. Different from the image classification task, semantic segmentation needs to correctly identify different discrete objects and mark semantic information in a complex and changeable background. Objects are often affected by phenomena such as occlusion, fragmentation, and lighting, which further increase the difficulty of semantic segmentation. So, it is hard to obtain high-precision semantic segmentation results, especially of complex scenes like high-resolution remote sensing images. Our work is built from the works of many other researchers. In this section, we briefly review the enlightening developments in high-resolution remote sensing semantic segmentation.
2.1. Deeplab Series
Chen et al. proposed the first version of DeepLab [8] on ICLR. It combines the advantages of deep convolutional neural network (DCNN) and fully connected conditional random field (FCCRF) [16]. DeepLabv2 [9] alleviates the loss of information caused by continuous pooling by replacing pooling layers with dilated convolutions. Deeplabv3 [10] removes the CRF module and uses batch normalization (BN) [17] layers to accelerate deep network training by reducing internal covariate shift. The final DeepLabv3+ [11] has two improvements. Firstly, the use of depthwise separable convolutions (Xception) [18] reduces the complexity of the model and improves the training speed. Secondly, a lightweight decoder is added and the high-level semantic information is fused with the low-level spatial information. DeepLabv3+ achieves a good balance between model complexity and accuracy.
2.2. Symmetric Encoder-Decoder
The SegNet [5] network proposed by Badrinarayanan et al. uses a symmetric encoder-decoder structure. The unique pooling indices allows the model to retain location information and to reduce the negative impact of pooling operations. It also eliminates the need to learn up-sampling parameters, thereby reducing the complexity of the model. Another well-known symmetric network is called U-Net [6], which includes more low-level regional features than FCN, so that the edge information of images can be recovered more finely. Even with a small training set, the model can still obtain a decent result. U-Net++ [19] refines the jump connection structure in U-Net, which improves the network’s adaptability and learning ability by using different scale features through short connection filling and superimposing features of different levels.
2.3. Multi-Scale Feature Perception
How to perceive and fuse multi-scale information has always been a big challenge for high-resolution semantic segmentation. Feature Pyramid Network (FPN) [20] extracts features layer by layer through top-down paths and horizontal paths, which enable the model to learn richer semantic information. Pyramid Scene Parsing Network (PSPNet) [7] combines ASPP and auxiliary loss functions to further improve the accuracy of semantic segmentation. DenseASPP [21] uses dense connections to combine different convolution modules with multiple dilation rates to effectively improve the receptive field of the model without significantly increasing the complexity. Dynamic Multi-scale Network (DMNet) [22] can adaptively capture multi-scale features to predict pixel-level labels.
2.4. Multi-Source Data Fusion
The fusion of multi-sensor data can effectively improve the accuracy of segmentation results [23,24,25,26,27,28] due to the complementarity of information from different sources. In the early works, some works used machine learning methods (such as SVM [29]) to fuse images from different sensors to obtain dense land segmentation results at the decision level. Waske et al. chose Synthetic Aperture Radar (SAR) images as the fusion object, because SAR is an active earth observation system, and can observe the ground all the time in any weather with a certain degree of ground penetration ability [30]. It is widely used in various applications such as disaster management [31,32,33]. A recent study [34] combined SAR and Thematic Mapper (TM) images to detect pixel changes. Some researches [35,36] fused the data of Sentinel-1 and Sentinel-2 for land classification. In addition, LiDAR data is also used in various remote sensing segmentation tasks [37,38,39]. Finally, the holding of various data fusion competitions [40,41,42] also greatly stimulated the enthusiasm of many researchers.
On the other hand, more and more excellent deep segmentation networks based on data fusion have been proposed with the emergence of FCN. In order to deal with indoor scene segmentation tasks, Hazirbas et al. proposed FuseNet [13] to combine RGB images and depth images. The backbone of FuseNet is still a classic encoder-decoder structure network similar to SegNet. In addition, it uses an auxiliary encoder to extract depth image features and then fuse them in the main encoder. Digital surface model (DSM) is used to provide height information for high-resolution remote sensing images in [14]. Sankaranarayanan et al. [15] fused high-resolution remote sensing images with 3-channel auxiliary input including normalized DSM, NDVI and IR data to get a clearer output.
3. Our Method
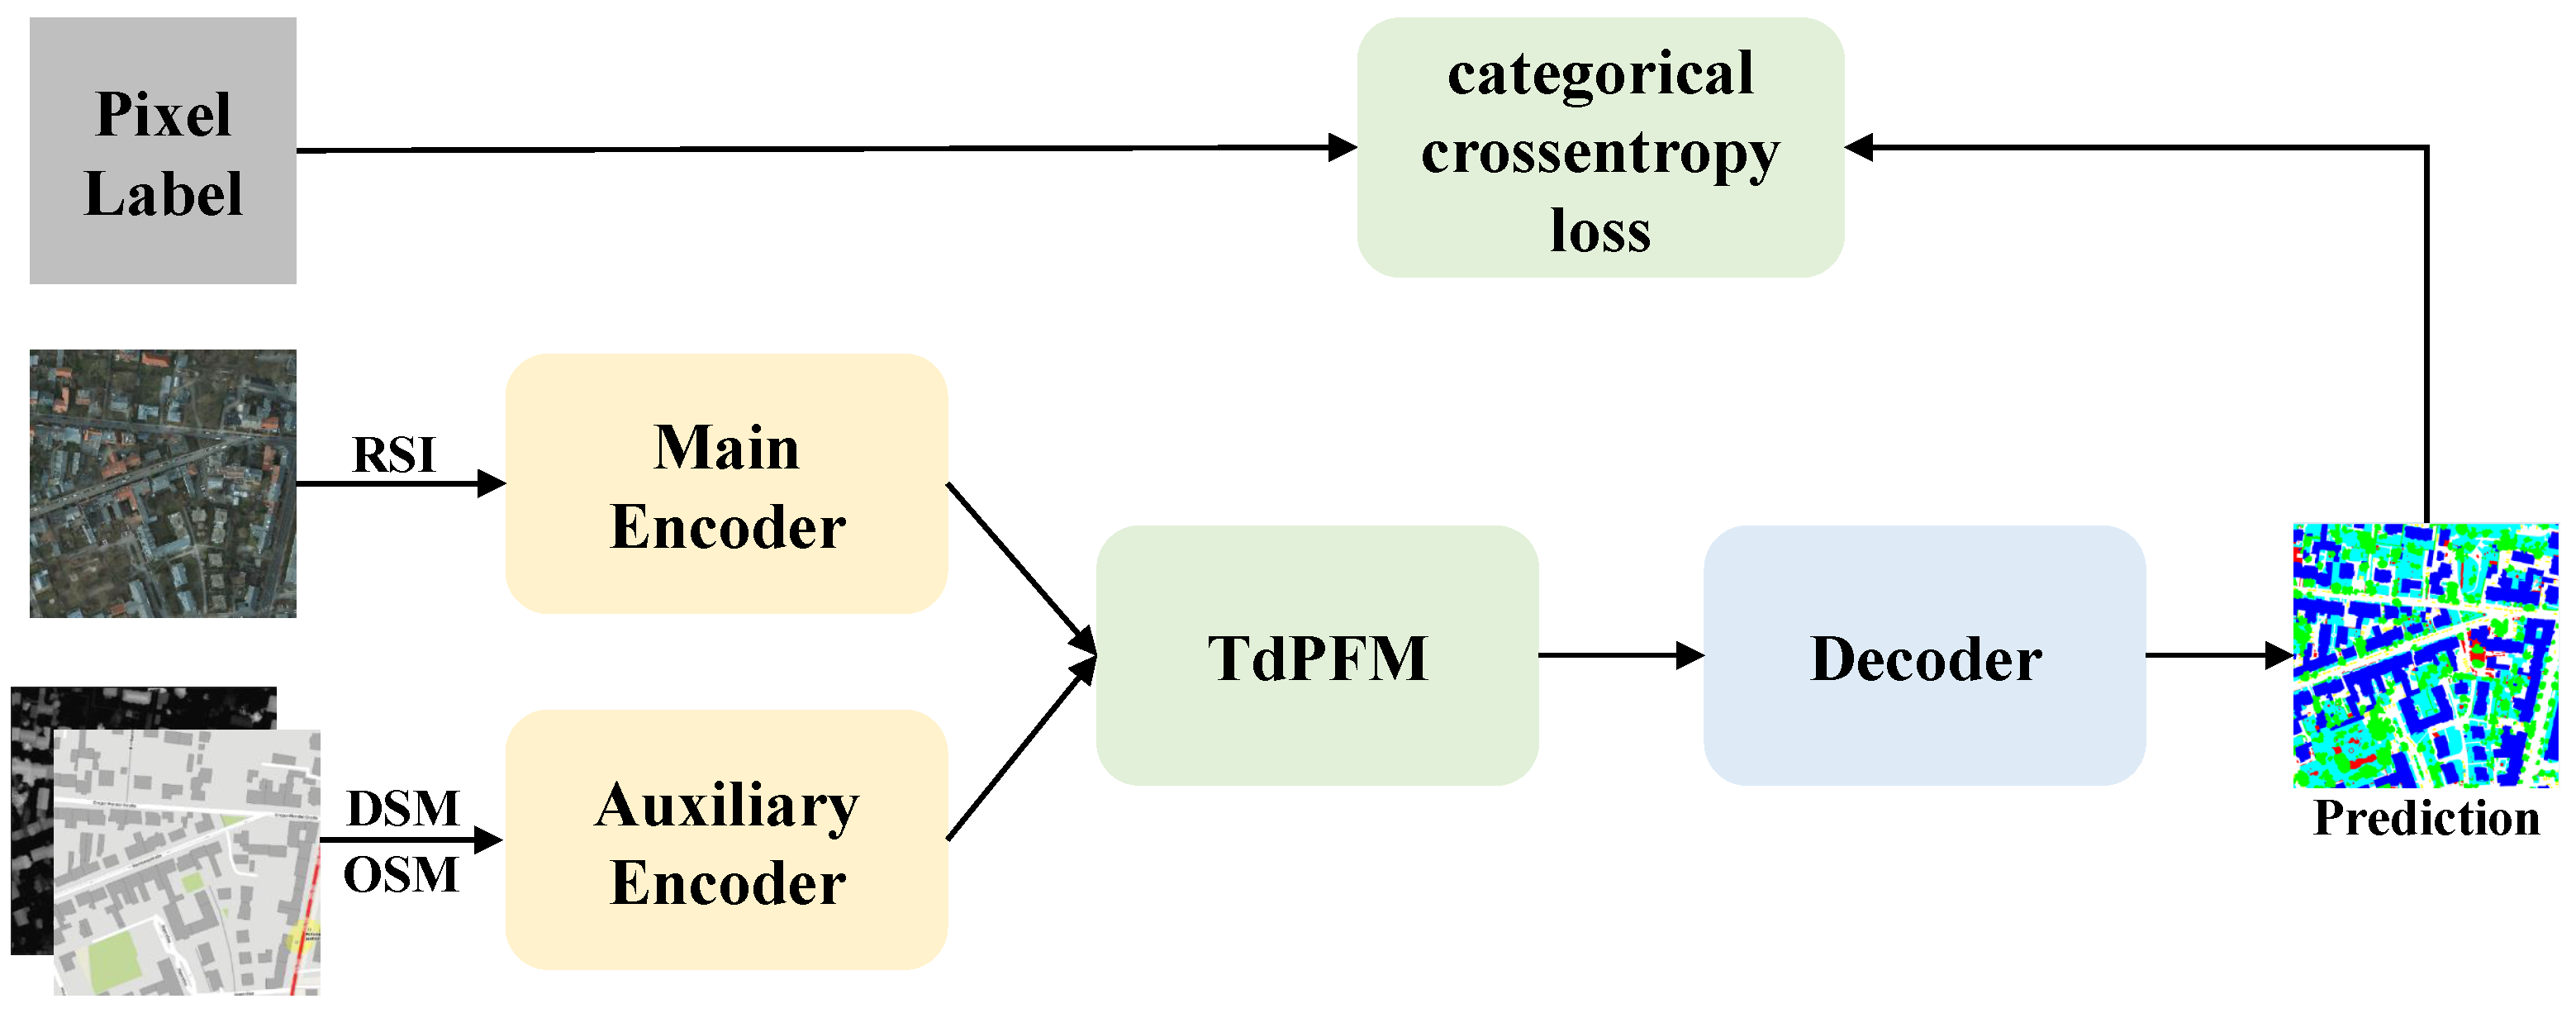
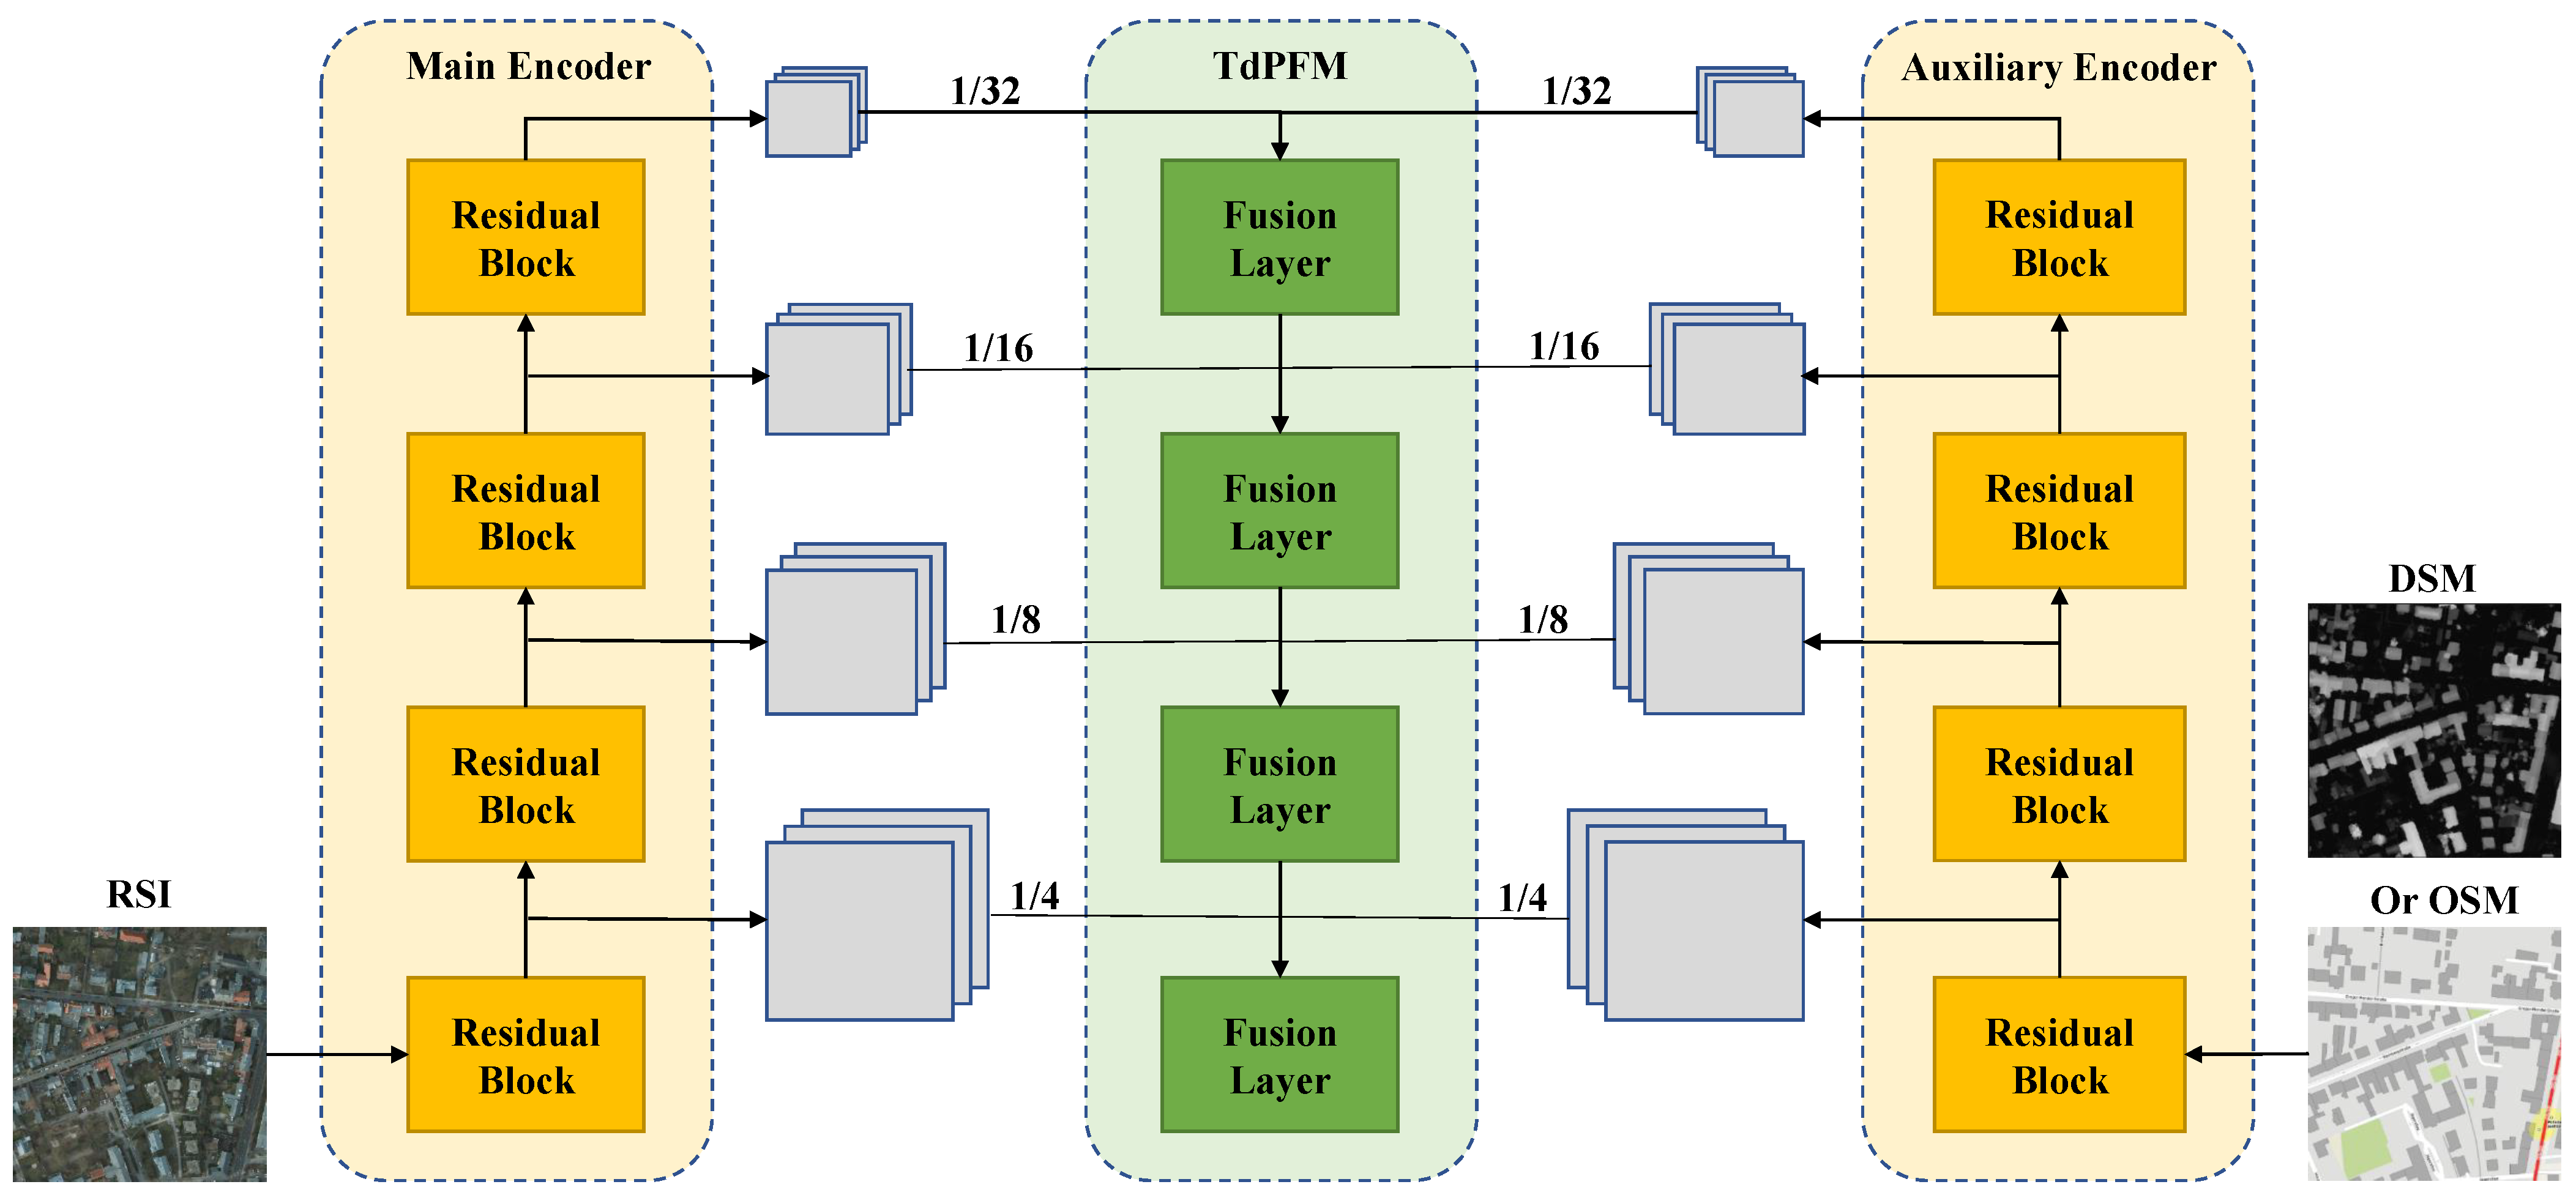
As shown in Figure 2, the model proposed in this paper can be divided into three modules, which include a multi-source feature extractor, a top-down pyramid fusion module and a decoder. The multi-source feature extractor consists of two lightweight encoders to receive high-resolution remote sensing data and auxiliary data. Both of them use the mainstream backbone network called residual network (ResNet). ResNet with deep structure can efficiently extract multi-scale features from input images, while the existance of the bottleneck blocks makes it possible to have fewer parameters. The extracted features are fed into top-down pyramid module for fusion. It fuses the data in a top-down structure, where high-level semantic knowledge can effectively guide the complementation of low-level information. The top-down model makes it easier to learn comprehensive knowledge of remote sensing images for accurate distinctions between different object categories. Finally, the decoder is used to restore multi-source and multi-scale features to pixel-level semantic labels. It is worth noting that these modules are designed in a lightweight structure. The new network will be detailed in the remainder of this section.

Figure 2.
The overall structure of TdPFNet.
3.1. Multi-Source Feature Extractor
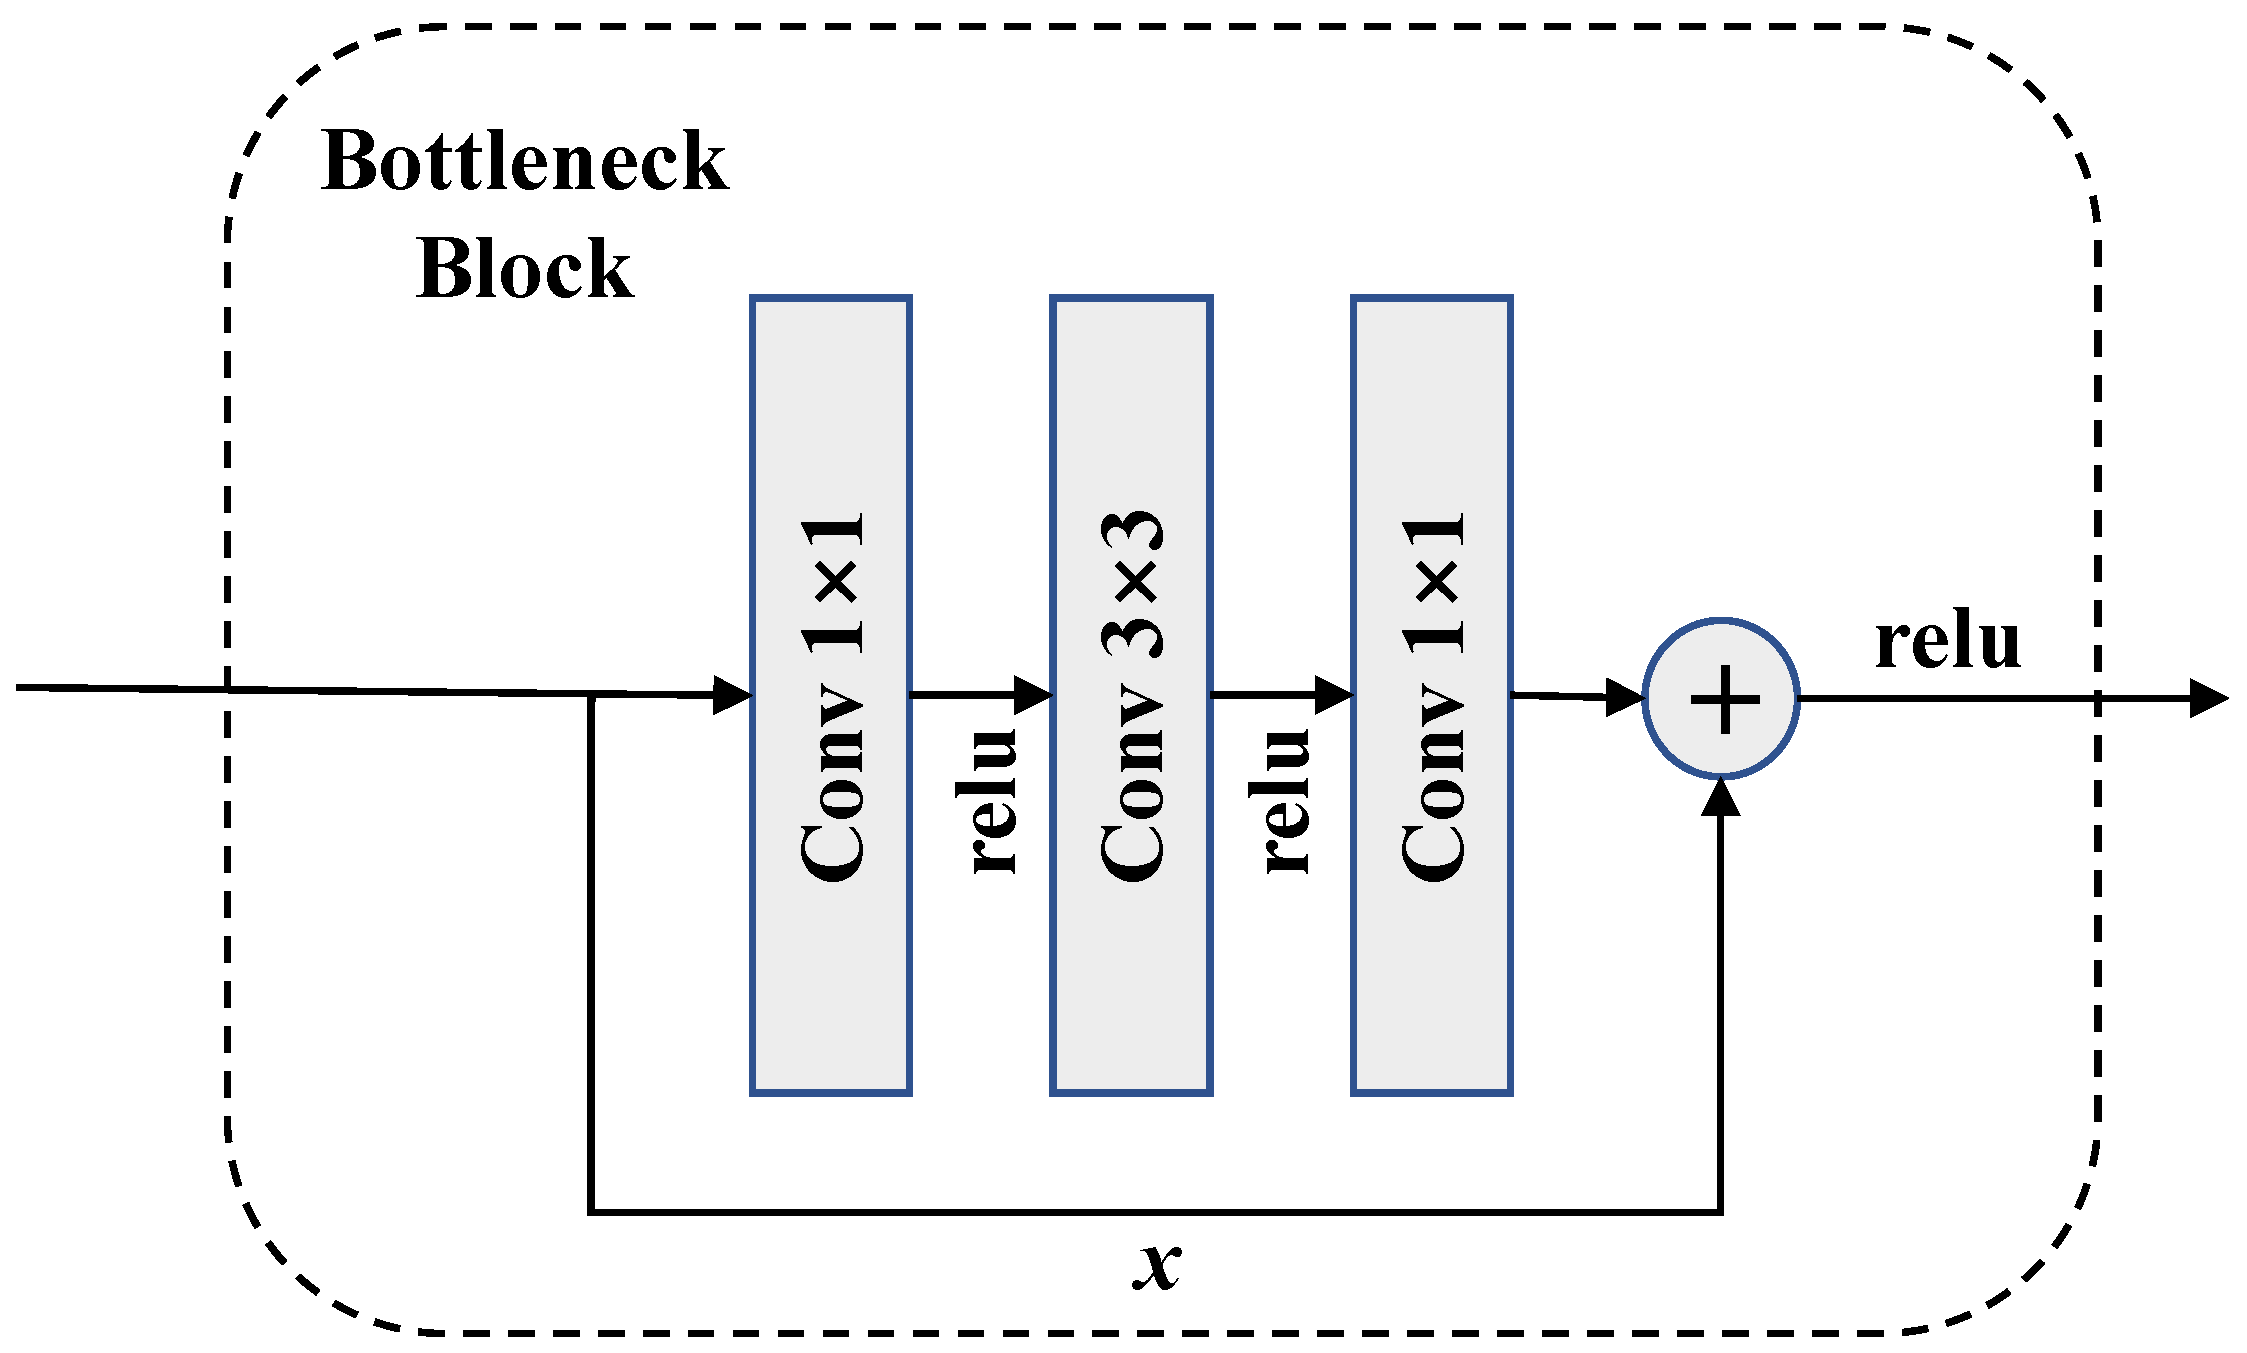
The multi-source feature extractor is composed of two lightweight encoders to extract the features of remote sensing images and auxiliary images at the same time. Compared with the single input model of merged channels, multiple branches can perform better in extracting features from different sources [13]. However, multiple encoders also bring about higher model complexity. The backbone network used in this work is called ResNet, and can easily achieve a deep structure with fewer negative effects. As shown in Figure 3, the residual structure composed of one convolutional layer and two convolutional layers is called bottleneck block. In order to reduce the computational complexity, the data dimensionality is reduced at the input and then restored after a convolution. Bottleneck blocks are widely used in deep structures, such as ResNet-101 and ResNet-152. Therefore, even with hundreds of layers, they are still considered to be lightweight networks.
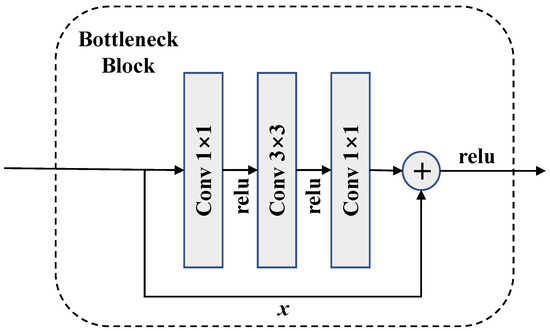
Figure 3.
The structure of a bottleneck block, where represents the input feature map, the fitting function of each block is and the expected latent mapping is . fits together with by skip connection. Instead of learning directly, the structure learns the residual for reduced complexity.
We use ResNet-101 as the main encoder to extract multi-scale features of high-resolution remote sensing images, which has been adopted by many excellent semantic segmentation models [7,11]. Empirically, we find that ResNet-50 is already sufficient to extract the features of auxiliary inputs with acceptable model complexity. Specifically, we remove fully connected layers for classification to form a fully convolutional structure to fittingly perform the pixel-level segmentation task. Two encoders simultaneously extract features in four different scales (from 1/4 to 1/32), and then send them into top-down pyramid fusion module (TdPFM).
3.2. Top-Down Pyramid Fusion Module
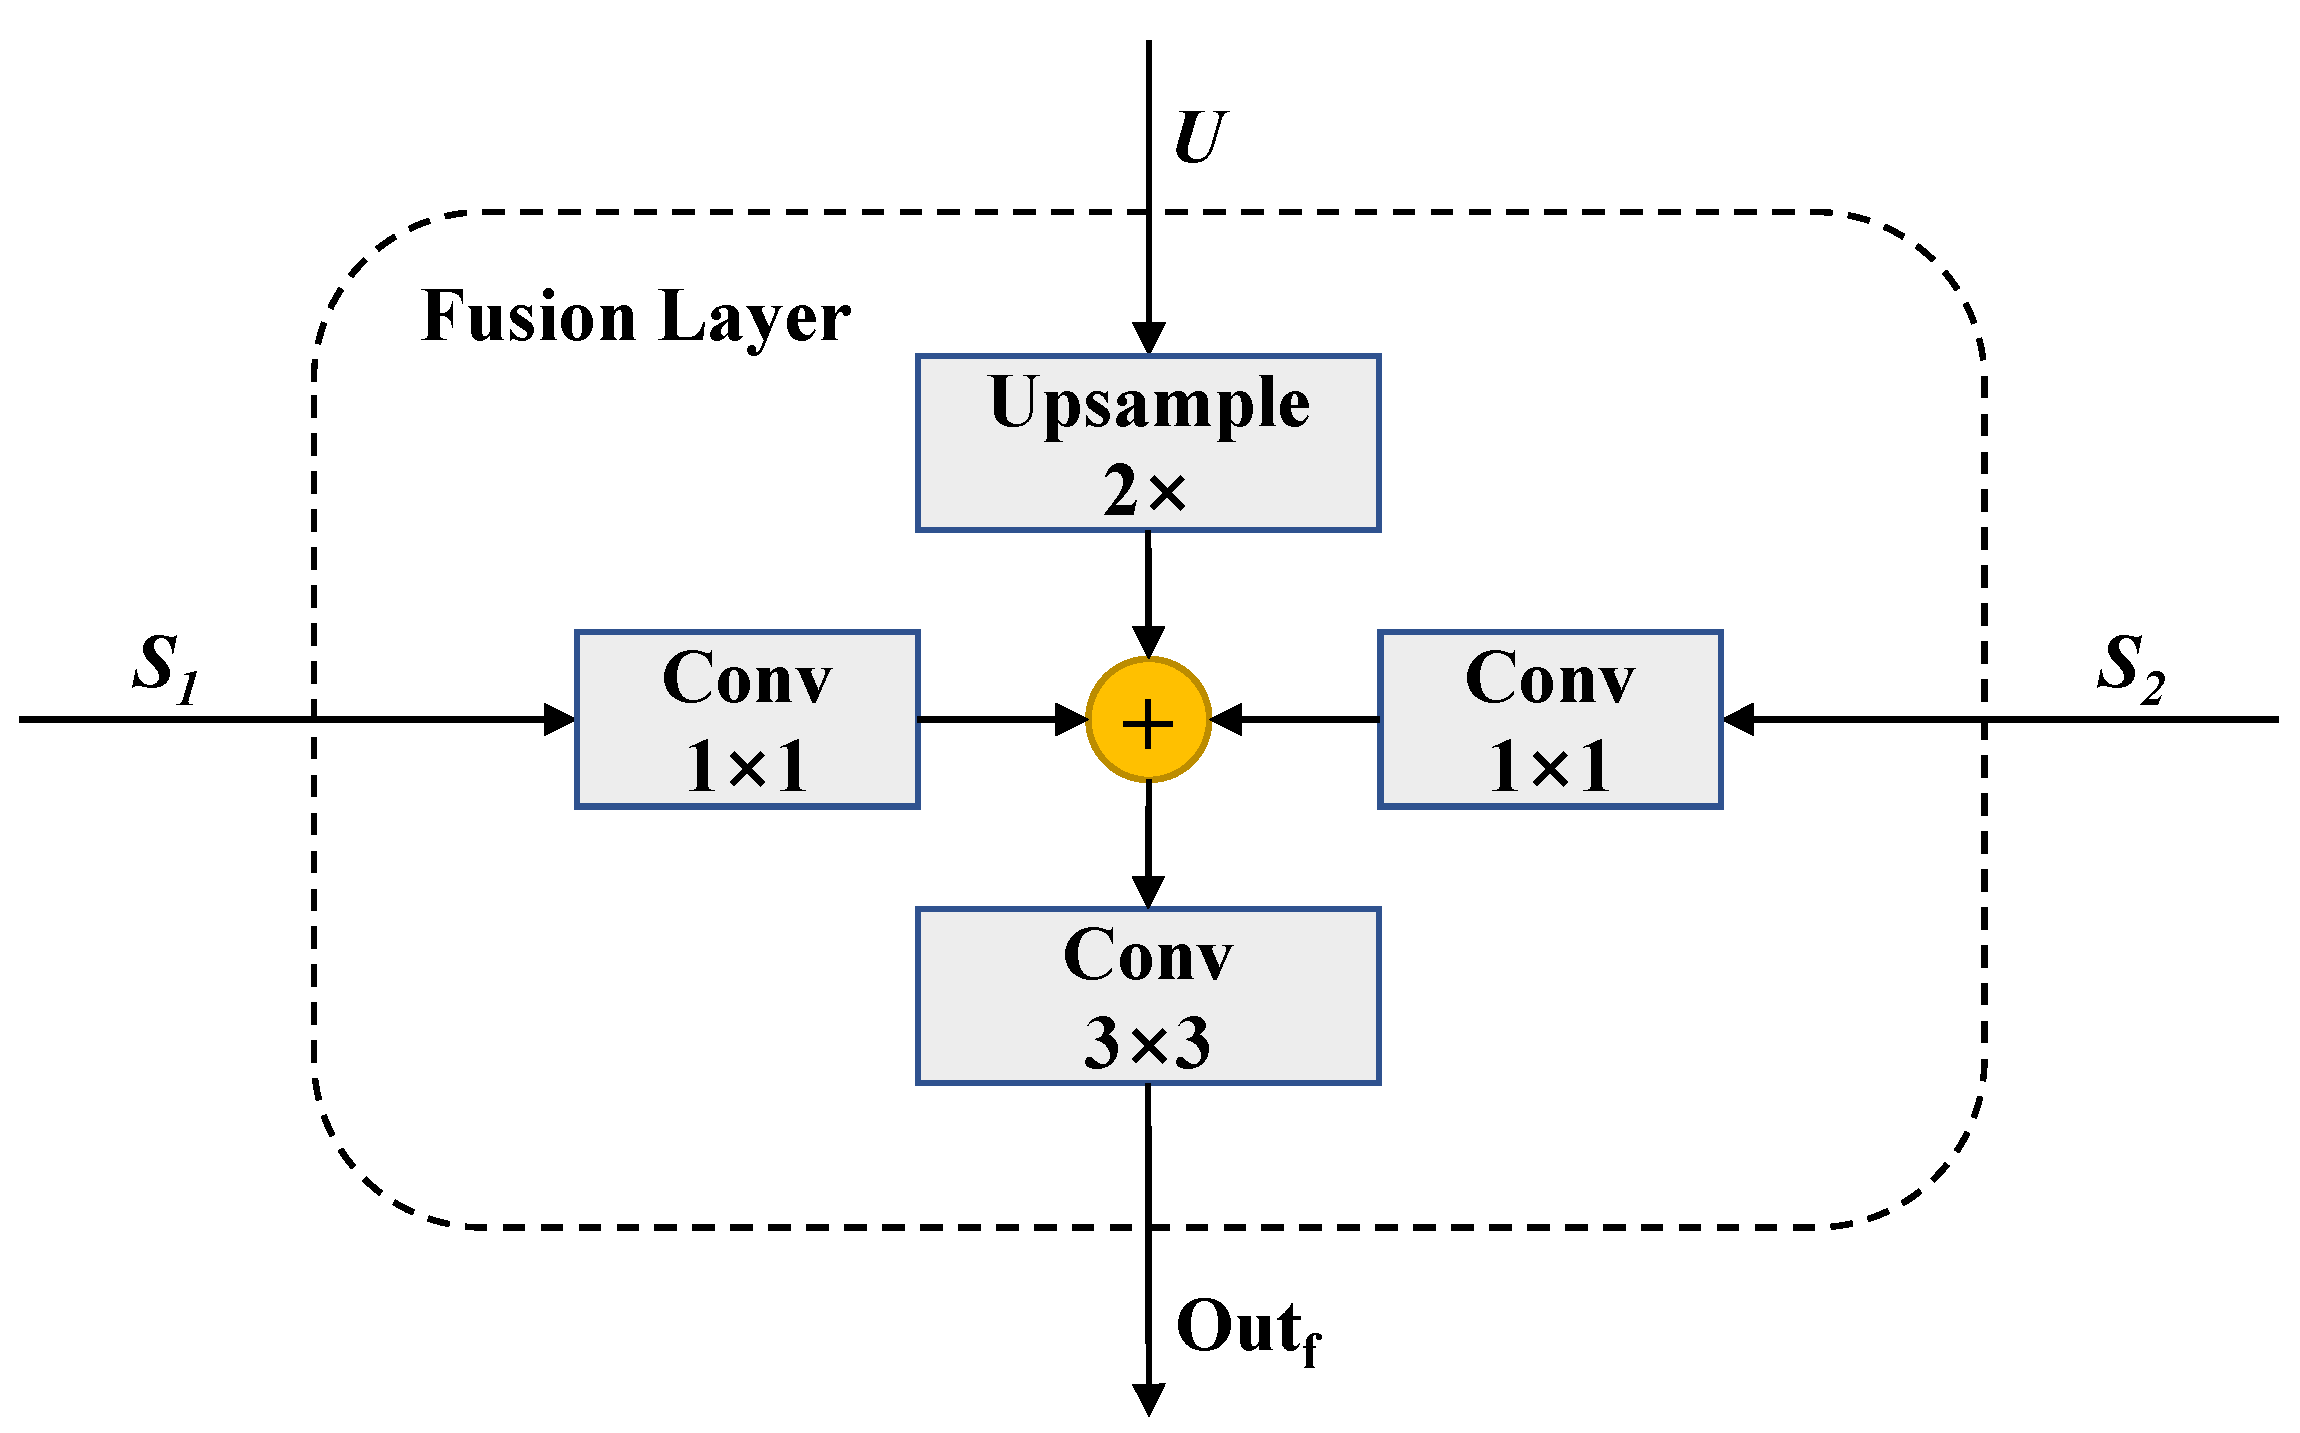
Traditional semantic segmentation methods based on data fusion either use simple fusion like channel-merging that may lose the multi-scale characteristics from different images, or include too many redundant fusion structures unnecessarily for high accuracy, leading to significantly increased model complexity. We aim to find a structure to balance between high-quality results and model complexity. The traditional bottom-up fusion methods are difficult to fully fuse the low-level details due to lacking information from high-level semantics. Therefore, we design a top-down pyramid fusion module, which can effectively fuse features from different sources and scales. The new model allows higher level features to guide the fusion of current features, and can easily achieve sufficient information fusion.
The top-down pyramid fusion module in Figure 4 can be divided into four layers to receive multi-source features of four different scales extracted by ResNet. The specific structure of each layer is shown in Figure 5. Except for the top layer, each data fusion unit contains three input paths and one output path. The two horizontal paths receive two feature maps of the same scale from main and auxiliary encoder, and the vertical path receives upsampling results output by the previous layer, which can provide effective high-level guidance for current fusion.
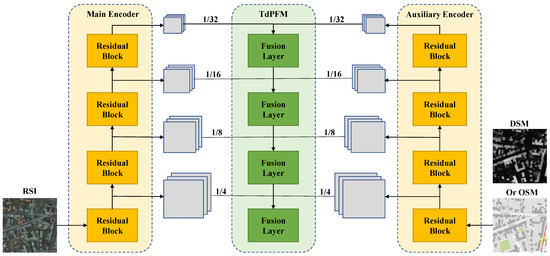
Figure 4.
The overall structure of TdPFNet (excluding decoder). It mainly includes two modules: Multi-source feature extractor and multi-source feature pyramid fusion module. The first module includes the main encoder and the auxiliary encoder used to receive high resolution remote sensing data and auxiliary data, respectively. The second module contains four fusion layers. The extracted features contain four different scales (from to ), and are sent to TdPFM for fusion.
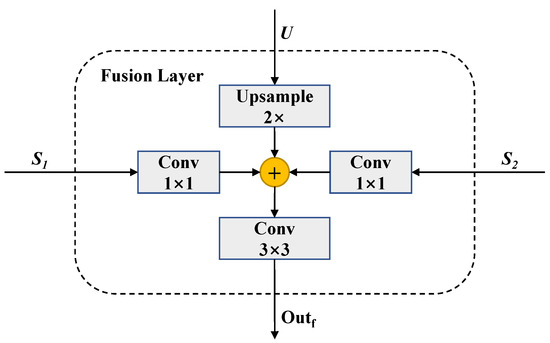
Figure 5.
The structure of a fusion layer. If it is the top layer, is not included.
The specific fusion output function is shown below:
where ⊕ denotes element-wise addition, and represent two features in the same scale and represents the feature map from the previous layer. is a bilinear up-sampling unit for doubling the size of the feature maps. represents a convolutional layer with a convolution kernel to adjust features from different sources to the same number of channels (256). A convolution is appended to each merged feature to reduce the aliasing effect of upsampling. The fused features are sent to the next layer to provide high-level semantic guidance. The final outputs of four different scales are fed to the decoding module to be restored to dense pixel-level labels.
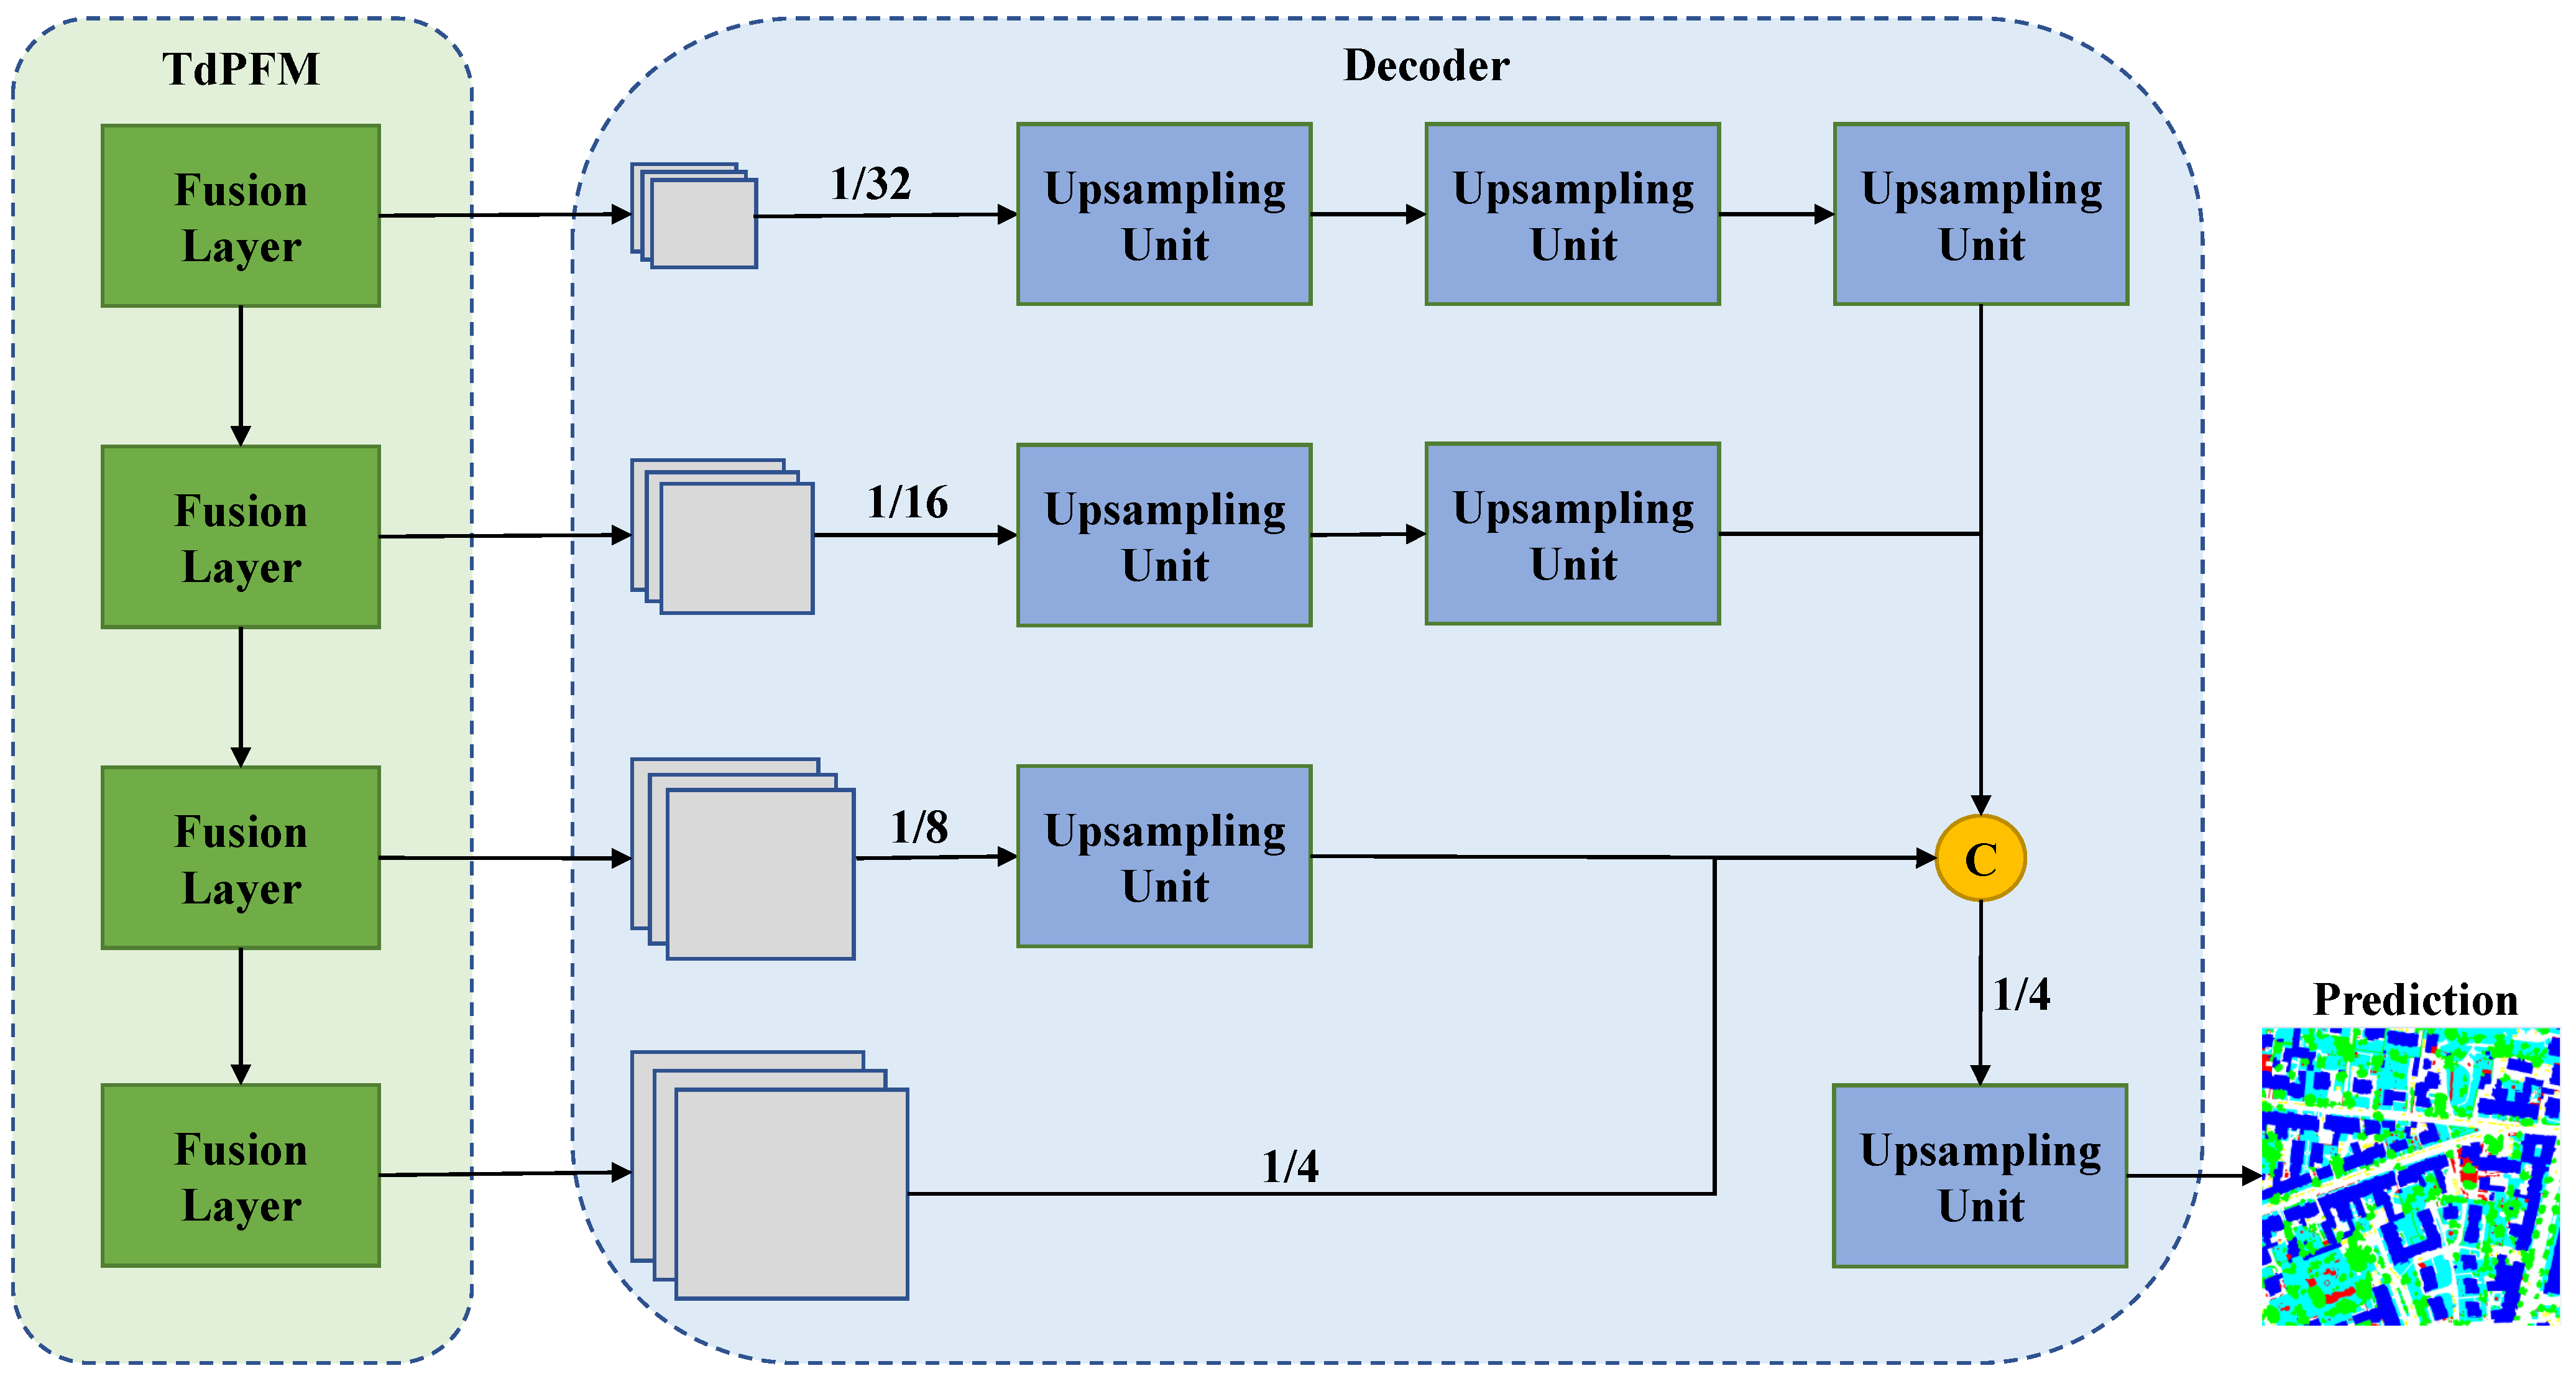
3.3. Lightweight Decoder
The main function of the decoder is to restore the fused sparse features into dense semantic segmentation results. Empirically, deep-level features usually contain rich semantic information, but lack the low-level spatial details. To better restore the image texture details, traditional symmetric decoding methods such as SegNet and U-Net always fuse the low-level information from encoders multiple times through jump connections during decoding. However, in our top-down fusion, the final outputs from the fusion module already contains a wealth of high-level and low-level information. Therefore, we only need to arrange and fuse multi-level information, and then reconstruct them into the original resolution to obtain accurate segmentation results.
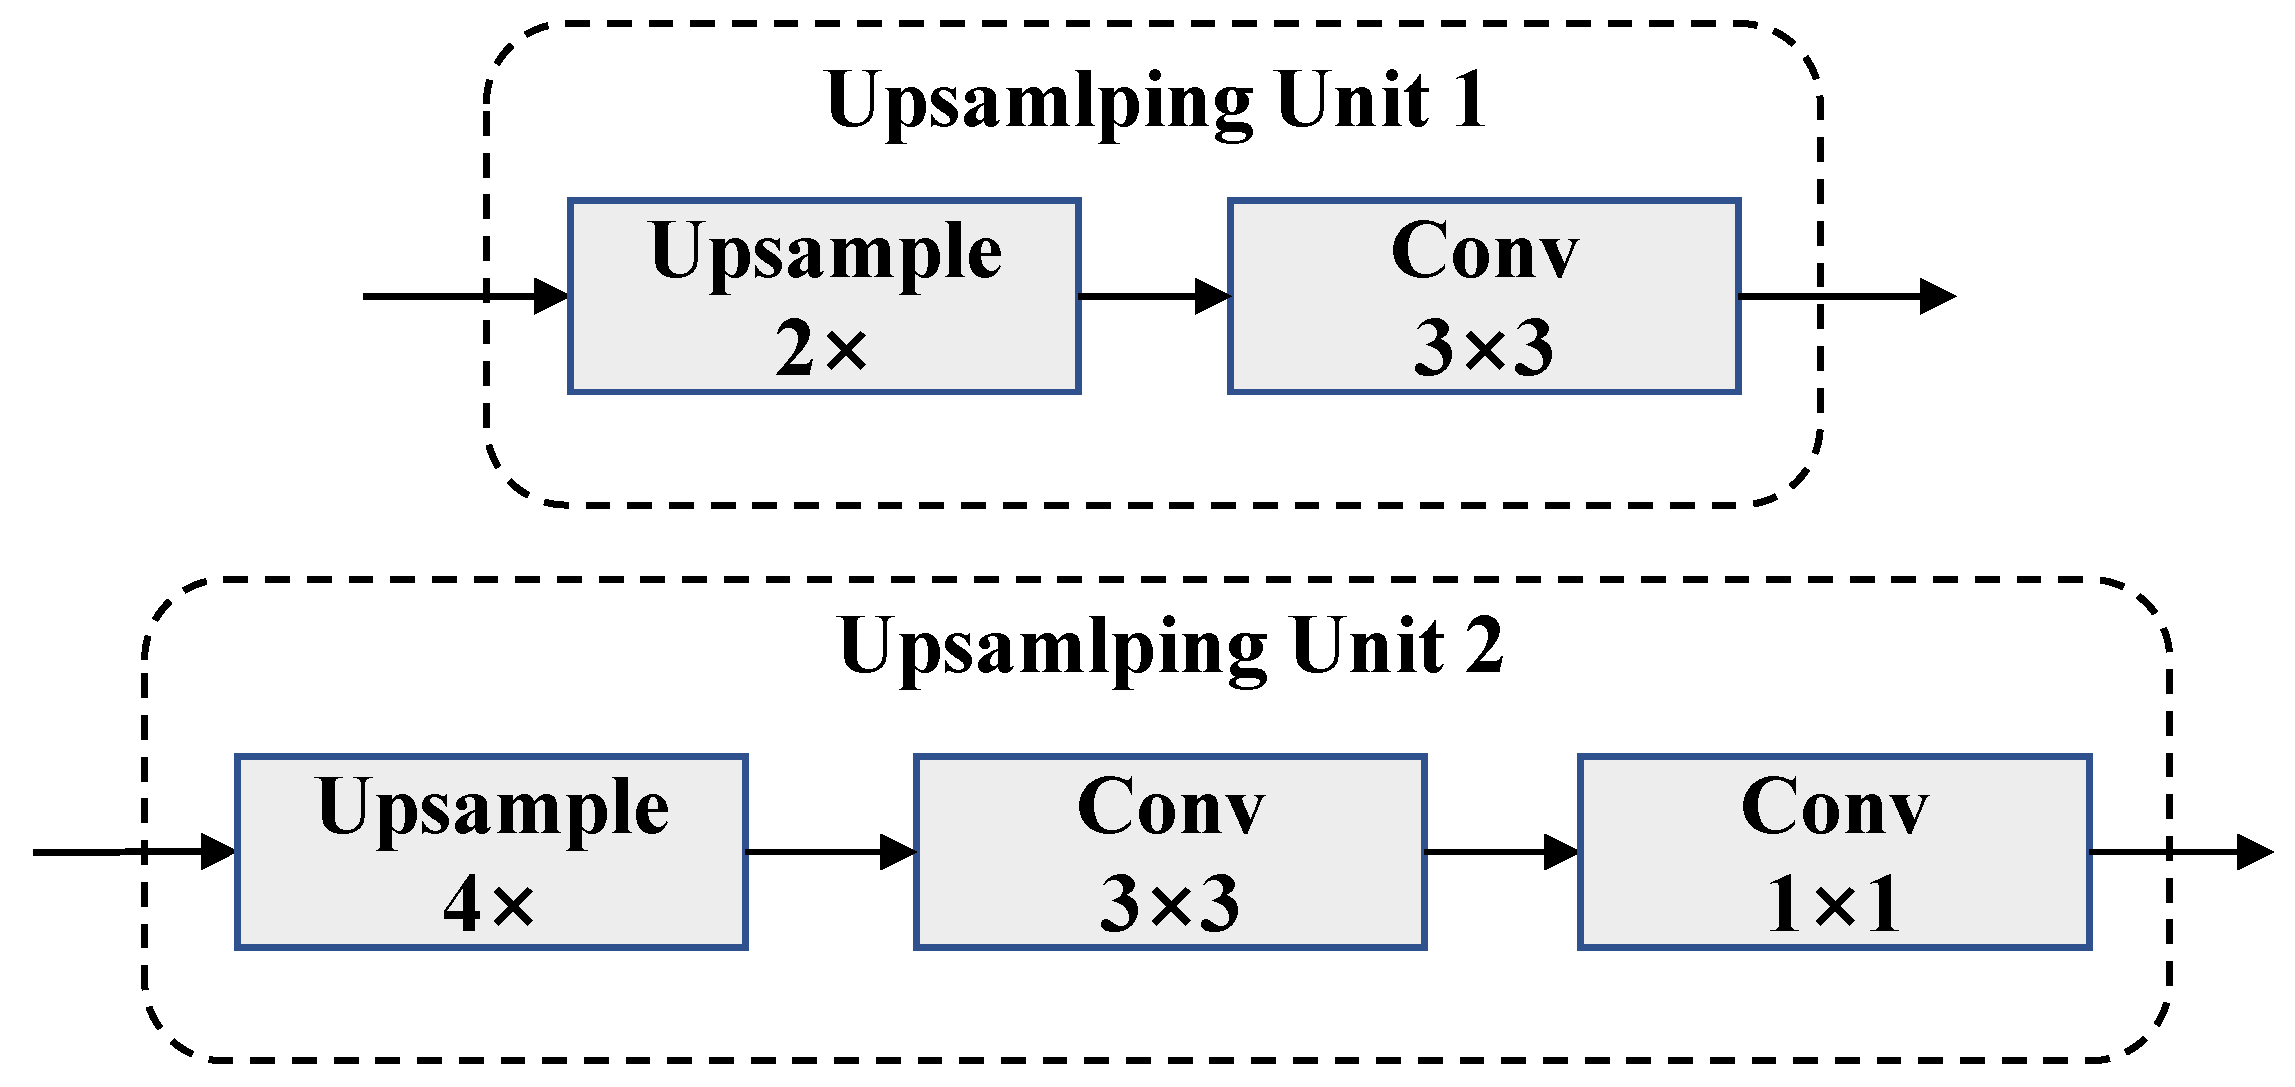
As shown in Figure 6, we first upsample feature maps of each layer to 1/4 of the original resolution through upsampling units (type 1, one or more in series). Each upsampling unit is composed of a bilinear interpolator and a convolution, as shown in Figure 7. After all features have been concatenated, the number of channels is adjusted by a convolution for fusion, because fewer channels mean reduced computational operations. Then, we upsample (type 2) the fusion result to restore the original resolution and use a convolution to achieve the final classification channels. Finally, the output is obtained through the softmax activation function. In addition, we added a BN layer after each convolutional layer to accelerate the convergence rate.

Figure 6.
The overall structure of TdPFNet (excluding extractor). It mainly includes two modules: Multi-source feature pyramid fusion module and lightweight decoder. The first module contains four fusion layers with different scales. The second module contains some upsampling units (where C represents concatenation operation). Multi-scale features from TdPFM are reconstructed to the images with the original resolution through multiple upsampling operations.
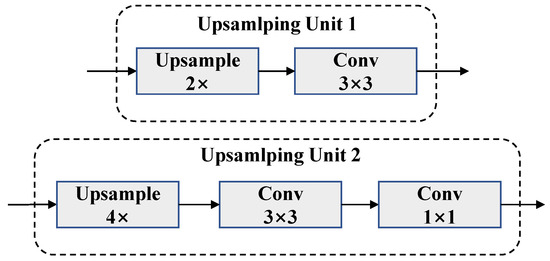
Figure 7.
The structure of upsampling unit.
Compared with the symmetric decoding methods such as SegNet or U-Net adopted by FuseNet, the decoding scheme with the top-down pyramid structure is less costly in complexity. Because we only use one block in each layer when decoding and unify the number of channels to 256, the model complexity is reduced significantly. The new design allows good segmentation accuracy to be achieved while maintaining lightweight model structure.
3.4. Loss Function
The loss function is used to estimate the difference between the predicted value of the deep learning model and the groud truth . It is also a necessary component for optimizing model parameters through backpropagation. The loss function is usually a non-negative scalar function represented by . The smaller the value of the function is, the higher the accuracy of the model.
In this work, we use the categorical crossentropy loss function:
where n represents the total number of categories, is the i-th bit of the one-hot encoding vector of the label, and represents the i-th bit of the softmax output vector. Categorical crossentropy loss function performs well for the instances with only one category. Therefore, it is suitable to deal with the single label classification problems such as the dataset used in this work.
4. Experiment
In this section, we use multiple sets of experiments to verify the superiority of TdPFNet to other models. First, we analyze the pros and cons of DSM and OSM as auxiliary data sources by ablation studies. Then, the performance of the proposed model is compared with those of the traditional single-source segmentation methods and the latest multi-source segmentation technologies. Finally, we analyze the complexity of the model.
4.1. Datasets
We evaluated our proposed model on the ISPRS2D high-resolution remote sensing imagedataset (https://www2.isprs.org/commissions/comm2/wg4/benchmark/semantic-labeling/, accessed on 16 October 2021). It provides two state-of-the-art airborne image datasets, consisting of very high resolution treue ortho photo (TOP) tiles and corresponding digital surface models (DSMs) derived from dense image matching techniques. Due to the limitation of OSM data collection, we selected Potsdam only as the evaluation dataset. Potsdam shows a typical historic city with large building blocks, narrow streets and dense settlement structure. It was manually divided into the six most common land cover categories including impervious surface, building, low vegetation, tree, car and background (marked in white, blue, cyan, green, yellow and red). The background class includes water bodies and other objects that look very different from everything else and that are usually not of interest in semantic object classification in urban scenes. The Potsdam dataset contains 38 patches of the same size, and each patch is composed of a TOP extracted from a larger TOP mosaic. The ground sampling distance of both, the TOP and the DSM, is 5 cm, and the pixel resolution is . 24 images are used for training and 14 images are used for testing. All images have corresponding pixel-level ground truth.
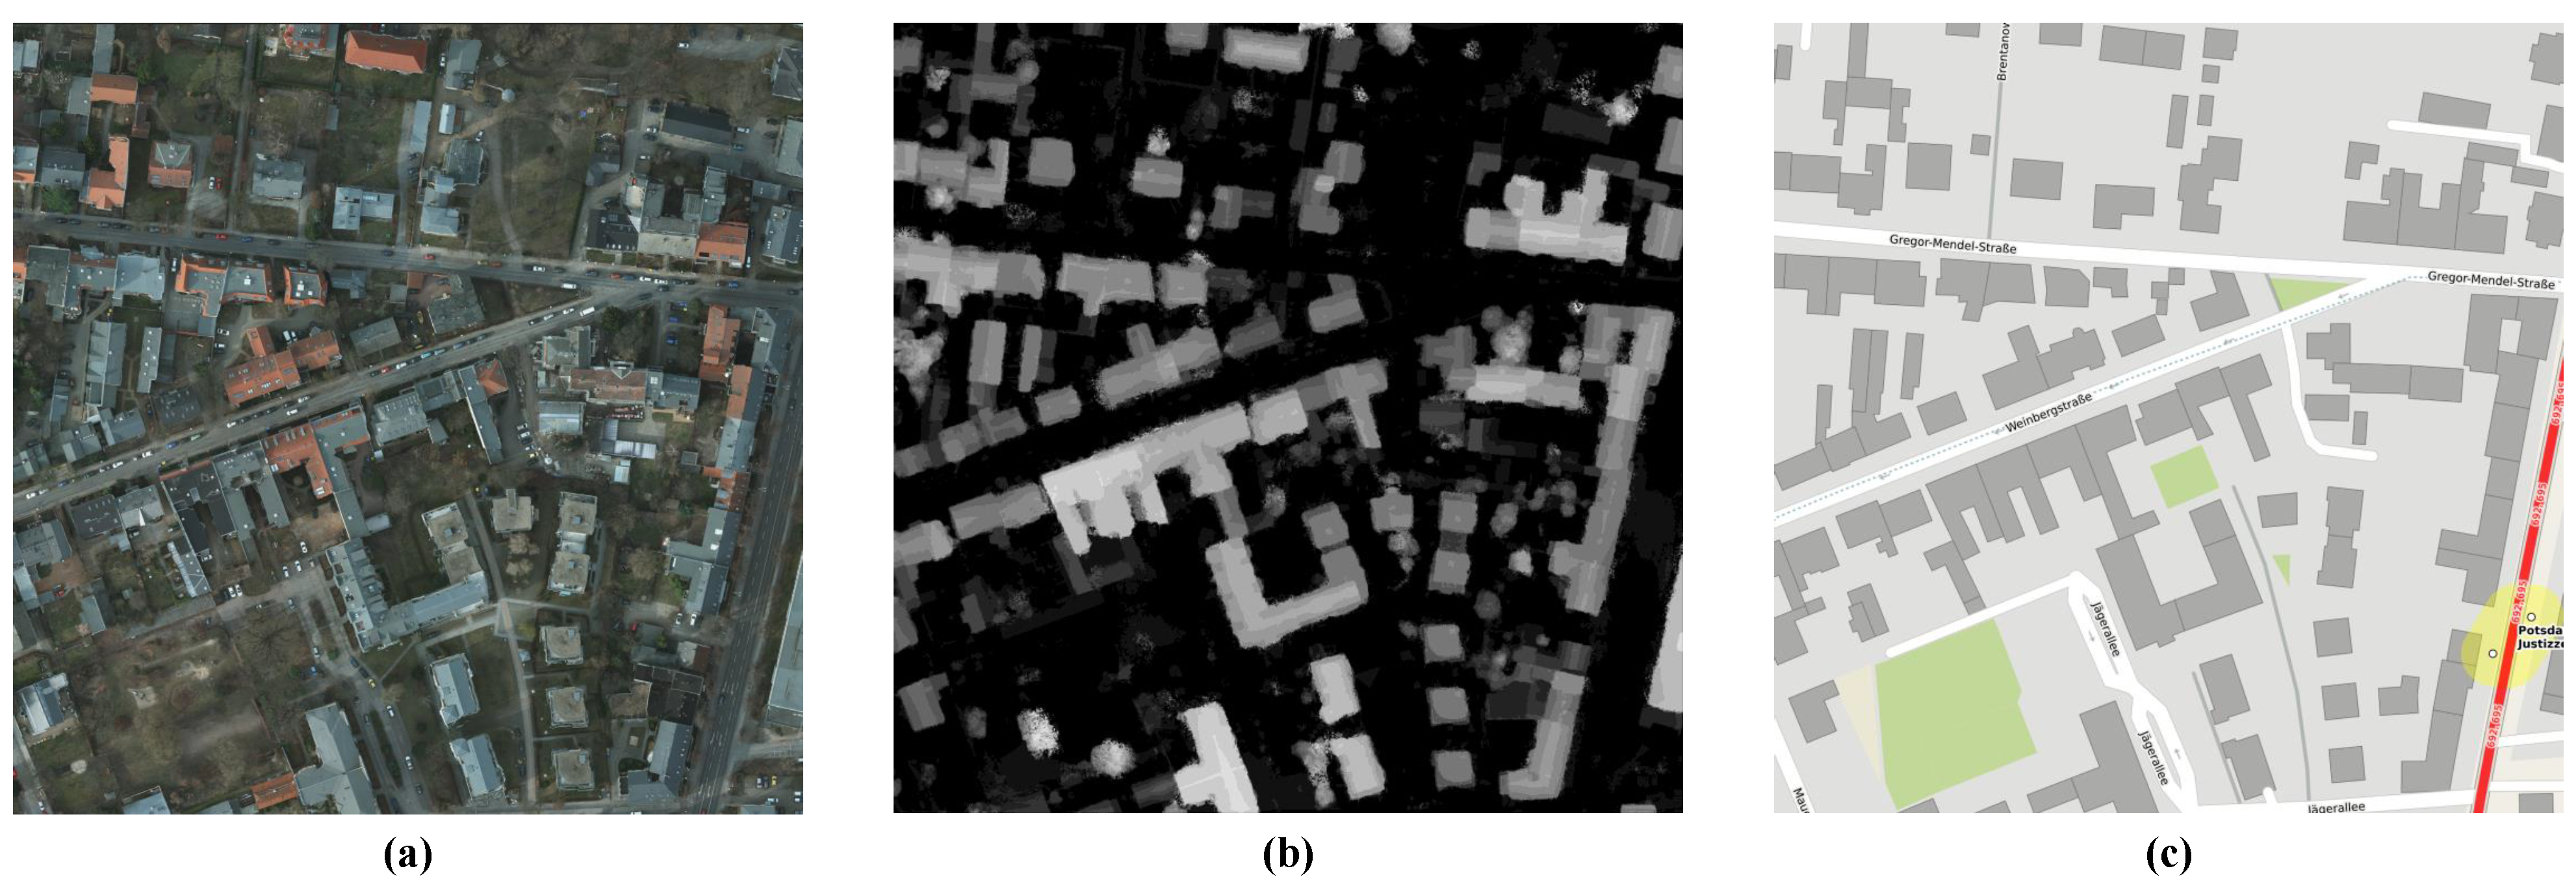
DSM is a ground elevation model that contains the height of ground buildings, bridges, and trees. It can provide additional height information for 2D remote sensing images. Therefore, it is also a mainstream dataset for fusion. In addition, we notice that there is a large remote sensing information resource that is available, but has not been fully utilized, which is called the public geographic information system (GIS) database, such as open street map (OSM). Some works [15] usually use it as a rough label to train the proposed model. Although containing some errors caused by volunteer-driven marking, OSM database is an easy-to-obtain and highly valuable resources. Therefore, we also selected OSM data as an auxiliary input for comparison and fusion processing, where the rich road and building information can be obtained to help the segmentation of remote sensing images. As shown in Figure 8, the first image shows the original high-resolution remote sensing image, the second one is the corresponding normalized DSM image and the third is the OSM data collected by ourselves. Different from the calibrated DSM data from the ISPRS2D, the OSM data of the corresponding city we collect requires additional manual coordinate correction to ensure that it aligns with the remote sensing images in spatial dimensions. Both DSM and OSM images are converted into 3 channels, which is the same as remote sensing RGB images, for convenience in data fusion processing.
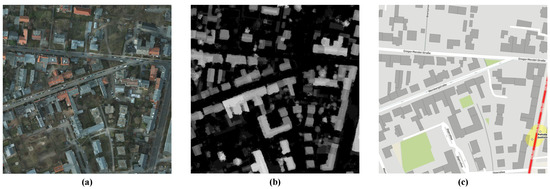
Figure 8.
A sample from Potsdam dataset. From left to right, they are the data for (a) original high-resolution remote sensing RGB image, (b) the normalized DSM image and (c) the corresponding OSM data.
4.2. Data Augmentation
As we all know, data augmentation can effectively reduce the risk of overfitting due to the insufficiency of training samples, and improve the generalization performance of deep learning models. Moreover, the semantic segmentation model proposed in this paper has parameters with the number far exceeding the size of the training set. It is obviously unrealistic to train the proposed model effectively by using the ISPRS2D dataset only. Therefore, we applied the following augmentation strategies to expand the training set. Firstly, we divided each image into patches with a pixel resolution of by random cutting. Secondly, we mirrored and flipped each patch. Finally, we randomly rotated each patch by 90 degrees. It is worth noting that the two auxiliary data sources and the groud truth need to be enhanced synchronously with the remote sensing data to ensure data consistency.
4.3. Implementation Details
The experiments in this paper are based on the deep learning framework Tensorflow2.1 with python3.8. The experimental platform is a workstation equipped with a Ubuntu 20.04 operating system. All bands of high-resolution images were normalized between , and the batch size of the input was set to 10. We used the pre-trained weights on ImageNet to initialize the backbone network, and the rest used the normal distribution initialization method, where the parameters were generated by a normal distribution with a mean value of 0 and a standard deviation of . The optimizer adopted was stochastic gradient descent (SGD) with the momentum of , which can improve the convergence speed of the networks. TdPFNet was then trained for 80 epochs with an initial learning rate of 0.01, which was reduced by a factor of 0.1 after 40th and 60th epochs. In order to evaluate the fusion results of TdPFNet, we used two common evaluation criteria called overall accuracy () and mean score ().
They are defined as follows:
where P is the number of Positive samples, N is the number of negative samples, , , and are the numbers of true positive, true negative, false positive and false negative samples, respectively.
4.4. Ablation Studies
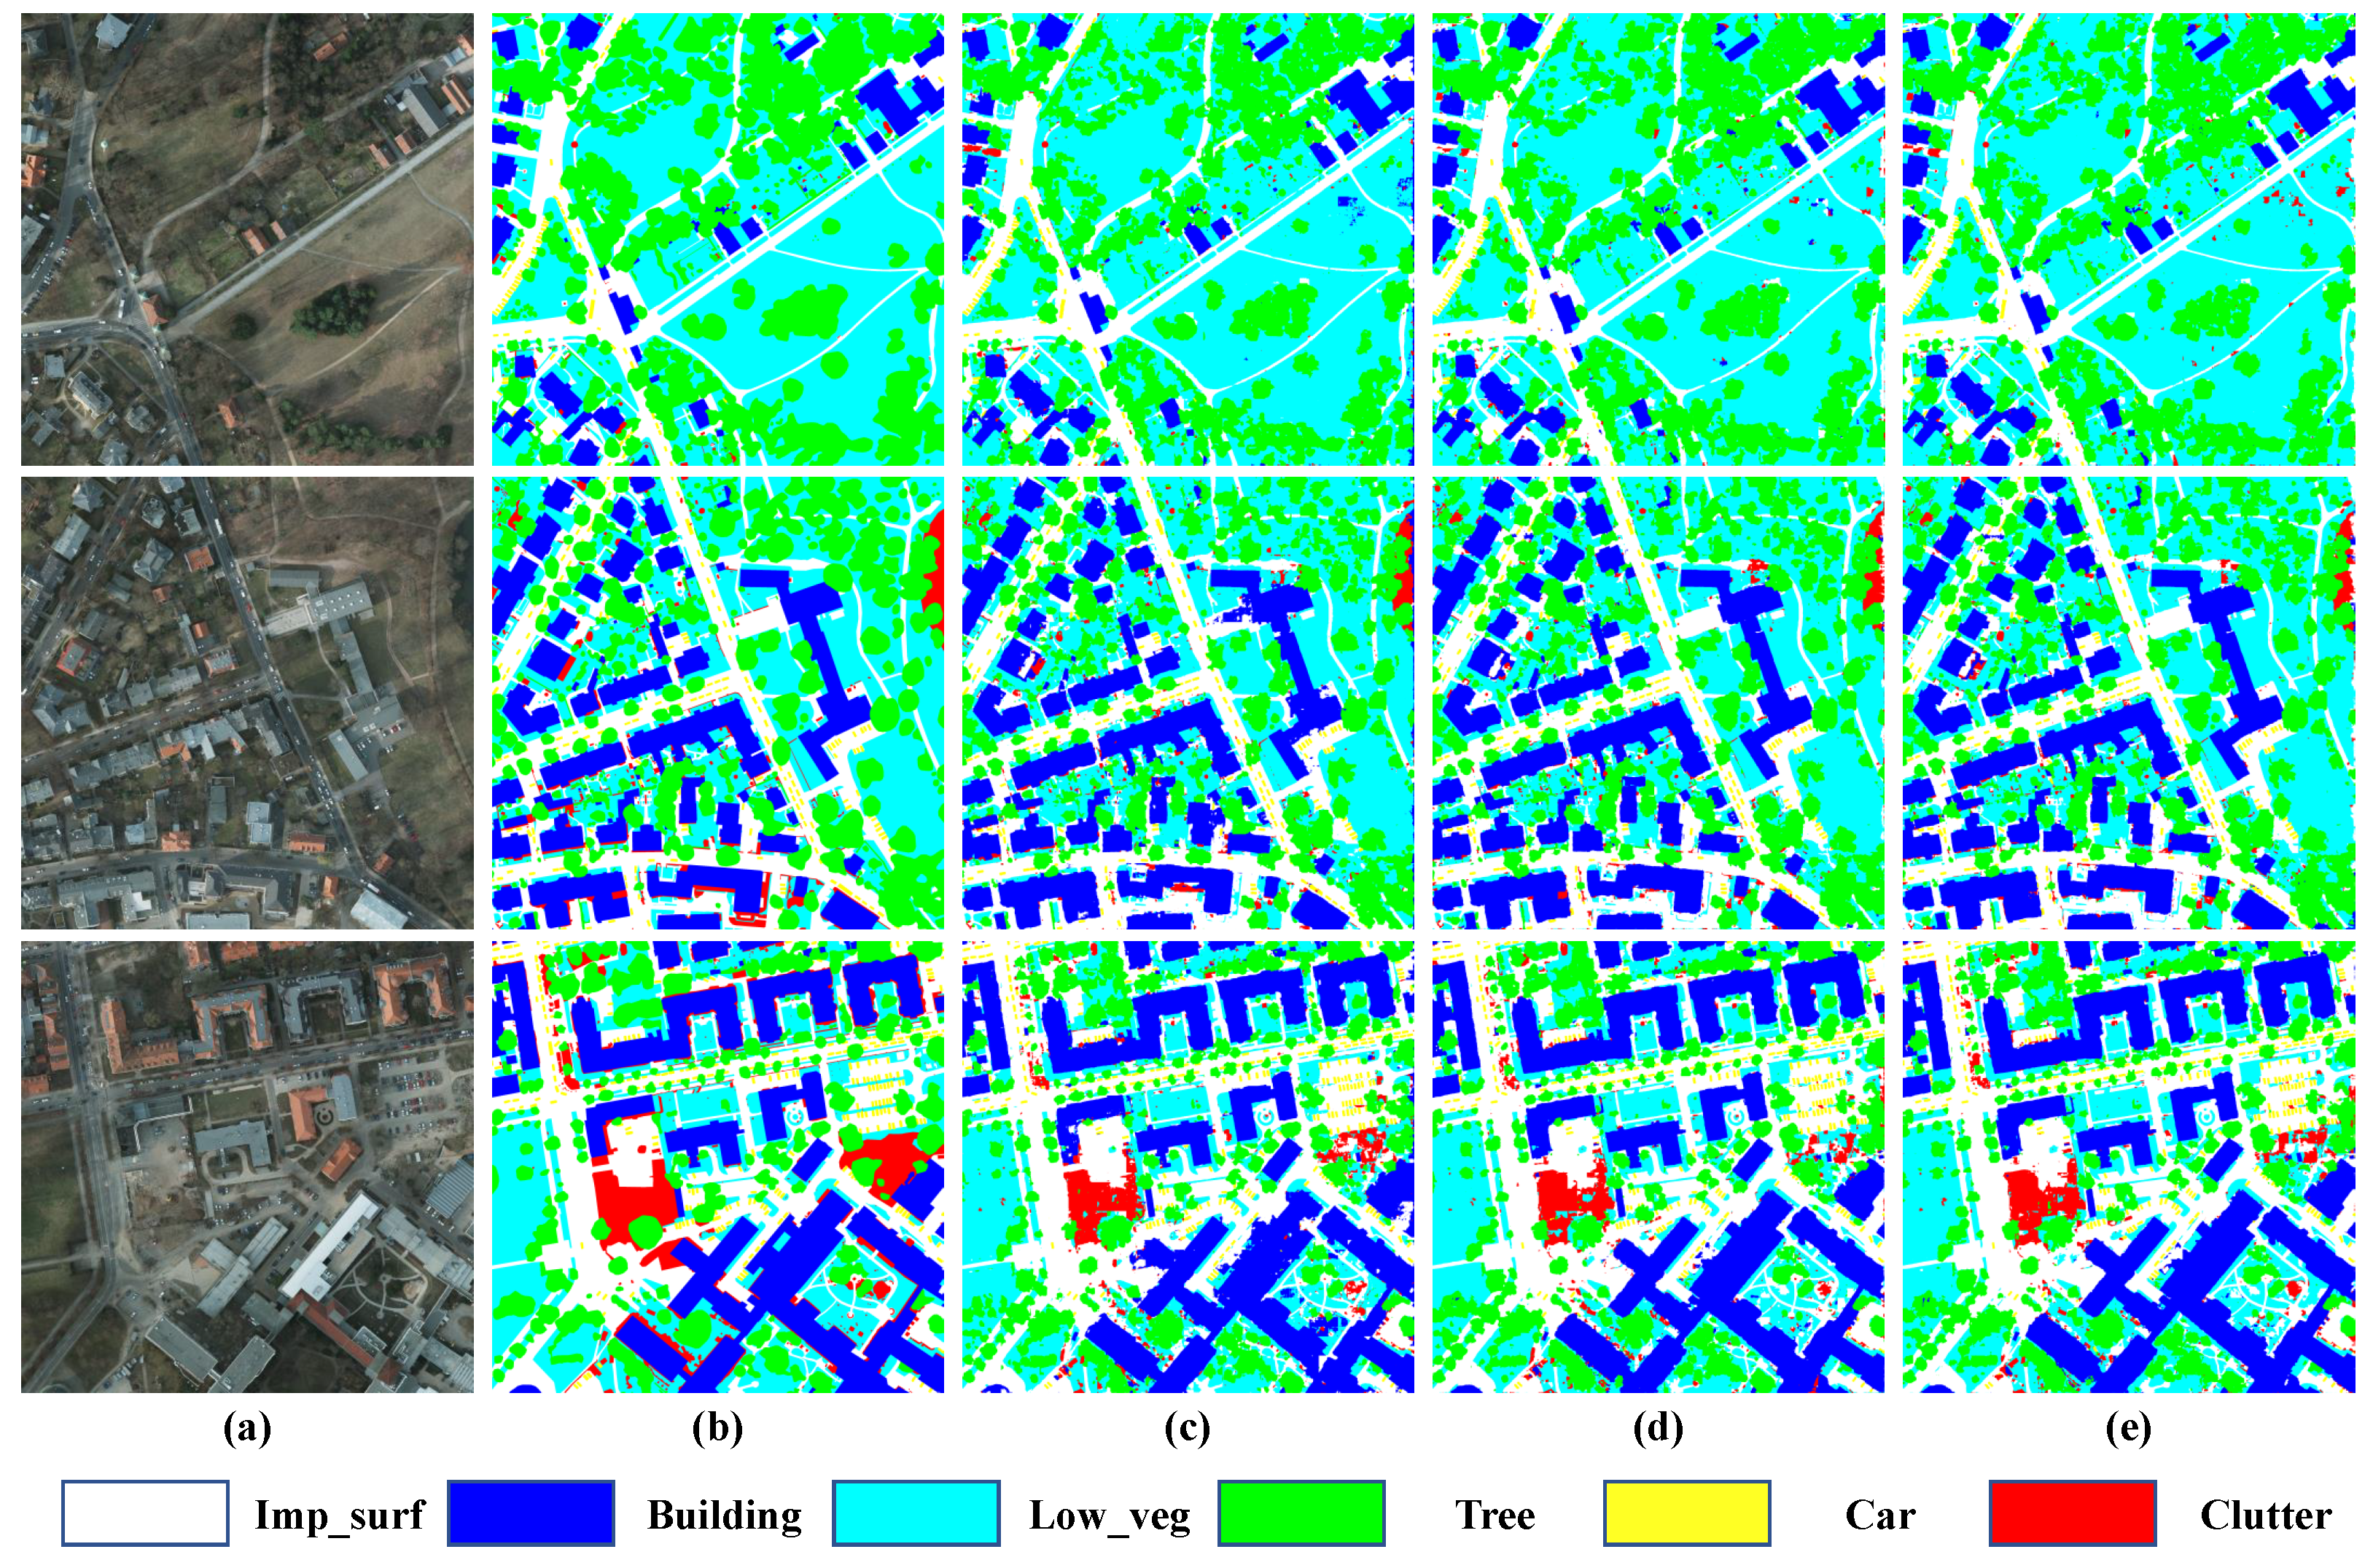
In order to verify the effectiveness of our TdPFNet and to show the differences between DSM or OSM as auxiliary inputs specifically, we added a single-source pyramid fusion network (TdPFNet(RSI)) as the baseline, whose original auxiliary encoder had been removed from TdPFNet, for some ablation studies. Figure 9 shows the results predicted by the proposed model, in which the first column represents original high-resolution remote sensing RGB images, the second represents the corresponding ground truth, the third represents predictions of TdPFNet(RSI) and the last two columns show the results fused by DSM and OSM. From the experimental results in Table 1 and Figure 9, it can be found that the addition of DSM and OSM data can effectively improve the segmentation accuracy of the model, and MF1 reach the highest 92.2 with the help of OSM. From another perspective, once the fusion-based model is separated from the auxiliary input, the segmentation results will be more or less affected. However, TdPFNet(RSI) still can generate good results, which means that it has strong robustness. We also conducted experiments on the CRF module and found that it had little impact on our fusion results, while increasing the complexity of model training, so we removed it in subsequent experiments.
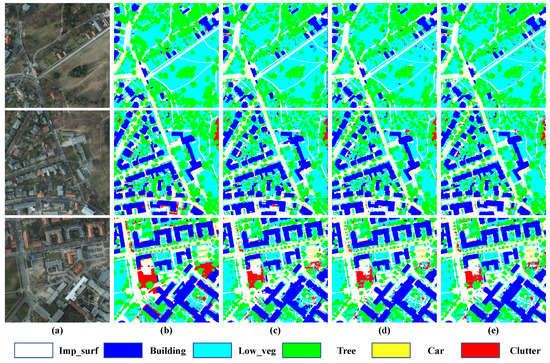
Figure 9.
Samples from the prediction results on Potsdam test set. From left to right, they are the data for (a) original high-resolution remote sensing RGB images, (b) the corresponding ground truth, (c) predictions of TdPFNet(RSI), (d) results fused with DSM and (e) results fused with OSM.

Table 1.
The ablation study for each part of TdPFNet on Potsdam test set. DSM: digital surface model. OSM: open street map. CRF: conditional random field. The number in bold is the maximum value.
Then, we conduct ablation experiments on different scales of data augmentation, as shown in Figure 10, where the abscissa indicates how many times the augmented dataset size has been expanded compared to the original one. Obviously, 0 means that no data augmentation is applied. From the results, we can find that these models work best when the size of the dataset is enlarged by 4 times. We also learn that when the training set continues to be augmented, the performances on the test set start to decrease instead. We speculate that this may be caused by the reduction of the model’s domain adaptability, which is beyond the scope of the work in this paper.
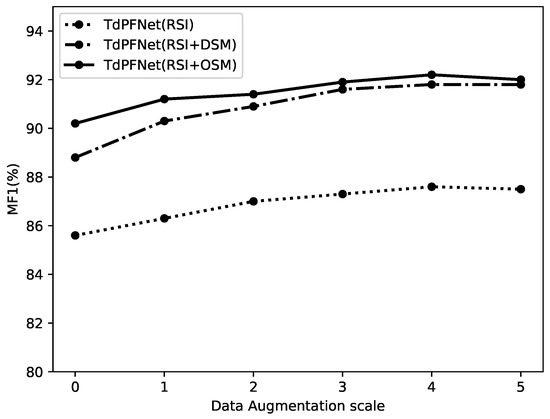
Figure 10.
The ablation study on different data augmentation scales on Potsdam test set.
4.5. Comparisons with the-State-of-the-Art Models
We selected some traditional single-input segmentation networks to compare with the proposed model, which include the famous FCN, PSPNet and the widely used Deeplabv3+. The results of the experiment are shown in Table 2. Considering that these methods do not have access to DSM or OSM, we remove the auxiliary branch of TdPFNet for fairness, which is called TdPFNet(RSI). As can be seen from Table 2, even though TdPFNet(RSI) is relegated to only a single-source (Ss) input model, its performance on the Potsdam dataset is still competitive to other models. The results prove that the proposed model has strong robustness, no matter for single-source or multi-source data. After fusing the DSM data, TdPFNet can achieve a mean F1-score (MF1) of 91.8%, and a MF1 of 92.2% with the OSM input. There is no doubt that the recognition ability of the model for each category has been significantly improved with the addition of height or building information. Compared with the traditional single input model, the MF1 value of TdPFNet is increased by nearly 4%. For the subsequent experimental results, the auxiliary input is fixed to OSM unless stated otherwise.
Table 2.
Detailed performance comparisons with single-source methods on Potsdam test set. The number in bold is the maximum value. All data are shown in percentage. Ss: Single-source. Ms: Multi-source.
Next, for better evaluation, L3Fsn [15] method, V-FuseNet [44], TreeUNet [45] and other bottom-up multi-source fusion methods on the ISPRS2D competition leaderboard served as benchmarks for comparison with the proposed model.
- L3Fsn: It is an early fusion framework, which is a variant of FCN-8. The CNN features obtained from multiple spectral bands are fused in the initial layer rather than the final layer of the deep neural network. Therefore, there are fewer model parameters that need to be trained.
- V-FuseNet: It is an early fusion network of multi-modal remote sensing data based on FuseNet structure, which is a variation of SegNet. Different from the original FuseNet, V-FuseNet fuses the data from the main and auxiliary encoders, with a convolutional block followed by summation. It can significantly improve semantic segmentation results by allowing the network to extract jointly strong multimodal features.
- TreeUNet: It is an adaptive network based on confusion matrix and tree cutting algorithm. A Tree-CNN block can be constructed based on a deep semantic model infrastructure adaptively, where each node represents a ResNeXt [46] unit. It allows the network to choose its own optimal structure automatically. However, the training process of this method is complicated, and it will take a long time for GPU to find the best structure.
- Other methods: Since these are some well-known algorithms from the ISPRS2D competition, they all use such data fusion methods as channel-merging or bottom-up to fuse multi-modal data including RSI, NDVI and DSM. No matter which method is used, they have a common problem of features information loss during fusion making it difficult to restore the original resolution. For convenience, we call these methods the traditional bottom-up methods.
As shown in Table 3, the TdPFNet achieved the best or competitive results on Potsdam data sets, especially after fusing OSM data. With fusion of OSM data, the accuracy of impervious surface and building has been significantly improved. TdPFNet get the highest OA and MF1 score among methods in the table. This is undoubtedly due to the contributions of using high-level semantic knowledge to guide the fusion and decoding progress of low-level spatial features. Compared with the traditional bottom-up methods, the top-down fusion method reveals a stronger ability in reconstructing texture details of high-resolution remote sensing images.
Table 3.
Detailed performance comparisons with the-state-of-the-art models on Potsdam test set. The number in bold is the maximum value. All percentage signs are omitted. Ms: Multi-source. Bu: Bottom-up. Td: Top-down.
5. Discussion
In this section, we further discuss the proposed model and analyze the experimental results in depth. In addition, we summarize the advantages, limitations and potential improvements of the model.
5.1. Results Analysis
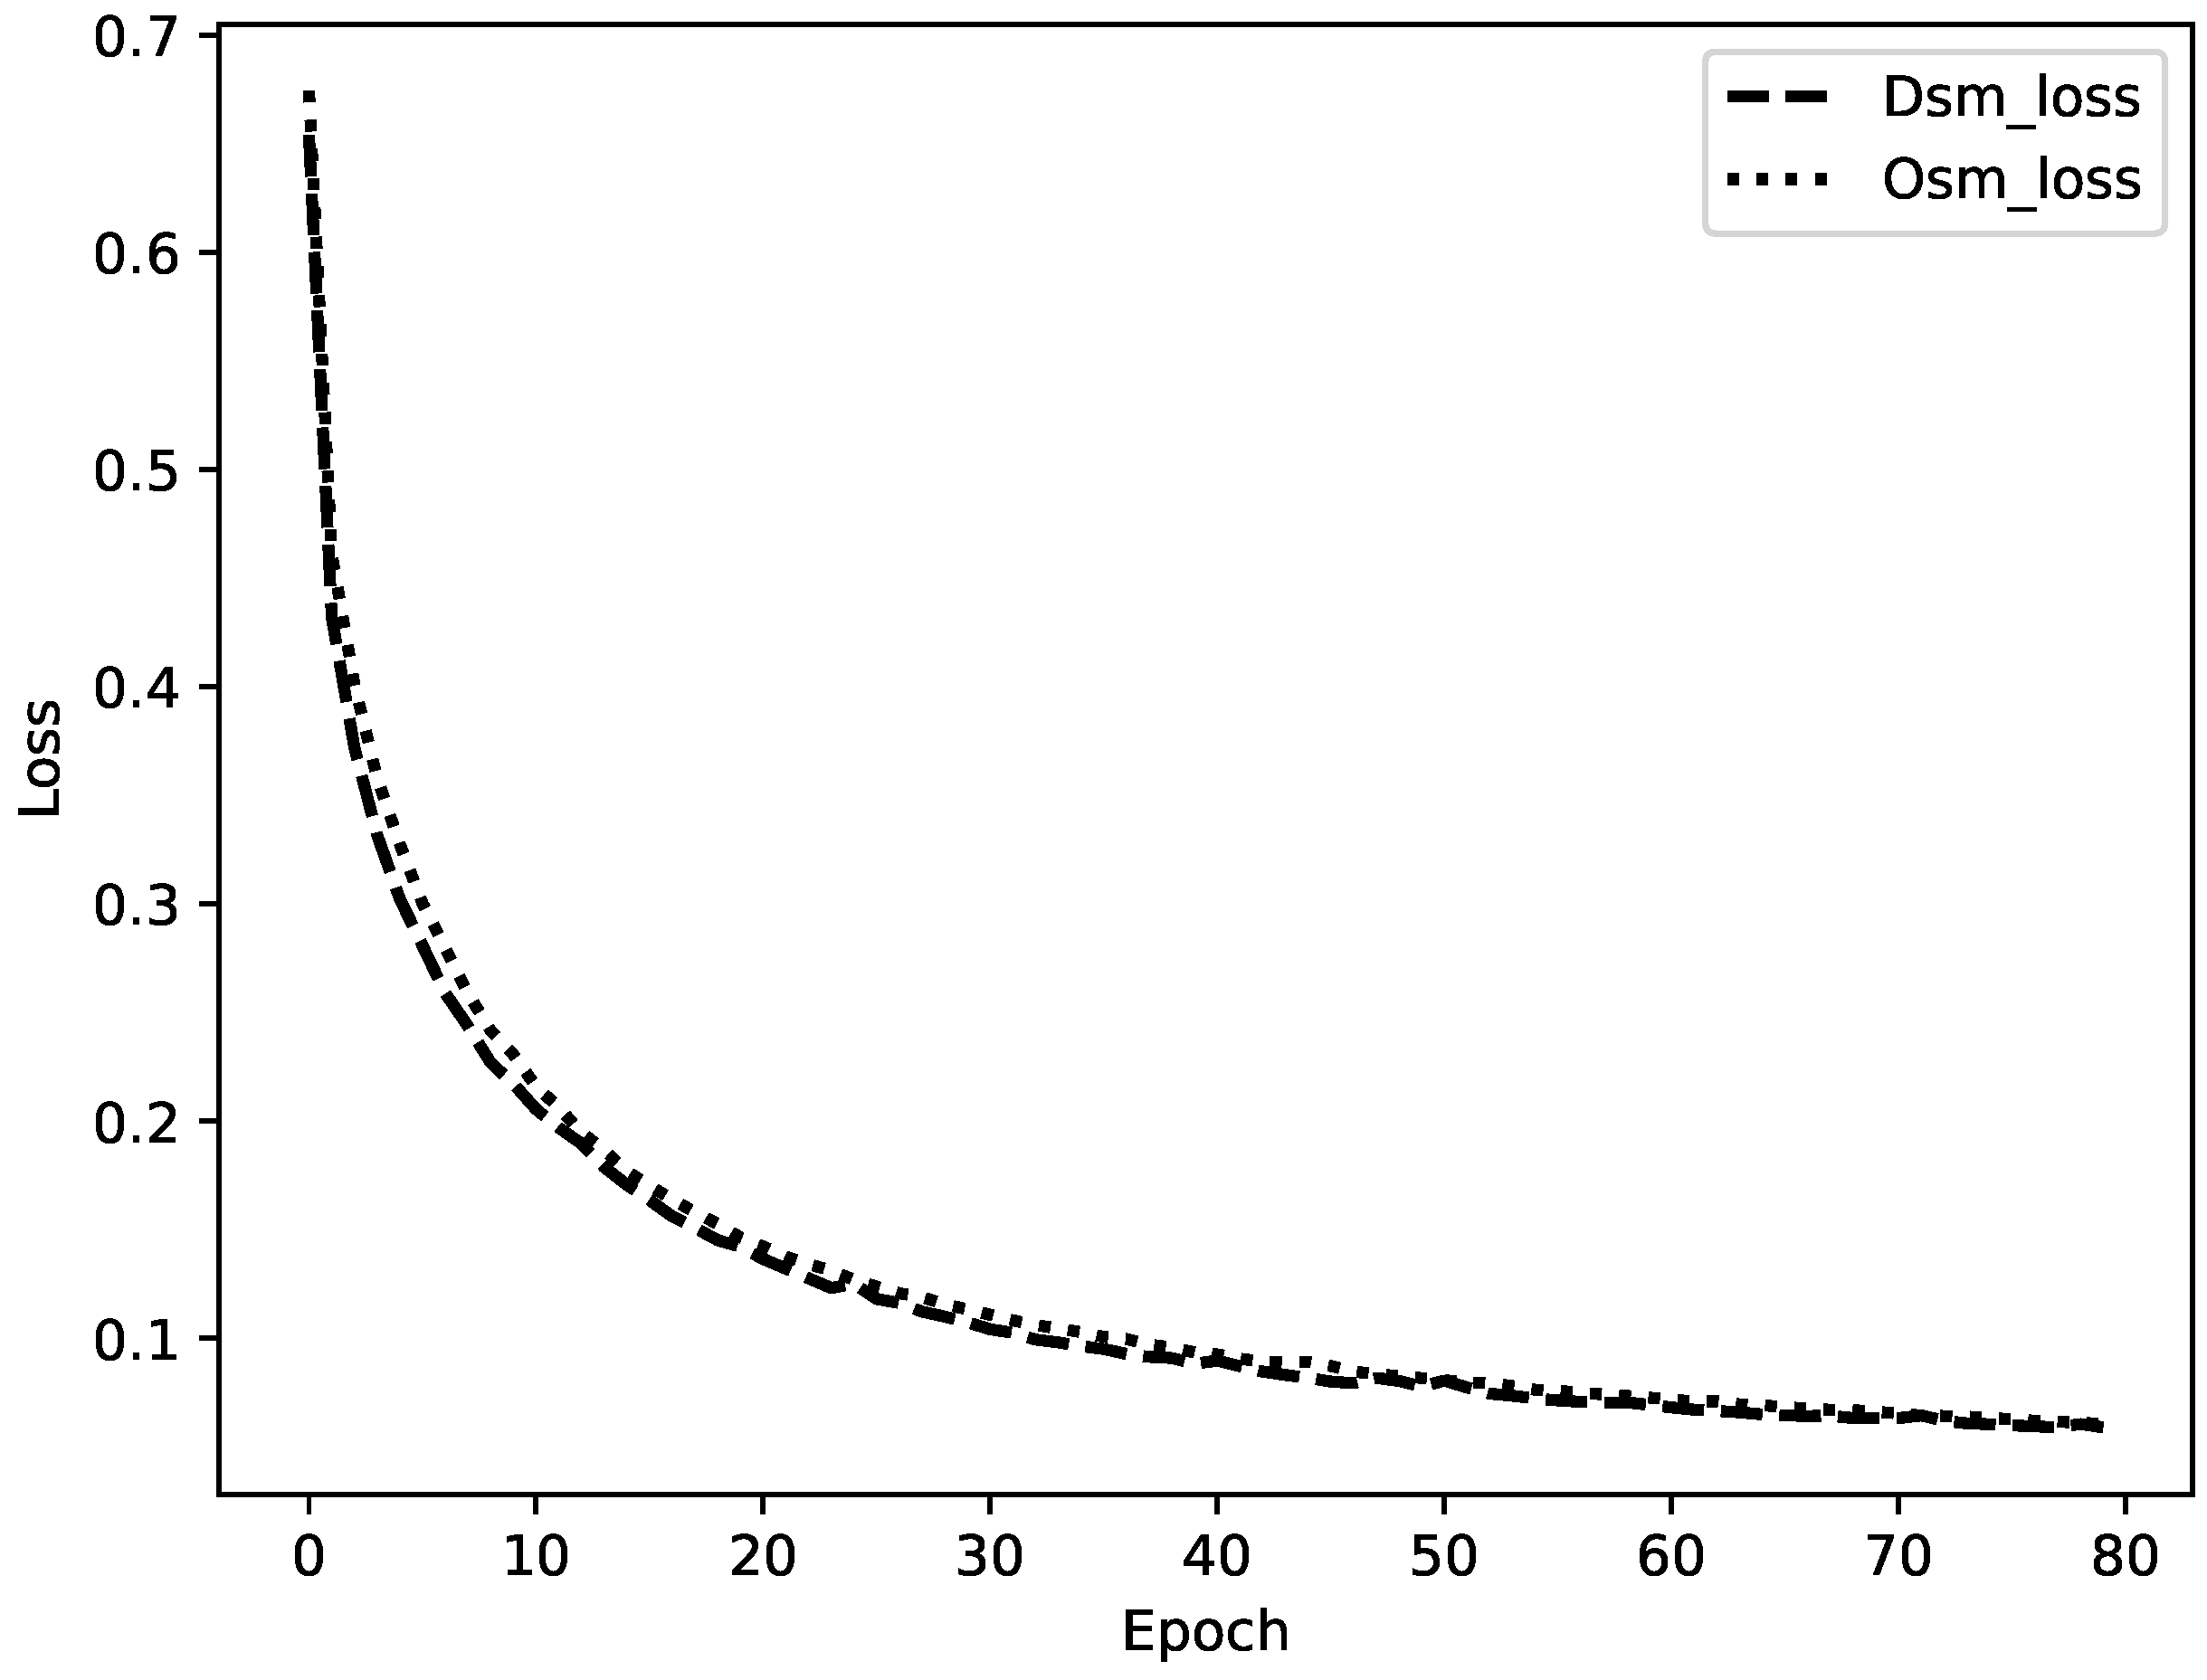
Figure 11 shows two decay curves of training loss with epochs. The smooth curves show that the proposed model has excellent robustness. The loss of the model fused with DSM drops a bit faster. This may be due to the fact that DSM is officially released without modifications and thus more compatible with the original remote sensing data than the OSM that were edited by ourselves.

Figure 11.
The decay curve of training loss with epochs.
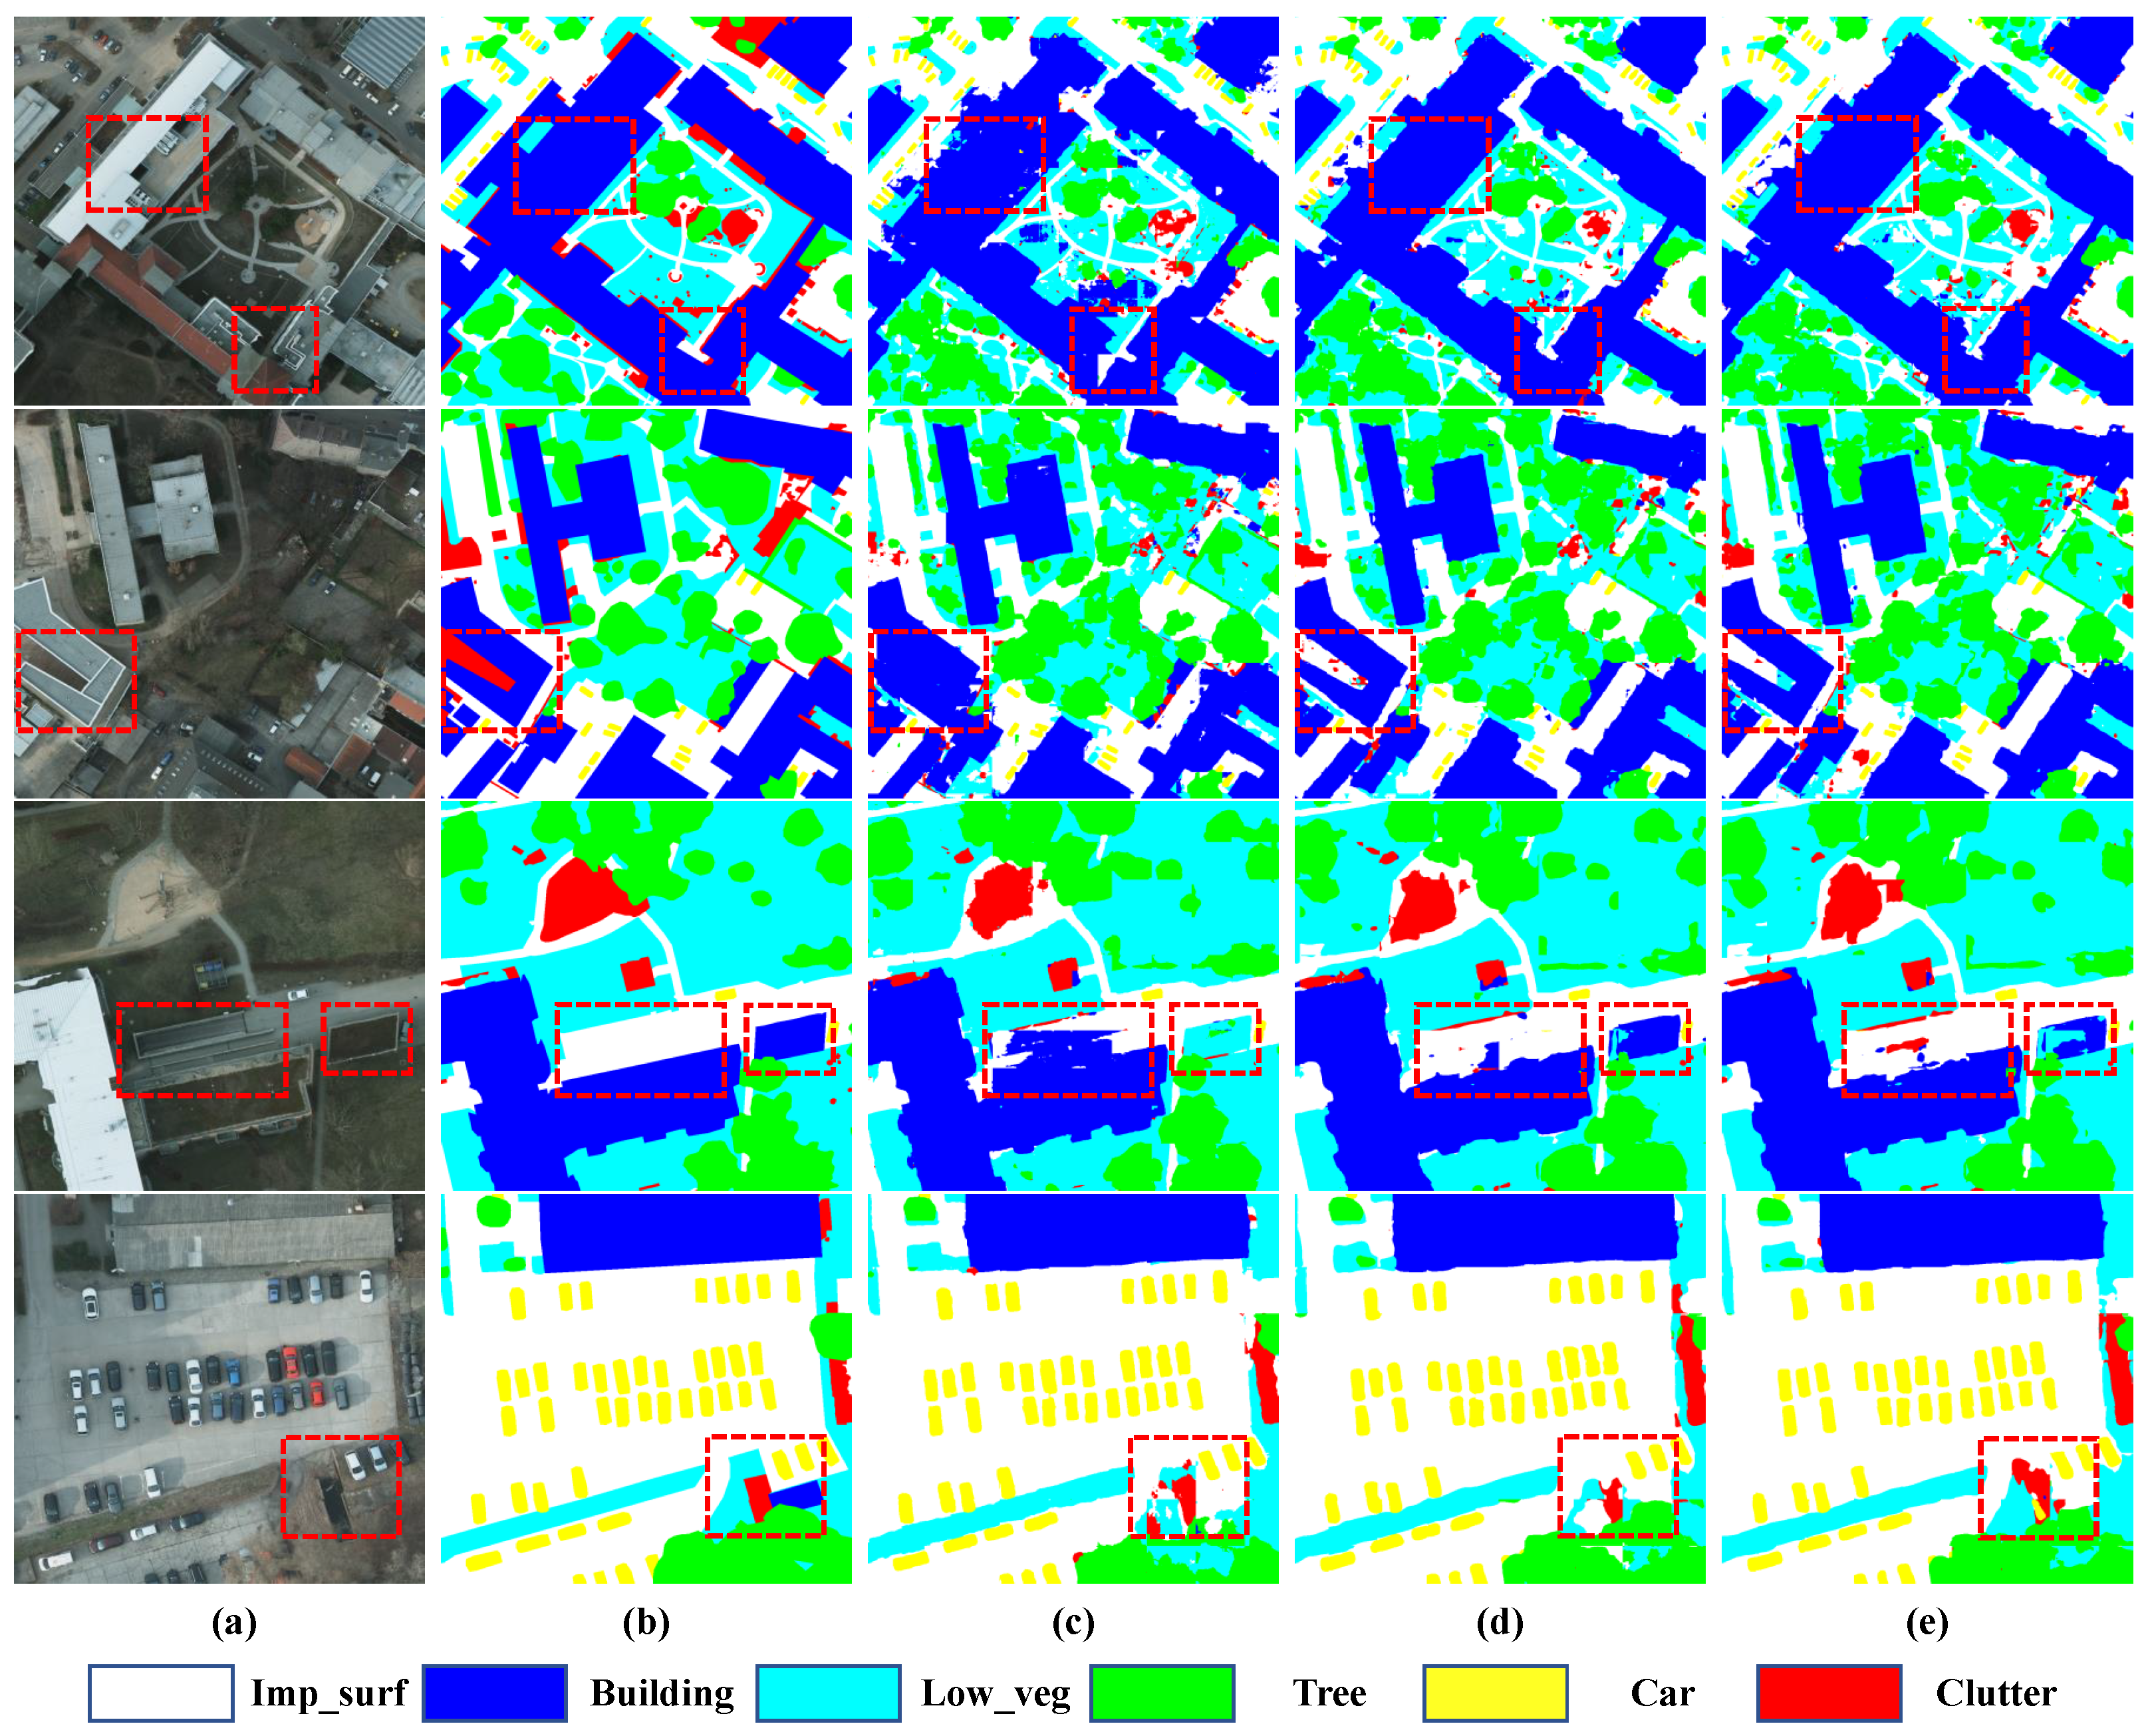
We enlarge some details of the prediction results, which can be displayed in Figure 12. The first column represents the original remote sensing slices, the second column represents the ground truth labels, the third represents predictions of TdPFNet(RSI) and the last two columns show fusion results with DSM and OSM. We can draw three conclusions from them. First of all, the height information of DSM and the building information of OSM can be used to distinguish the similar categories. Secondly, With OSM data the images of buildings have a clearer outline. Finally, in rare cases like the last two lines, DSM data have better performance for certain categories, but in most cases, OSM performs better.
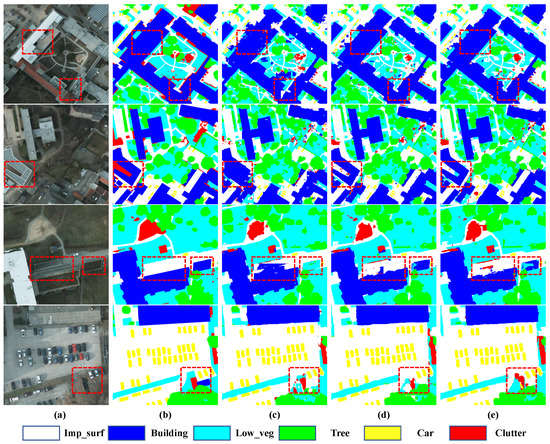
Figure 12.
Slices from the prediction results. From left to right, they are the data for (a) original high-resolution remote sensing RGB slices, (b) the corresponding ground truth, (c) predictions of TdPFNet(RSI), (d) results fused with DSM and (e) results fused with OSM.
5.2. GPU Inference Time
We calculated the GPU inference time for each excellent model with a image ( patches) and made a comparative analysis, as shown in Table 4. The penultimate column of the table shows the backbone of each network and the last column lists the GPU inference times.
Table 4.
The GPU inference times of various models. Ms: Multi-source. Bu: Bottom-up. Td: Top-down. The number in bold is the maximum value.
We select two traditional models for comparison, and they both adopt the classic bottom-up multi-source data fusion strategy. Obviously, the proposed model only takes 22.5 seconds, and it is the least time in Table 4, for three reasons. First, ResNet itself uses bottleneck blocks, in which the use of convolutions greatly reduces the number of parameters. Second, our auxiliary branch uses fewer layers without affecting the quality of the segmentation results, further reducing the parameters of the network. Third, TdPFNet only uses one block in each layer when fusing and decoding, and unify the number of channels to 256. Compared with the traditional symmetric decoding method such as L3Fsn and V-FuseNet, the top-down fusion structure proposed in this paper maintains the high accuracy while having the computational complexity significantly reduced.
5.3. Pros and Cons Analysis
When data fusion is applied in semantic segmentation, how to better restore low-level spatial details becomes a major problem, especially for complex remote sensing images. Traditional methods use channel-merging or bottom-up fusion structures for data fusion. Their high-level feature maps become less accurate in detailed spatial information, making it difficult to restore low-level spatial texture details. The TdPFNet proposed in this paper uses high-level semantic information to guide the fusion of low-level information step by step, and the top-down structure can better restore more spatial information. Therefore, the predicted results have been significantly improved. And the experimental results prove that our method is robuster in performance, no matter for single-source or multi-source inputs. Then, we selected two easily accessible data sources, DSM and OSM, effectively help complete the task of land classification and reduce the data collection cost. Furthermore, with some previous methods, more and more fusion structures are added to pursue better fusion results, making the model more and more bloated computationally. TdPFNet adopts a lightweight fusion strategy and simplifies redundant structures, greatly reducing the complexity of training and prediction process.
Our method also has some limitations. First, compared with traditional single-source algorithms, TdPFNet requires more data sources, and inevitably increases the cost of data preprocessing. Second, The fusion module we proposed can support the fusion of more than two data sources, but it requires more encoders, and further increases the complexity. It conflicts with the original intention in this paper. Therefore, we only fuse two data sources after careful consideration. Finally, because ISPRS2D does not provide additional fusion sources other than DSM, the OSM data collected by ourselves may conflict with the original data in some places, such as labeling errors or time differences. We could achieve better results with higher-quality auxiliary data.
TdPFNet still has a lot of room for improvement. In the future, we can design a lightweight encoder that can support more data from different sources (except for the method of channel-merging). In addition, the cost of pixel-level annotations should also be taken seriously. Intuitively, the introduction of a large amount of multi-source information can reduce the dependence of samples on annotations. In the current work, we are using the information redundancy brought by data fusion technology to learn semantic knowledge from unlabeled samples.
6. Conclusions
In this work, we analyze the existing problems of semantic segmentation based on data fusion. Specifically, traditional methods fuse the features extracted from different sources with a bottom-up fusion structure, making it difficult to achieve excellent fusion results due to information losses in the fusion process. On the other hand, various auxiliary fusion modules improve the model accuracy, but increase the complexity as well. In order to solve these problems, we propose a new lightweight model called top-down pyramid fusion network. It can effectively fuse the multi-scale features from different sources with the top-down fusion structure, where high-level semantic knowledge guides the gradual fusion of low-level texture information. And the experimental results prove that our method is robuster in performance, no matter for single-source or multi-source inputs. TdPFNet is easy to train, because it has lower complexity than other multi-source fusion networks. In addition, we study the feasibility of OSM data as auxiliary input, which is different from DSM data. Compared with DSM data, OSM data contains more data on road and building components, which are useful in enhancing the differentiation of various categories. Finally, the comparative experiments on Potsdam dataset show that our method can maintain the high accuracy of the model prediction while further having the complexity reduced.
With the rapid development of remote sensing technology, more and more high-resolution remote sensing images can be mined. However, the pixel-level labels for researches or model training are always timeconsuming and expensive. In the future, we plan to focus on weak or semi supervised methods for semantic segmentation, which can effectively reduce the cost of building the training datasets.
Author Contributions
Conceptualization, Y.G.; methodology, Y.G.; formal analysis, Y.G.; investigation, Y.G.; writing—original draft preparation, Y.G.; writing—review and editing, Y.G., J.H., B.C. and H.D.; visualization, Y.G.; supervision, J.H. and B.C.; funding acquisition, B.C. All authors have read and agreed to the published version of the manuscript.
Funding
This work was supported in part by the National Key Research and Development Program of China, under Grant 2019YFB2102002; in part by the Key Research and Development Program of Jiangsu Province, under Grant BE2019012; and in part by the National Natural Science Foundation of China, under Grant 62001217.
Institutional Review Board Statement
Not applicable.
Informed Consent Statement
Not applicable.
Data Availability Statement
Publicly available datasets were analyzed in this study. This data can be found here: https://www2.isprs.org/commissions/comm2/wg4/benchmark/semantic-labeling/, accessed on 16 October 2021.
Acknowledgments
The authors would like to thank the anonymous reviewers for their very competent comments and helpful suggestions.
Conflicts of Interest
The authors declare no conflict of interest.
Abbreviations
The following abbreviations are used in this manuscript:
| BN | Batch Normalization |
| Bu | Bottom-up |
| CNN | Convolutional Neural Network |
| DMNet | Dynamic Multi-scale Network |
| DSM | Digital surface model |
| FCCRF | Fully Connected Conditional Random Field |
| FCN | Fully Convolutional Network |
| FPN | Feature Pyramid Network |
| FuseNet | Fusion Network |
| GIS | Geographic Information System |
| IR | Infrared Radiation |
| ISPRS | International Society for Photogrammetry and Remote Sensing |
| MF1 | Mean F1-score |
| Ms | Multi-source |
| NDVI | Normalized Difference Vegetation Index |
| OA | Overall Accuracy |
| OSM | OpenStreetMap |
| PSPNet | Pyramid Scene Parsing Network |
| ResNet | Residual Network |
| RSI | Remote sensing images |
| SAR | Synthetic Aperture Radar |
| SGD | Stochastic Gradient Descent |
| Ss | Single-source |
| SVM | Support Vector Machine |
| Td | Top-down |
| TdPFM | Top-down Pyramid Fusion Module |
| TdPFNet | Top-down Pyramid Fusion Network |
| TM | Thematic Mapper |
| TOP | Treue Ortho Photo |
References
- Coates, A.; Ng, A.Y. Learning feature representations with k-means. In Neural Networks: Tricks of the Trade; Springer: Berlin/Heidelberg, Germany, 2012; pp. 561–580. [Google Scholar]
- Hao, Y.; Zhu, F. Fast algorithm for two-dimensional Otsu adaptive threshold algorithm. J. Image Graph. 2005, 4, 484–485. [Google Scholar]
- Shotton, J.; Johnson, M.; Cipolla, R. Semantic texton forests for image categorization and segmentation. In Proceedings of the 2008 IEEE Conference on Computer Vision and Pattern Recognition, Anchorage, AK, USA, 24–26 June 2008; pp. 1–8. [Google Scholar]
- Long, J.; Shelhamer, E.; Darrell, T. Fully convolutional networks for semantic segmentation. In Proceedings of the IEEE Conference on Computer Vision and Pattern Recognition, Boston, MA, USA, 7–12 June 2015; pp. 3431–3440. [Google Scholar]
- Badrinarayanan, V.; Kendall, A.; Cipolla, R. Segnet: A deep convolutional encoder-decoder architecture for image segmentation. IEEE Trans. Pattern Anal. Mach. Intell. 2017, 39, 2481–2495. [Google Scholar] [CrossRef]
- Ronneberger, O.; Fischer, P.; Brox, T. U-net: Convolutional networks for biomedical image segmentation. In Proceedings of the International Conference on Medical Image Computing and Computer-Assisted Intervention, Munich, Germany, 5–9 October 2015; pp. 234–241. [Google Scholar]
- Zhao, H.; Shi, J.; Qi, X.; Wang, X.; Jia, J. Pyramid scene parsing network. In Proceedings of the IEEE Conference on Computer Vision and Pattern Recognition, Honolulu, HI, USA, 21–26 July 2017; pp. 2881–2890. [Google Scholar]
- Chen, L.C.; Papandreou, G.; Kokkinos, I.; Murphy, K.; Yuille, A.L. Semantic image segmentation with deep convolutional nets and fully connected crfs. arXiv 2014, arXiv:1412.7062. [Google Scholar]
- Chen, L.C.; Papandreou, G.; Kokkinos, I.; Murphy, K.; Yuille, A.L. Deeplab: Semantic image segmentation with deep convolutional nets, atrous convolution, and fully connected crfs. IEEE Trans. Pattern Anal. Mach. Intell. 2017, 40, 834–848. [Google Scholar] [CrossRef]
- Chen, L.C.; Papandreou, G.; Schroff, F.; Adam, H. Rethinking atrous convolution for semantic image segmentation. arXiv 2017, arXiv:1706.05587. [Google Scholar]
- Chen, L.C.; Zhu, Y.; Papandreou, G.; Schroff, F.; Adam, H. Encoder-decoder with atrous separable convolution for semantic image segmentation. In Proceedings of the European Conference on Computer Vision (ECCV), Munich, Germany, 8–14 September 2018; pp. 801–818. [Google Scholar]
- Albawi, S.; Mohammed, T.A.; Al-Zawi, S. Understanding of a convolutional neural network. In Proceedings of the 2017 International Conference on Engineering and Technology (ICET), Antalya, Turkey, 21–23 August 2017; pp. 1–6. [Google Scholar]
- Hazirbas, C.; Ma, L.; Domokos, C.; Cremers, D. Fusenet: Incorporating depth into semantic segmentation via fusion-based cnn architecture. In Proceedings of the Asian Conference on Computer Vision, Taipei, Taiwan, 20–24 November 2016; pp. 213–228. [Google Scholar]
- Sun, W.; Wang, R. Fully convolutional networks for semantic segmentation of very high resolution remotely sensed images combined with DSM. IEEE Geosci. Remote Sens. Lett. 2018, 15, 474–478. [Google Scholar] [CrossRef]
- Piramanayagam, S.; Saber, E.; Schwartzkopf, W.; Koehler, F.W. Supervised classification of multisensor remotely sensed images using a deep learning framework. Remote Sens. 2018, 10, 1429. [Google Scholar] [CrossRef] [Green Version]
- Krähenbühl, P.; Koltun, V. Efficient inference in fully connected crfs with gaussian edge potentials. arXiv 2012, arXiv:1210.5644. [Google Scholar]
- Ioffe, S.; Szegedy, C. Batch normalization: Accelerating deep network training by reducing internal covariate shift. In Proceedings of the International Conference on Machine Learning, Lille, France, 7–9 July 2015; pp. 448–456. [Google Scholar]
- Chollet, F. Xception: Deep learning with depthwise separable convolutions. In Proceedings of the IEEE Conference on Computer Vision and Pattern Recognition, Honolulu, HI, USA, 21–26 July 2017; pp. 1251–1258. [Google Scholar]
- Zhou, Z.; Siddiquee, M.M.R.; Tajbakhsh, N.; Liang, J. Unet++: A nested u-net architecture for medical image segmentation. In Deep Learning in Medical Image Analysis and Multimodal Learning for Clinical Decision Support; Springer: Berlin/Heidelberg, Germany, 2018; pp. 3–11. [Google Scholar]
- Lin, T.Y.; Dollár, P.; Girshick, R.; He, K.; Hariharan, B.; Belongie, S. Feature pyramid networks for object detection. In Proceedings of the IEEE Conference on Computer Vision and Pattern Recognition, Honolulu, HI, USA, 21–26 July 2017; pp. 2117–2125. [Google Scholar]
- Yang, M.; Yu, K.; Zhang, C.; Li, Z.; Yang, K. Denseaspp for semantic segmentation in street scenes. In Proceedings of the IEEE Conference on Computer Vision and Pattern Recognition, Salt Lake City, UT, USA, 18–22 June 2018; pp. 3684–3692. [Google Scholar]
- He, J.; Deng, Z.; Qiao, Y. Dynamic multi-scale filters for semantic segmentation. In Proceedings of the IEEE/CVF International Conference on Computer Vision, Seoul, Korea, 27–28 October 2019; pp. 3562–3572. [Google Scholar]
- Gómez-Chova, L.; Tuia, D.; Moser, G.; Camps-Valls, G. Multimodal classification of remote sensing images: A review and future directions. Proc. IEEE 2015, 103, 1560–1584. [Google Scholar] [CrossRef]
- Chen, B.; Huang, B.; Xu, B. Multi-source remotely sensed data fusion for improving land cover classification. ISPRS J. Photogramm. Remote Sens. 2017, 124, 27–39. [Google Scholar] [CrossRef]
- Hasani, H.; Samadzadegan, F.; Reinartz, P. A metaheuristic feature-level fusion strategy in classification of urban area using hyperspectral imagery and LiDAR data. Eur. J. Remote Sens. 2017, 50, 222–236. [Google Scholar] [CrossRef] [Green Version]
- Zhang, J. Multi-source remote sensing data fusion: Status and trends. Int. J. Image Data Fusion 2010, 1, 5–24. [Google Scholar] [CrossRef] [Green Version]
- Fauvel, M.; Chanussot, J.; Benediktsson, J.A. Decision fusion for the classification of urban remote sensing images. IEEE Trans. Geosci. Remote Sens. 2006, 44, 2828–2838. [Google Scholar] [CrossRef]
- Benediktsson, J.A.; Swain, P.H.; Ersoy, O.K. Neural network approaches versus statistical methods in classification of multisource remote sensing data. In Proceedings of the 2th Canadian Symposium on Remote Sensing Geoscience and Remote Sensing Symposium, Vancouver, BC, Canada, 13 July 1989. [Google Scholar]
- Waske, B.; van der Linden, S. Classifying multilevel imagery from SAR and optical sensors by decision fusion. IEEE Trans. Geosci. Remote Sens. 2008, 46, 1457–1466. [Google Scholar] [CrossRef]
- Moreira, A.; Prats-Iraola, P.; Younis, M.; Krieger, G.; Hajnsek, I.; Papathanassiou, K.P. A tutorial on synthetic aperture radar. IEEE Geosci. Remote Sens. Mag. 2013, 1, 6–43. [Google Scholar] [CrossRef] [Green Version]
- Tupin, F.; Roux, M. Detection of building outlines based on the fusion of SAR and optical features. ISPRS J. Photogramm. Remote Sens. 2003, 58, 71–82. [Google Scholar] [CrossRef]
- Zhang, Y.; Zhang, H.; Lin, H. Improving the impervious surface estimation with combined use of optical and SAR remote sensing images. Remote Sens. Environ. 2014, 141, 155–167. [Google Scholar] [CrossRef]
- Joshi, N.; Baumann, M.; Ehammer, A.; Fensholt, R.; Grogan, K.; Hostert, P.; Jepsen, M.R.; Kuemmerle, T.; Meyfroidt, P.; Mitchard, E.T.; et al. A review of the application of optical and radar remote sensing data fusion to land use mapping and monitoring. Remote Sens. 2016, 8, 70. [Google Scholar] [CrossRef] [Green Version]
- Li, S.; Wang, Y.; Chen, P.; Xu, X.; Cheng, C.; Chen, B. Spatiotemporal fuzzy clustering strategy for urban expansion monitoring based on time series of pixel-level optical and SAR images. IEEE J. Sel. Top. Appl. Earth Obs. Remote Sens. 2017, 10, 1769–1779. [Google Scholar] [CrossRef]
- Gyorgy, S.; Gizella, N.; Zoltán, F.; Mátyás, R.; Anikó Rotterné, K.; Irén, H.; Bálint, G.; Cecilia, T. Fusion of the Sentinel-1 and Sentinel-2 Data for Mapping High Resolution Land Cover Layers. In Proceedings of the 36th EARSeL Symosium, Bonn, Germany, 20–24 June 2016. [Google Scholar]
- Haas, J.; Ban, Y. Sentinel-1A SAR and sentinel-2A MSI data fusion for urban ecosystem service mapping. Remote Sens. Appl. Soc. Environ. 2017, 8, 41–53. [Google Scholar] [CrossRef]
- Sohn, G.; Dowman, I. Data fusion of high-resolution satellite imagery and LiDAR data for automatic building extraction. ISPRS J. Photogramm. Remote Sens. 2007, 62, 43–63. [Google Scholar] [CrossRef]
- Awrangjeb, M.; Ravanbakhsh, M.; Fraser, C.S. Automatic detection of residential buildings using LIDAR data and multispectral imagery. ISPRS J. Photogramm. Remote Sens. 2010, 65, 457–467. [Google Scholar] [CrossRef] [Green Version]
- Dechesne, C.; Mallet, C.; Le Bris, A.; Gouet-Brunet, V. Semantic segmentation of forest stands of pure species combining airborne lidar data and very high resolution multispectral imagery. ISPRS J. Photogramm. Remote Sens. 2017, 126, 129–145. [Google Scholar] [CrossRef]
- Pacifici, F.; Del Frate, F.; Emery, W.J.; Gamba, P.; Chanussot, J. Urban mapping using coarse SAR and optical data: Outcome of the 2007 GRSS data fusion contest. IEEE Geosci. Remote Sens. Lett. 2008, 5, 331–335. [Google Scholar] [CrossRef] [Green Version]
- Debes, C.; Merentitis, A.; Heremans, R.; Hahn, J.; Frangiadakis, N.; van Kasteren, T.; Liao, W.; Bellens, R.; Pižurica, A.; Gautama, S.; et al. Hyperspectral and LiDAR data fusion: Outcome of the 2013 GRSS data fusion contest. IEEE J. Sel. Top. Appl. Earth Obs. Remote Sens. 2014, 7, 2405–2418. [Google Scholar] [CrossRef]
- Robinson, C.; Malkin, K.; Jojic, N.; Chen, H.; Qin, R.; Xiao, C.; Schmitt, M.; Ghamisi, P.; Hänsch, R.; Yokoya, N. Global Land-Cover Mapping With Weak Supervision: Outcome of the 2020 IEEE GRSS Data Fusion Contest. IEEE J. Sel. Top. Appl. Earth Obs. Remote Sens. 2021, 14, 3185–3199. [Google Scholar] [CrossRef]
- Liu, Y.; Piramanayagam, S.; Monteiro, S.T.; Saber, E. Dense semantic labeling of very-high-resolution aerial imagery and lidar with fully-convolutional neural networks and higher-order CRFs. In Proceedings of the IEEE Conference on Computer Vision and Pattern Recognition Workshops, Honolulu, HI, USA, 21–26 July 2017; pp. 76–85. [Google Scholar]
- Audebert, N.; Le Saux, B.; Lefèvre, S. Beyond RGB: Very high resolution urban remote sensing with multimodal deep networks. ISPRS J. Photogramm. Remote Sens. 2018, 140, 20–32. [Google Scholar] [CrossRef] [Green Version]
- Yue, K.; Yang, L.; Li, R.; Hu, W.; Zhang, F.; Li, W. TreeUNet: Adaptive Tree convolutional neural networks for subdecimeter aerial image segmentation. ISPRS J. Photogramm. Remote Sens. 2019, 156, 1–13. [Google Scholar] [CrossRef]
- Xie, S.; Girshick, R.; Dollár, P.; Tu, Z.; He, K. Aggregated residual transformations for deep neural networks. In Proceedings of the IEEE Conference on Computer Vision and Pattern Recognition Workshops, Honolulu, HI, USA, 21–26 July 2017; pp. 1492–1500. [Google Scholar]
- ISPRS Semantic Labeling Contest (2D) Results. Available online: https://www2.isprs.org/commissions/comm2/wg4/results/potsdam-2d-semantic-labeling/ (accessed on 16 October 2021).
- Volpi, M.; Tuia, D. Dense semantic labeling of sub-decimeter resolution images with convolutional neural networks. IEEE Trans. Geosci. Remote Sens. 2016, 55, 881–893. [Google Scholar] [CrossRef] [Green Version]
- Kemker, R.; Salvaggio, C.; Kanan, C. Algorithms for semantic segmentation of multispectral remote sensing imagery using deep learning. ISPRS J. Photogramm. Remote Sens. 2018, 145, 60–77. [Google Scholar] [CrossRef] [Green Version]

Publisher’s Note: MDPI stays neutral with regard to jurisdictional claims in published maps and institutional affiliations. |
© 2021 by the authors. Licensee MDPI, Basel, Switzerland. This article is an open access article distributed under the terms and conditions of the Creative Commons Attribution (CC BY) license (https://creativecommons.org/licenses/by/4.0/).