Abstract
Instance segmentation of fruit tree canopies from images acquired by unmanned aerial vehicles (UAVs) is of significance for the precise management of orchards. Although deep learning methods have been widely used in the fields of feature extraction and classification, there are still phenomena of complex data and strong dependence on software performances. This paper proposes a deep learning-based instance segmentation method of litchi trees, which has a simple structure and lower requirements for data form. Considering that deep learning models require a large amount of training data, a labor-friendly semi-auto method for image annotation is introduced. The introduction of this method allows for a significant improvement in the efficiency of data pre-processing. Facing the high requirement of a deep learning method for computing resources, a partition-based method is presented for the segmentation of high-resolution digital orthophoto maps (DOMs). Citrus data is added to the training set to alleviate the lack of diversity of the original litchi dataset. The average precision (AP) is selected to evaluate the metric of the proposed model. The results show that with the help of training with the litchi-citrus datasets, the best AP on the test set reaches 96.25%.
1. Introduction
Remote sensing applications in the precision agriculture field have diversified to include satellite, aerial, and hand-held or tractor-mounted sensors [1]. Remote sensing using unmanned aerial vehicles (UAVs) has become an important new technology to assist farmers with precision agriculture, providing easier crop nutrient management [2], better diagnosis of crop diseases, and usage of pests and weeds with a lower cost compared with satellite remote sensing [3].
Among the tasks of precise management of orchards, instance segmentation of fruit trees’ canopies using UAV-acquired images, which is also known as identification or information extraction of individual trees, is of critical importance since it provides the basic information for plant breeding evaluation [4], differentiated analysis, and decision-making, as well as information on plantation cover-area and location [5].
Deep learning represents a powerful tool for big data processing, especially image data. By training with a large amount of data, deep learning-based models can achieve good prediction results for complex phenomena. Recently, deep learning-based methods have been increasingly used in agriculture and horticultural research [6]. A series of studies have demonstrated that the convolutional neural network (CNN), which denotes one of the deep learning-based models, is effective in spatial pattern recognition, enabling the extraction of vegetation properties from remote sensing imagery [7]. Csillik et al. [8] detected citrus and other crop trees from UAV images using a simple CNN model, followed by a classification refinement using super-pixels derived with a simple linear iterative clustering (SLIC) algorithm [9]. Mubin et al. [10] utilized two different CNNs to detect young and mature oil palm separately, and used geographic information systems (GIS) during the data processing and resulting storage process.
Compared with simple image classification using complex post processes, such as the functions in GIS software [11] or extra image processing algorithms [8], the object detection process, which is an incremental step in the progression from coarse to fine image inference, not only provides the classes of objects but also their locations [12], which means the algorithm can extract both the classes and the location information of trees in a unified way. Zamboni, et al. [13] evaluated 21 object detection algorithms, including anchor-based and anchor-free methods, for single tree crown detection. Semantic segmentation, different from object detection, gives fine inference by predicting classes for each pixel of the input image [12]. Morales et al. [14] proposed a semantic segmentation method of the Mauritia flexuosa palm using an end-to-end trainable CNN based on the DeepLab v3+ architecture [15]. Furthermore, instance segmentation, which represents a mixture of object detection and semantic segmentation, gives different labels for separate instances of objects belonging to the same class [12]. The introduction of the Mask-RCNN [16] has started a new era of instance segmentation based on deep learning, and many new methods have been proposed, including the YOLACT [17], SOLO [18], and Blend Mask [19]. Among them, the YOLACT is considered the first real-time instance segmentation model. Instance segmentation methods have been widely applied to the task of tree [20] or fruit [21] extraction.
Data collected by unmanned aerial systems combined with photogrammetric processing enable reaching different data types, such as digital orthophoto maps (DOMs), digital surface models (DSMs), digital terrain models (DTMs), digital elevation models (DEMs), and three-dimensional (3D) point clouds [22]. In previous studies, more than one type of data product has been required for the extraction task. For instance, Dong et al. [23] designed digital height models (DHMs) by subtracting the DTM from the DSM, which is the key data product for avoiding confusion between the treetop and soil areas. Similarly, Timilsina et al. [24] developed a canopy height model (CHM) by subtracting DEM from the DSM using the tool in ENVI for the identification of tree coverage.
Previous studies on the identification of individual trees have been focused on several species, including citrus [4,5,8,25,26,27,28], apple [23], palm [10,14,29], cranberry [21], and urban trees [13,24]. However, although there are studies on the semantic segmentation of litchi flowers [30] and branches [31], the studies on litchi canopy segmentation based on remote sensing, as far as we know, have not been proposed.
In this paper, instance segmentation of the litchi canopy, which represents the identification of individual litchi trees, is proposed. The segmentation task is performed using the deep learning-based instance segmentation method YOLACT [17]. The YOLACT method achieves good performance by recognizing the pixels of the tree canopy in the input image and separating instances individually without external algorithm processing, that is, inference in a unified way. Unlike the above-mentioned studies, which use plural data products as the input, in the proposed method, only the DOM is used as the input.
Annotating canopy areas in input images with boxes or polygons is a key step in the data pre-processing for the training of deep learning models for tree identification [13,20,21]. Since the amount of data needed for the model training is large [32], it is ineffective to annotate all data manually. As a large number of images in the custom dataset in this paper are collected at the same place at different flight heights and dates, a labor-friendly semi-auto annotation method based on the invariance of objects’ geographical location is introduced, which can significantly reduce the time of data pre-processing.
It is common and necessary to divide the original DOM, whose side length reaches thousands or tens of thousands of pixels, into image subsets with a side length of only a few hundred pixels, which are used as input data when training deep learning models for the identification of individual tree, due to high demand for computing resources [13,14,20]. However, the corresponding reverse operation, that is, integrating the inference results of image patches into an inference result of the whole DOM, has been seldom considered in previous studies. In this paper, a partition-based method for high-resolution instance segmentation of DOMs is presented, having two main differences compared with the previously proposed methods. First, the DOM is split into patches, and the position of each patch is saved separately in the data pre-processing task. Second, the inference results of image patches are integrated into a unified result based on the position information stored in the data pre-processing task, which is followed by non-maximum suppression (NMS).
Although the data are collected on different dates and flight heights, the original litchi images still lack diversity. To solve this problem, a large amount of citrus data were annotated and added to the training set. The comparative experiment results show that the addition of citrus data can improve model performance in litchi tree identification.
In this paper, the average precision (AP) is chosen as an evaluation metric of the proposed model. This metric has been commonly used to examine the performance of models in detection tasks. A series of comparative experiments are performed using different settings of the backbone network, model structure, spectral type, data augmentation method, and training data source. According to the experimental results, when trained with the litchi-citrus datasets, the AP on the test set reaches 96.25%, achieving the best performance among all experiment groups.
The main contributions of this paper can be summarized as follows:
- The YOLACT model is used to develop a method for litchi canopy instance segmentation from UAV imagery;
- A labor-friendly semi-auto annotation method for data pre-processing is developed;
- A partition-based method for high-resolution instance segmentation of DOMs, including the division of input images and integration of inference results, is proposed.
2. Materials and Methods
2.1. Study Areas
The study area of this work is located in Guangdong Province, China. The experiment was conducted in three orchards containing litchi trees and citrus trees. The orchards were denoted as Area A, B, and C. Area A was located in Conghua District, Guangzhou City (23°35′11.98″ N–113°36′48.49″ E), and contained 141 litchi trees. Area B was located in Tianhe District, Guangzhou City (23°9′40.75″ N–113°21′10.75″ E), and contained 246 litchi trees. Area C was located in Boluo County, Huizhou City (23°29′56.74″ N–114°28′4.11″ E), and contained 324 citrus trees. There were significant differences in lighting conditions and canopy shapes between the three areas. The overview of the study areas is shown in Figure 1.
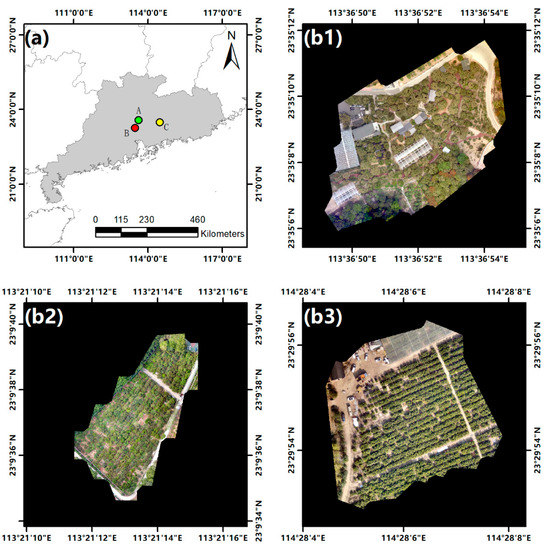
Figure 1.
Overview of the study areas. (a) The locations of the study areas. (b1–b3) digital orthophoto maps of Areas A, B, and C acquired by a UAV, respectively.
2.2. UAV Image Collection
Images of the three study areas were obtained using a DJI P4 Multispectral. An example of the UAV image is shown in Figure 2. The UAV was equipped with six 1/2.9″complementary metal-oxide semiconductors (CMOS), including one RGB sensor for visible light imaging and five monochrome sensors for multispectral imaging: blue (B): (450 ± 16) nm; green (G): (560 ± 16) nm; red (R): (650 ± 16) nm; red edge (RE): (730 ± 16) nm; near-infrared (NIR): (840 ± 26) nm. The flight height and flight date of the three areas are shown in Table 1. Flight planning and mission control software was managed by the DJI GO Pro software.
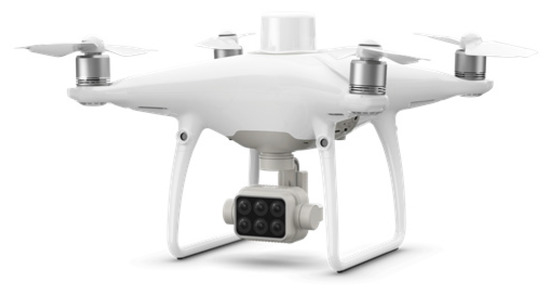
Figure 2.
The DJI P4 Multispectral.

Table 1.
Flight height and flight date of three areas.
2.3. Photogrammetric and Data Format Processing
The imagery was photogrammetrically processed to generate the RGB DOM using DJI Terra software. The corresponding normal different vegetation index (NDVI) image was obtained based on the red and near-infrared bands using the formula of (NIR − Red)/(NIR + Red). As the input form of the YOLACT network is three-band, in order to allow the single-band NDVI image to be input in the same format as the RGB image, additional data processing was performed. The workflow of this process is shown in Figure 3.
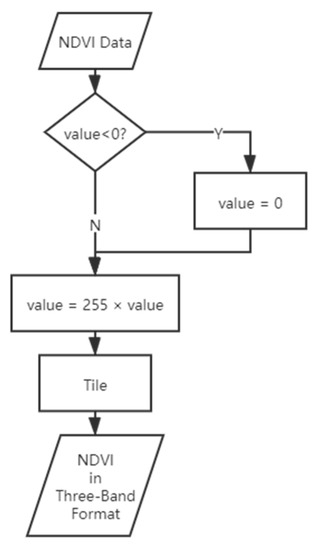
Figure 3.
Workflow of the NDVI image data pre-processing.
2.4. Annotation
A labor-friendly annotation method based on the coordinate system conversion is introduced since it is time-consuming to annotate the images of the canopy areas of the same litchi tree collected on different days manually. The positioning information of the same place based on different coordinate systems can be converted to each other through a series of calculations [33]. Suppose a point’s positions in the WGS 84 geographic coordinate system and image coordinate system are denoted as and and and . The values needed for conversion between the image coordinate system and the WGS 84 geographic coordinate system, including longitude and latitude of the image’s upper left corner denoted as and and horizontal and vertical spacings of raster pixels denoted as and , were extracted from the DOM using the Pillow library in Python. The coordinate system conversion is given by (1)–(4).
Theoretically, the actual geo-coordinates of the trees in the experimental area can be considered fixed. The coordinates in an image of the annotations of the canopy in new shots can be easily calculated if the actual geo-coordinates of trees and values of another DOM needed for the conversion are known. In practice, the canopy areas of trees in DOMs acquired on different days can be automatically annotated by the above-mentioned method based on the manual DOM annotation. The principle of the annotation method is shown in Figure 4.
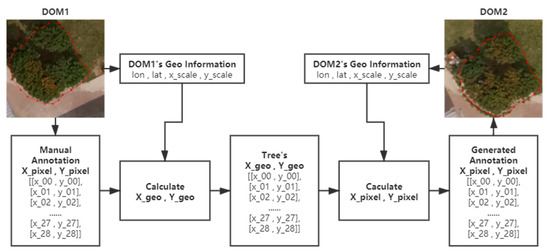
Figure 4.
The principle of the annotation method.
2.5. Crop Sampling and Datasets Construction
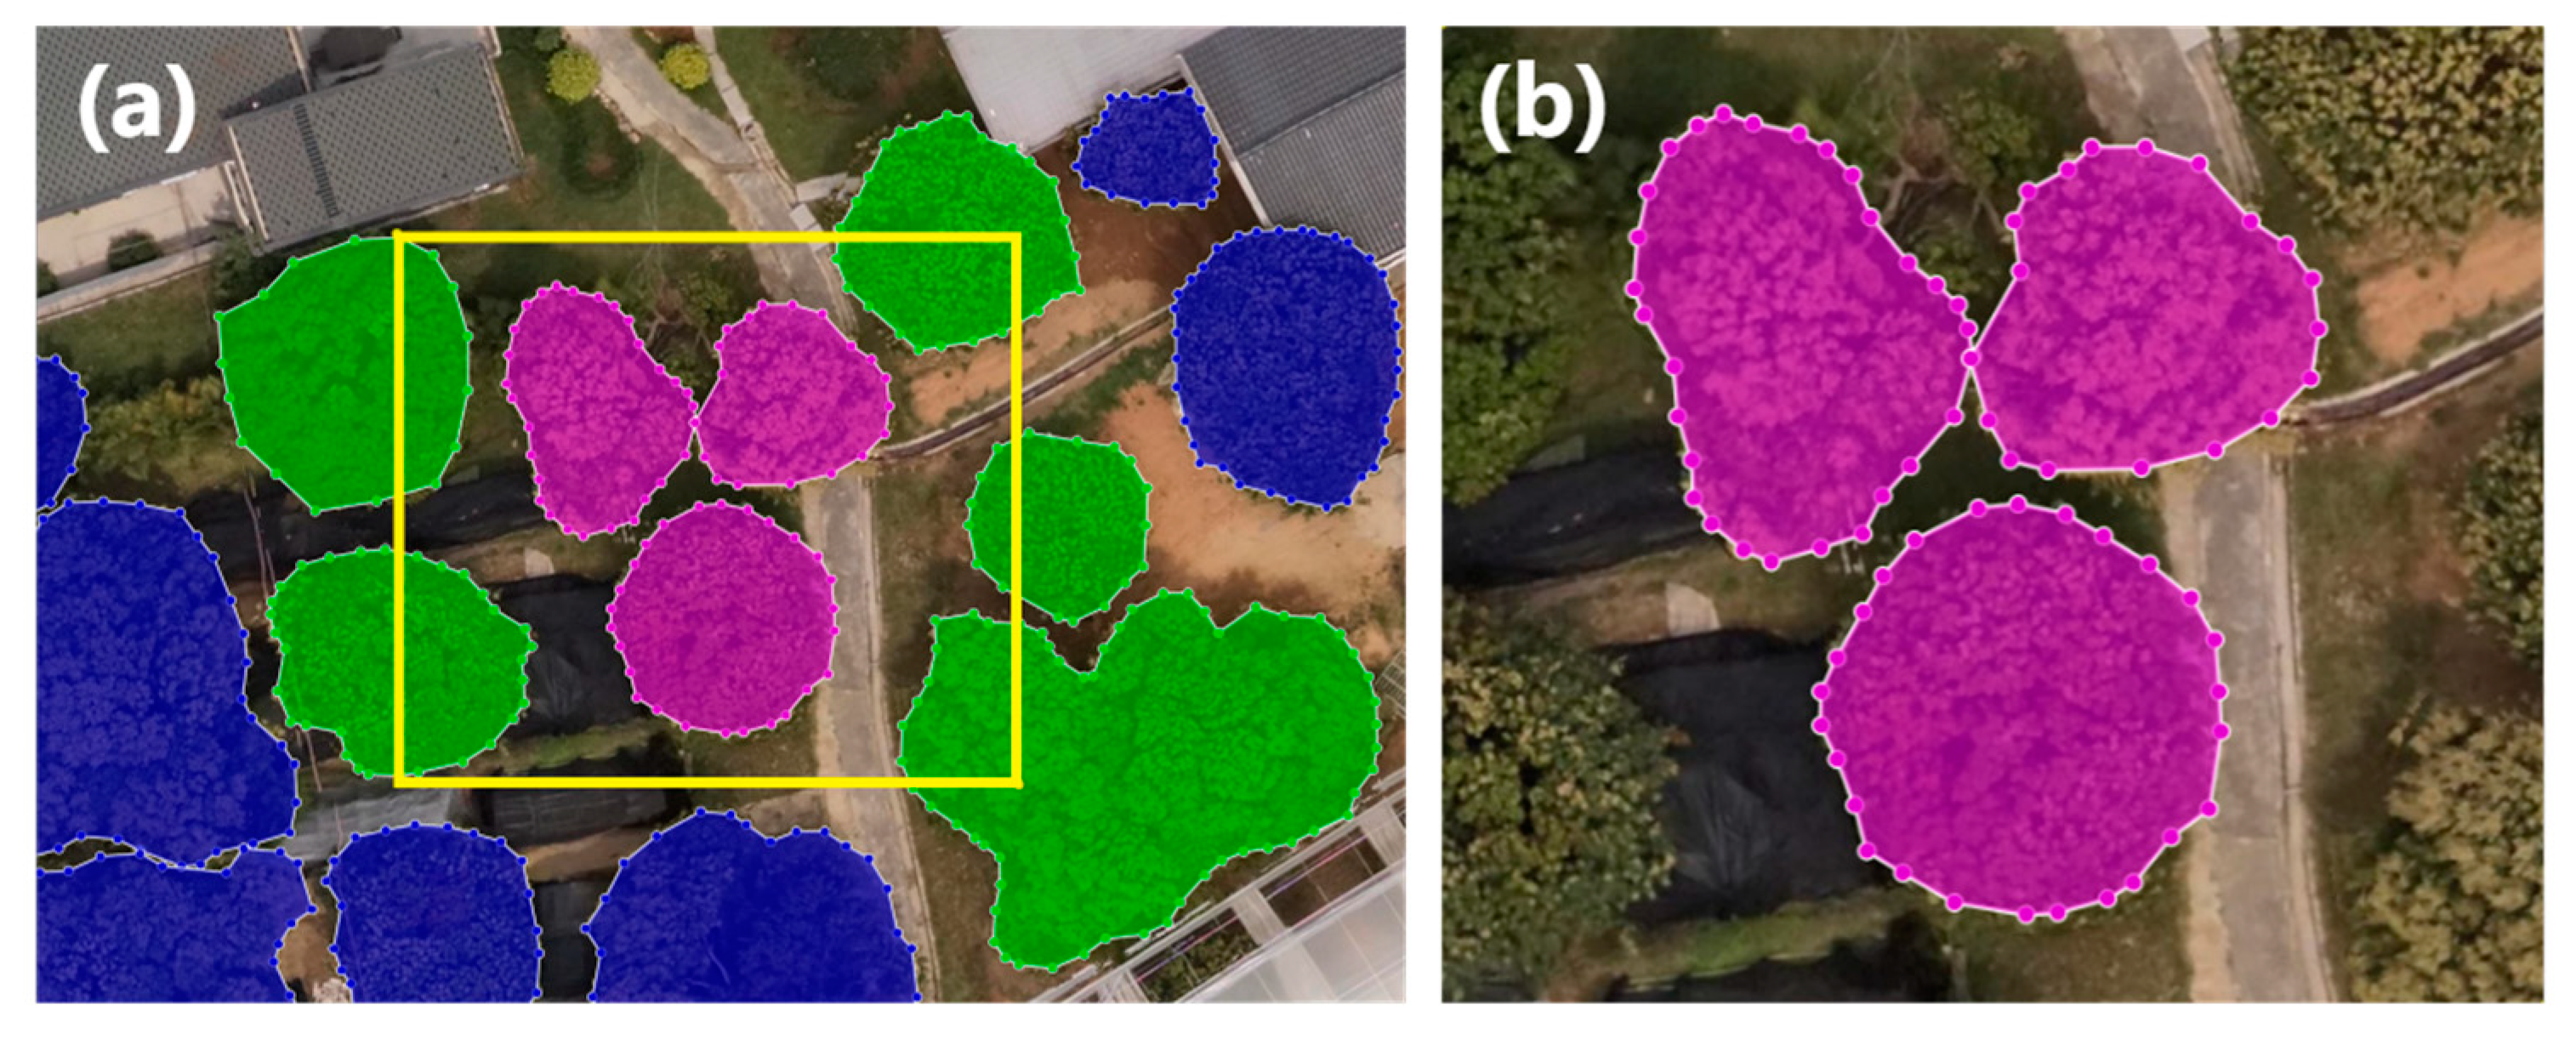
Random cropping for sampling was performed. The cropping size was set at 1100 × 1100 pixels. An object was chosen for sampling only if it was the whole inside the frame. An illustration of the crop sampling process is shown in Figure 5.
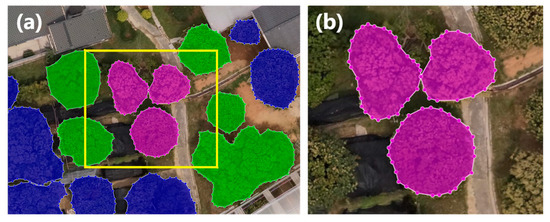
Figure 5.
Illustration of crop sampling. (a) Objects are colored based on the relationship with the cropping frame in the yellow color: pink means that the whole object is inside the frame; green indicates that the object is partly inside the frame; blue means the object is outside the frame. (b) Only the objects which are the whole inside the frame are chosen as objects in the sampling process.
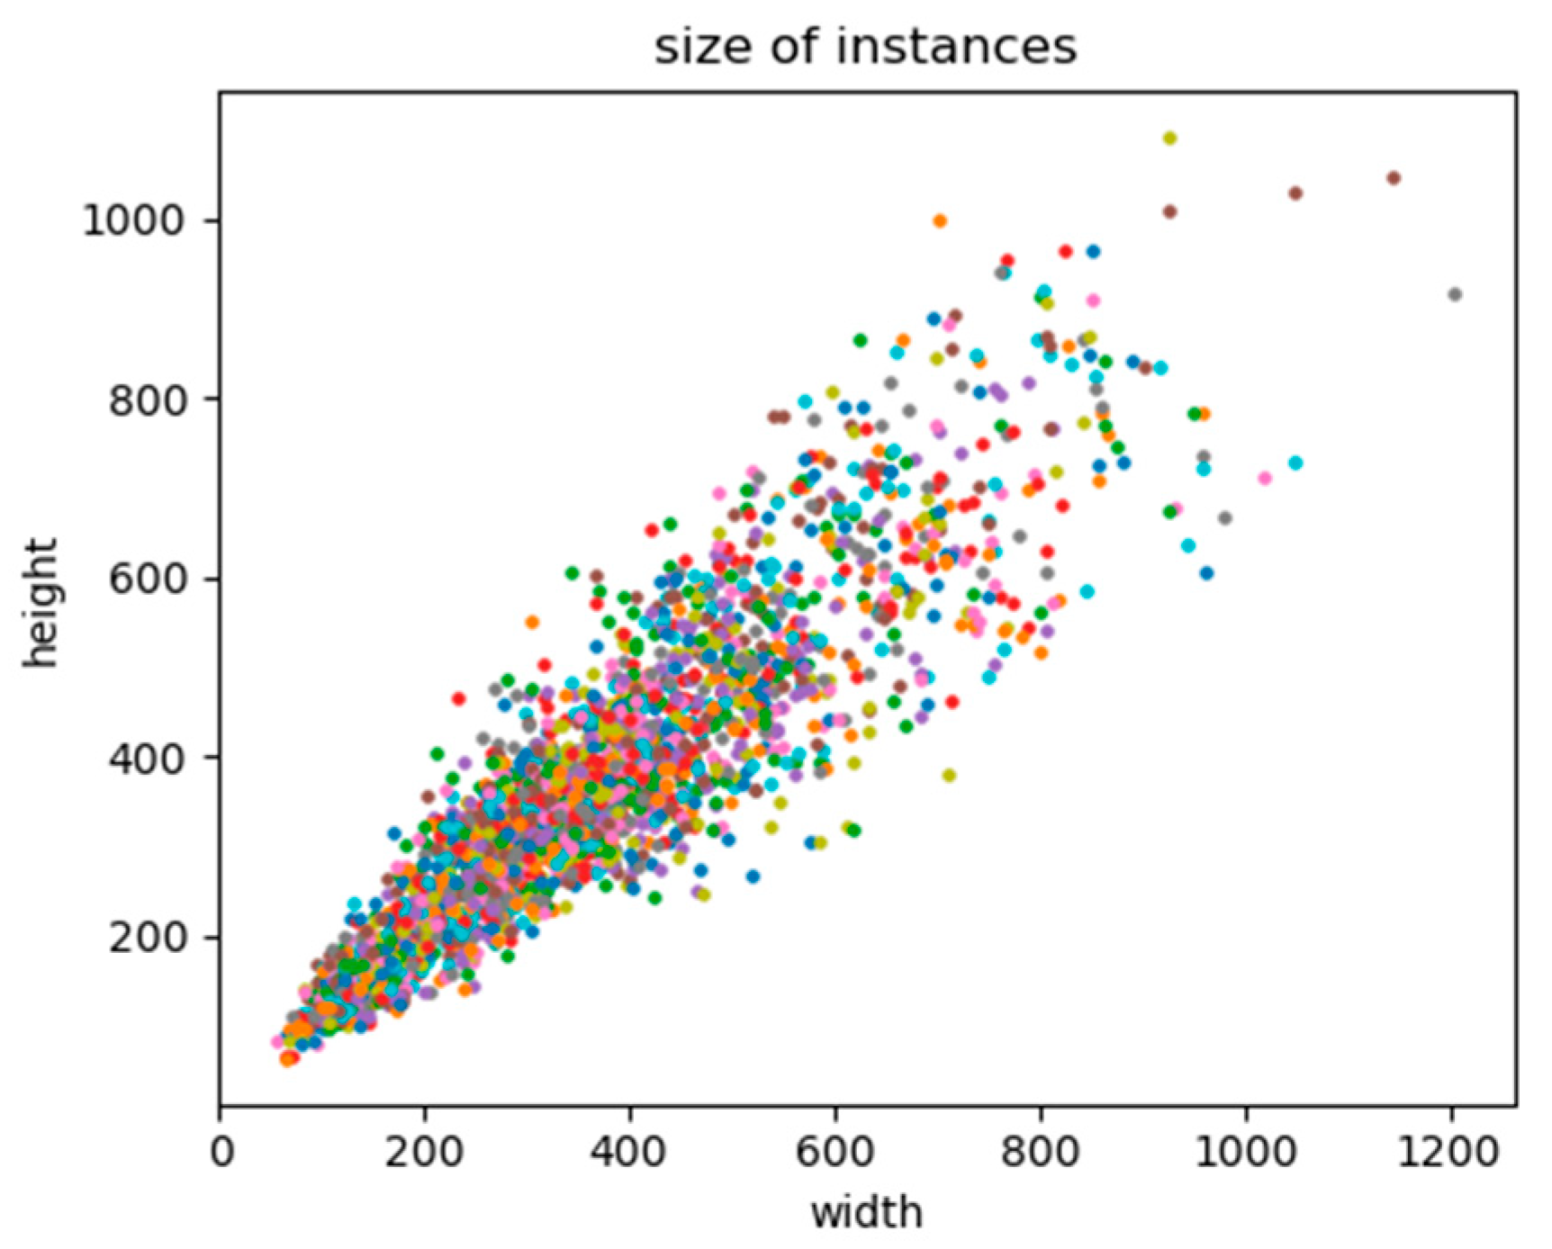
In addition, a crop sampling image would not be accepted if all objects in the frame had already appeared in the previous sampling image. The NDVI image sampling was performed in parallel with the RGB image sampling. The sample numbers of the three areas are given in Table 2, and the distribution of the original size of instances in samples is shown in Figure 6. Since the largest instance had a side length of almost two times the default input size of the YOLACT, each cropped image was down-sampled at a ratio of 0.5.
Table 2.
Sample numbers of the three areas.

Figure 6.
Distribution of the original size of instances.
After the crop sampling, four datasets were constructed for the experiments. The components of the train set, valid set, and test set in each dataset are shown in Table 3.
Table 3.
Components of the datasets.
2.6. YOLACT Network
The YOLACT [17] is a simple, fully-convolutional model for real-time instance segmentation. The ResNet [34] with feature pyramid network (FPN) [35] was used as a default feature backbone, while the base image size was set at 550 550 pixels. Each layer of the FPN included three anchors with aspect ratios of 1, 0.5, and 2.
The YOLACT divides the segmentation task into two parallel subtasks: generation of the prototype mask set and prediction of per-instance mask coefficients. Instance masks can be produced by linearly combining prototypes with the mask coefficients.
In this paper, several modifications in the YOLACT model are introduced to reduce computational complexity while achieving high-precision instance segmentation.
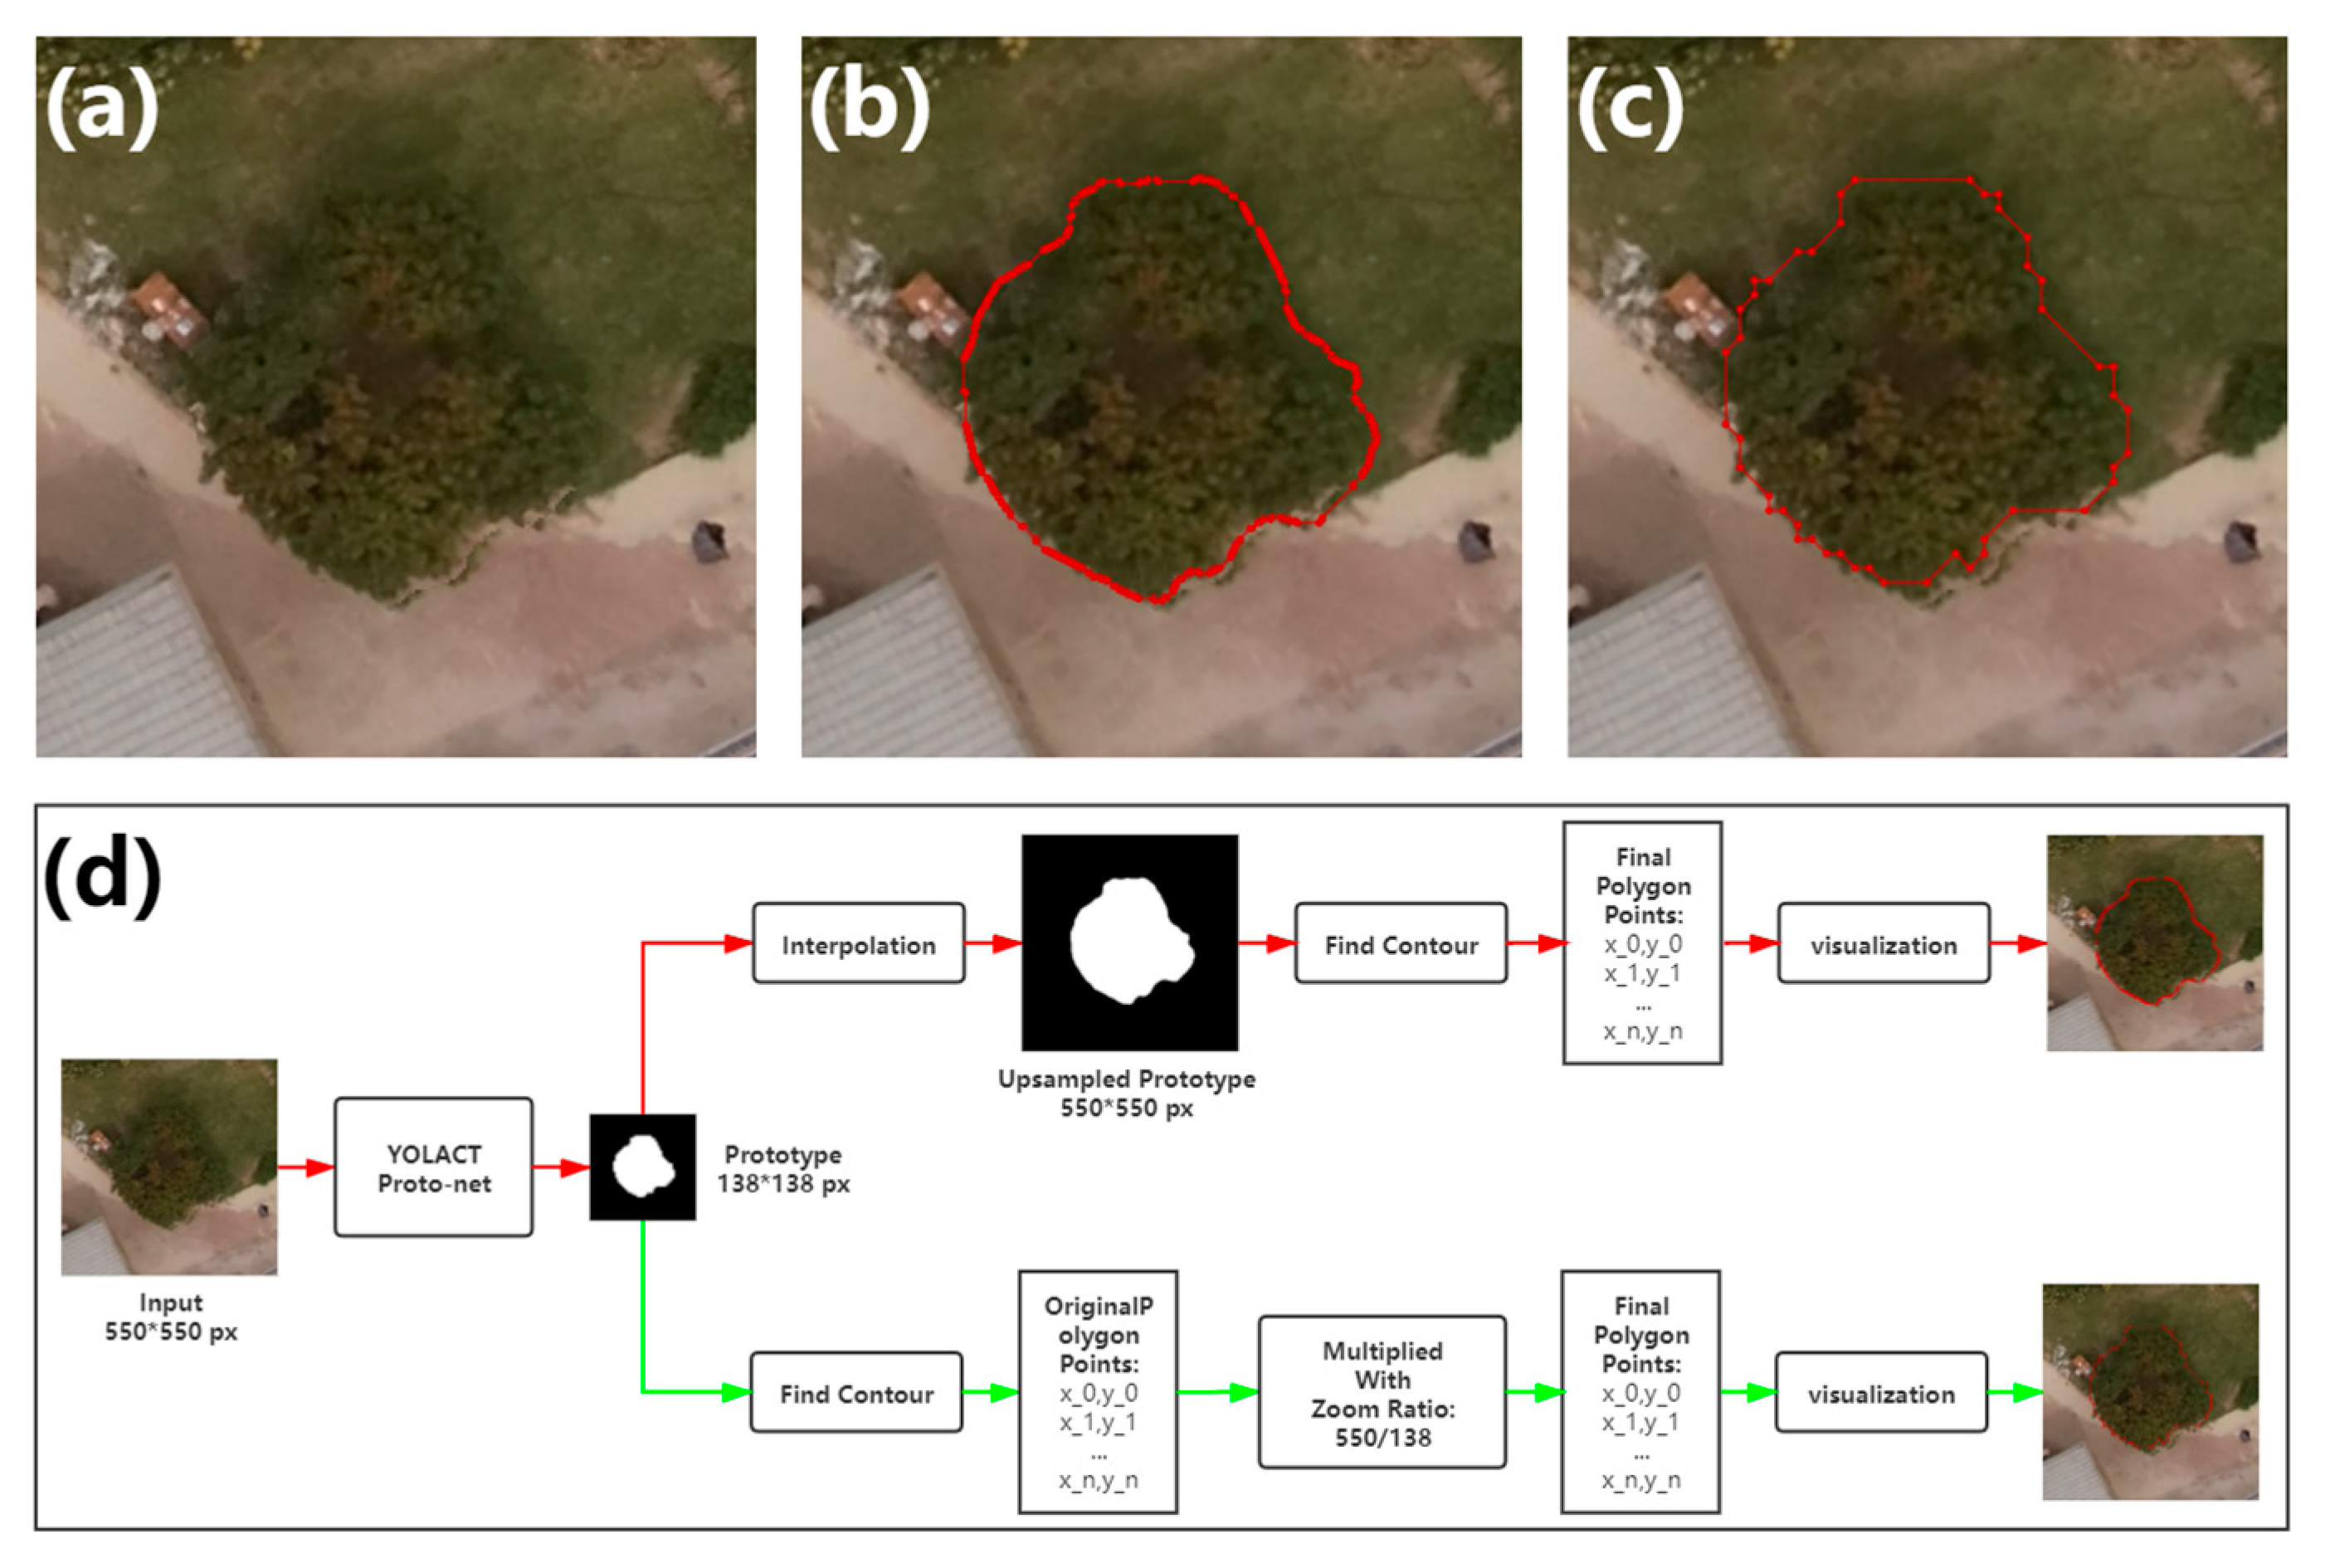
The output of the proto-net has a size of 138 138 pixels, which is smaller than the final output size of the whole model of 550 550 pixels. In the original implementation, the up-sampling by interpolation is performed to enlarge the per-instance mask. This approach provides a good match between the masks and the margin of detected objects. However, in the canopy segmentation task from remote sensing images, the shape of the tree canopy is generally round, without obvious protruding corners. The interpolation for mask production only brings up the subtle difference for the contours, which is not worthy from the aspect of computation cost. In this paper, polygon contours of the masks are obtained directly from the output of the proto-net using OpenCV functions, and values of the coordinates of the points of contours are simply multiplied by the zoom ratio for the enlargement. This approach reduces computation while still achieving proper segmentation of canopies. The difference between the two workflows is shown in Figure 7.
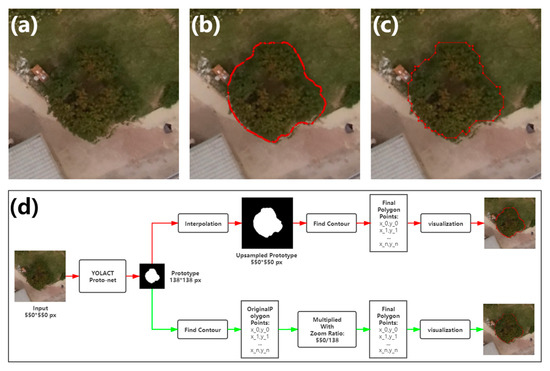
Figure 7.
Illustration of contour extraction. (a) The example of the litchi canopy image. (b,c) The visualization of the contours extracted by the original implementation and the method proposed in this paper. (d) Workflows of contour extraction. The red line represents the original implementation, while the green represents the method proposed in this paper.
As introduced above, three anchors with aspect ratios are used for each layer of the FPN. Unlike various ratios of width and height of objects in the public datasets, such as MS COCO [36], in this work, the circumscribed rectangles of the litchi tree canopies are of approximately square shape in most cases, so multi-ratio anchors can be replaced by a single anchor for the instance segmentation of litchi canopy. In this study, experiments were performed using two types of anchor ratio settings, the original ratio setting and the single ratio setting with the value one.
In the default configuration of the YOLACT, the number of prototypes k is set to 32. Considering the reduced variety in the litchi canopy shape, in this study, a smaller k with the value of four or eight is used. In the comparison experiments, different k values were used.
2.7. Instance Segmentation of High-Resolution Image by Partition
The training and inference of high-resolution images have not been considered in most studies on instance segmentation. In addition, it is not advisable to down-sample large images roughly to match their sizes with the input size of the model [37] since such an approach can cause a great loss of details, which are important for the detection and segmentation processes. Furthermore, object shape can be distorted during down-sampling if the formats of the input images and model input are different in width and height. Both these situations can significantly degrade the precision of inference.
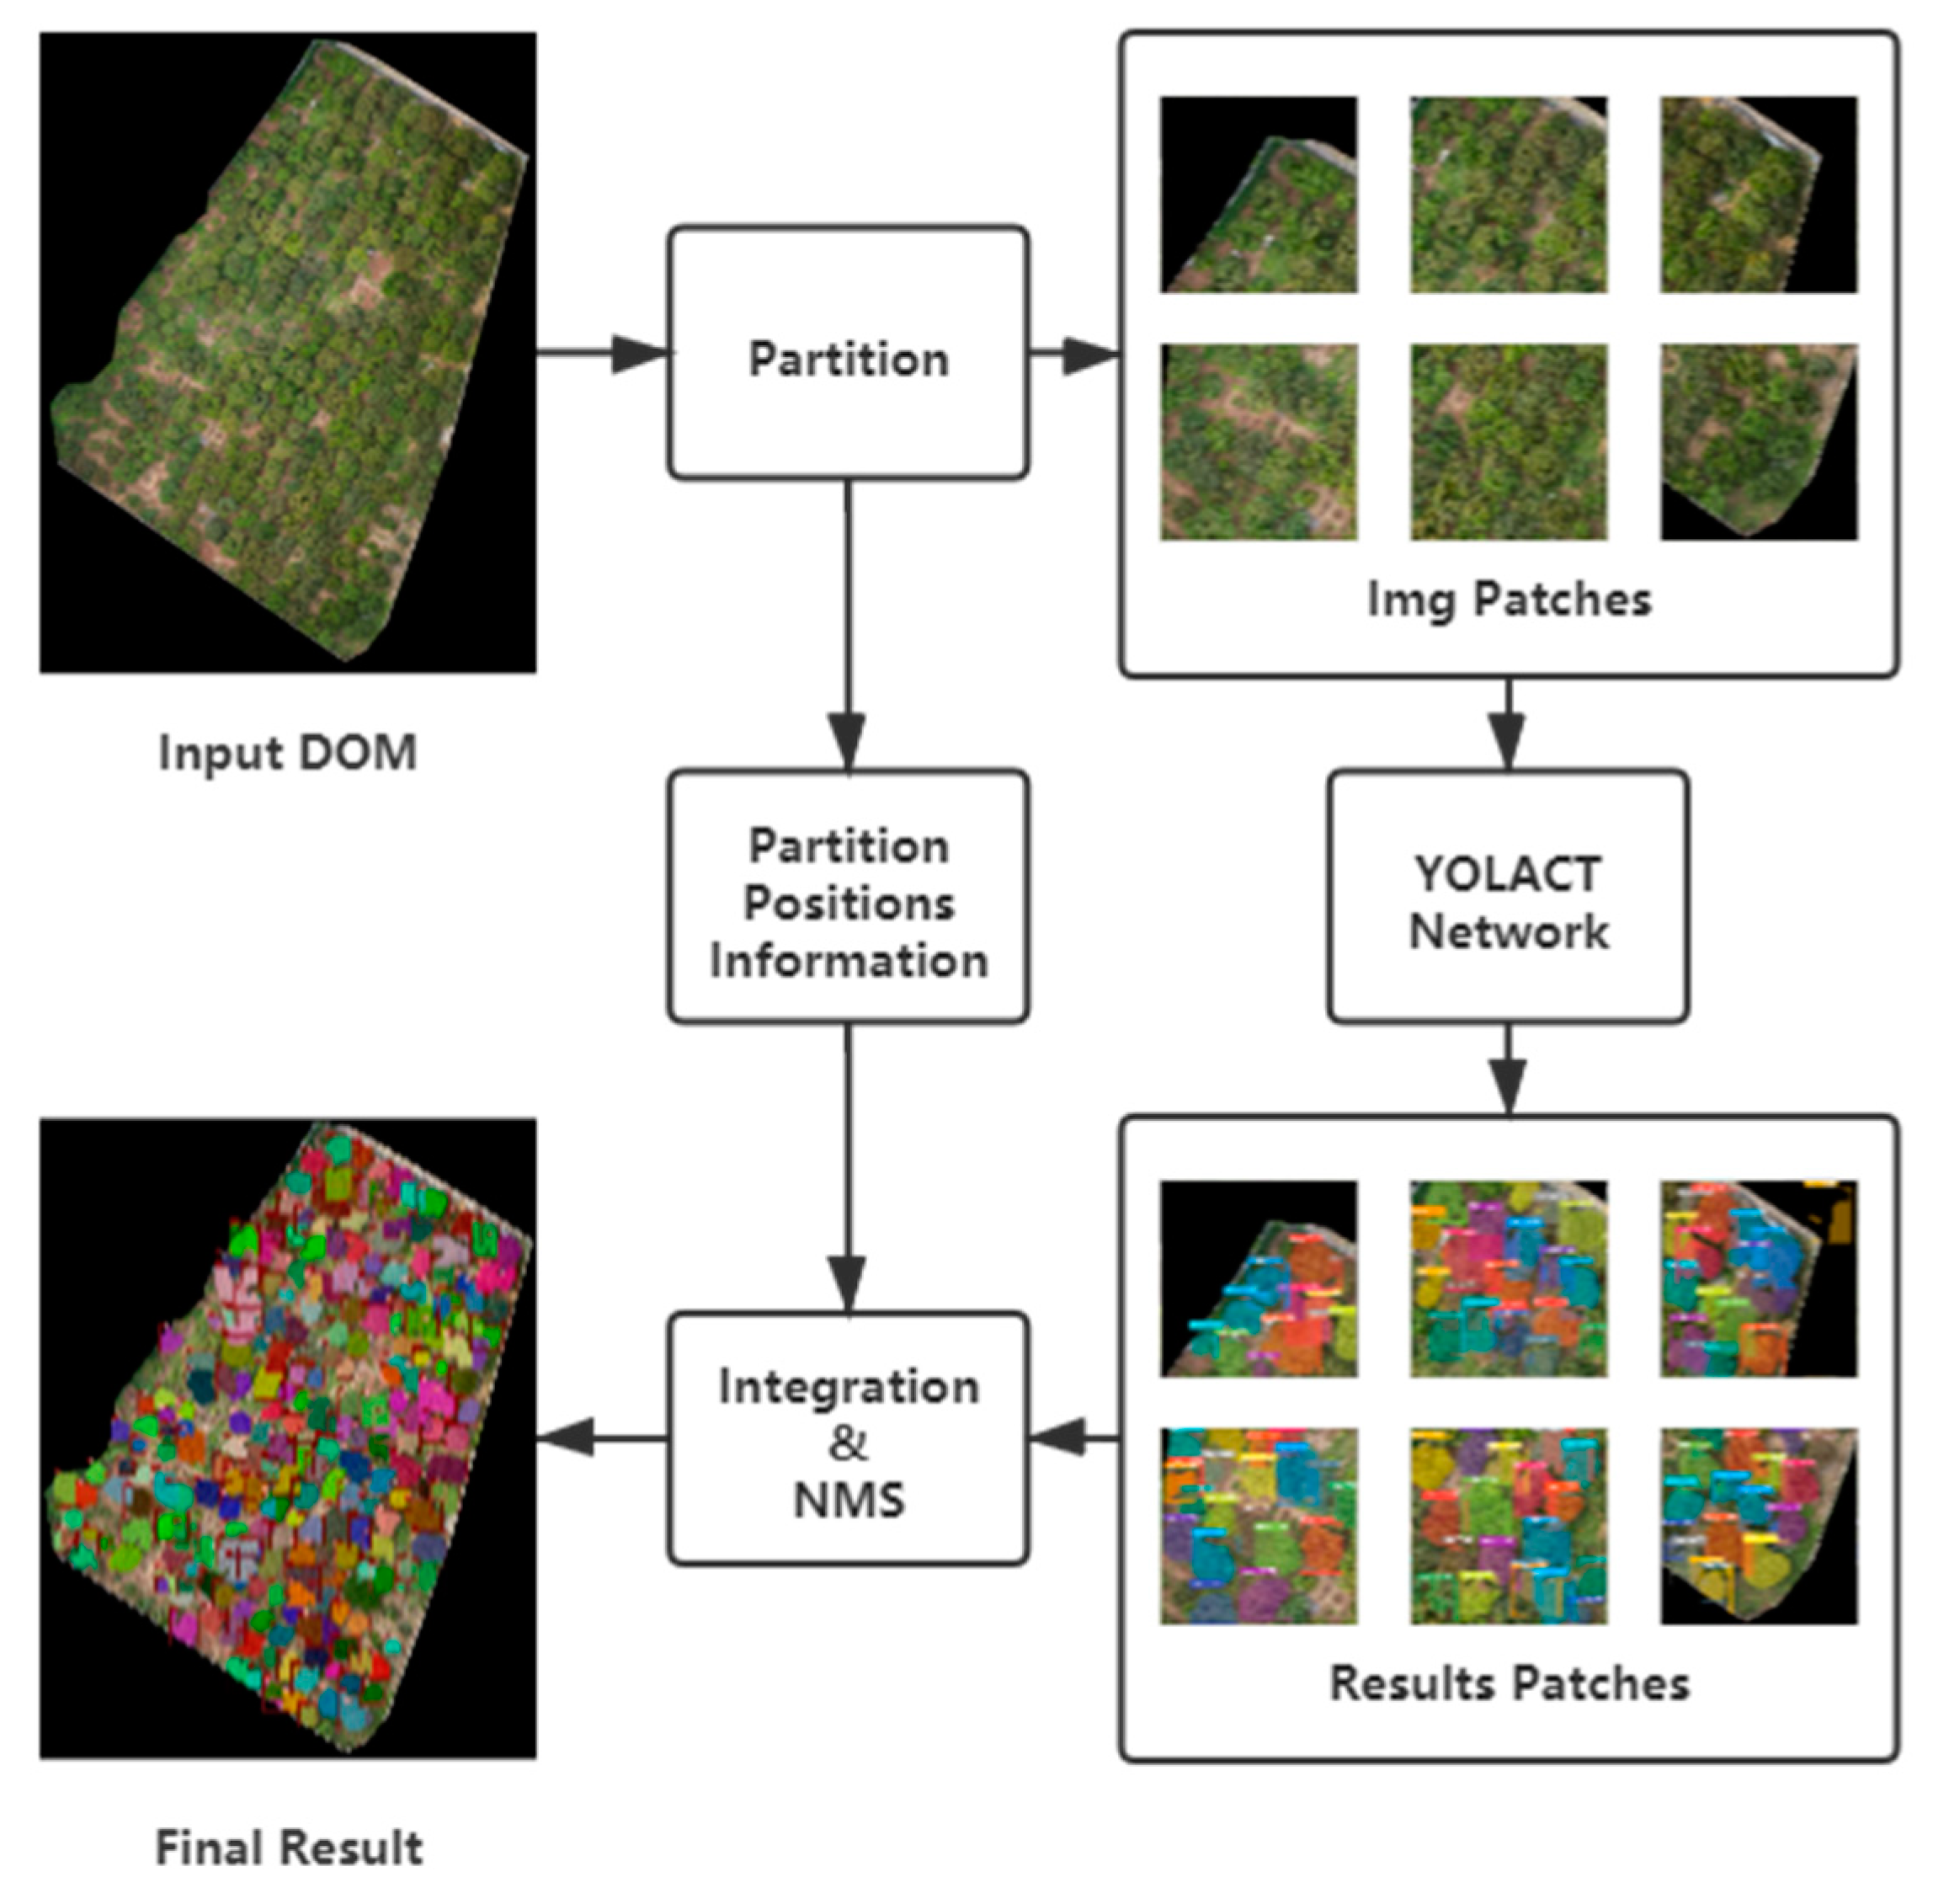
Similar to the YOLT method proposed in [38], a partition-based method for high-resolution instance segmentation DOMs is presented in this work. The DOM is divided into patches, and the position of each patch is saved during data pre-processing. The inference results of image patches are integrated into a unified result based on the position information stored during data pre-processing, which is followed by the NMS; and denote the width and height of a DOM; denotes the lower bound of the number of samplings via sliding a window with the size of in each direction ;
where is the window sliding distance, and is the overlap length, and they are respectively calculated by:
In practice, is set to be equal to the input size of YOLACT, and is multiplied by the gain ratio to enlarge , which can be expressed as:
Once the partition is completed, image patches obtained from the original DOM are subjected to instance segmentation sequentially. This approach can infer the high-resolution DOMs while avoiding the shortcoming of rough down-sampling, as mentioned above. The partition and integration workflow is shown in Figure 8.

Figure 8.
Workflow of partition and integration.
In this paper, the partitioned-based method was applied only for inference, while the image patches for training were generated by random cropping. Unlike the sliding window position randomly generated when sampling mentioned in Section 2.5, when partitioning is mentioned in this section, the sliding window position for cropping each image patch is determined based on the size of the original image, the sliding window’s size , and the gain ratio , without any randomness.
2.8. Training Details
The original YOLACT model was trained with the COCO dataset using the stochastic gradient descent (SGD) algorithm for 800,000 iterations starting at an initial learning rate of , which was decreased by a factor of 10 after 280,000, 600,000, 700,000, and 750,000 iterations; the weight decay was , and the momentum was set to 0.9.
The learning rate decay strategy was applied to the training process with two modifications. First, iteration nodes for learning rate changes were multiplied with a ratio. Suppose the number of samples in the training and MS COCO datasets were denoted as and , respectively; then, the ratio was set at . Second, the training would stop when the half of maximum iterations was reached since after that, the accuracy could not be further improved.
The ResNet [34] is a default backbone of the YOLACT. The same backbone settings were applied to the experiments in Section 3. Models in the original implementation [17] were trained on the MS COCO dataset, while the models in this paper were trained on the custom dataset described in Section 2.5.
All models were trained with a batch size of eight on a single NVIDIA Titan X using ImageNet [39] pre-trained weights, the same as in the original implementation.
2.9. Model Validation
The InterSection over Union (IoU) used in the validation was defined as a quotient of the overlapping area and the union area between the prediction and ground-truth. In addition, the Box IoU and Mask IoU denote the IoU of objects’ circumscribed rectangle area and the IoU of objects’ own area, respectively. The predictions were classified into three groups: (1) True Positive (TP), which represented the predictions with the IoU larger than the threshold; (2) False Positive (FP): which represented the predictions with the IoU below the threshold; (3) False Negative (FN): which indicated that the ground-truth area was not detected by any prediction.
Further, the precision and recall were respectively calculated by:
The average precision (AP), which corresponded to the area under the Precision-Recall curve, was used to validate the performances of the models. The Box AP and Mask AP were calculated based on the Box IoU and Mask IoU, respectively. In this paper, the IoU threshold was set to 0.5, and the AP based on the threshold was denoted as AP50.
3. Results
Several ablation experiments were conducted to compare the performances of the models under different configurations. Each model configuration was trained 5 times and the model’s weights of each training time were saved. In the following, the mean AP50 and best AP50 of all configurations are given for the 5 training times.
3.1. Backbone Network
Comparisons of the model performance based on two kinds of ResNet are shown in Table 4, where the best AP values of the first two models denote the results reported in [17].
Table 4.
Model performances under different backbone network models.
The results in Table 4 indicate that a deeper backbone network might be useless for the canopy segmentation task since such a binary classification task is less difficult compared with the original task of the YOLACT. The results have shown that the ResNet50 is enough as a backbone network model for the segmentation task considered in this study.
3.2. Anchor
Experiments were performed to compare the models’ performances under the two anchor settings. The “Lite” model had the same configuration as the third model in Section 3.1 except for the anchor number. Results showed that models with a single square anchor still had better performance compared to the default model. More details are shown in Table 5.
Table 5.
Model performances under different anchor settings.
As mentioned in Section 2.6, the circumscribed rectangles of the litchi tree canopies had a square shape in most cases. Experiments have proven that using a single square anchor cannot impact the model performance. This modification in the model’s structure is feasible based on the inherent biological properties of trees.
3.3. Mask Prototype
This section presents the performance comparison of the number of prototypes under different settings. Three model configurations used in the comparison experiment were identical with the exception of the prototypes. Results indicated that the model with four prototypes had better performance than the default model on average. The comparison results are shown in Table 6.
Table 6.
Performances of models under different prototype settings.
3.4. Data Type
As mentioned in Section 2.6, the RGB and NDVI images were sampled parallelly. The model trained on the NDVI dataset had the same configuration as the default model. Model performance comparison results are shown in Table 7. Results showed that the NDVI data did not provide an improvement in model performance compared with the RGB data.
Table 7.
Performances of the models for different data types.
However, it would be inappropriate to draw a conclusion that the NDVI data have less advantage in canopy recognition compared with the RGB data. It should be noted that the YOLACT model has been primary designed for visible spectral tasks, not multispectral tasks, but it could achieve good performance in canopy recognition using a suitable backbone neural network when the NDVI data are used.
3.5. Rotated Data Augmentation
The default data augmentation methods of the YOLACT follow the setting of the SSD [40]. Rotation methods, such as flipping and rotation, are not applied in the default settings. Experimental results shown in Table 8 show that rotation methods cannot improve model performance.
Table 8.
Performances of the models for different augmentation methods.
3.6. Datasets
Comparisons of model performance based on different datasets are shown in Table 9, where the components of each dataset are shown in Table 3.
Table 9.
Performances of the models trained with different datasets.
According to the comparisons of results between D1 and D2, the model achieves better performance when trained with the data consisting of the canopy images of different types of trees. This is because, in that case, the model is guided to learn common features of canopies of both litchi and citrus instead of only one specific type of tree, which makes the model more robust.
3.7. Best Model Configuration
Based on the above presented results of the ablation experiments, this section presents the result of a theoretical high-performance model configuration. A comparison of the actual test results is shown in Table 10.
Table 10.
Performances of the models with different high-performance configurations.
According to the experimental results, a simple combination of several settings that improve the recognition performance may not be the best choice. Specifically, the third model in Table 10 outperformed the fourth one in almost all metrics except the mean Mask AP50, indicating that the methods of model simplification, such as reducing the total number of prototypes, cannot ensure that the models perform better when training on various data sources. Thus, over-simplifying of the model configuration could reduce the model’s ability to extract more complex features.
In addition, the third model in Table 10 was considered as the best model on average in this paper since it performed best on three metrics, and was only slightly inferior to the fourth model on the metric of mean Mask AP50.
3.8. Visualization
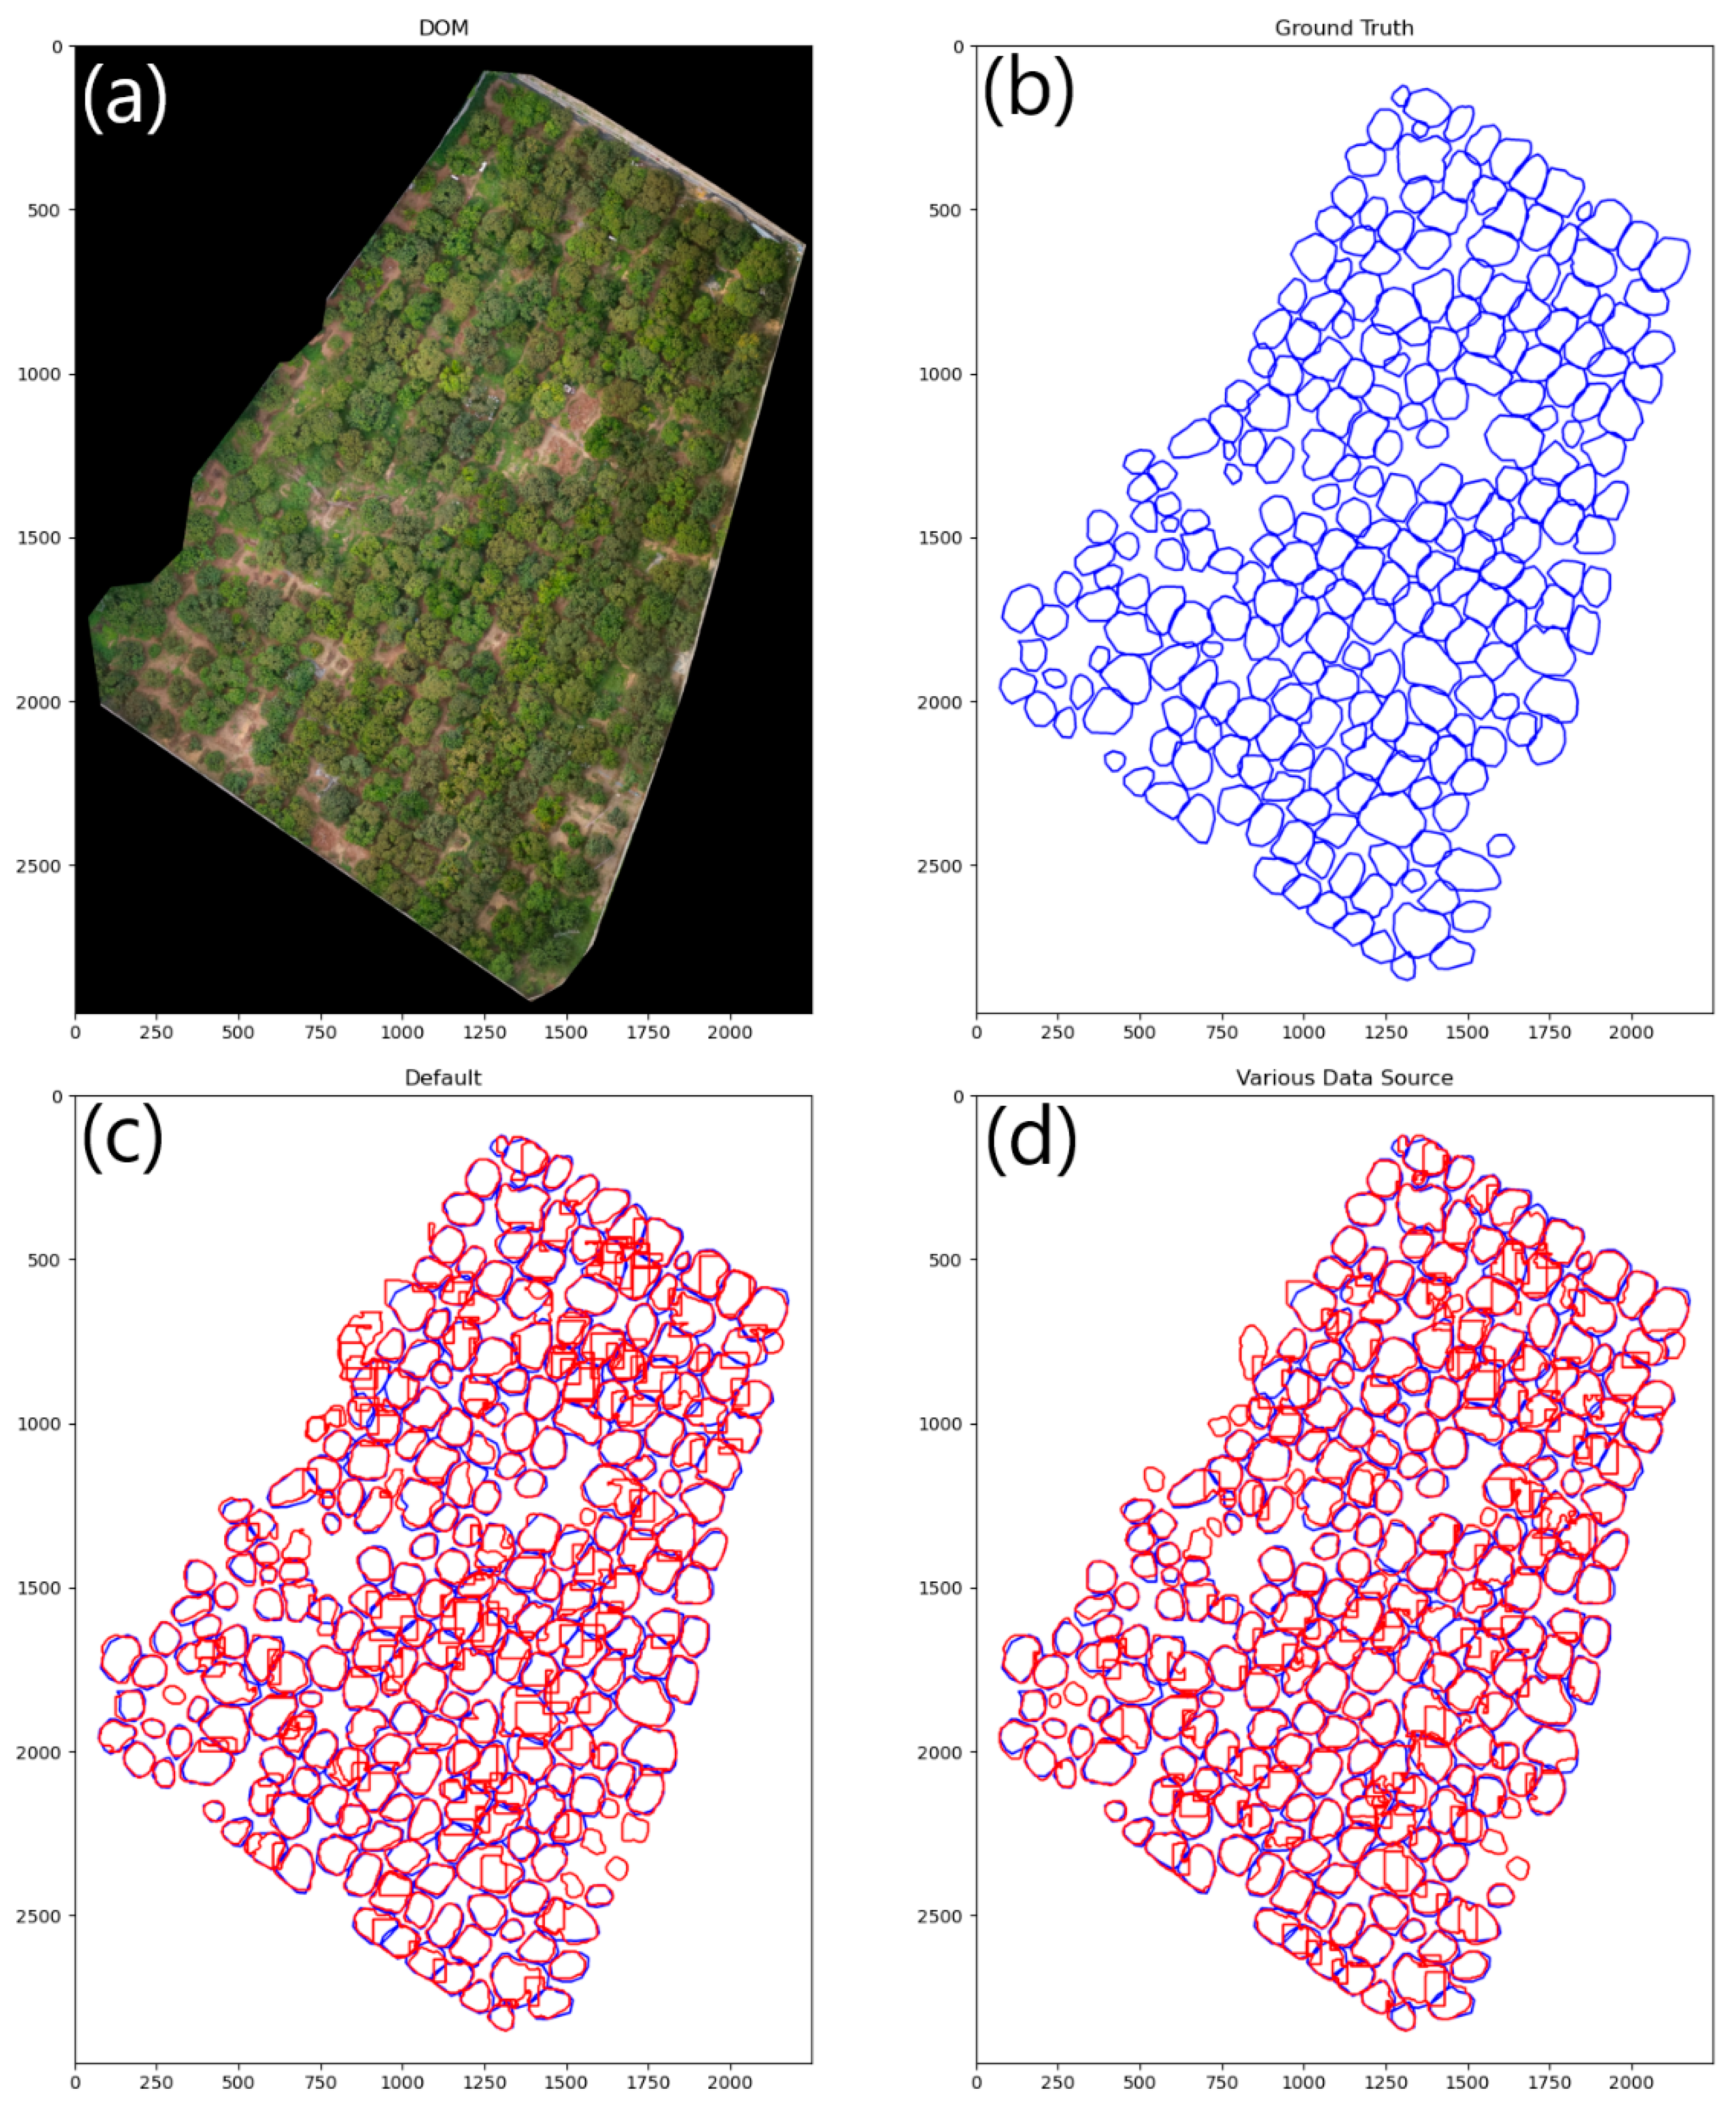
Instance segmentation of Area B’s DOM is performed by partition as mentioned in Section 2.7. The gain ratio of the partition was set at 2 and the confidence threshold was set at 0.15. The visual results of the models are presented in Figure 9 and Figure 10.
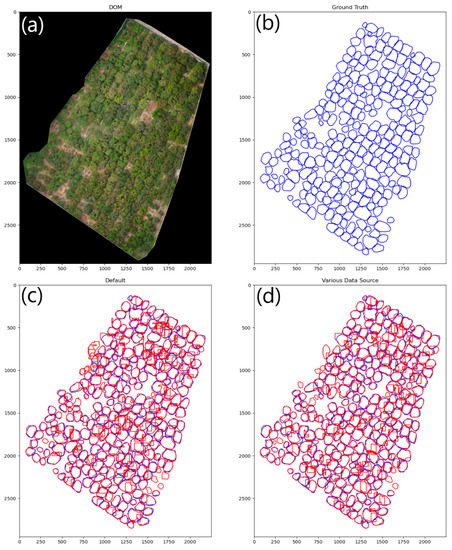
Figure 9.
Visualization of the model’s inference results. (a) The DOM of Area B. (b) The annotation of ground truth with blue lines. (c,d) The inference results of the models with red lines.
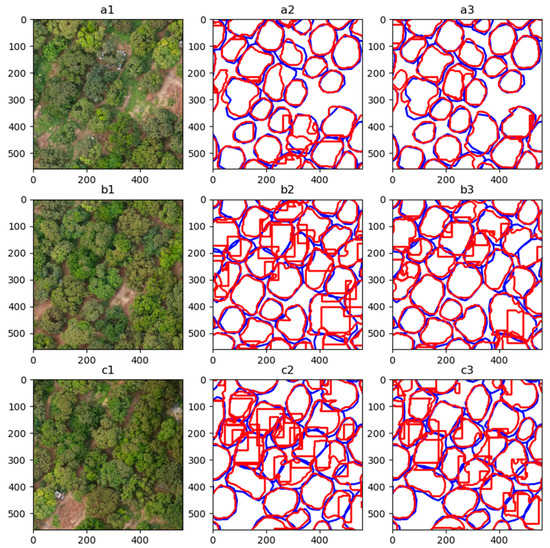
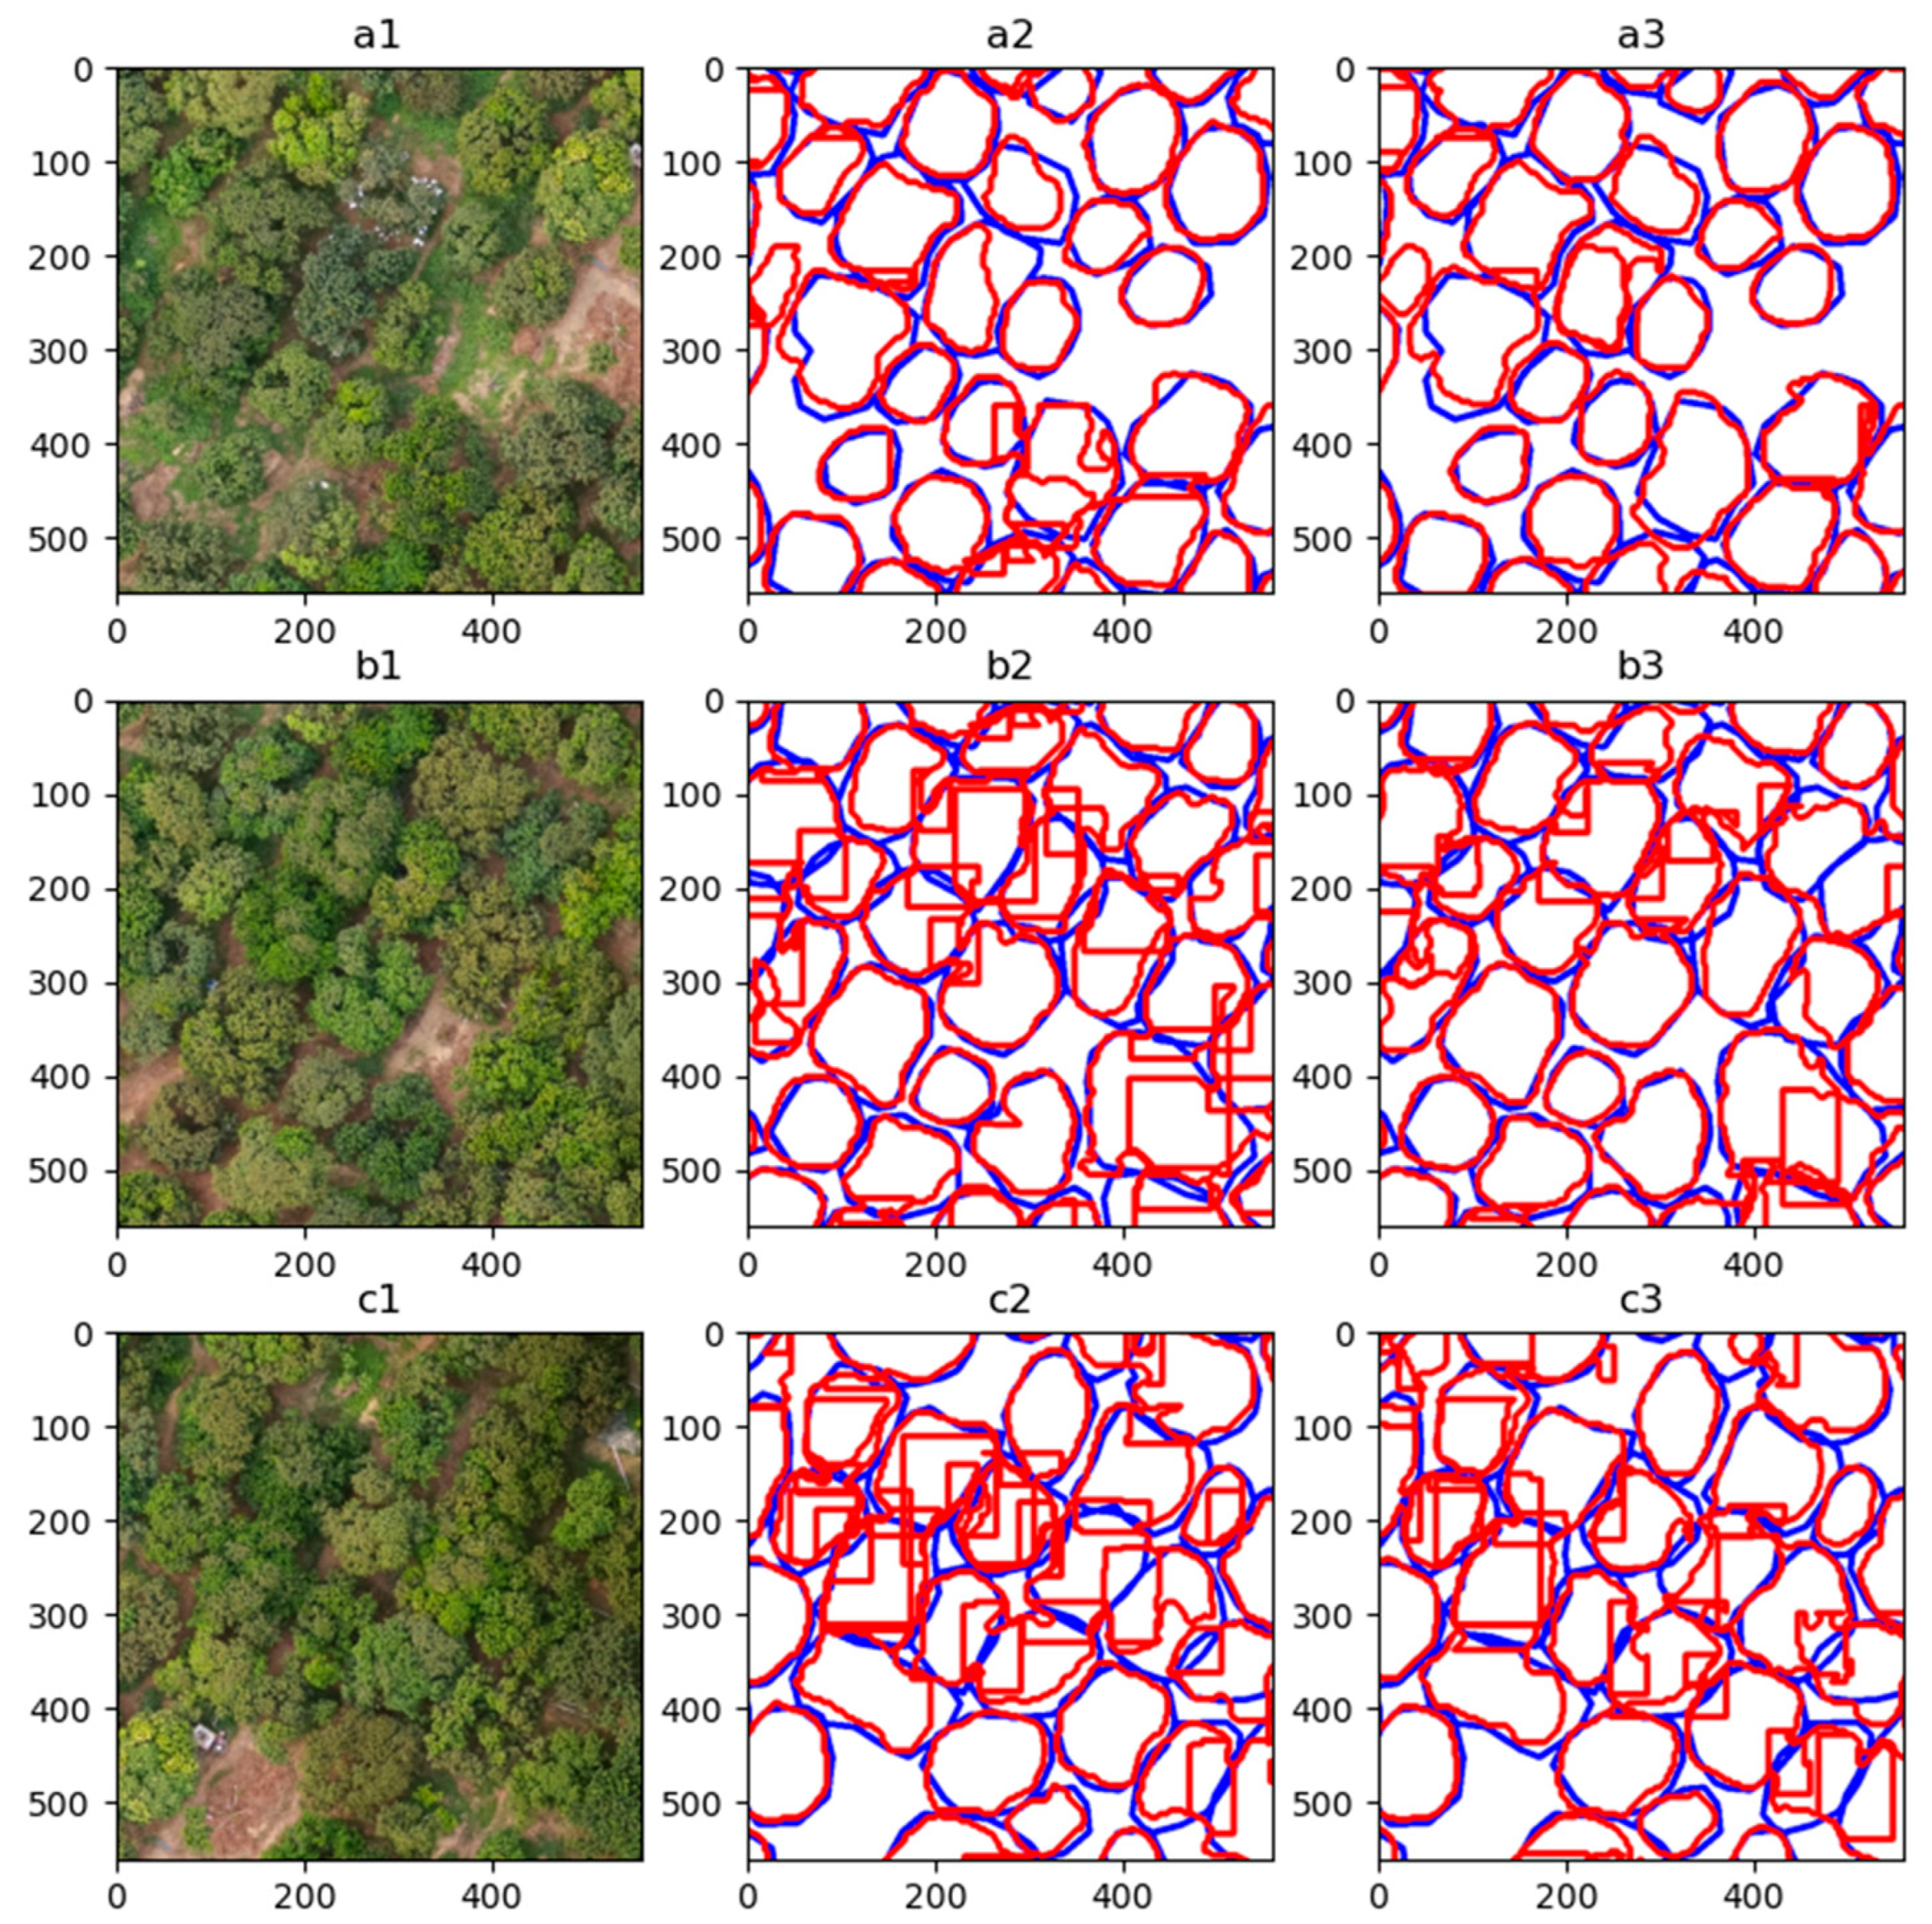
Figure 10.
Enlarged display of the models’ inference results. Rows a to c: three areas selected in Area B. Column 1: DOM of each area selected. Columns 2 and 3: the inference results from the model with default and best configuration respectively. The meaning of the line colors in Columns 2 and 3 is consistent with Figure 9.
Row a in Figure 10 indicates that both models can segment the canopies well when the trees are not dense. When inferring the position shown in Row c, the default model tends to generate overlapping masks, but the best model does not.
4. Discussion
4.1. Training and Testing Data Sources
Many previous studies [8,13,21] have constructed a dataset from a single source and then divided it into training, test, and validation sets, ensuring that all sets had relatively similar or the same distributions, which provides more advantages for validation.
In this paper, as mentioned in Section 2.5, four datasets with different forms of data division were constructed. Among them, D1 and D2 were constructed in the forms of datasets from previous studies mentioned above, while D3 and D4 were built based on a rule: no sample for training or validation was added from Area B. As mentioned in Section 2.1, lighting conditions and canopy shapes are significantly different between the three areas. Using such a data structure introduces challenges to model training and validation.
The experiments in Section 3.6 show a huge gap in the model’s precision between datasets built by different kinds of rules. On the one hand, the low precision of the models trained with D3 or D4 indicates that the proposed method is difficult to learn common features between the training data and testing data if both of them have diverse distribution. On the other hand, although the best model in this paper has a good performance on the D2 dataset, it is still unguaranteed whether the model can perform equally well on data at unknown times or places.
In conclusion, effective transfer learning for deep learning models is still challenging.
4.2. Crop Sampling Details
In early research on crop sampling, an object was chosen for sampling if the IoU between the object and the frame was greater than a specific threshold of 0.5. As a result, plenty of objects that were partly inside the cropping frame were chosen. Therefore, during training, models could not learn what a complete canopy was. Thus, this sampling rule decreases the model’s ability to understand the canopy integrity, degenerating from the instance segmentation to the semantic segmentation. To address this problem, a new sampling rule is introduced in this work, as presented in Section 2.5.
4.3. Partition-Method Drawbacks
As mentioned in Section 2.7, a solution to the instance segmentation problem for high-resolution images is proposed, and that is the partition-method. Compared with roughly down-sampling, using the partition method preserves more image details, thus improving the recognition precision, however, this damages the integrity of images of large tree canopies. To overcome this drawback, a gain ratio is introduced to enlarge the overlapping area, thus ensuring that each canopy image can be fully sampled in at least one block. This method provides better results at the cost of extra computation cost.
4.4. Application and Future Work Directions
The proposed method in this paper can be applied to the extraction and positioning of tree canopies, which is the prerequisite for the precise management of the litchi orchard. After obtaining the boundary and location information of the canopy, on this basis, agricultural analysis and decision-making can be carried out for each tree differentially.
For instance, in flowering periods, according to the color characteristics of the segmented canopy image, the flower growth of each tree can be individually evaluated. In fruiting periods, a more precisive yield prediction for individual trees can be performed instead of a coarse prediction for tree clusters. In addition, when combined with the GIS, the proposed method facilitates the establishment of trees’ location databases.
It should be noted that for a specific orchard, if the canopy boundaries of trees do not change much, the canopy information generated by the proposed method can be reused without re-identification.
There are two directions for improvement in the future works. First, when the NDVI or the original multispectral data are used for canopy recognition, the original backbone network in the YOLACT model can be replaced by a backbone network specific for multispectral tasks. Such improvement requires a modification of the backbone structure. Second, although as mentioned in Section 2.7, rough down-sampling could cause a great loss of details needed for the canopy segmentation, and the partition-method is proposed to address the problem, the appropriate degree of down-sampling can greatly reduce computation required for model inference. Thus, it remains to be explored how to strike a balance between maintaining the accuracy of recognition and increasing the degree of down-sampling.
5. Conclusions
In this paper, a deep learning-based instance segmentation method is proposed for images of litchi trees using the UAV DOM in a simple way. A labor-friendly semi-auto annotation method of images based on the coordinate system conversion is introduced, which significantly improves the efficiency of data pre-processing. When inferring high-resolution DOMs, which differ from the segmentation methods in previous studies that can only infer image patches, the partition-based method proposed in this paper can automatically integrate the inference results of patches into a united segmentation result. Citrus data are added to the training set to address the lack of diversity of the original litchi dataset. With the help of training on the litchi-citrus dataset, the model achieved the best Mask AP50 of 95.49% and the best Box AP50 of 96.25% on the test set, respectively. The results show that the model’s performance can be significantly improved if training data consisting of images of two types of fruit trees are used. After obtaining the boundary and location information of the canopy by the proposed method, the agricultural analysis and decision-making can be carried out for each tree differentially, which is of significance for the precise management of orchards.
Author Contributions
Conceptualization, J.M. and X.D.; methodology: J.M.; software, J.M.; validation, J.M.; formal analysis, J.M.; investigation, J.M.; resources, Y.L.; data curation, D.Y., F.W., H.Q. and J.M.; writing—original draft preparation, J.M.; writing—review and editing, X.C.; visualization, J.M.; supervision, X.D. and Y.L.; project administration, Y.L., funding acquisition, Y.L. All authors have read and agreed to the published version of the manuscript.
Funding
This research work was supported by the Key-Area Research and Development Program of Guangdong Province (Grant No. 2019B020214003), the Key-Area Research and Development Program of Guangzhou (Grant No. 202103000090), the Key-Areas of Artificial Intelligence in General Colleges and Universities of Guangdong Province (Grant No. 2019KZDZX1012), the Laboratory of Lingnan Modern Agriculture Project (Grant No. NT2021009), the National Natural Science Foundation of China (Grant No. 61675003), the National Natural Science Foundation of China (Grant No. 61906074), and the Guangdong Basic and Applied Basic Research Foundation (Grant No. 2019A1515011276).
Acknowledgments
The authors would like to acknowledge the support of the Litchi Provincial Modem Agricultural Industrial Park, Conghua, Guangzhou, Guangdong, China.
Conflicts of Interest
The authors declare no conflict of interest.
References
- Mulla, D.J. Twenty five years of remote sensing in precision agriculture: Key advances and remaining knowledge gaps. Biosyst. Eng. 2013, 114, 358–371. [Google Scholar] [CrossRef]
- Hunt, E.R.; Daughtry, C.S.T. What good are unmanned aircraft systems for agricultural remote sensing and precision agriculture? Int. J. Remote Sens. 2018, 39, 5345–5376. [Google Scholar] [CrossRef] [Green Version]
- Lan, Y.; Deng, X.; Zeng, G. Advances in diagnosis of crop diseases, pests and weeds by UAV remote sensing. Smart Agric. 2019, 1, 1. [Google Scholar]
- Ampatzidis, Y.; Partel, V. UAV-Based High Throughput Phenotyping in Citrus Utilizing Multispectral Imaging and Artificial Intelligence. Remote Sens. 2019, 11, 410. [Google Scholar] [CrossRef] [Green Version]
- Osco, L.P.; Nogueira, K.; Marques Ramos, A.P.; Faita Pinheiro, M.M.; Furuya, D.E.G.; Gonçalves, W.N.; de Castro Jorge, L.A.; Marcato Junior, J.; Dos Santos, J.A. Semantic segmentation of citrus-orchard using deep neural networks and multispectral UAV-based imagery. Precis. Agric. 2021, 22, 1171–1188. [Google Scholar] [CrossRef]
- Yang, B.; Xu, Y. Applications of deep-learning approaches in horticultural research: A review. Hortic. Res. 2021, 8, 123. [Google Scholar] [CrossRef] [PubMed]
- Kattenborn, T.; Leitloff, J.; Schiefer, F.; Hinz, S. Review on Convolutional Neural Networks (CNN) in vegetation remote sensing. ISPRS J. Photogramm. 2021, 173, 24–49. [Google Scholar] [CrossRef]
- Csillik, O.; Cherbini, J.; Johnson, R.; Lyons, A.; Kelly, M. Identification of Citrus Trees from Unmanned Aerial Vehicle Imagery Using Convolutional Neural Networks. Drones 2018, 2, 39. [Google Scholar] [CrossRef] [Green Version]
- Achanta, R.; Shaji, A.; Smith, K.; Lucchi, A.; Fua, P.; Süsstrunk, S. SLIC Superpixels Compared to State-of-the-Art Superpixel Methods. IEEE Trans. Pattern Anal. 2012, 34, 2274–2282. [Google Scholar] [CrossRef] [Green Version]
- Mubin, N.A.; Nadarajoo, E.; Shafri, H.Z.M.; Hamedianfar, A. Young and mature oil palm tree detection and counting using convolutional neural network deep learning method. Int. J. Remote Sens. 2019, 40, 7500–7515. [Google Scholar] [CrossRef]
- Onishi, M.; Ise, T. Explainable identification and mapping of trees using UAV RGB image and deep learning. Sci. Rep. 2021, 11, 903. [Google Scholar] [CrossRef]
- Hafiz, A.M.; Bhat, G.M. A survey on instance segmentation: State of the art. Int. J. Multimed. Inf. Retr. 2020, 9, 171–189. [Google Scholar] [CrossRef]
- Zamboni, P.; Junior, J.M.; Silva, J.D.A.; Miyoshi, G.T.; Matsubara, E.T.; Nogueira, K.; Gonçalves, W.N. Benchmarking Anchor-Based and Anchor-Free State-of-the-Art Deep Learning Methods for Individual Tree Detection in RGB High-Resolution Images. Remote Sens. 2021, 13, 2482. [Google Scholar] [CrossRef]
- Morales, G.; Kemper, G.; Sevillano, G.; Arteaga, D.; Ortega, I.; Telles, J. Automatic Segmentation of Mauritia flexuosa in Unmanned Aerial Vehicle (UAV) Imagery Using Deep Learning. Forests 2018, 9, 736. [Google Scholar] [CrossRef] [Green Version]
- Chen, L.; Zhu, Y.; Papandreou, G.; Schroff, F.; Adam, H. Encoder-Decoder with Atrous Separable Convolution for Semantic Image Segmentation; Ferrari, V., Hebert, M., Sminchisescu, C., Weiss, Y., Eds.; Springer International Publishing: Cham, Switzerland, 2018; pp. 833–851. [Google Scholar]
- He, K.; Gkioxari, G.; Dollár, P.; Girshick, R. Mask R-CNN. In Proceedings of the IEEE International Conference on Computer Vision (ICCV), Venice, Italy, 22–29 October 2017. [Google Scholar]
- Bolya, D.; Zhou, C.; Xiao, F.; Lee, Y.J. YOLACT: Real-time Instance Segmentation. In Proceedings of the IEEE/CVF International Conference on Computer Vision (ICCV), Seoul, Korea, 27 October–2 November 2019. [Google Scholar]
- Wang, X.; Kong, T.; Shen, C.; Jiang, Y.; Li, L. SOLO: Segmenting Objects by Locations. In Proceedings of the Computer Vision—ECCV 2020, Glasgow, UK, 23–28 August 2020; Springer: Cham, Switzerland, 2020. [Google Scholar]
- Chen, H.; Sun, K.; Tian, Z.; Shen, C.; Yan, Y. BlendMask: Top-Down Meets Bottom-Up for Instance Segmentation. In Proceedings of the IEEE/CVF Conference on Computer Vision and Pattern Recognition (CVPR), Seattle, WA, USA, 13–19 June 2020. [Google Scholar]
- Ocer, N.E.; Kaplan, G.; Erdem, F.; Kucuk Matci, D.; Avdan, U. Tree extraction from multi-scale UAV images using Mask R-CNN with FPN. Remote Sens. Lett. 2020, 11, 847–856. [Google Scholar] [CrossRef]
- Akiva, P.; Dana, K.; Oudemans, P.; Mars, M. Finding Berries: Segmentation and Counting of Cranberries using Point Supervision and Shape Priors. In Proceedings of the IEEE/CVF Conference on Computer Vision and Pattern Recognition Workshops, Seattle, WA, USA, 13–19 June 2020. [Google Scholar]
- Marques, P.; Pádua, L.; Adão, T.; Hruška, J.; Peres, E.; Sousa, A.; Sousa, J.J. UAV-Based Automatic Detection and Monitoring of Chestnut Trees. Remote Sens. 2019, 11, 855. [Google Scholar] [CrossRef] [Green Version]
- Dong, X.; Zhang, Z.; Yu, R.; Tian, Q.; Zhu, X. Extraction of Information about Individual Trees from High-Spatial-Resolution UAV-Acquired Images of an Orchard. Remote Sens. 2020, 12, 133. [Google Scholar] [CrossRef] [Green Version]
- Timilsina, S.; Aryal, J.; Kirkpatrick, J.B. Mapping Urban Tree Cover Changes Using Object-Based Convolution Neural Network (OB-CNN). Remote Sens. 2020, 12, 3017. [Google Scholar] [CrossRef]
- Donmez, C.; Villi, O.; Berberoglu, S.; Cilek, A. Computer vision-based citrus tree detection in a cultivated environment using UAV imagery. Comput. Electron. Agric. 2021, 187, 106273. [Google Scholar] [CrossRef]
- Modica, G.; Messina, G.; de Luca, G.; Fiozzo, V.; Praticò, S. Monitoring the vegetation vigor in heterogeneous citrus and olive orchards. A multiscale object-based approach to extract trees’ crowns from UAV multispectral imagery. Comput. Electron. Agric. 2020, 175, 105500. [Google Scholar] [CrossRef]
- Osco, L.P.; Arruda, M.D.S.D.; Marcato Junior, J.; da Silva, N.B.; Ramos, A.P.M.; Moryia, É.A.S.; Imai, N.N.; Pereira, D.R.; Creste, J.E.; Matsubara, E.T.; et al. A convolutional neural network approach for counting and geolocating citrus-trees in UAV multispectral imagery. ISPRS J. Photogramm. 2020, 160, 97–106. [Google Scholar] [CrossRef]
- Chen, Y.; Hou, C.; Tang, Y.; Zhuang, J.; Lin, J.; He, Y.; Guo, Q.; Zhong, Z.; Lei, H.; Luo, S. Citrus Tree Segmentation from UAV Images Based on Monocular Machine Vision in a Natural Orchard Environment. Sensors 2019, 19, 5558. [Google Scholar] [CrossRef] [Green Version]
- Epperson, M. Empowering Conservation through Deep Convolutional Neural Networks and Unmanned Aerial Systems; University of California: San Diego, CA, USA, 2018. [Google Scholar]
- Xiong, J.; Liu, B.; Zhong, Z.; Chen, S.; Zheng, Z. Litchi Flower and Leaf Segmentation and Recognition Based on Deep Semantic Segmentation. Trans. Chin. Soc. Agric. Mach. 2021, 52, 252–258. [Google Scholar]
- Peng, H.; Xue, C.; Shao, Y.; Chen, K.; Xiong, J.; Xie, Z.; Zhang, L. Semantic Segmentation of Litchi Branches Using DeepLabV3+ Model. IEEE Access 2020, 8, 164546–164555. [Google Scholar] [CrossRef]
- Sun, C.; Shrivastava, A.; Singh, S.; Gupta, A. Revisiting Unreasonable Effectiveness of Data in Deep Learning Era. In Proceedings of the 2017 IEEE International Conference on Computer Vision (ICCV), Venice, Italy, 22–29 October 2017. [Google Scholar]
- Deng, X.; Tong, Z.; Lan, Y.; Huang, Z. Detection and Location of Dead Trees with Pine Wilt Disease Based on Deep Learning and UAV Remote Sensing. AgriEngineering 2020, 2, 294–307. [Google Scholar] [CrossRef]
- He, K.; Zhang, X.; Ren, S.; Sun, J. Deep Residual Learning for Image Recognition. In Proceedings of the 2016 IEEE Conference on Computer Vision and Pattern Recognition (CVPR), Las Vegas, NV, USA, 26 June–1 July 2016. [Google Scholar]
- Lin, T.Y.; Dollar, P.; Girshick, R.; He, K.; Hariharan, B.; Belongie, S. Feature Pyramid Networks for Object Detection. In Proceedings of the 2017 IEEE Conference on Computer Vision and Pattern Recognition (CVPR), Honolulu, HI, USA, 21–26 July 2017. [Google Scholar]
- Lin, T.Y.; Maire, M.; Belongie, S.; Hays, J.; Zitnick, C.L. Microsoft COCO: Common Objects in Context; Springer International Publishing: Cham, Switzerland, 2014. [Google Scholar]
- Li, X.; Orchard, M.T. New Edge-Directed Interpolation. IEEE Trans. Image Process. 2001, 10, 1521–1527. [Google Scholar] [PubMed] [Green Version]
- Etten, A.V. You Only Look Twice: Rapid Multi-Scale Object Detection in Satellite Imagery. arXiv 2018, arXiv:1805.09512. [Google Scholar]
- Jia, D.; Wei, D.; Socher, R.; Li, L.J.; Kai, L.; Li, F.F. ImageNet: A large-scale hierarchical image database. In Proceedings of the IEEE Computer Vision & Pattern Recognition, Miami, FL, USA, 20–25 June 2009; pp. 248–255. [Google Scholar]
- Liu, W.; Anguelov, D.; Erhan, D.; Szegedy, C.; Reed, S.; Fu, C.Y.; Berg, A.C. SSD: Single Shot MultiBox Detector. In Proceedings of the European Conference on Computer Vision, Amsterdam, The Netherlands, 11–14 October 2016. [Google Scholar]


Publisher’s Note: MDPI stays neutral with regard to jurisdictional claims in published maps and institutional affiliations. |
© 2021 by the authors. Licensee MDPI, Basel, Switzerland. This article is an open access article distributed under the terms and conditions of the Creative Commons Attribution (CC BY) license (https://creativecommons.org/licenses/by/4.0/).