Article

Long-Term Variation Assessment of Aerosol Load and Dominant Types over Asia for Air Quality Studies Using Multi-Sources Aerosol Datasets

1
Key Laboratory of Aerospace Thermophysics, Harbin Institute of Technology, Ministry of Industry and Information Technology, Harbin 150001, China
2
School of Urban Construction, Wuhan University of Science and Technology, Wuhan 430065, China
3
School of Energy Science and Engineering, Harbin Institute of Technology, Harbin 150001, China
*
Author to whom correspondence should be addressed.
Remote Sens. 2021, 13(16), 3116; https://doi.org/10.3390/rs13163116
Submission received: 15 June 2021 / Revised: 25 July 2021 / Accepted: 4 August 2021 / Published: 6 August 2021
(This article belongs to the Special Issue Multi Sensor Data Integration for Atmospheric Composition Analysis)

Abstract

:
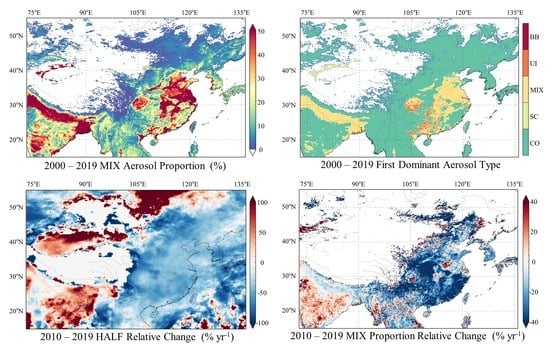
Long-term (2000–2019) assessment of aerosol loads and dominant aerosol types at spatiotemporal scales using multi-source datasets can provide a strong impetus to the investigation of aerosol loads and to the targeted prevention control of atmospheric pollution in densely populated regions with frequent anthropogenic activities and heavy aerosol emissions. This study uses multi-source aerosol datasets, including Modern-Era Retrospective Analysis for Research and Applications version 2 (MERRA-2), Moderate Resolution Imaging Spectroradiometer (MODIS), and Aerosol Robotic Network (AERONET), to conduct a long-term variation assessment of aerosol load, high aerosol load frequency, and dominant aerosol types over Asia. The results indicate that regional aerosol type information with adequate spatial resolution can be combined with aerosol optical depth (AOD) values and heavy aerosol load frequency characterization results to explore the key contributors to air pollution. During the study period, the aerosol load over the North China Plain, Central China, Yangtze River Delta, Red River Delta, Sichuan Basin, and Pearl River Delta exhibited an increasing trend from 2000–2009 due to a sharp rise in aerosol emissions with economic development and a declining trend from 2010–2019 under stricter energy conservation controls and emissions reductions. The growth of urban/industrial (UI) type and biomass burning (BB) type aerosol emissions hindered the improvement of the atmospheric environment. Therefore, in future pollution mitigation efforts, focus should be on the control of UI-type and BB-type aerosol emissions. The Indus–Ganges River Plain, Deccan Plateau, and Eastern Ghats show a continuously increasing trend; however, the aerosol load growth rate of the last decade was lower than that of the first decade, which was mainly due to the decrease in the proportion of the mixed type aerosols.

Graphical Abstract

1. Introduction

Aerosols, originating from anthropogenic and natural sources, have significant effects on the radiative budget of the earth-atmospheric system, climate change, atmospheric environment, and human health, especially in densely populated regions with frequent anthropogenic activities and heavy aerosol emissions (e.g., East Asia, South Asia, and Southeast Asia) [1,2,3,4,5]. However, examining the effects of aerosols effect through their properties poses great challenges because they exhibit short atmospheric lifetimes and strong spatiotemporal heterogeneity. Research on aerosol effects based on aerosol properties, which are obtained from regional and long-term aerosol remote sensing observations using satellite/ground-based platform sensors, is an effective solution pattern for the challenges [6,7].
Observations of aerosol properties, which have been derived with high accuracy and temporal resolutions by ground-based measurement networks (e.g., Chinese Aerosol Network (CARSNET), Sun-Sky Radiometer Observation Network (SONET), and Aerosol Robotic Network (AERONET)), are widely used in the research on aerosol load and satellite aerosol product validation [8,9,10,11,12]. Limited to point locations, ground-based instruments can only support research at the local scale. Satellite sensors such as Moderate Resolution Imaging Spectroradiometer (MODIS), Advanced Himawari Imager (AHI), Ozone Monitoring Instrument (OMI), and Multi-angle Imaging Spectroradiometer (MISR) can provide continuous spatial aerosol property observations, which greatly aid the research of the aerosol effect on the global atmospheric environment and air quality, especially in areas with heavy aerosol loads (e.g., the Indo-Gangetic Plains [IGP] and the North China Plain [NCP]) [13,14,15,16,17,18,19]. However, there are evident differences in the accuracy and applicability of each satellite aerosol product owing to the different retrieval algorithms and spatiotemporal resolutions. These differences directly affect aerosol research based on remote sensing observations; thus, a single remote sensing platform is not sufficient to accurately and effectively characterize the variations in aerosol properties.
Collaborative analysis using multi-source remote sensing datasets was gradually promoted to reduce the analysis bias caused by the difference between satellite aerosol products [6,20,21,22]. Previous studies using multi-source datasets have focused on aspects such as the calculation of aerosol optical depth (AOD) under multiple temporal scales, validation of dataset accuracy, and correlation verification between datasets [16,23,24,25,26,27]. Meanwhile, heavy aerosol load frequency (HALF) has rarely been studied [28]. HALF means occurrence number of the cases with AOD values higher than a specific threshold during a period. The applicability of HALF is higher than that of AOD, with regard to capturing the variation in atmospheric pollution state. For example, two areas with the same average AOD in the same period may have different aerosol load, a low-frequency heavy pollution weather may occur in one of the areas, while a high-frequency low-pollution weather could be recorded in another area. The HALF can effectively capture the atmospheric pollution state difference mentioned above.
Combining large-scale HALF information with AOD observations and aerosol types information can comprehensively and effectively characterize the spatiotemporal distribution and variation of aerosol load, thereby enabling further exploration of high pollution incidents. Large-scale HALF studies need continuous spatial and high temporal resolution aerosol characteristics information. In the existing remote sensing platforms, the ground measurement network is unable to support the acquisition demand of large-scale HALF, and satellite platforms will underestimate the HALF. As the retrievals of satellite platforms are performed only under cloud-free conditions, the platforms cannot provide aerosol observation data covering the whole year. Thus, there is a possibility of missing the statistic of some heavy aerosol load events and further underestimating HALF. For geostationary sensors with high temporal resolution (e.g., Himawari), they also have some common limitations as other satellite-based sensors. The high temporal resolution characteristic will greatly reduce the underestimation degree of HALF, but this underestimation cannot be avoided. Assimilating a variety of aerosol datasets from different remote sensing platforms (MODIS, MISR, AERONET), the Modern-Era Retrospective Analysis for Research and Applications version 2 (MERRA-2) was generated by the NASA Global Modeling-Assimilation Office (GMAO) [29,30,31]. The latest MERRA-2 dataset contains global aerosol characteristics on an hourly scale, which provides great support for the precise acquisition of regional HALF [32,33,34].
Aerosol type information can be obtained from aerosol identification models based on aerosol characteristics [35,36,37,38,39]. AERONET provides diverse, accurate, and high temporal resolution aerosol characteristics observations (AOD; Angstrom Exponent, AE; Single Scattering Albedo, SSA; Absorption Angstrom Exponent, AAE; Extinction Angstrom Exponent, EAE), and the observations are widely used to support aerosol identification work. In recent years, satellite datasets have been gradually used in aerosol recognition, including multi-angle observations of atmospheric aerosol provided by MISR to extract aerosol type information (e.g., size, absorbing versus non- absorbing and shape) [19,40]. Some reliable satellite-based identification models (e.g., AOD vs. aerosol relative optical depth [AROD]) have been developed to obtain aerosol types information with adequate spatial resolution and high coverage [41,42].
In this study, long-term (2000–2019) aerosol datasets (AERONET, MODIS, and MERRA-2) were used to conduct the variation assessment of aerosol load and dominant aerosol types over Asia. The usability of spatial datasets (MODIS and MERRA-2) was assessed at regional and site scales using ground-based aerosol measurements. To assess the usability of MERRA-2 AODs and HALFs in this study, moreover, correlation and difference analyses of the spatial datasets were carried out, and spatiotemporal distribution and variation of AOD and HALF were calculated based on the three datasets (Section 3). Finally, we classified the aerosol types over the study region using the identification model and aerosol optical properties provided by MODIS dataset. Further, we obtained spatial aerosol type information through AROD-based model and MODIS data, including different aerosol proportions, dominant aerosol types, and the temporal variation of pollution aerosols (Section 4). The results of AOD, HALF, and aerosol types presented in this work can be used to explore the key factors of atmospheric pollution and provide a basis for targeted prevention and control of pollution sources.

2. Data and Methodology

2.1. Study Region

In this study, a part of Asia was selected as the focus of the study, with latitude and longitude ranging from 73° to 136°E and 15° to 55°N, respectively, as shown in Figure 1. According to the population density (Figure 1), altitude (Figure S1), and surface type, the study region was divided into five geographical regions, namely, south-west, north-west, south, center, and east (Figure 1). The study region includes the most densely populated areas of the North China Plain (NCP), Yangtze River Delta (YRD), Pearl River Delta (PRD), Red River Delta (RRD), and Indus–Ganges River Plain (IGP), as well as the Taklimakan Desert, one of the major dust sources in East Asia [31]. Global population density data were obtained from the NASA Socioeconomic Data and Applications Center (SEDAC, https://sedac.ciesin.columbia.edu/; accessed on 1 December 2020).

2.2. Data

2.2.1. MERRA-2

MERRA-2 is a new generation of atmospheric reanalysis data released by NASA’s Global Modeling and Assimilation Office (GMAO). Compared to the first version of the data, MERRA-2 uses the latest Goddard Earth Observing System, Version 5 (GEO-5) data assimilation system, which updates the model and global statistical interpolation (GSI). The MERRA-2 data have 576 and 361 grid points in the longitudinal and latitudinal directions, respectively, with a spatial resolution of 0.625° × 0.5°. Covering the period from 1980 to the present, it contains 21 categories of products, such as atmospheric aerosols, radiation, temperature, water vapor, and precipitation [43,44].
This study used hourly MERRA-2 AOD550 and AE470-870 data for two decades (2000–2019) over Asia; all the data were downloaded from the Goddard Earth Science Data and Information Services Center (GES-DISC, http://disc.sci.gsfc.nasa.gov; accessed on 1 December 2020).

2.2.2. MODIS

MODIS sensor on board the Terra/Aqua satellite provides global aerosol observations. The AOD data in MODIS aerosol products are based on two inversion algorithms, namely the dark target (DT) and the deep blue (DB) algorithms. The former can effectively retrieve AOD data in areas with low surface albedo, such as dense vegetation cover, but not in areas with high surface albedo, such as the Gobi Desert; in those areas the DB algorithm is used [45,46]. The DT AOD products with 3-km resolution were added to the C6 Level 2 aerosol products. The latest Terra 3 km DT AOD data from 2000–2019, collected from Level 1 and the Atmosphere Archive and Distribution System (LAADS, http://ladswebnascomnasagov/data/searchhtml; accessed on 1 December 2020), were chosen for the study.

2.2.3. AERONET

AERONET is a global ground-based multi-band solar photometric remote sensing aerosol observation network established jointly by NASA and Centre national de la recherché scientifique (CNRS) and is capable of providing global aerosol observations with high resolution. The AERONET provides observations with three quality levels, namely unscreened (level 1.0), quality control (level 1.5), and quality assurance (level 2.0) where level 1.0 data are not cloud filtered and finally calibrated, level 1.5 data are cloud filtered but not finally calibrated, and level 2.0 data are cloud processed and front/back field of view corrected. Hence, the level 2.0 data have a guaranteed data quality and a high accuracy.
The level 2.0 aerosol optical depth and angstrom index of 75 sites located in the study region during 2000–2019 were collected from the AERONET portal (https://aeronet.gsfc.nasa.gov; accessed on 1 December 2020) and used. The geographic information of the AERONET sites used in this study is shown in Figure 1 and listed in Table S1.

2.3. Methodology

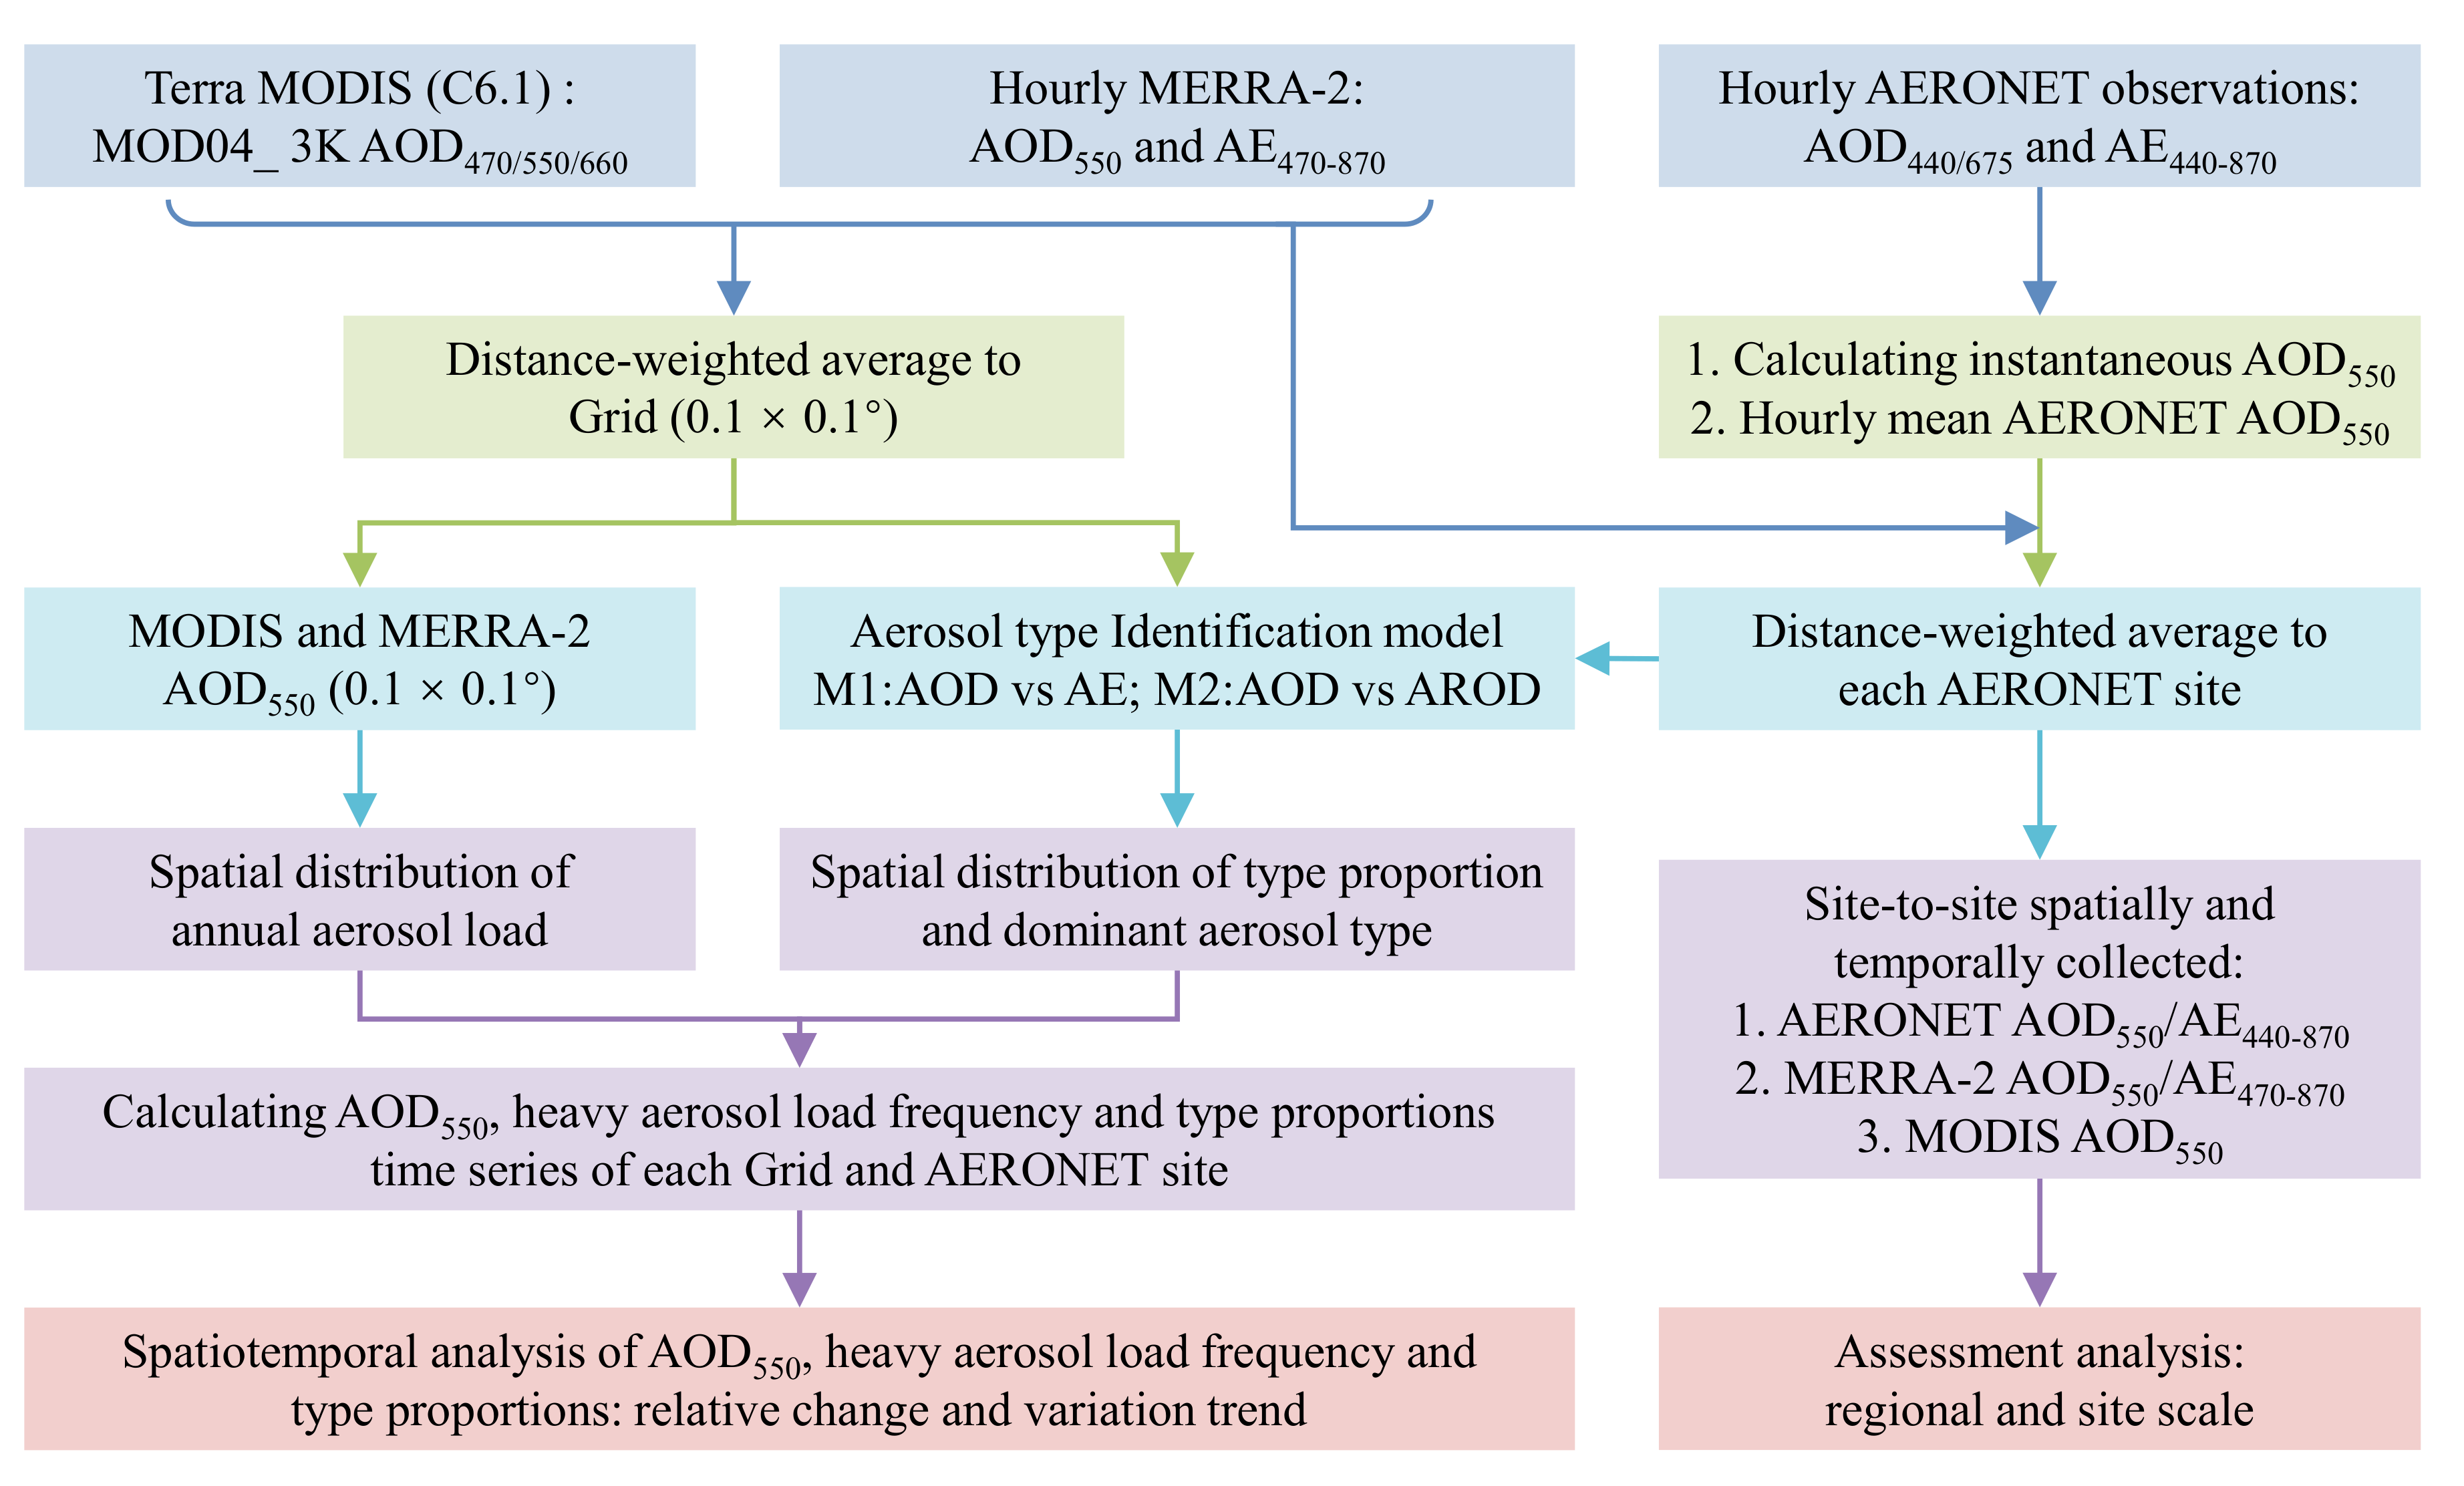
The research is based on the following three steps: (1) Usability assessment of the MERRA-2/MODIS AODs and HALFs; (2) the relative change and variation trend of the annual average AOD value and heavy aerosol load frequency; and (3) dominant aerosol type identification through MODIS dataset and AROD-based model, and suitability assessment of aerosol type identification obtained by MERRA-2 outputs combined with AE-based model. The overall research process is illustrated in Figure 2.

2.3.1. Spatial Distribution of AOD Datasets

Usability assessment of MERRA-2 and MODIS aerosol products was performed using AERONET data. First, the three datasets were temporally and spatially matched. By “temporally,” we mean that MODIS only provides AOD data at the time of satellite transit. AERONET and MERRA-2 data for one hour before and after the satellite transit time were chosen to match the MODIS data. The AERONET site was used as a reference. The data of the four grid points closest to the site and the data within a range of 0.1° around the site were selected to calculate the MERRA-2 and MODIS data corresponding to the base station point based on the weighted average method (Equation (1)).
A O D φ = k = 1 n A O D d a t a s e t k ( 1 / r k ) 2 / k = 1 n ( 1 / r k ) 2
where r represents the distance between the sampling point and the grid point, and n represents the number of sampling points in the effective radius.
AERONET does not provide AOD data at 550 nm (AOD550), and the ground-based AOD550 was calculated using data from neighboring bands (440 and 675 nm), as well as Equation (2). The accuracy of the MERRA-2 and MODIS aerosol products was characterized using statistical indicators, including valid data quantity (N), the correlation coefficient (R, Equation (3)), root-mean-square error (RMSE, Equation (4)), relative mean bias (RMB, Equation (5)), mean absolute error (MAE, Equation (6)), and expected error (EE, Equation (7)) [13,47].
τ ( λ ) = β λ α
R = i = 1 n ( A O D d a t a s e t , i A O D ¯ d a t a s e t ) ( A O D A E R O N E T , i A O D ¯ A E R O N E T ) i = 1 n ( A O D d a t a s e t , i A O D ¯ d a t a s e t ) 2 ( A O D A E R O N E T , i A O D ¯ A E R O N E T ) 2
R M S E = 1 n i = 1 n ( A O D d a t a s e t , i A O D A E R O N E T , i ) 2
R M B = A O D ¯ d a t a s e t / A O D ¯ A E R O N E T
M A E = 1 n i = 1 n A O D d a t a s e t , i A O D A E R O N E T , i
E E = ± ( a + b × A O D A E R O N E T )
where τ λ represents the AOD value at the wavelength λ , α is the Angstrom Exponent, and β is the turbidity coefficient. In this work, the wavelength pair for AE is 440 and 870 nm. A O D d a t a s e t s , i and A O D A E R O N E T , i denote the dataset (MERRA-2 or MODIS) and AERONET AOD value on day i , A O D ¯ d a t a s e t s and A O D ¯ A E R O N E T denote the average dataset (MERRA-2 or MODIS) and AERONET-AOD values during the study period. The a and b of EE recommended by Levy are 0.05 and 0.15, respectively [15].
Spatial resampling of the MERRA-2 and MODIS datasets is required before carrying out the spatial distribution study of AOD. The datasets were resampled to a resolution of 0.1° using the weighted average method, and the search diameters of MERRA-2 and MODIS were 1° and 0.2°, respectively. The correlation coefficients between MERRA-2 and MODIS are calculated at each grid after spatial resample. To ensure the accuracy of correlation coefficients, the amount of valid data at each grid point needs to be ensured, and only grids with 100% of the annual mean AOD data were included in the calculation. Using the resampled datasets, the annual/seasonal mean AOD values, correlation coefficients, and differences were plotted to characterize the spatial distribution of aerosol loads as well as the similarities and differences between the two datasets. Moreover, a year were divided into four seasons, March-April-May (MAM), June-July-August (JJA), September-October-November (SON), and December-January-February (DJF).

2.3.2. Temporal Analysis of AOD and Heavy Load

The cases with AOD values higher than one are denoted as heavy aerosol loads. The temporal variation analysis of AOD and heavy aerosol load includes the relative change and variation trend. The relative changes were calculated using Equation (9). The variation trend was calculated using least-squares linear regression (Equation (8)), and the significance assessment of variation trend calculation was carried out based on Student’s t-test. The resampled (0.1° × 0.1°) MERRA-2/MODIS AOD datasets were used for the temporal analysis. The grid points were screened to ensure temporal analysis accuracy, and the screening method was the same as that chosen for the correlation coefficient calculation of the dataset (Section 2.3.1). In addition, five sub-regions were selected within the study area: the NCP (A), Korean Peninsula (B), Taiwan Island of China (C), RRD and its southern region (D), and IGP area (E); and the three datasets (MERRA-2, MODIS, and AERONET) within each sub-region were compared and analyzed. The coordinate information of the sub region is listed in Table S2. Among the five sub-regions, regions A, D, and E have heavy aerosol loads, which are higher than that of regions B and C.
V a r i a t i o n   t r e n d = i = 1 n Y e a r i A O D i i = 1 n Y e a r i i = 1 n A O D i / n i = 1 n Y e a r i 2 ( i = 1 n Y e a r i ) 2 / n
R e l a t i v e   c h a n g e = A v e r a g e   A O D ( 2000 2009 ) A v e r a g e   A O D ( 2010 2019 ) A v e r a g e   A O D ( 2000 2009 )
where y e a r i starts from 2000–2019, A O D i represents the average AOD in year i.

2.3.3. Aerosol Identification

In this study, dominant aerosol types and temporal variations of different types were determined using MERRA-2 (AOD550, AE470-870) and MODIS (AOD470, AOD660) datasets. The identification models selected in this work were AE-based model (AOD550 vs. AE470-870) and AROD-based model (AOD470 vs. AROD660/470). The AE-based model can recognize clean marine (CM), dust (DD), mixed (MIX), continental clean (CC), and biomass burning/urban industry (BB/UI) [32].
AROD denotes the ratio of AOD at two wavelengths, the parameter alters with the aerosol types. AROD660/470 is defined as follows:
AROD 660 / 470 = AOD 660 / AOD 470
where AOD470 and AOD660 are the AOD values at wavelengths of 470 and 660 nm.
The AROD-based identification model requires only two bands of AOD data to identify the aerosol types, and can effectively recognize aerosol types using continuous spatial observation (e.g., MODIS datasets). AROD-based identification model is suitable for MODIS AOD bands, the feasibility and accuracy of the method combining AROD model and MODIS AOD have been verified. The bias of aerosol type identification results generated by AROD model is mainly caused by satellite observation errors. MODIS will over/underestimate the real AOD values. The difference of over/underestimation degree in two wavelength bands has impact on the AROD calculation, and influences the final aerosol recognition results [41]. The AROD-based model can classify five aerosol types, including continental (CO), desert dust (DD), mixed (MIX), urban industrial (UI), and biomass burning (BB). The threshold division of the identification model is shown in Figure S2.

3. Long-Term Variation Assessment of Aerosol Load

In this section, the results of the spatiotemporal distributions, relative change, and variation trend of aerosol loads and types are presented, including the following: (1) The usability assessment and spatial distribution of MERRA-2 and MODIS AOD data, and a comparison between the two datasets (Section 3.1); and (2) relative change and variation trend of the AOD load and high aerosol load frequency (Section 3.2).

3.1. Spatial Distribution of MERRA-2/MODIS AOD

Accuracy validation was carried out at the regional and site scales. Figure 3 shows the regional usability assessment results of the MERRA-2 and MODIS AOD data in the study region. In the figure, MODIS data are closer to the ground observation than MERRA-2, and the data error (RMSE/MAE) is smaller. However, MERRA-2 provides 1.6 times more valid data than MODIS. This is because MERRA-2 has a higher spatiotemporal integrity than MODIS, the former can provide global aerosol characteristics every day, while the latter will fail to provide aerosol characteristics under some conditions (e.g., clouds and heavy aerosol [15]). For the EE, the proportion of data points falling within the EE envelope was 61.60% for MERRA-2, which was higher than that of MODIS (58.25%). The two datasets show opposite overestimation/underestimation phenomena: MODIS shows a clear overestimation with 35.76% of data points falling above the EE envelope; in contrast, MERRA-2 is biased to underestimate the true AOD value with 22.90% of data points falling below the EE envelope, and this underestimation becomes more pronounced as the AOD value increases. Figure 3c shows that MERRA-2 AOD is closer to AERONET AOD than that of MODIS under medium/low aerosol load (AOD550 < 0.6). Compared to MERRA-2, the advantage of MODIS dataset lies in heavy load condition. The difference between MERRA2 and AERONET AOD increases significantly with the aerosol load, while for MODIS the difference is more stable.
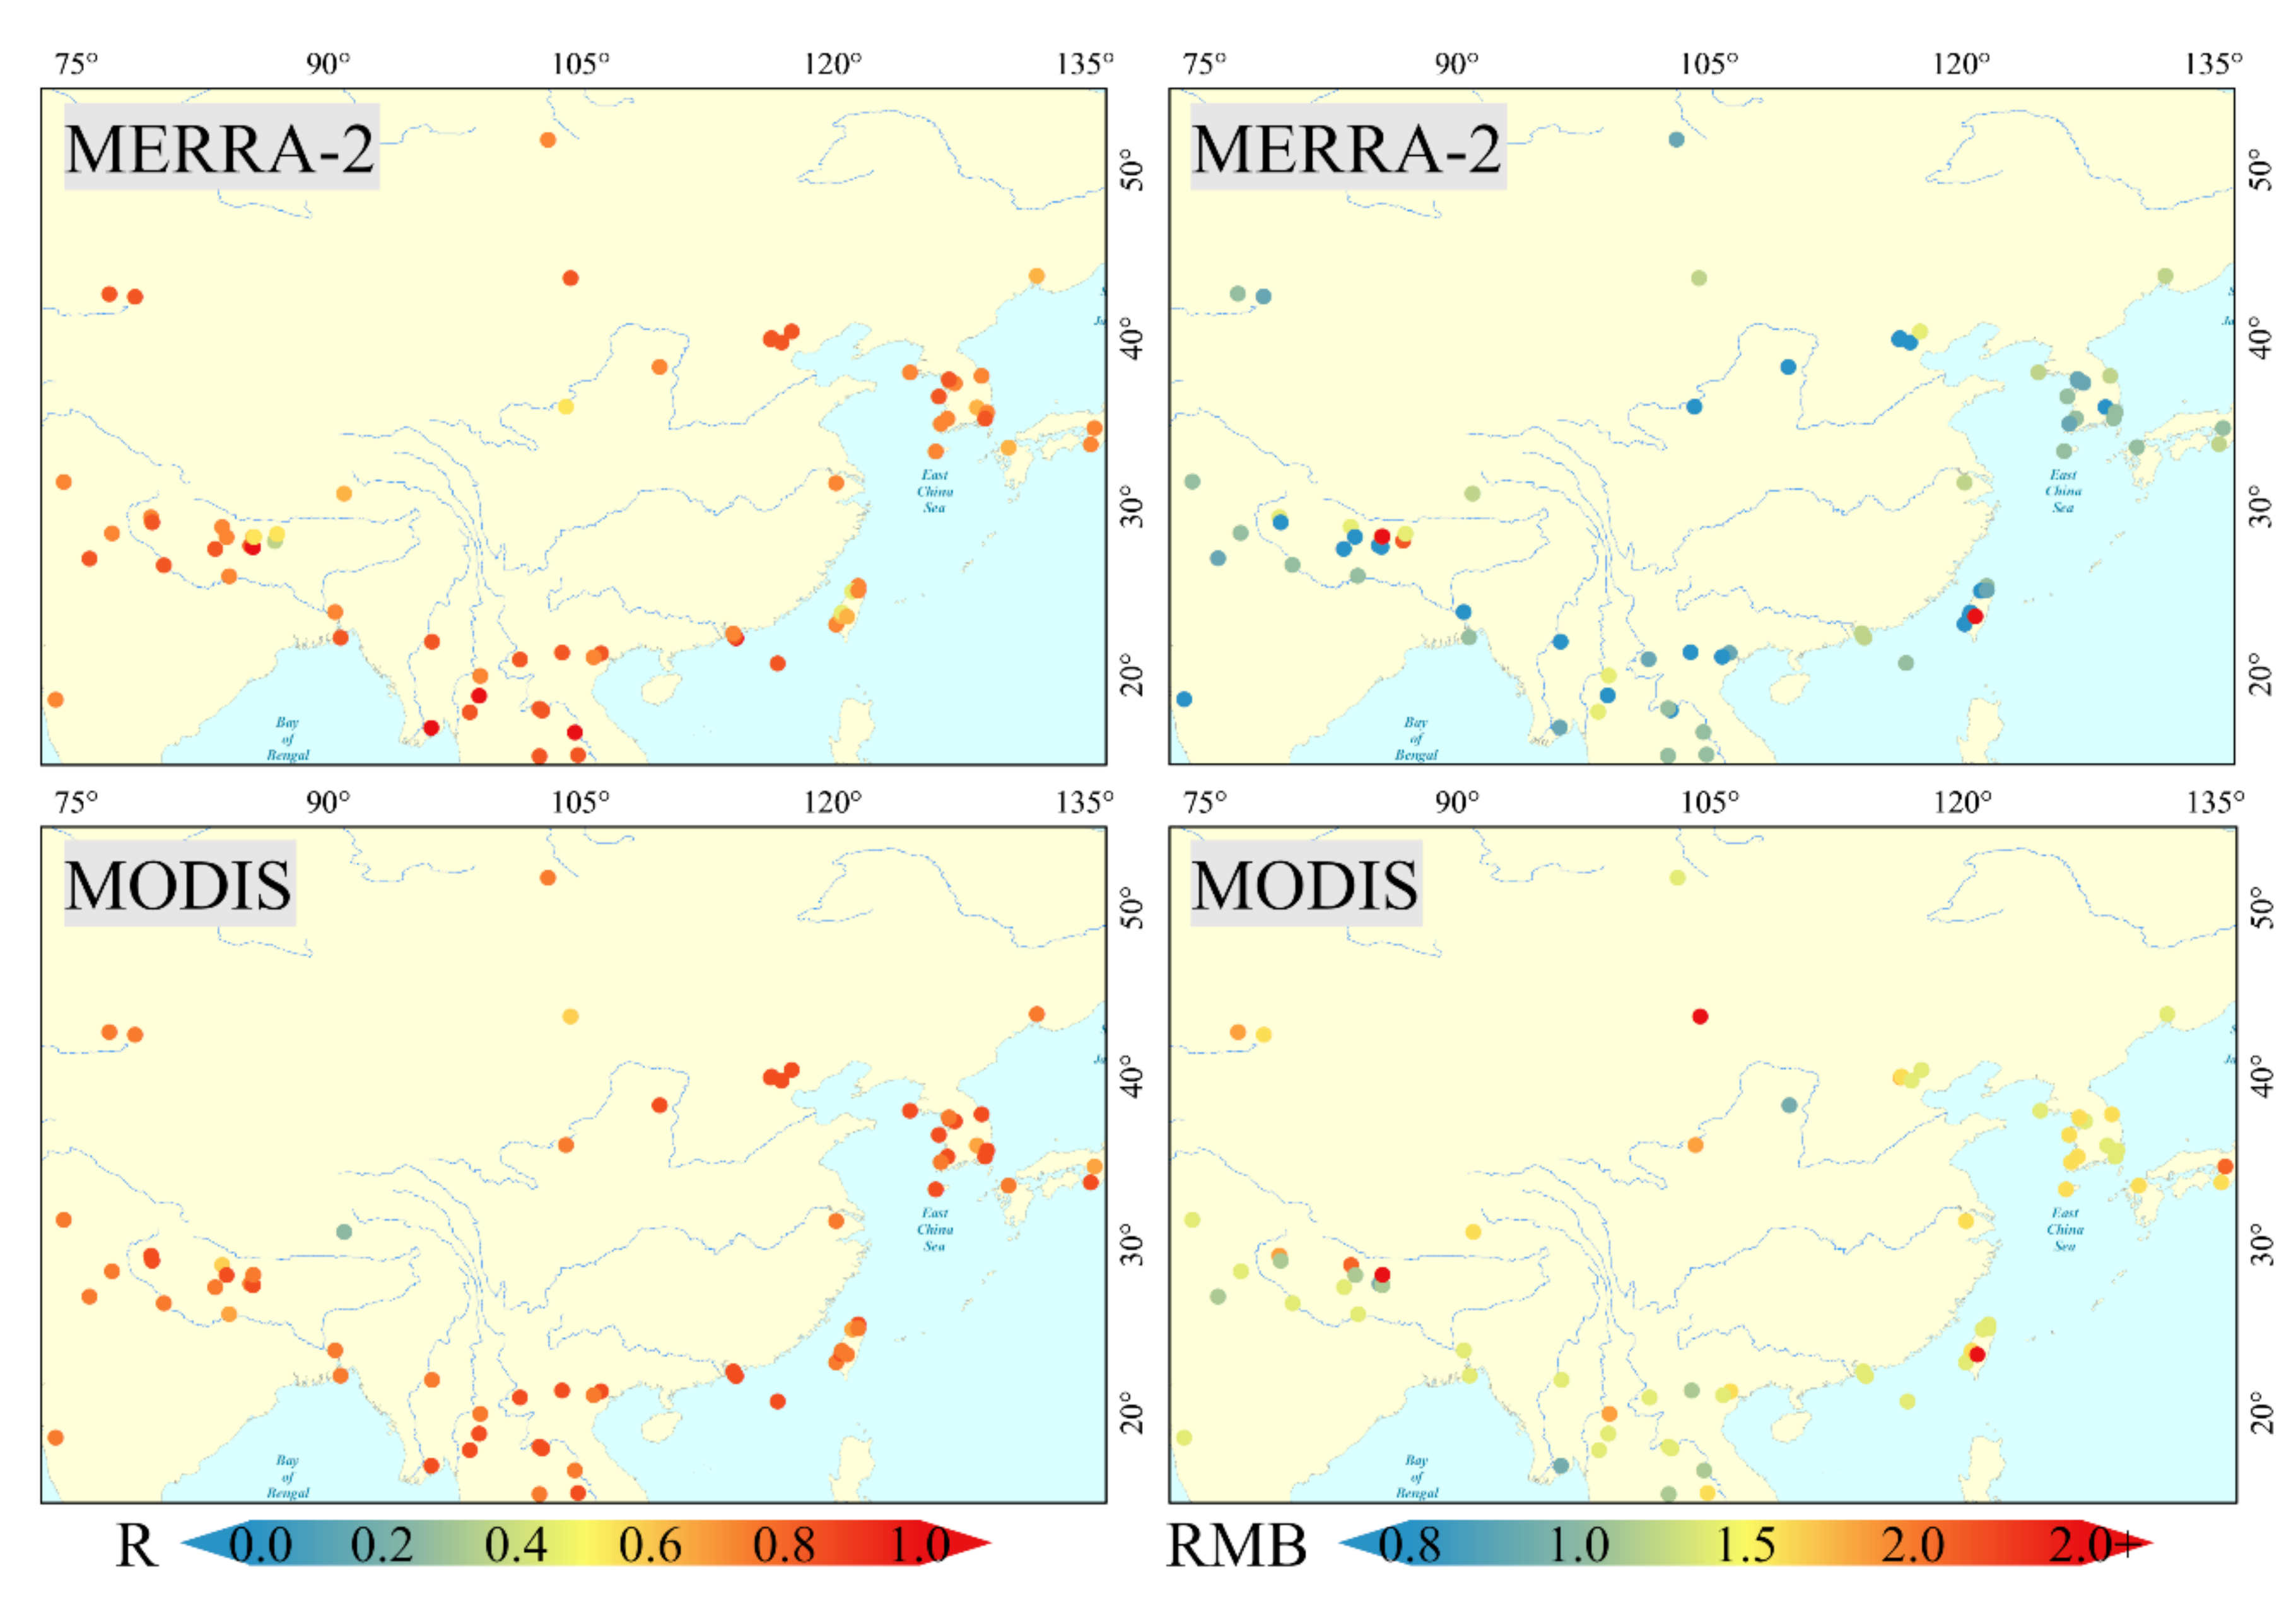
Figure 4 gives the results of two statistical indicators (R and RMB) at the site scale. The R calculations of MODIS are better than MERRA-2 for most sites and the advantage is more significant in some areas. In NCP, for example, the average value of R for three MODIS sites was 0.94, while that of MERRA-2 was only 0.84. For some sites at higher altitudes, the R results of MERRA-2 were noticeably better than that of MODIS. In NAM_CO site (Table S1) (altitudes: 4746 m), the R values of MERRA-2 and MODIS were 0.23 and 0.66, respectively, with a difference of 0.43. The RMB values of MODIS were mostly higher than one accounting for 85% of the total sites. The opposite was found in MERRA-2, where 72% of the sites had RMB values less than one and the remaining sites that had RMB values greater than 1 were mostly located at high altitudes. The results of the remaining statistical indicators (N, RMSE, MASE, and EE) are shown in Figures S3 and S4. For N values, the MERRA-2 dataset was superior, with higher N values than MODIS at most site scales, and this is mostly due to the difference in the spatiotemporal integrity. In contrast to N values, MODIS performs better than MERRA-2 for RMSE and MAE, especially in heavily polluted areas such as the NCP, the IGP. This is because MODIS AOD is closer to AERONET AOD under high aerosol load (as shown in Figure 3). The performance of the two datasets was contrary for EE values; this phenomenon was more pronounced at sites located in heavily polluted areas. Taking the XiangHe site as an example, the percentage of MODIS data points falling above, at the middle of, or below the EE envelop are 36.99%, 60.72%, 2.29%, respectively, while those of MERRA-2 results are 12.75%, 52.07%, 35.18%, respectively.
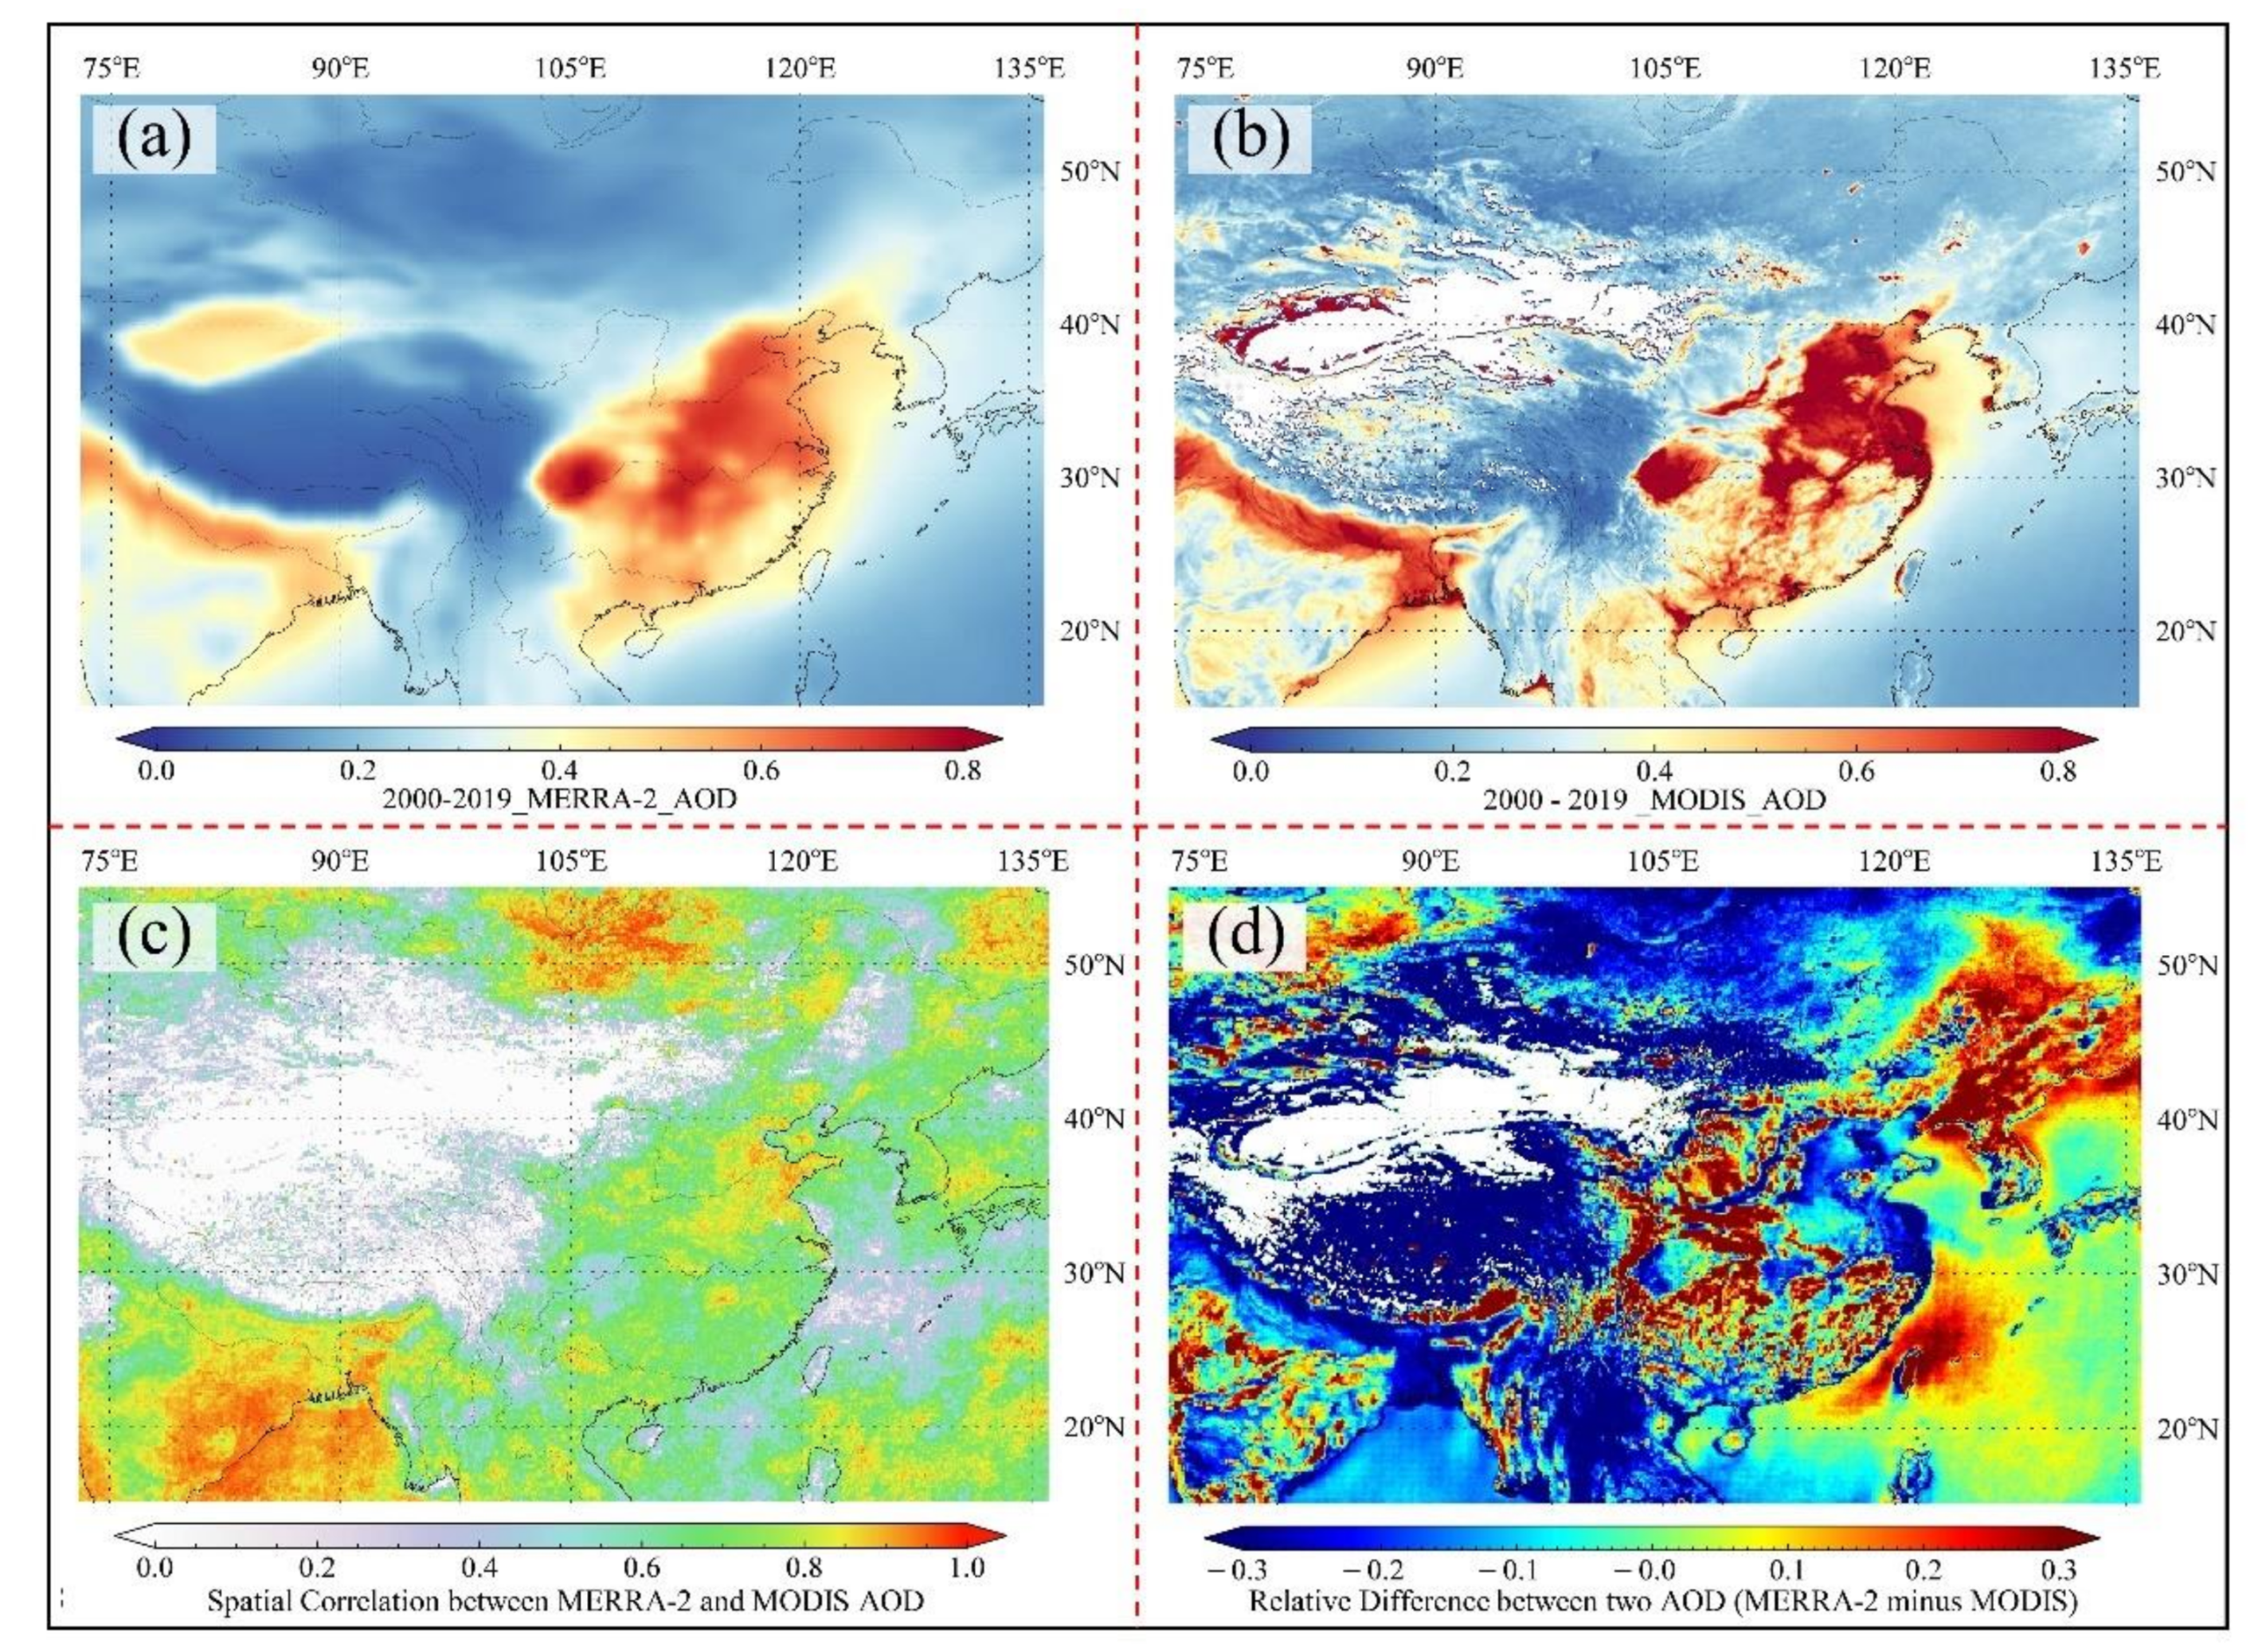
Figure 5 shows the annual spatial distribution of AOD data, correlations, and relative differences provided by the two datasets. The two AOD data show similar spatial variation patterns, and high value areas are distributed in the NCP, YRD, PRD, Sichuan Basin, RRD, and IGP, but the MODIS AOD values are significantly higher than the MERRA-2 AOD values. Dense population and high frequency of human activities (agricultural fires, industry, traffic), surface emissions, and changes in recent years in these areas are the main contributors to the high aerosol load. In addition, MERRA-2 has high AOD values in areas of the Taklimakan Desert, which is mainly caused by natural factors (sand and dust) [31]. Due to the inversion algorithm, the selected 3 km DT MODIS aerosol product cannot provide AOD data for areas with high surface albedo (deserts like the Gobi Desert); moreover, there are missing data for northwestern China and parts of the Tibetan Plateau [46]. Figure 5 shows that there is a good correlation between the two datasets. The R-values of most grid points are higher than 0.7, and the R-values of NCP, IGP, East Ghats, Bay of Bengal, and northern Mongolian Plateau are close to 0.9. On the other hand, the relative differences between the two datasets are large, in which the MODIS AOD values are greater than the MERRA-2 AOD values in the NCP, IGP area, Eastern Ghats, Bay of Bengal, and the northern part of the Mongolian Plateau, while the opposite is true in the Northeast Plain and around the Sichuan Basin.
The results of the seasonal scale calculations and correlation significance analyses are shown in Figures S5 and S6, respectively. The seasonal patterns of the spatial distribution of the two AOD datasets were the same, with the aerosol load peaking during JJA, then gradually decreasing, and rebounding in March, April, and May (MAM). There were evident spatiotemporal fluctuations in the correlation coefficients between the datasets. In the NCP, the seasonal variation pattern of the correlation coefficients was similar to that of the AOD data, with the highest correlation between the two datasets in JJA. On the contrary, the R-values were higher during all seasons except JJA over the IGP area, Eastern Ghats, and Bay of Bengal. Seasonal fluctuations in the relative differences were also pronounced. In MAM, the MERRA-2 AOD values were higher than MODIS AOD values in the study region, especially in the Northeast Plain and around the Sichuan Basin. In contrast, the situation was significantly reversed in JJA, with MODIS AOD values generally higher than in areas with MERRA-2 AOD values greater than 0.5.

3.2. Temporal Variation of Aerosol Load

This section presents the calculated results of relative change and variation trend of the aerosol load (annual average AOD values and heavy load frequency) from MERRA-2 and MODIS at each grid point, as well as a comparative temporal variation analysis of the three datasets over the five sub-regions. The results are divided into two parts based on the time scale as calculated results from 2000–2009 and 2010–2019.
Spatial distributions of the temporal variation of the annual/seasonal mean MERRA-2/MODIS AOD values over the study region were shown in Figures S7–S9. The aerosol load in the study region from 2000 to 2019 showed significant fluctuations, with high load areas in the center region (including the NCP, the Sichuan Basin, the PRD, and the YRD) showing an upward convex parabolic pattern of rising and then falling. The overall temporal variation of regional aerosol load is consistent with the environmental policy and regulation change in China. The aerosol load rose rapidly and remained at a high-level owing to the increasing aerosol emissions from economic development and urban industry energy demands during the first decade. The growth in energy demand has led to stricter energy conservation and emission reduction policies, which are key factors in the declining trend (2010–2019). The MODIS data show that the annual average AOD over the above areas in 2019 was lower than that in 2000, but relatively closer in MERRA-2 AOD values. The aerosol load in the South-West region (especially the IGP area and the Eastern Ghats) continues to increase, but at a lower rate.

3.2.1. Annual Frequency of Heavy Aerosol Load

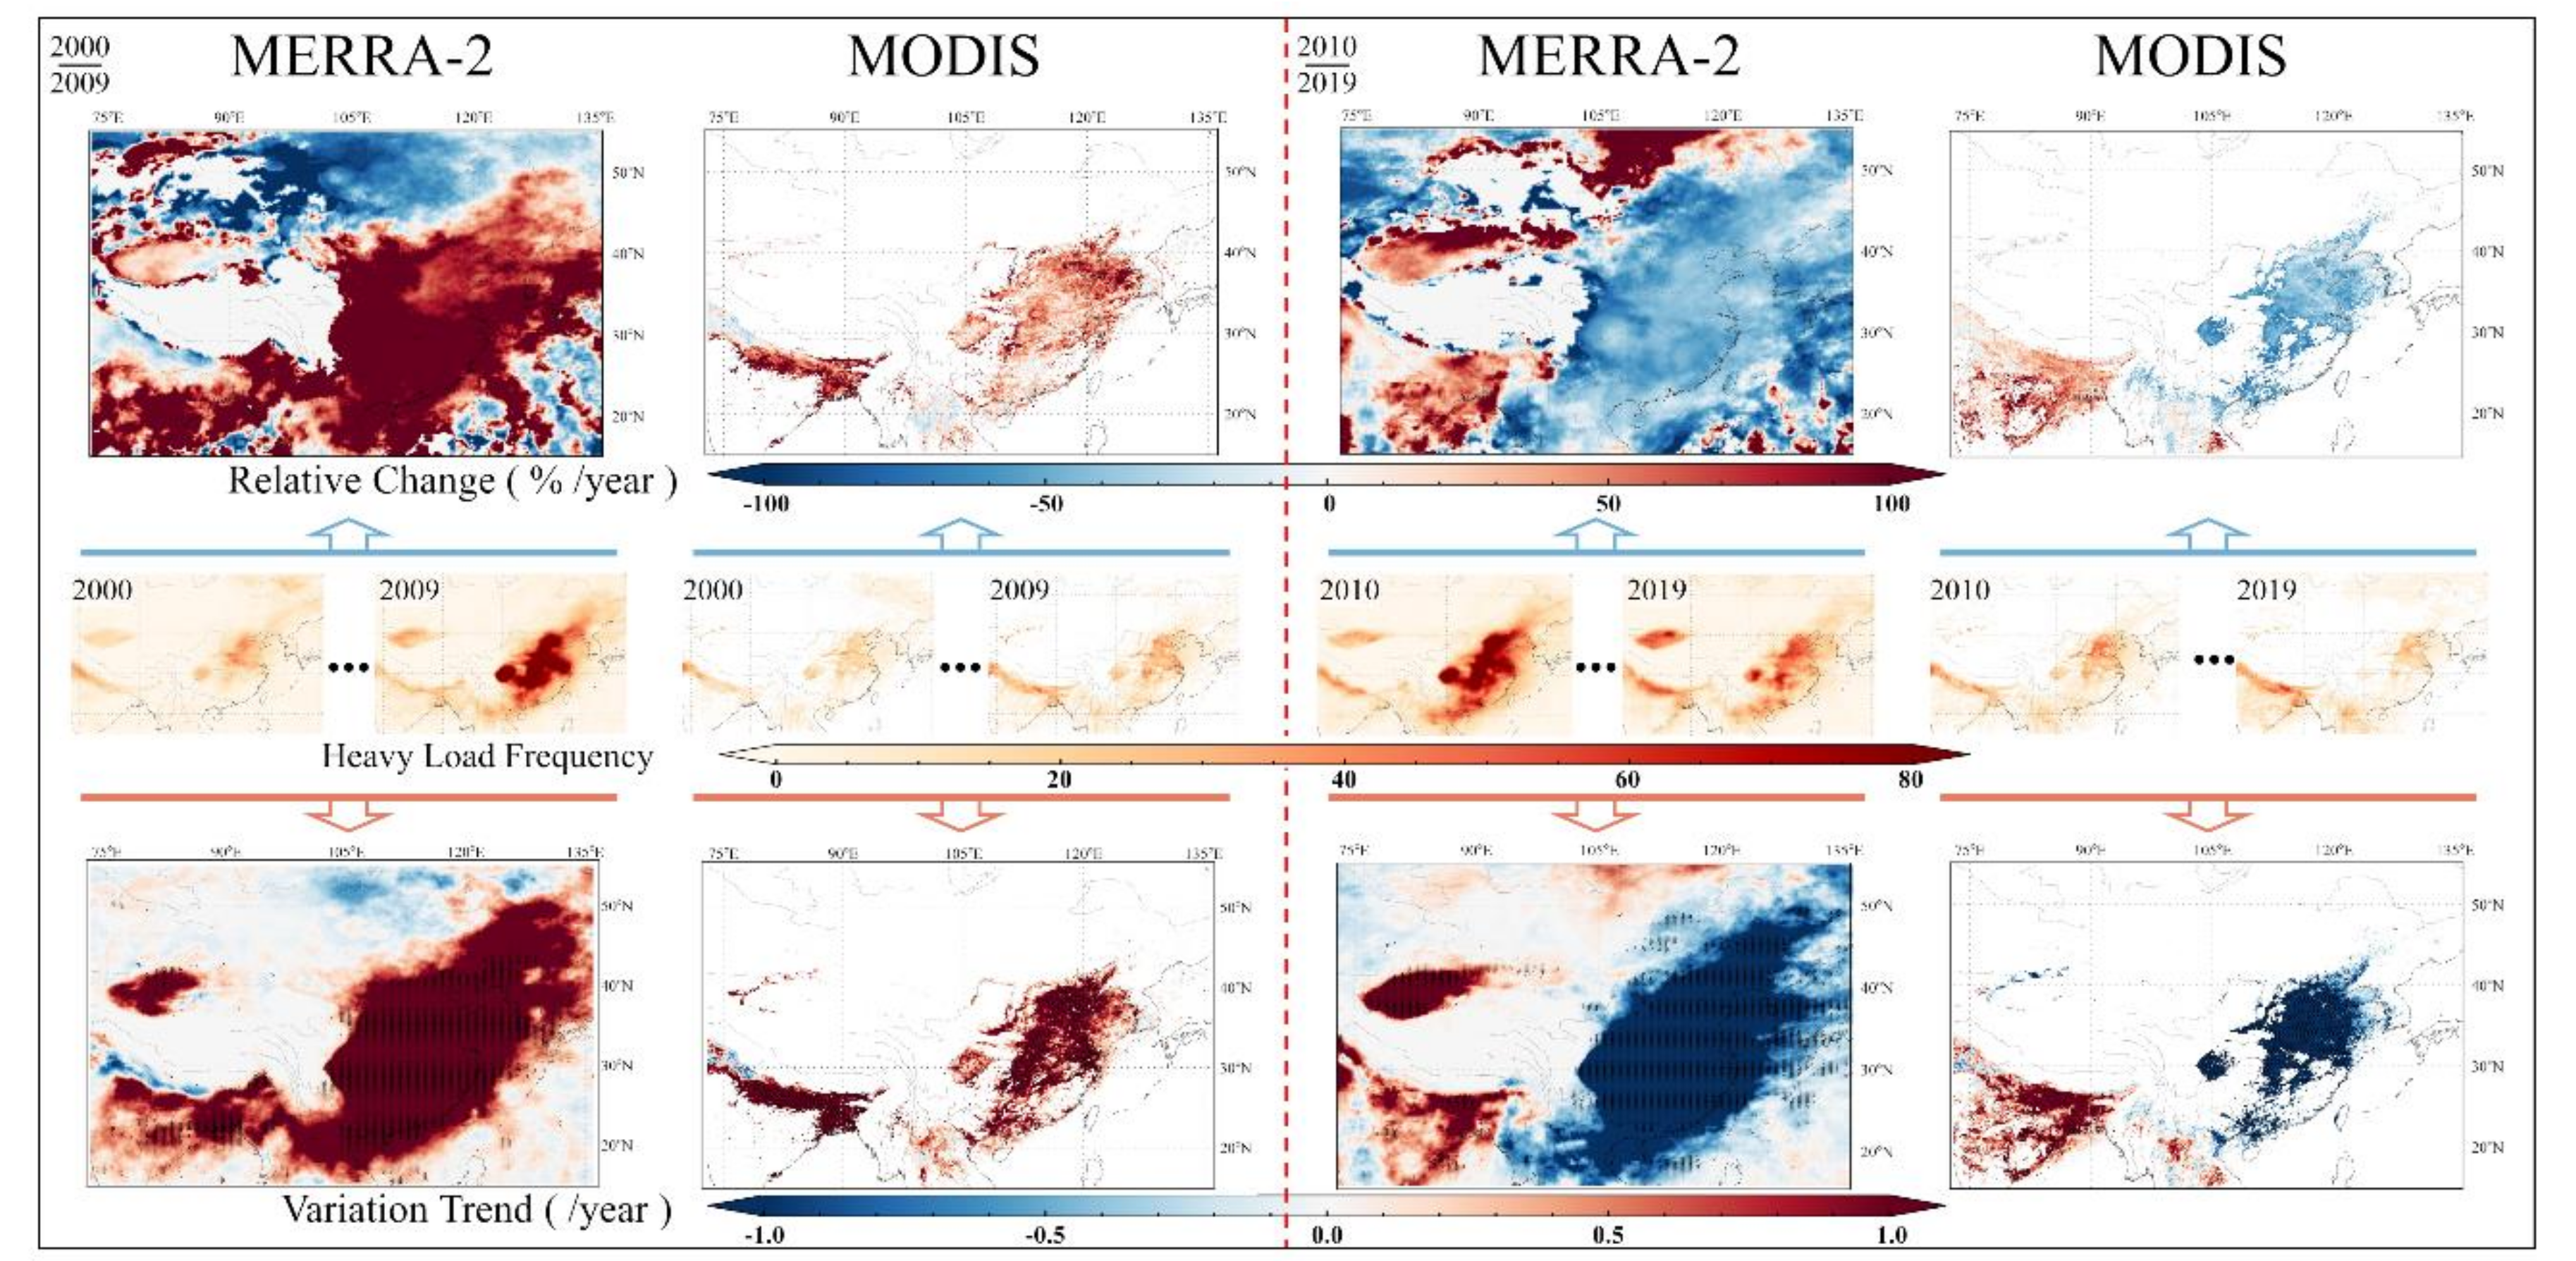
Figure 6 shows the spatial distribution of annual mean HALF, relative change, and variation trends over the study period. The MERRA-2 HALF over the center region was significantly higher than that of MODIS in 2009 and 2010, with the former being more than twice as high as the latter in terms of values. To more comprehensively visualize the differences in the annual HALF between the two datasets, we plotted the spatial distribution of the annual HALF during the study period (Figures S10 and S11). The MERRA-2 results show that the annual HALF in the center region fluctuates significantly, and the upward convex parabolic fluctuations match well with the AOD fluctuations. During 2000–2002, annual HALF was low but rose rapidly and stabilized at a high level during 2006–2014. After 2014, annual HALF decreased steadily, but the annual HALF in 2019 was still higher than that in 2000. MODIS also shows the same annual HALF fluctuation trend in the region, but the fluctuation was significantly less intense than that of MERRA-2. The IGP area in South Asia has a high aerosol load, and the annual HALF of MERRA-2 and MODIS is very close year by year, which indicates that the temporal integrity of MODIS is close to that of MERRA-2 in the IGP region.
Differences in temporal integrity have less impact on the calculated relative change and variation trend of the two datasets. Except for the differences in the relative change from 2000–2009, the temporal variation calculations of annual HALF fluctuations based on the two datasets were extremely close. For example, from 2000–2009, the annual HALF of the NCP increased significantly, with MER_VT and MOD_VT being greater than 0.02. During the second decade, the aerosol loads of the NCP decreased sharply, and the annual HALF reduction rates given by MERRA-2 and MODIS remained consistent. The previous AOD results indicate that the aerosol load in the IGP area always increased, and the relative change and variation trend of the annual HALF were consistent with the results.
This paper presents the results of the spatial distribution of AOD as well as heavy aerosol load frequency over marine regions. However, it mainly focuses on the characterization of aerosol status on land and therefore, detailed characterization of the spatiotemporal distribution of aerosols over marine areas is not carried out. For marine areas close to land with high aerosol loads, the aerosol state is similar to that of land areas. For example, the polluted aerosols in the Bohai Sea region, which are mainly from the NCP, fluctuate on spatiotemporal scales, consistent with those in the NCP.

3.2.2. Sub-Regions Temporal Variation Characteristics

Figure 7 provides a comparative analysis of the AERONET, MERRA-2, and MODIS datasets in five sub-regions. The three datasets showed different variation characteristics in different sub-regions. Sub-regions A, D, and E had higher aerosol load, and MODIS and AERONET data were closer, both being higher than MERRA-2. This phenomenon is more obvious in the sub-region D. The overall average AOD of AERONET (0.497) and MODIS (0.488) was very close, which is much higher than that of MERRA-2 (0.324). In the low and medium aerosol load regions, the MERRA-2 data were closer to the AERONET observations, with a difference of 0.01 (sub-region B) and 0.029 (sub-region C). The overall mean AOD values for the sub-regions given by MODIS were higher, exceeding the first two by 10–30%. The above results suggest that MERRA-2 underestimates the AOD levels in the high aerosol load region, while MODIS tend to overestimate the AOD levels in the low and medium aerosol load regions.
Among the results of the AOD variation trend over sub-regions, the calculated aerosol load variation trends for the three datasets in sub-regions B and E are more consistent. In sub-region B, the aerosol load exhibited a parabolic pattern of ascending and then descending. The overall trend shows a slow decline, with AERONET giving the most obvious overall declining trend with a slope of −0.004, followed by MODIS (−0.003) and MERRA-2 (−0.001). In addition, the aerosol load in sub-region B showed a sharp increase in 2004, which was accurately recorded in all the three datasets. The aerosol load in sub-region E showed a fluctuating increasing pattern, with the highest aerosol load growth rate calculated by MODIS during the study period. The MODIS increasing trend attained a value of 0.012 year−1, i.e., four and three times higher than AERONET (0.003 year−1) and MERRA-2 (0.006 year−1), respectively. The aerosol load growth rate in the second decade was four times higher than that in the first decade. The MODIS and MERRA-2 results were much closer, with both showing a significantly higher increasing trend in the first decade than in the second decade. Contradictorily, for AERONET data, the aerosol load growth rate in the second decade was four times higher than in the first decade.
Compared with the results of sub-regions B and E, the consistency of the temporal variation trend results of the three datasets was lower in sub-regions A, C, and D. Specifically, the results of MODIS and MERRA-2 were consistent, while the AERONET results were different from those of the former two; in sub-region A, the regional aerosol load variation trend given by AERONET in the first decade was −0.029, i.e., a strong declining trend, which is diametrically opposite to the strong increasing trend observed by MODIS (0.013 year−1) and MERRA-2 (0.026 year−1). A similar phenomenon occurred in sub-region D during the same period. Conversely, in the latter decade, the calculated trends for the three datasets were consistent over the two regions mentioned above, both showing a decreasing trend in aerosol load. For sub region C, the calculated results of MERRA-2 were significantly different from those of the other two datasets.
The above phenomenon that AERONET observations follow different trends compared to MERRA and MODIS is mainly caused by the differences of the AERONET observations amount and time-span. Taking two sites of sub-region D as examples, the time-span of Bac_Giang is 2003–2009, which is significantly shorter than that of Chiang_Mai_Mct_Sta (2007–2020). On site-scale, the amount of valid observations also varies with year (Figure S12). Compared with the sub-regional mean AOD, the temporal variation calculation based on annual mean AOD were more susceptible on the amount and time-span differences of the AERONET observations.

4. Long-Term Variation Assessment of Aerosol Type

This section focuses on the analysis of the temporal variation of different aerosol proportions and dominant types. As MERRA-2 AE is not accurate enough to be the base of analysis, MERRA-2-based aerosol types are abandoned. Aerosol type assessment of this study mainly uses the AROD-based model and MODIS data.

4.1. Aerosol Identification Using AE-Based Model

In this study, regional aerosol type identification was carried out using AOD and AE data provided by MERRA-2 and AOD vs. AE identification model, and the results are presented in Figure S13. From the spatial distribution of the CM-type aerosol, we found that the variation pattern of CM-type aerosols in the southeastern part of the study region is more reasonable, and the proportion of CM-type aerosols at the grid points in this area increased with an increase in the distance from the land. However, the observations of a large number of grid points with high CM-type proportions in the North-West region (especially on the Tibetan and Mongolian plateaus) is distinctly incorrect, which is caused by the identification mechanism of the model. CM-type aerosols have larger particle sizes and usually do not lead to higher aerosol loads. In the AE recognition model, grid points with low aerosol loads (low AOD values) and large particle sizes (low AE values) are identified as the CM type. However, there are also a large number of aerosols with the same characteristics in the northwest region, which cannot be classified as the CM type. The overall proportion of CM-type aerosols over the study region given by MERRA-2 reached 22.19%, which, combined with the above, can be considered as a serious overestimation of the CM-type aerosol proportion in the region. Many CC-type aerosols are also incorrectly classified as CM-type aerosols in the North-West region, which is the main reason for the overall lower percentage (less than 30%) of CC-type aerosols.
The suitability of the MERRA-2 AE data was verified at the site scale using the same assessment method of AOD data shown in Section 2.3.1. Statistical analysis on the verification results were conducted to determine the impact of the AE data accuracy on the aerosol type identification. The statistical results are shown in Figure S14. Among the 75 sites, only 10 (13.33%) had R greater than 0.6, 24 (32%) had an RMSE less than 0.3, 5 (6.67%) had a MAE less than 0.2, and 10 (13.33%) had more than 66% of their grid points falling within the EE envelope. For the same statistical indicator, the site-scale statistics of AOD data were 92%, 78.67%, 80%, and 37.33%, respectively. The statistical results show that the accuracy of MERRA-2 AE data is low, and it can be inferred that the credibility of the aerosol type identification results based on MERRA-2 data is insufficient. Considering the evident limitations of aerosol type identification based on MERRA-2 data, the dominant aerosol type analysis, the seasonal scale identification, and the calculation of relative change and variation trend of various types of aerosols based on MERRA-2 datasets were not presented in this paper.

4.2. Aerosol Identification Using AROD-Based Model

The AROD-based identification model requires only two bands of AOD data to identify the aerosol types. The model is suitable for MODIS AOD bands, the feasibility and accuracy of the method that combining AROD model and MODIS AOD have been verified [41]. In this study, the AROD-based model and MODIS data were used to overcome the setback of the abandon of MERRA-2 outputs. Moreover, seasonal information of aerosol identification is shown in the supplementary file (Figures S15 and S16).

4.2.1. Annual Aerosol Types Proportion

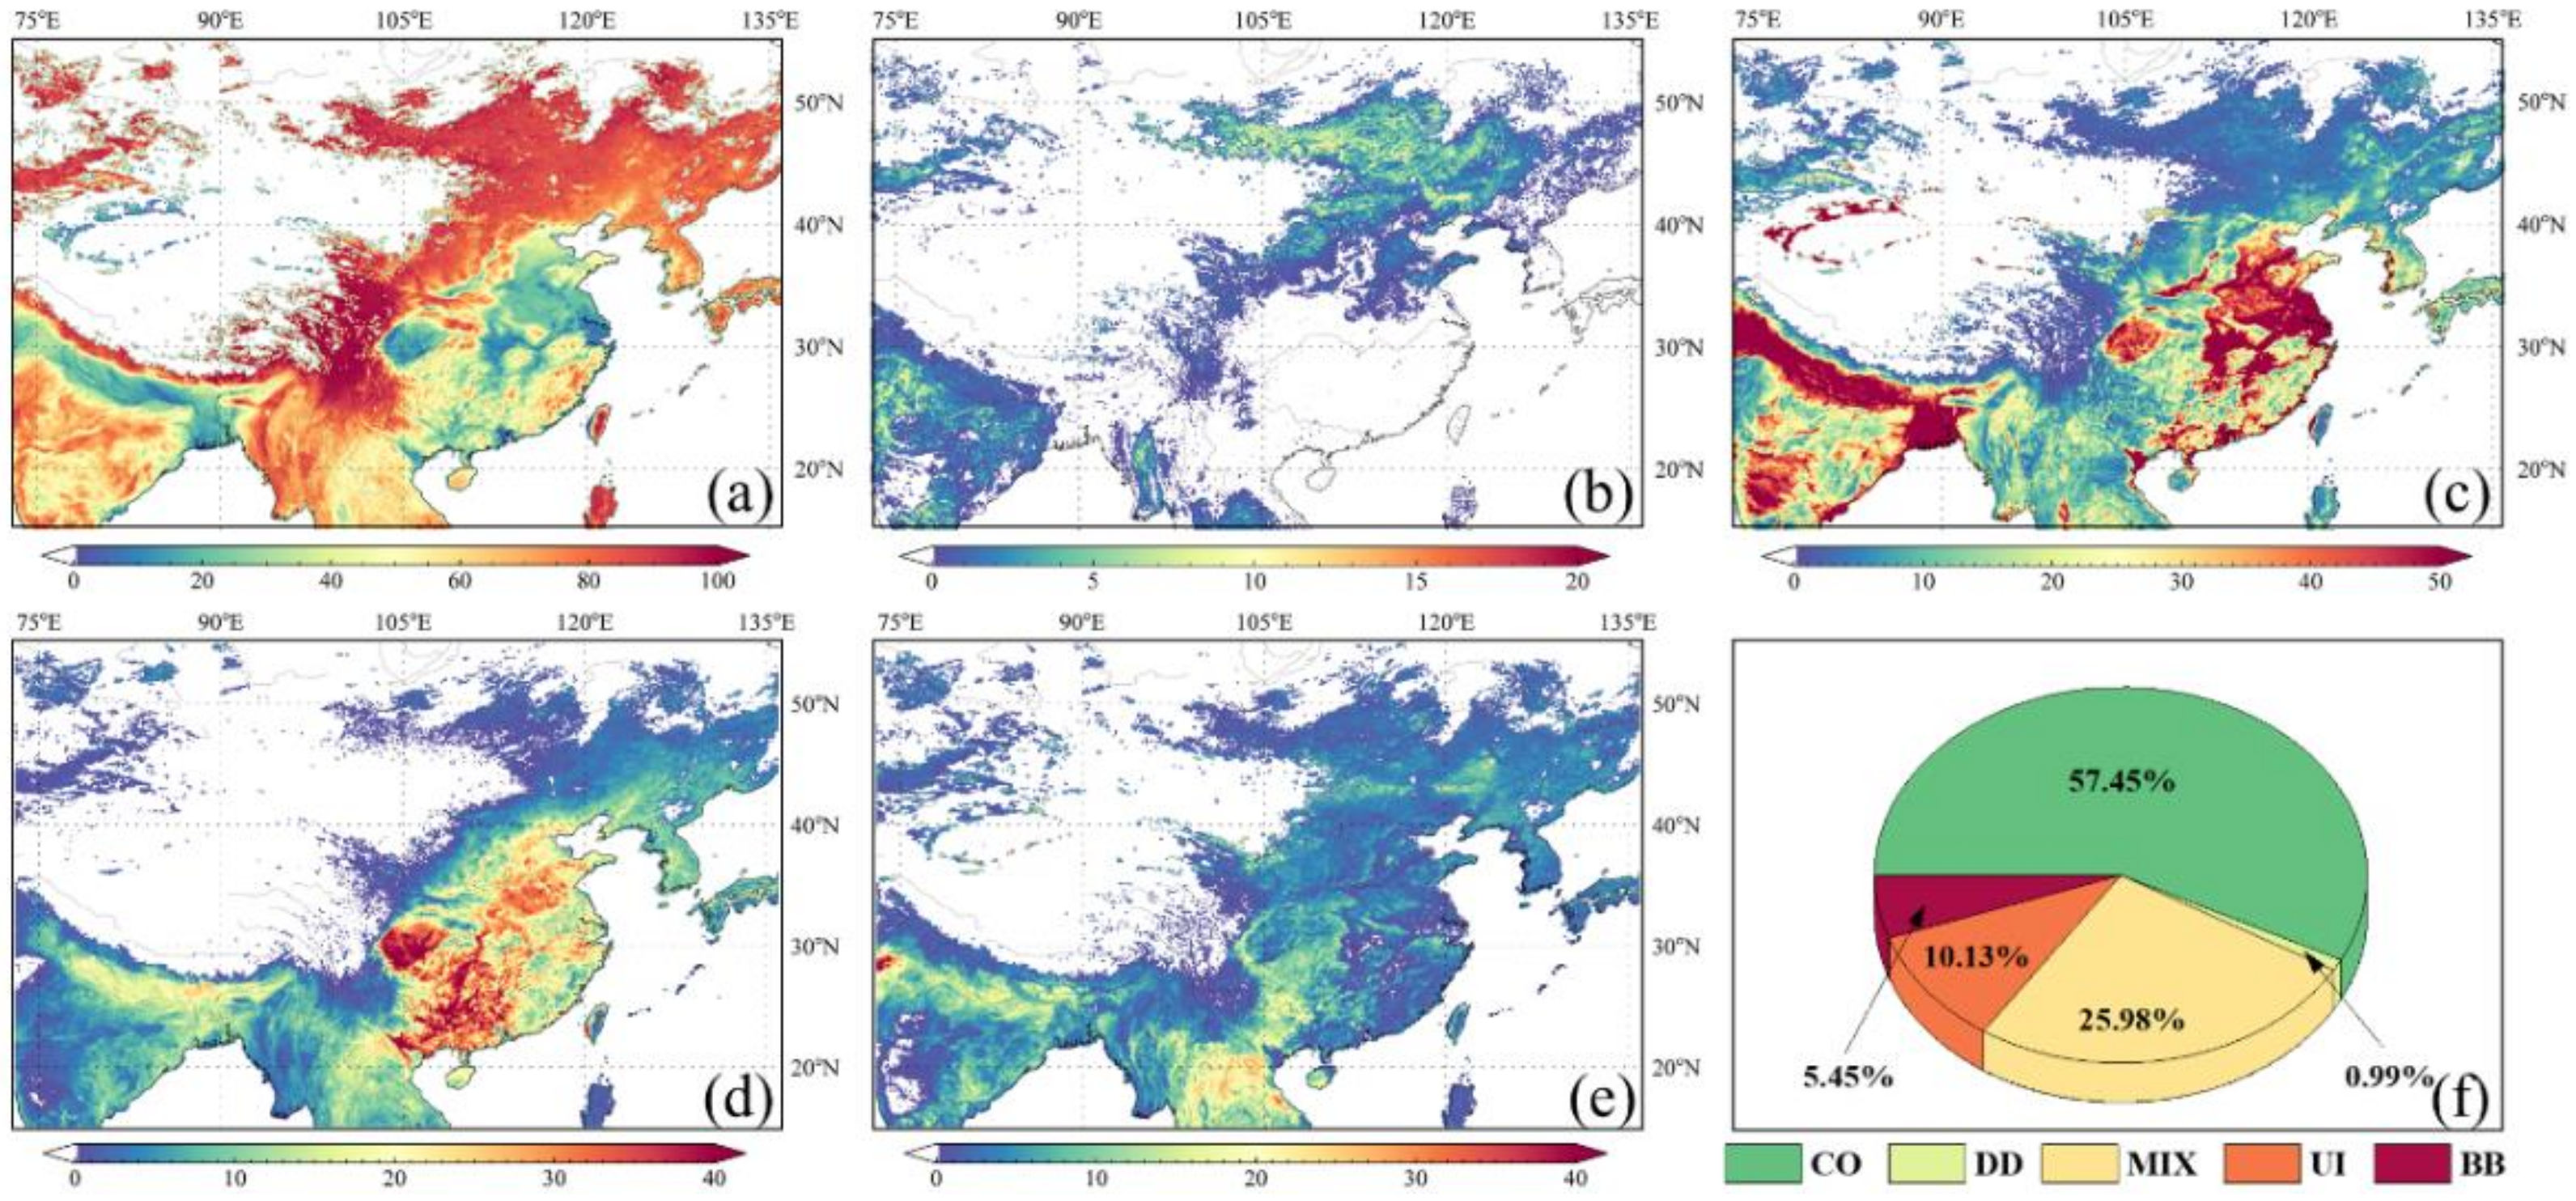
Figure 8 represent the spatial distribution of five aerosol types proportion, and the overall proportion of each type of aerosol over the study region from 2000–2019, based on the AOD470 vs. AROD660/470 aerosol-type identification model that incorporates MODIS data. In general, the degree of atmospheric pollution in the study region was high (Figure 8). The total proportion of aerosol types with pollution characteristics, such as MIX, UI, and BB, reached 41.56%, and the proportion of CO-type aerosols, which represent the clean atmospheric background, accounted for 57.45%, with the former reaching 70% of the latter.
It can be observed from Figure 8a that CO-type aerosols mainly appeared in the Mongolian Plateau, the Inner Mongolian Plateau, the western and northern regions of the NCP, the Northeast Plain, the south of the IGP area, and the Hengduan Mountains and its southwestern part toward the Bay of Bengal. The percentage of CO-type aerosols in the Hengduan Mountains was close to 100%. In the NCP, the Central China, the Sichuan Basin, the YRD, the PRD, the Tarim Basin, the RRD, and the IGP, the proportion of CO-type aerosols was extremely low. This is mainly due to the dense population, low altitude, and flat terrain in these areas, and is strongly influenced by anthropogenic aerosols. The main distribution areas of the MIX and UI types are the areas where the aforementioned CO-type aerosols accounted for a relatively low proportion.
MIX-type aerosols are mainly distributed in areas with high population density and are clearly affected by multiple aerosols (Figure 8c). The causes of MIX-type aerosols are closely related to the area to which they belong. MIX-type aerosols over the study region can be classified into three categories. The first category occurs in coastal areas, such as the YRD, the PRD, the RRD, and the Ganges Delta in the IGP area. Coastal areas usually have developed economies, high population density, significant anthropogenic emission sources, and are influenced by marine aerosols, thus exhibiting a mixed type of marine aerosols and urban aerosols. The second category is mainly distributed in inland areas such as the NCP, the Central China, the Sichuan Basin, the IGP area, and the Deccan Plateau. These urban areas are usually densely populated having high perennial aerosol loads and significant anthropogenic emissions, and receive the influence of long-distance transport aerosols, thus showing a mixed type dominated by anthropogenic aerosol emissions. The third category is influenced by anthropogenic emissions and primary dust aerosols, and is dominated by a mixture of urban aerosols and primary dust aerosols throughout the year. Such MIX-type aerosols are mainly distributed in the neighboring areas of the Tarim Basin, the western region of the IGP, and the western and northern parts of the NCP. Figure 8d shows the spatial distribution of UI-type aerosol proportion. The Sichuan Basin had the highest UI-type (>35%), which is closely related to the dense population in the area and the topography that is favorable for pollutant accumulation. The proportion of the UI-type over the western part of the southeastern hills and the northwestern part of the RRD is slightly lower than that in the Sichuan Basin, which is also responsible for the high UI-type aerosol proportion in the region. In addition to anthropogenic emissions and terrain factors, pollution caused by aerosol transportation is also the reason for the high proportion of UI in this area. In the most densely populated areas such as the NCP, Central China, and the IGP, the aerosol load is complex, and the main type of aerosol is MIX aerosol (as shown in Figure 8c). The proportion of UI-type aerosols over the above areas is not the highest of the study region, with fluctuation from 15% to 30%.
The overall proportion of BB-type aerosols was not high, reaching only 5.45%. Spatial distribution of BB-type (Figure 8e) shows that the BB-type aerosols are mainly concentrated in the South region, the Northeast Plain, the western part of the southeast hills, and the IGP area, especially in the west of the IGP area, with many grid points having a proportion of more than 40%. The regions mentioned above have a large amount of arable land, where straw burning is the main source of BB-type aerosols. In addition, the South region is also prone to large forest volcanic events in spring and is one of the main contributors to BB-type aerosols. This can be inferred from Figure 8b,f showing that the study region of this study is less affected by DD-type aerosols, accounting for less than 1% of the total aerosol proportions; DD-type aerosols mainly originate in deserts, and plateau areas. The Deccan Plateau, the Northeast Plain, the eastern part of the Inner Mongolian Plateau, and the northern part of the NCP are affected by transported DD-type aerosols. The eastern Indus Plain and the Mongolian Plateau are both affected by native sand and dust aerosols, and the proportion of DD-type accounts for approximately 10%. The Taklimakan Desert, located in the Tarim Basin, is the largest desert in China and delivers a large number of DD-type aerosols to the outside throughout the year. As mentioned in Section 3.1, the inversion algorithm used for MODIS datasets selected in this study is the DT algorithm, which makes it difficult to obtain information on aerosol optical properties in the area. Therefore, the selected MODIS datasets have limitations in characterizing the proportion and distribution of DD-type aerosols.

4.2.2. Annual Dominant Aerosol Types

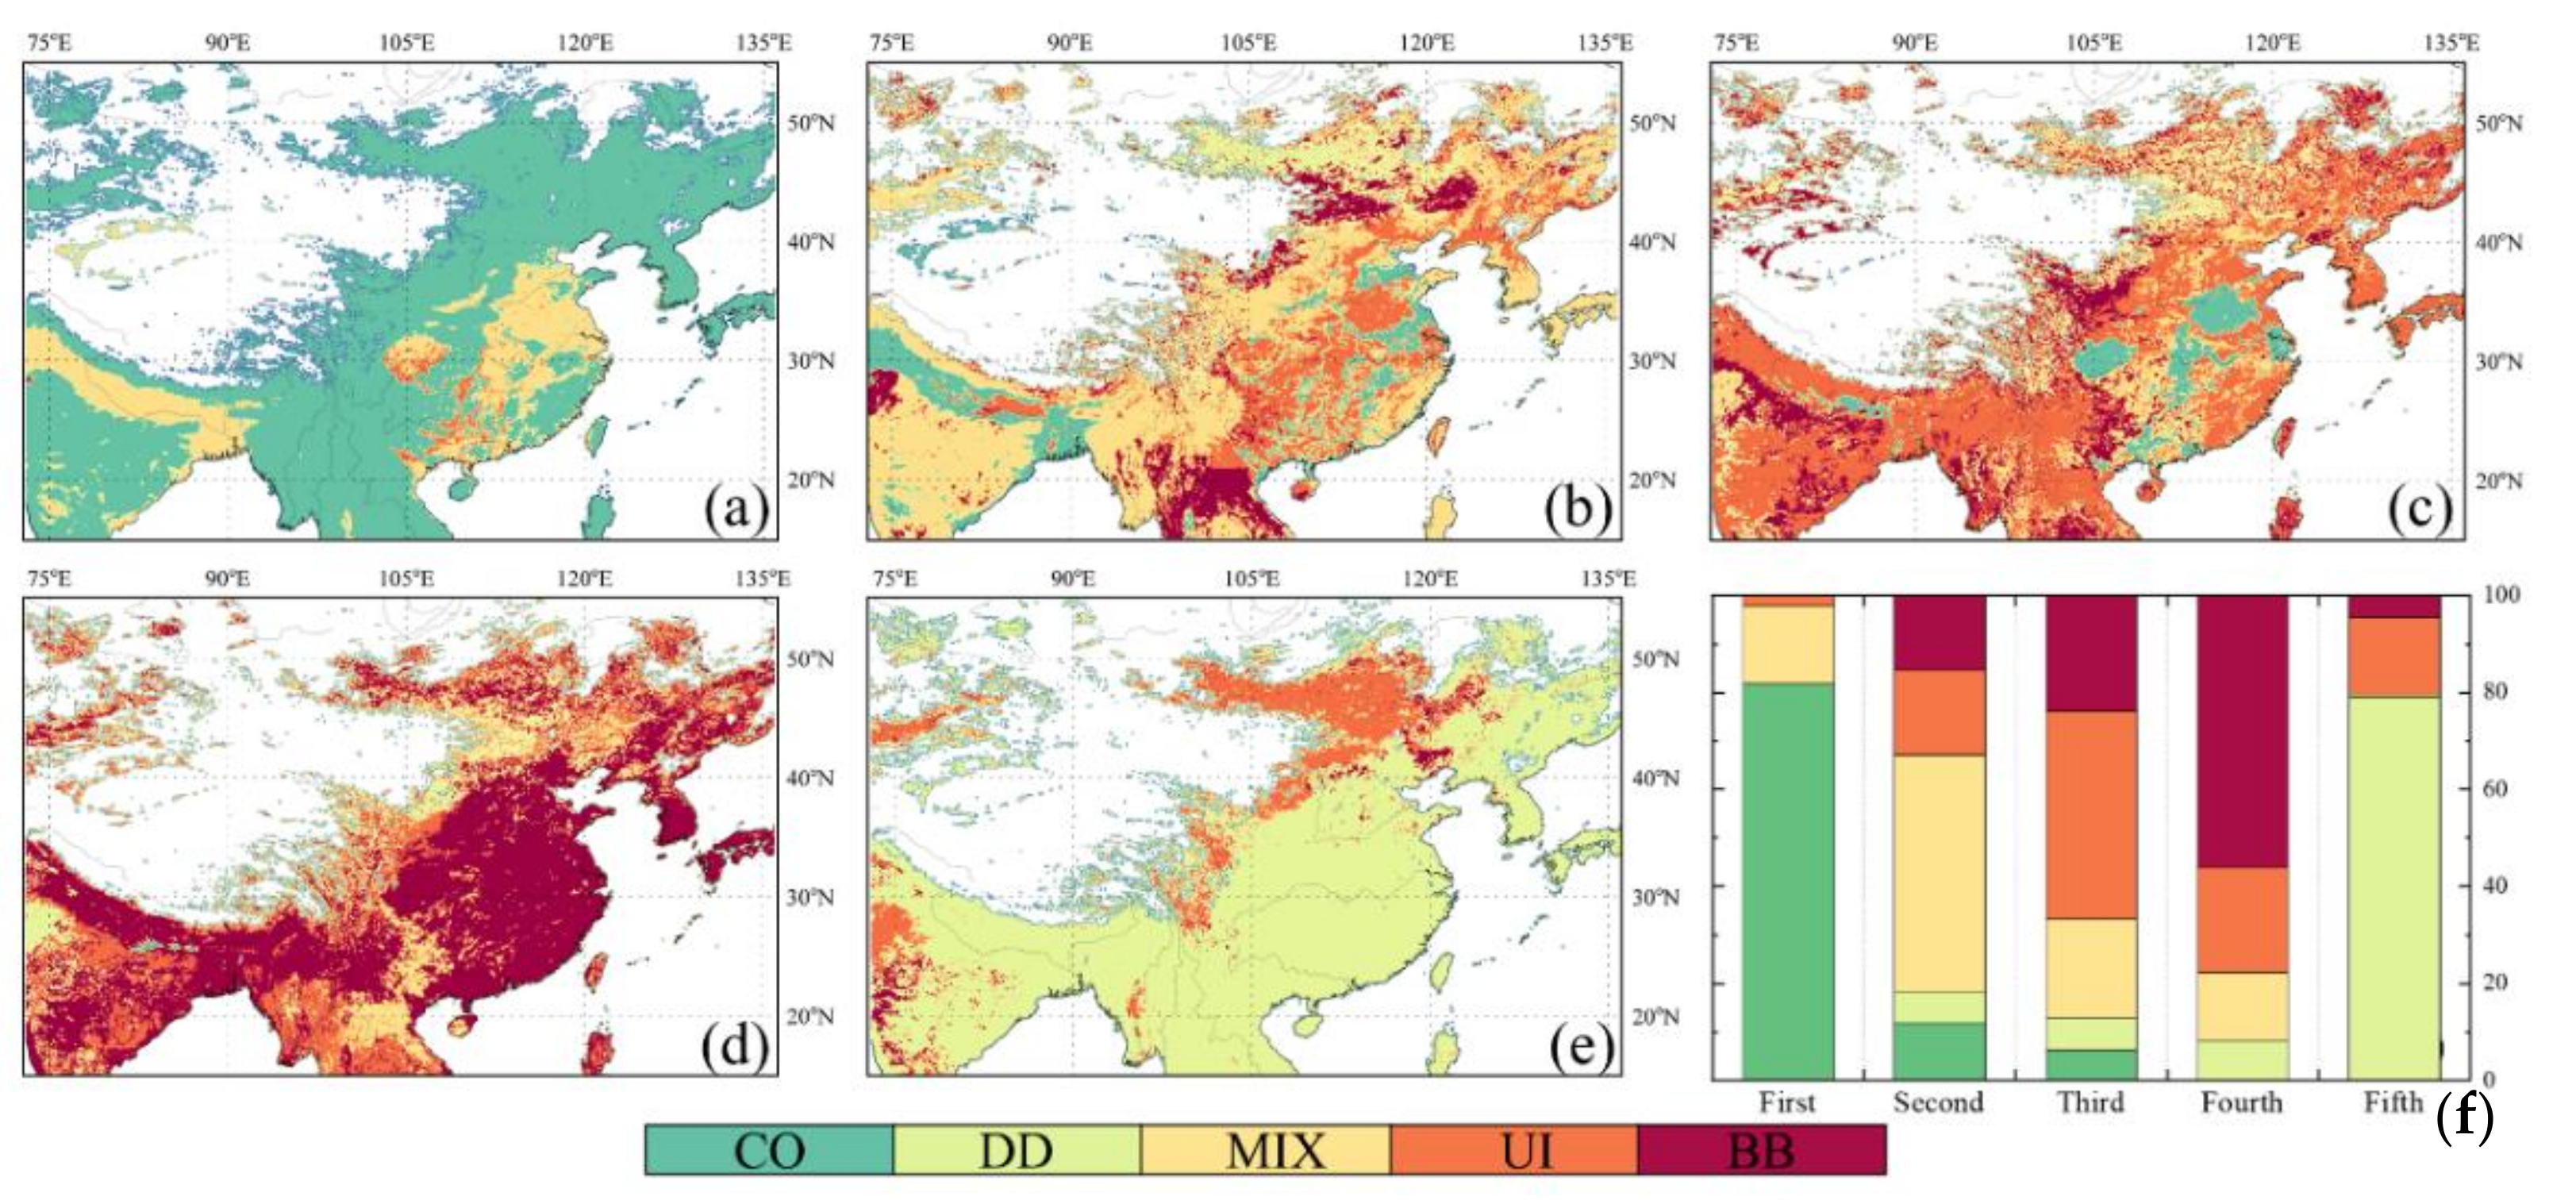
Figure 9 Represent the results of the dominant aerosol types over the study region from 2000–2019, based on MODIS datasets. Although the overall proportions of polluted aerosols (MIX, UI, and BB) and clean aerosols (CO) in the study region were relatively close, the latter had a much higher proportion than the former in terms of the dominant aerosol type. Figure 9a shows that the first dominant aerosol type is mainly CO-type, followed by MIX-type, and the proportions of the two are 81.65% and 16.19, respectively, and the latter is only one-fifth of the former. The grid points where the UI type occupies the first dominant position are mainly distributed in the southern Sichuan Basin, the western part of the southeastern hills, and the northwestern part of the RRD, accounting for 2.11% and are interspersed with MIX-type grid points. In terms of spatial distribution pattern, the grid points where the first dominant aerosol type is a polluted type coincides with the distribution of the areas with high AOD values (Figure 5). In the second dominant aerosol type (Figure 9b) results, the MIX-type replaces the dominant position of the CO-type and nearly half (48.72%) of grid points are MIX-type. In the NCP, Central China, the Sichuan Basin, and in the southeast hills, the second dominant aerosol type was UI-type, followed by CO-type. The distribution phenomenon in the IGP area is exactly opposite to the areas mentioned above, and the second aerosol type in most grid points of the area is CO-type. The percentage of grid points with BB-type as the second dominant aerosol type is close to that of the UI-type, which is mainly distributed in southeast Asia, the Indus Plain, and the Northeast Plain. In the calculated results of the third and fourth dominant aerosol types, approximately 70% of the grid points showed UI-type and BB-type, followed by MIX-type and DD-type. From the grid points, as shown in Figure 9c, 6.24% show CO-type, which is negligible in Figure 9d. Because the overall proportion of DD-type aerosols is maintained at a low level (only 0.99%), the dominance of DD-type aerosols is low in majority of the grid points. From Figure 9f, the proportions of DD-type aerosols are only 6.51%, 6.66%, and 7.90%, respectively, and all these grid points are concentrated in the dust particle originating places such as the Mongolian Plateau, the Inner Mongolian Plateau, and the Tarim Basin. The percentage of grid points where the fifth dominant type is DD type reaches 78.94%, and the area where these grid points are located (e.g., coastal areas in southeast China) is not affected by DD-type aerosols all throughout the year. From the grid points in Figure 9b, 21.06% exhibit the MIX/UI/BB-type, which can be used to characterize the areas that can be obviously affected by DD-type aerosols. For example, in the western and northern regions of the NCP, DD-type aerosols appear even more frequently than UI-type aerosols under the influence of long-range transported sand and dust.

4.2.3. Temporal Variation of Polluted Aerosols

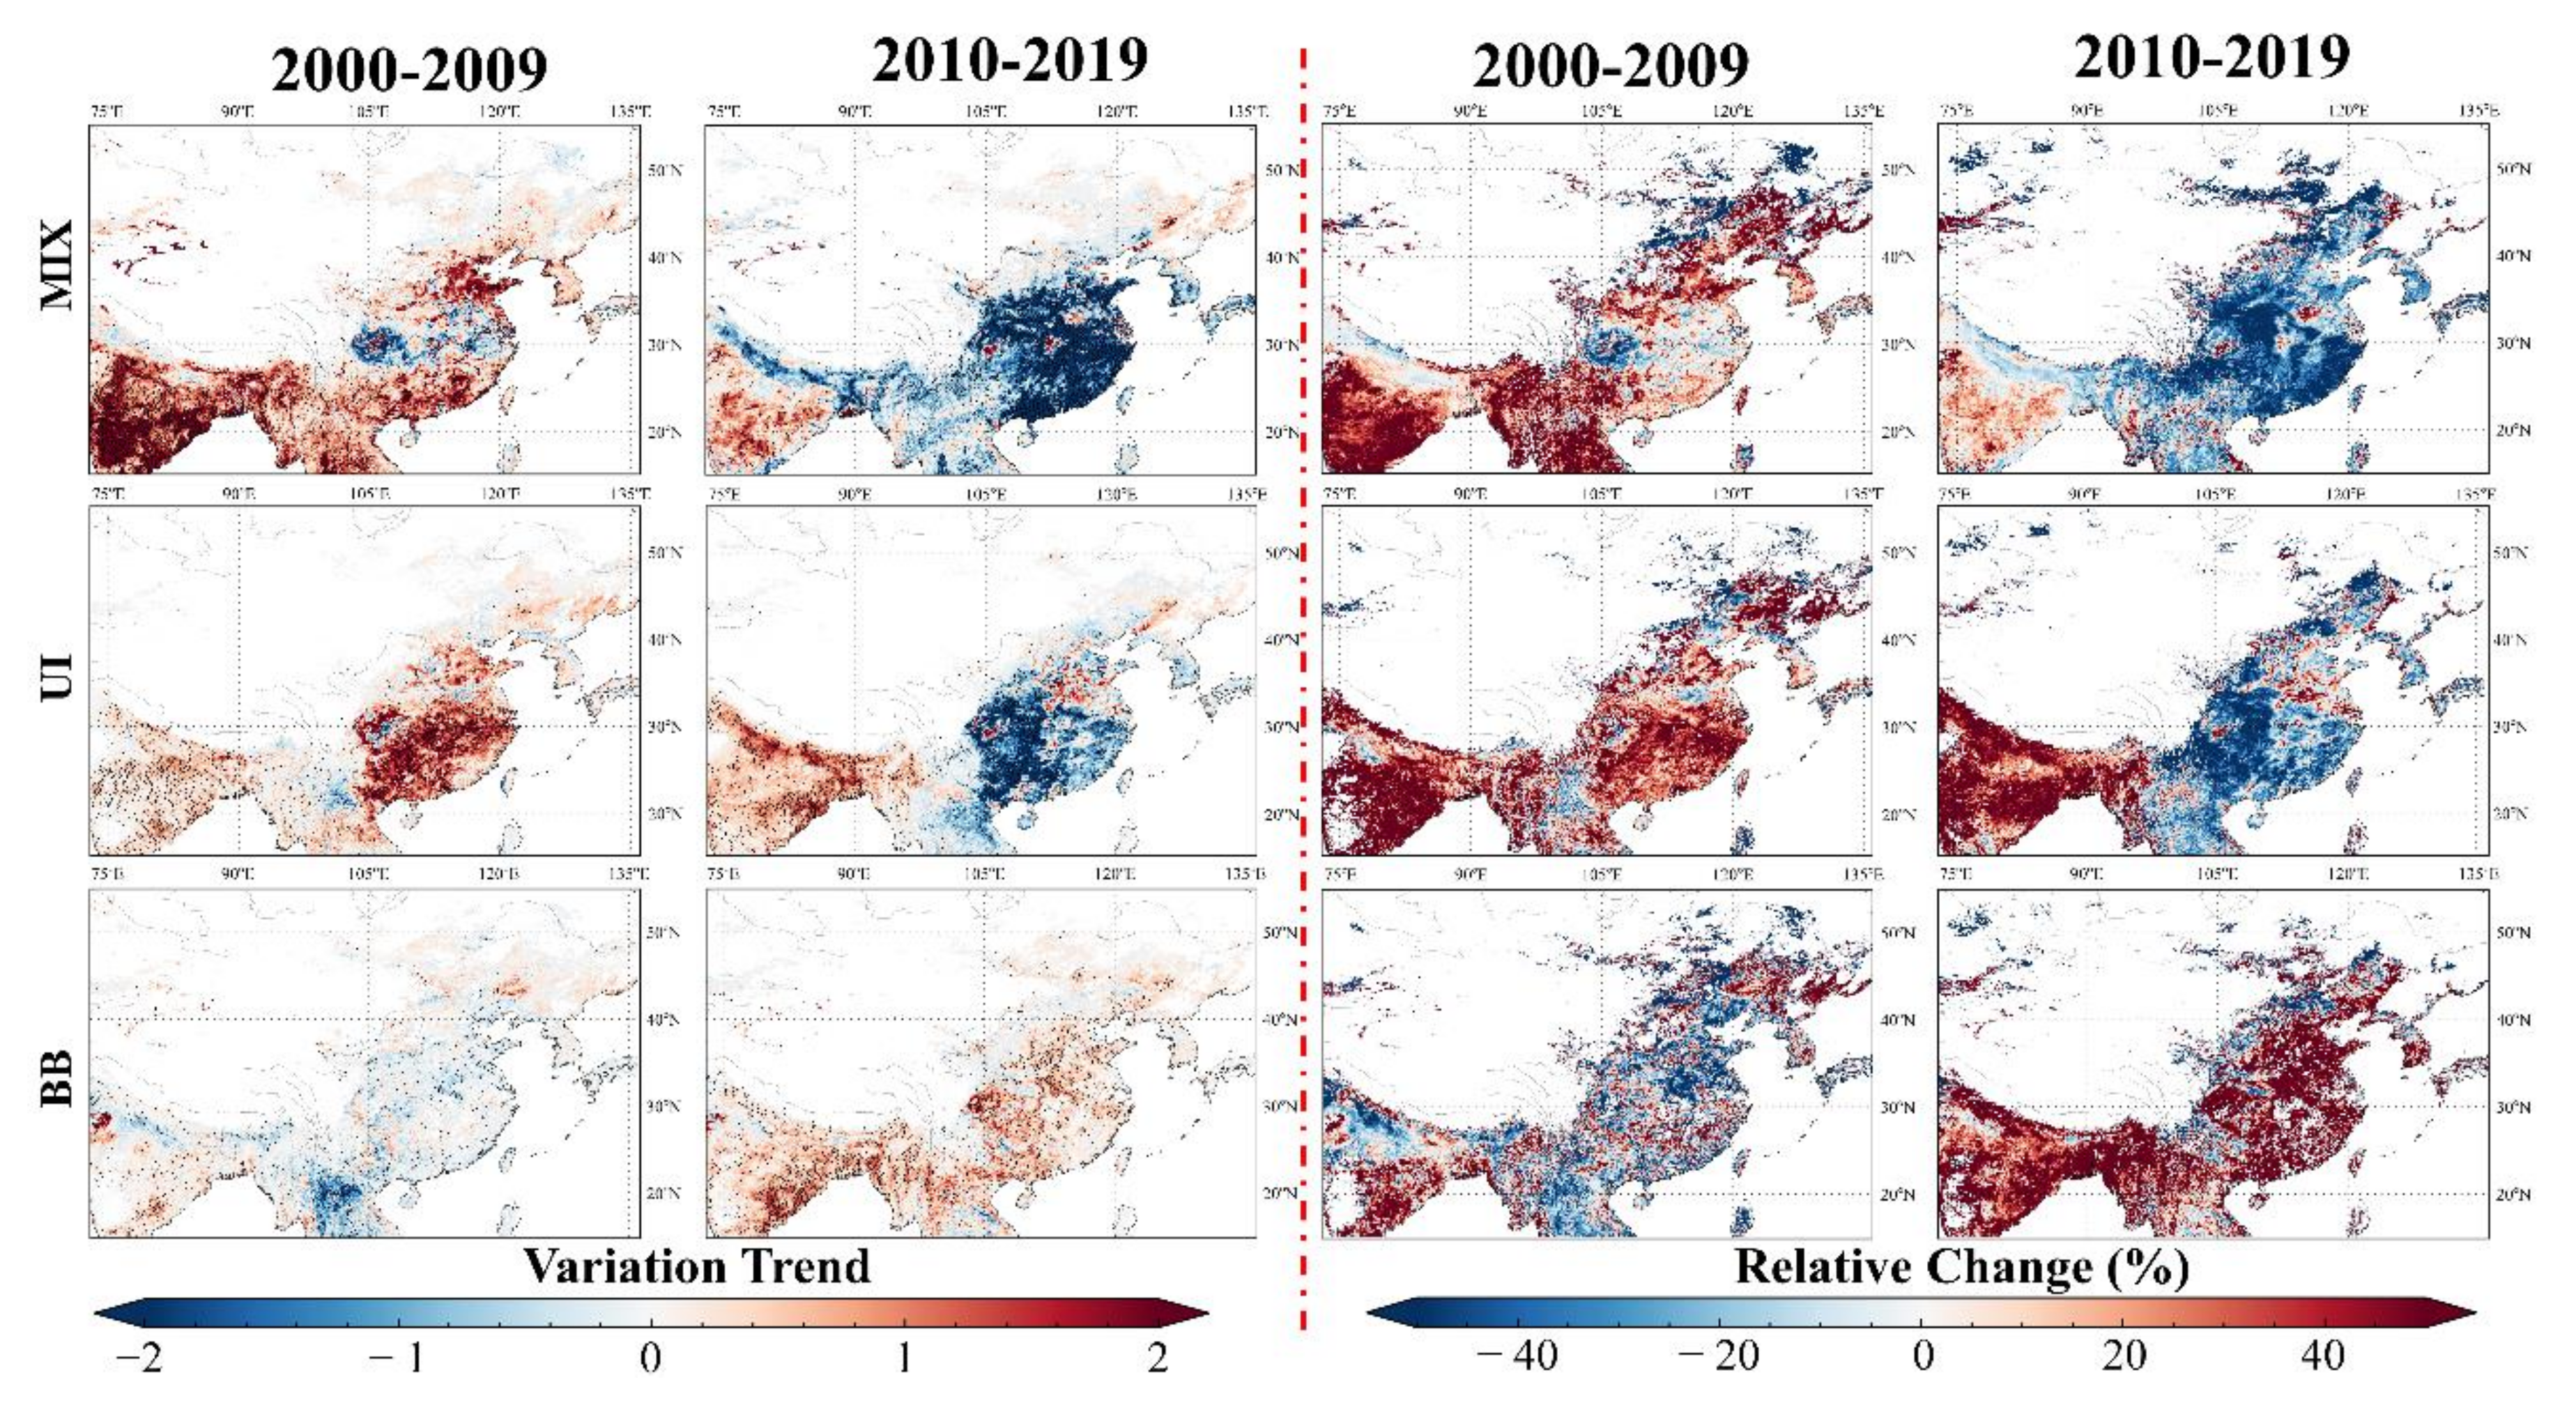
In order to promote the understanding of the relationship between aerosol load changes and aerosol types in each region, a temporal study (variation trend and relative change) on the proportion of pollutant aerosols was conducted and the results are shown in Figure 10. The DD-type was not included in the study because of its lower proportion and higher uncertainty in the calculation results. During the study period, grid points with high aerosol load in the center region showed a significant reversal in the polluted aerosols proportion. Except for the local regions of Sichuan Basin, Central and Northern China, the MIX-type showed a rapid increase in the first decade and a rapid decrease in the second decade. The MIX-type proportion fluctuation of grid points located in the Sichuan Basin shows a distinct polarization with the central location of the basin where the MIX-type proportion continued to increase, whereas in the surrounding area continued to decrease. The proportion of UI-type aerosols in the center region also showed a reversal phenomenon of increasing and then decreasing, except for the NCP with a continuously increasing variation. In the Sichuan Basin and the areas along the middle and lower reaches of the Yangtze River, BB-type aerosols did not show reversal changes similar to the UI/MIX type. In the first decade, the number of grid points with upward characteristics was relatively close with that of downward, whereas in the second decade, a rapid increasing trend was observed. The change in the polluted aerosol in the east region was similar to that in the center region. The changes in the MIX/UI-type in the south region were also close to those in the center region, and the difference in BB-type aerosol was evident. In the first decade, BB-type aerosols in the south region showed a rapid decline, while in the latter decade, there was a rapid increase. The proportion of pollutant aerosols in southwest China increased during the study period. During the first decade, the increase in pollutant aerosols was mainly in the MIX-type, and the growth rates of the UI-type and BB-type were lower than that of the MIX-type. In the second decade, the growth rate of the MIX-type decreased and was gradually overtaken by the UI-type and BB-type.

5. Discussion

Recent evidence suggests that a violent fluctuation in aerosol load has occurred over the study region during the last two decades. The aerosol load rose rapidly and remained at a high-level owing to the increase in aerosol emissions from economic development and urban industry energy demands. The aerosol load over the study region is much higher than that in the rest of the world, except in Western Asia and the Sahara Desert. Studies on the variation pattern of aerosol load over the study region is highly significant for controlling the atmospheric environment in the region and even globally.
By combining the advantages of multi-source datasets, the spatiotemporal distribution and variation of aerosol load can be comprehensively and effectively characterized, and enables further exploration of high pollution incidents. The spatial datasets, MERRA-2 and MODIS, used in this study can accurately describe the spatial distribution of high AOD areas at annual and seasonal scales, and have adequate spatial agreement. The advantages and limitations of both MERRA-2 and MODIS data are highly evident. The spatiotemporal integrity of the former is higher than that of the latter. In terms of spatial scale, MERRA-2 is able to provide aerosol characteristics over high surface albedo areas (e.g., Desert) located in the northwest region. For temporal-scale, MERRA-2 daily AOD data provide sufficient support to the research of HALF, which is focused in this study. In contrast, MODIS has noticeable limitations in terms of its spatiotemporal integrity. The MODIS 3 km DT dataset selected in this study usually fails to retrieve aerosol characteristics over abundant grids in the northwest region as the DT algorithm cannot retrieve AOD over regions with high surface albedo. Similar phenomenon occurs at high latitudes in winter because of the snow covered the land surface and larger sensor zenith angle [15,46]. On a temporal scale, MODIS cannot provide continuous daily retrievals, which makes its applicability for HALF research lower than that of MERRA-2. It is worth emphasizing that MODIS AOD retrievals are closer to the ground-based AOD values under heavy aerosol load conditions than MERRA-2 AOD data, which have evident underestimation (Figure 3). MODIS retrievals can be used to correct MERRA-2 data to obtain more accurate daily AOD data, and as a way to advance HALF characterization studies.
Although MODIS data have a deficiency in spatiotemporal integrity, its spatial resolution is much higher than that of MERRA-2. Adequate spatial resolution allows MODIS data to be used to characterize local aerosol state fluctuations more accurately. For example, AOD temporal variation during the first decade over the SB area given by MODIS shows that the growth rate of AOD values in the central part of the SB area was lower than that in the surrounding area, while the spatial difference of AOD was not reflected in the MERRA-2 results (Figure S7).
MODIS and MERRA-2 can provide long-term aerosol characteristics, which have been widely used in temporal variation studies of aerosol loads. In this study, we confirmed that the selection of the time span could have a fundamental impact on the research of aerosol load temporal variation. Comparing the spatial distribution of the annual average AOD calculated using MODIS and MERRA-2 (Figure S17), it was found that the AOD values of the heavy load area located in the center region during 2000–2019 were close to each other, and both results were significantly lower than during 2010; this suggested that the AOD temporal variation showed an upward convex parabola. While performing the temporal variation analysis, if the entire study period (2000–2019) was used as the time span, then the final calculation of temporal variation for MERRA-2/MODIS AOD will be as shown in Figure S18; the aerosol load over the heavy load part of the center region in the two decades was extremely stable, with a relative change of less than 10%, showing a very small increasing or decreasing trend. Among them, the SB area exhibited a significant decrease in aerosol load. It is evident that the above inferences were far from the actual aerosol fluctuation over the center region and contradicted the large number of previous aerosol-related events in the region. Similar phenomena also appeared over the southwest region. Taking the IGP area as an example, the AOD values over the area in 2019 were slightly higher than in 2010, but both were much higher than in 2020. The above phenomenon shows that the aerosol load in IGP area had increased sharply since 2000, and the growth rate had slowed down after 2010. Hence, the aerosol temporal variation results with a time span of two decades cannot accurately reflect the aerosol load fluctuation over the area. The results will underestimate or overestimate the load growth rate of the first or last decade. Thus, we conclude that the time span setting is a key factor to conduct aerosol load trend analysis. If set too long, it is difficult to accurately calculate the temporal variation of aerosol load, while too short a time span will lead to strong randomness. Therefore, the time span was set as one decade in this work when carrying out the temporal variation analysis of aerosol load, and the relative change and the variation trend were calculated for the two decades (2000–2009 and 2010–2019) separately.
The spatiotemporal distribution and variation of aerosol load obtained from multi-source aerosol datasets in this study have described the aerosol load state over the study region over the past two decades more completely but had not given a strong impetus to the exploration of aerosol load and the targeted prevention and control of air pollution. This is because aerosol load information can only characterize the location and frequency of atmospheric pollution events and cannot reflect the other characteristics (such as contributors) of the event. Specifically, it is less difficult to prevent and control atmospheric pollution events caused by a single type of polluted aerosol. The prevention and control of the corresponding aerosol emission sources in the area can realize a rapid and effective reduction of the polluted aerosol load. For example, urban industrial emissions and automobile exhaust emissions are the main contributors to UI-type aerosols. The UI-type aerosol load can be effectively reduced by formulating strict emission policies and promoting the use of clean energy. It can be seen that the acquisition of aerosol type information is one of the key factors in the study of aerosol load genesis and air pollution control.
MODIS aerosol products can provide multiple bands of AOD data, which can support aerosol type recognition based on the AROD identification model. The regional aerosol type information with adequate spatial resolution can be combined with the AOD values and HALF characterization results to analyze the key contributors to air pollution and provide a reference for the targeted prevention and control of pollution sources. Taking the NCP area as an example, the aerosol load and high load frequency in the area increased rapidly in the first decade, and the proportions of the MIX-type and UI-type aerosols also increased. However, the BB-type proportion did not change significantly, in the second decade, the aerosol load, high load frequency, and MIX-type aerosols proportion simultaneously showed a decrease, and the UI-type and BB-type aerosols proportion increased. The above results indicate that the deterioration of the atmospheric environment in the NCP area in the first decade was mainly caused by the rapid growth of MIX-type and UI-type aerosol emissions. In the second decade, the growth of UI-type and BB-type aerosol emissions hindered the improvement of the atmospheric environment, and the control of UI-type and BB-type aerosol emissions should be focused in the subsequent process of air pollution prevention and control. Similarly, high aerosol load areas such as the IGP, the YRD, and the PRD can be analyzed according to a compatible method. Application of AROD-based model to MODIS retrievals produces usable results, though with much reduced spatiotemporal coverage compared to MERRA-2. Fortunately, aerosol types do not change as fast in space and time as AODs and HALFs, and the reduced spatial and temporal aerosol type information retrieved from MODIS AOD retrievals and the AROD-based model adopted for them is sufficient in combination with the MERRA-2 AODs and HALFs for the long-term variation assessment of aerosol load and dominant types.
MERRA-2 data can provide AOD and AE data, and have the potential to carry out aerosol type identification based on the AE model; however, the credibility of the aerosol type information obtained on this basis is insufficient owing to the poor accuracy of the AE data (Figure S14). Considering the advantages of MERRA-2 in spatiotemporal integrity, future research can try to improve the usability of MERRA-2 AE data, and further obtain aerosol-type information with high frequency and adequate spatial resolution. It should be emphasized that the applicability of the AE model selected in this study needs to be improved, because the existing aerosol type classification methods and the set recognition threshold will classify a large number of inland aerosols into marine type. Therefore, an attempt can be made to amend the AE model by setting a background aerosol identification threshold, below which the type is classified as background aerosol, and above which the aerosol sub-type can be identified. The aerosol state varies from region to region, and the corresponding background aerosol identification threshold should be determined in relation to the actual aerosol state.
MERRA-2 provides aerosol typing information based on their assimilation model. The information, combined with MERRA-2 HALF and MODIS-based aerosol type, can be used to explain what aerosol types occurred during the heavy aerosol load events. As one of the assimilation datasets of MERRA-2, MISR provides multi-angle observations of atmospheric aerosol which can be used to extract information of aerosol type. Although this study focuses on MODIS data, MISR data needs to be included in further studies of aerosol type identification. Future research should focus on improving aerosol type identification using MERRA-2 outputs so that the constraints imposed on this study by using only MODIS-based aerosol type identification are removed. Such a study should focus on detailed investigations of the MERRA-2 aerosol type information against those used in this study, as well as contained in the standard products of AERONET, MODIS, and MISR, to be of greatest possible import.

6. Conclusions

This study utilizes multi-source aerosol datasets, including MERRA-2, MODIS, and AERONET, to carry out long-term variation assessment of aerosol load, high aerosol load frequency, and dominant aerosol types over Asia. The main conclusions of this study are as follows:
  • Both MERRA-2 and MODIS data can accurately characterize the spatial distribution of AOD values at annual and seasonal scales, and there is adequate spatial agreement between them. The former has significantly higher spatiotemporal integrity than the latter and can support the study of aerosol load over areas with high surface albedo, while the latter has advantages in spatial resolution and accuracy and can reflect the aerosol load fluctuation in local areas more accurately.
  • The aerosol load temporal variation shows that the NCP, Central China, YRD, PRD, Sichuan Basin, and RRD exhibit an increasing trend and then a declining one during the study period. Meanwhile, the IGP area, Deccan Plateau, and the Eastern Ghats show a continuously increasing variation; however, the growth rate of the past decade was lower than that of the first decade.
  • For areas with more serious air pollution (e.g., IGP, NCP), the annual heavy aerosol load frequency given by MERRA-2 is much higher than that of MODIS. The annual HALF given by the two datasets differed numerically; however, the relative changes and trends remained consistent. Thus, the spatiotemporal integrity differences of datasets will directly affect the calculation of temporal variation patterns, but have a less impact.
  • The regional aerosol type information with adequate spatial resolution obtained from MODIS and AROD identification model can be combined with the AOD values and HALF characterization results to explore the key contributors to air pollution and promote the investigation of heavy aerosol loads and the targeted prevention and control of air pollution. MERRA-2 datasets have the potential to support regional aerosol type recognition research; however, the accuracy of AE data and the applicability of AE identification models need to be improved.

Supplementary Materials

The following are available online at https://www.mdpi.com/article/10.3390/rs13163116/s1, Figure S1: The altitude (m) over the study region. Figure S2: Aerosol identification model used in this work (Left: AOD550 vs. AE470-870; Right: AOD470 vs. AROD660/470). Figure S3: Valid data quantity (N), root-mean-square error (RMSE), mean absolute error (MAE), and expected error (EE) envelopes MERRA-2 against AERONET AOD under site scales. Figure S4: N, RMSE, MAE, and EE envelopes MODIS against AERONET AOD under site scales. Figure S5: Spatial distribution of annual average AOD from (a) MERRA-2 and (b) MODIS; (c) correlation; (d) relative difference between MERRA-2 and MODIS AOD during 2000–2019. Figure S6: Annual and seasonal spatial correlation between MERRA-2 and MODIS AOD (0.1°) during 2000–2019 (small black dot on the map denotes p < 0.05). Figure S7: Relative change (%) and variation trend of annual AOD using MERRA-2 and MODIS datasets during 2000–2019 (small black dot on the variation trend map denotes p < 0.05). Figure S8: Relative change (%) of seasonal AOD using MERRA-2 and MODIS datasets during 2000–2019. Figure S9: Variation trend of seasonal AOD using MERRA-2 and MODIS datasets during 2000–2019. Figure S10: Annual frequency of heavy aerosol load using MERRA-2 datasets during 2000–2019. Figure S11: Annual frequency of heavy aerosol load using MODIS datasets during 2000–2019. Figure S12: The differences of the AERONET observations time and time-span over Bac_Giang and Chiang_Mai_Met_Sta. Figure S13: Spatial distribution of (a) CC, (b) DD, (c) MIX, (d) BB/UI, and (e) CM aerosol proportions; (f) the total proportion of five types of aerosols based on MERRA-2 dataset. Figure S14: R, RMSE, RMB, MAE, and EE envelopes. Figure S15: Seasonal spatial distribution of continental (CO), desert dust (DD), mixed (MIX), urban industrial (UI), and biomass burning (BB) type aerosol proportion based on MODIS dataset. Figure S16: Seasonal spatial distribution of first, second, third, fourth, and fifth dominant aerosol type based on MODIS dataset. Figure S17: Annual AOD (2000, 2010, and 2019) using MODIS and MERRA-2 datasets. Figure S18: Relative change (%) and variation trend of annual AOD using MODIS and MERRA-2 datasets during 2000–2019. Table S1: The geographical information of AERONET sites used in this study. Table S2: The geographical coordinates and included AERONET sites of each region.

Author Contributions

Conceptualization, C.H. and Y.Y.; Data curation, W.S. and Q.C.; Formal analysis, C.H.; Funding acquisition, Q.-J.M. and Y.Y.; Investigation, C.H. and Y.Y.; Methodology, C.H., W.S., Q.C. and Y.Y.; Resources, Q.-J.M.; Software, J.L. and W.S.; Validation, Q.C.; Visualization, C.H. and Y.Y.; Writing—original draft, C.H.; Writing—review & editing, C.H., J.L. and Y.Y. All authors have read and agreed to the published version of the manuscript.

Funding

This work was supported by the National Natural Science Foundation of China (52041601) and the National Natural Science Foundation of China (51876147).

Institutional Review Board Statement

Not applicable.

Informed Consent Statement

Not applicable.

Data Availability Statement

Data available on request.

Acknowledgments

A very special acknowledgement is made to the editors and referees who make important comments to improve this paper. We would like to thank the MODIS and MERRA-2 teams as well as AERONET for providing the data used in this study.

Conflicts of Interest

All authors declare that they have no known competing financial interests or personal relationships that could have appeared to influence the work reported in this paper.

References

  1. Chen, Q.; Yuan, Y.; Huang, X.; He, Z.; Tan, H. Assessment of column aerosol optical properties using ground-based sun-photometer at urban Harbin, Northeast China. J. Environ. Sci. 2018, 74, 50–57. [Google Scholar] [CrossRef] [PubMed]
  2. Mhawish, A.; Sorek-Hamer, M.; Chatfield, R.; Banerjee, T.; Bilal, M.; Kumar, M.; Sarangi, C.; Franklin, M.; Chau, K.; Garay, M.; et al. Aerosol characteristics from earth observation systems: A comprehensive investigation over South Asia (2000–2019). Remote Sens. Environ. 2021, 259, 112410. [Google Scholar] [CrossRef]
  3. Ma, Z.; Hu, X.; Sayer, A.M.; Levy, R.; Zhang, Q.; Xue, Y.; Tong, S.; Bi, J.; Huang, L.; Liu, Y. Satellite-Based Spatiotemporal Trends in PM2.5 Concentrations: China, 2004-2013. Environ. Health Perspect. 2016, 124, 184–192. [Google Scholar] [CrossRef] [PubMed] [Green Version]
  4. Ramachandran, S.; Kedia, S.; Srivastava, R. Aerosol optical depth trends over different regions of India. Atmos. Environ. 2012, 49, 338–347. [Google Scholar] [CrossRef]
  5. Yao, W.; Gui, K.; Wang, Y.; Che, H.; Zhang, X. Identifying the dominant local factors of 2000–2019 changes in dust loading over East Asia. Sci. Total Environ. 2021, 777, 146064. [Google Scholar] [CrossRef]
  6. Kuttippurath, J.; Raj, S. Two decades of aerosol observations by AATSR, MISR, MODIS and MERRA-2 over India and Indian Ocean. Remote Sens. Environ. 2021, 257, 112363. [Google Scholar] [CrossRef]
  7. Gueymard, C.A.; Yang, D. Worldwide validation of CAMS and MERRA-2 reanalysis aerosol optical depth products using 15 years of AERONET observations. Atmos. Environ. 2020, 225, 117216. [Google Scholar] [CrossRef]
  8. Che, H.; Wang, Y.; Sun, J.; Zhang, X. Assessment of In-situ Langley Calibration of CE-318 Sunphotometer at Mt. Waliguan Observatory, China. Sola 2011, 7, 89–92. [Google Scholar] [CrossRef] [Green Version]
  9. Che, H.; Zhang, X.Y.; Xia, X.; Goloub, P.; Holben, B.; Zhao, H.; Wang, Y.; Zhang, X.C.; Wang, H.; Blarel, L. Ground-based aerosol climatology of China: Aerosol optical depths from the China Aerosol Remote Sensing Network (CARSNET) 2002–2013. Atmos. Chem. Phys. 2015, 15, 7619–7652. [Google Scholar] [CrossRef] [Green Version]
  10. Li, Z.; Li, K.; Li, L.; Xu, H.; Xie, Y.; Ma, Y.; Li, D.; Goloub, P.; Yuan, Y.; Zheng, X. Calibration of the degree of linear polarization measurements of the polarized Sun-sky radiometer based on the POLBOX system. Appl. Opt. 2018, 57, 1011–1018. [Google Scholar] [CrossRef] [PubMed]
  11. Xia, X.; Che, H.; Shi, H.; Chen, H.; Zhang, X.; Wang, P.; Goloub, P.; Holben, B. Advances in sunphotometer-measured aerosol optical properties and related topics in China: Impetus and perspectives. Atmos. Res. 2021, 249, 105286. [Google Scholar] [CrossRef] [PubMed]
  12. Zheng, Y.; Che, H.; Zhao, T.; Zhao, H.; Gui, K.; Sun, T.; An, L.; Yu, J.; Liu, C.; Jiang, Y. Aerosol optical properties observation and its relationship to meteorological conditions and emission during the Chinese National Day and Spring Festival holiday in Beijing. Atmos. Res. 2017, 197, 188–200. [Google Scholar] [CrossRef]
  13. Mao, Q.; Huang, C.; Zhang, H.; Chen, Q.; Yuan, Y. Performance of MODIS aerosol products at various timescales and in different pollution conditions over eastern Asia. Sci. China Technol. Sci. 2020, 64, 774–784. [Google Scholar] [CrossRef]
  14. Buchard, V.; da Silva, A.M.; Colarco, P.R.; Darmenov, A.; Randles, C.A.; Govindaraju, R.; Torres, O.; Campbell, J.; Spurr, R. Using the OMI aerosol index and absorption aerosol optical depth to evaluate the NASA MERRA Aerosol Reanalysis. Atmos. Chem. Phys. 2015, 15, 5743–5760. [Google Scholar] [CrossRef] [Green Version]
  15. Levy, R.C.; Mattoo, S.; Munchak, L.A.; Remer, L.A.; Hsu, N.C. The Collection 6 MODIS aerosol products over land and ocean. Atmos. Meas. Tech. 2013, 6, 2989–3034. [Google Scholar] [CrossRef] [Green Version]
  16. Mehta, M.; Singh, R.; Singh, A.; Singh, N. Anshumali, Recent global aerosol optical depth variations and trends—A comparative study using MODIS and MISR level 3 datasets. Remote Sens. Environ. 2016, 181, 137–150. [Google Scholar] [CrossRef]
  17. Su, X.; Wang, L.; Zhang, M.; Qin, W.; Bilal, M. A High-Precision Aerosol Retrieval Algorithm (HiPARA) for Advanced Himawari Imager (AHI) data: Development and verification. Remote Sens. Environ. 2021, 253, 112221. [Google Scholar] [CrossRef]
  18. Shi, H.; Li, W.; Fan, X.; Zhang, J.; Hu, B.; Husi, L.; Shang, H.; Han, X.; Song, Z.; Zhang, Y.; et al. First assessment of surface solar irradiance derived from Himawari-8 across China. Sol. Energy 2018, 174, 164–170. [Google Scholar] [CrossRef]
  19. Gui, K.; Che, H.; Zheng, Y.; Wang, Y.; Zhang, L.; Zhao, H.; Li, L.; Zhong, J.; Yao, W.; Zhang, X. Seasonal variability and trends in global type-segregated aerosol optical depth as revealed by MISR satellite observations. Sci. Total Environ. 2021, 787, 147543. [Google Scholar] [CrossRef] [PubMed]
  20. Kumar, A.; Singh, N.; Solanki, R. Evaluation and utilization of MODIS and CALIPSO aerosol retrievals over a complex terrain in Himalaya. Remote Sens. Environ. 2018, 206, 139–155. [Google Scholar] [CrossRef]
  21. Chen, Z.; Torres, O.; Mccormick, M.P.; Smith, W.; Ahn, C. Comparative study of aerosol and cloud detected by CALIPSO and OMI. Atmos. Environ. 2012, 51, 187–195. [Google Scholar] [CrossRef] [Green Version]
  22. Bilal, M.; Nazeer, M.; Nichol, J.E. Validation of MODIS and VIIRS derived aerosol optical depth over complex coastal waters. Atmos. Res. 2017, 186, 43–50. [Google Scholar] [CrossRef]
  23. Wang, Q.; Sun, L.; Jing, W.; Yang, Y.; Li, R.; Liu, Q.; Chen, L. Validation and Accuracy Analysis of Global MODIS Aerosol Products over Land. Atmosphere 2017, 8, 155. [Google Scholar] [CrossRef] [Green Version]
  24. Li, D.; Qin, K.; Wu, L.; Xu, J.; Letu, H.; Zou, B.; He, Q.; Li, Y. Evaluation of JAXA Himawari-8-AHI Level-3 Aerosol Products over Eastern China. Atmosphere 2019, 10, 215. [Google Scholar] [CrossRef] [Green Version]
  25. Si, Y.; Chen, L.; Xiong, X.; Shi, S.; Husi, L.; Cai, K. Evaluation of the MISR fine resolution aerosol product using MODIS, MISR, and ground observations over China. Atmos. Environ. 2020, 223, 117229. [Google Scholar] [CrossRef]
  26. Yang, X.; Zhao, C.; Luo, N.; Zhao, W.; Shi, W.; Yan, X. Evaluation and Comparison of Himawari-8 L2 V1.0, V2.1 and MODIS C6.1 aerosol products over Asia and the Oceania regions. Atmos. Environ. 2020, 220, 117068. [Google Scholar] [CrossRef]
  27. Choi, M.; Lim, H.; Kim, J.; Lee, S.; Saide, P.E. Validation, comparison, and integration of GOCI, AHI, MODIS, MISR, and VIIRS aerosol optical depth over East Asia during the 2016 KORUS-AQ campaign. Atmos. Meas. Tech. 2019, 12, 4619–4641. [Google Scholar] [CrossRef] [Green Version]
  28. Hu, Z.; Jin, Q.; Ma, Y.; Pu, B.; Ji, Z.; Wang, Y.; Dong, W. Temporal evolution of aerosols and their extreme events in polluted Asian regions during Terra’s 20-year observations. Remote Sens. Environ. 2021, 263, 112541. [Google Scholar] [CrossRef]
  29. Gelaro, R.; McCarty, W.; Suarez, M.J.; Todling, R.; Molod, A.; Takacs, L.; Randles, C.; Darmenov, A.; Bosilovich, M.G.; Reichle, R.; et al. The Modern-Era Retrospective Analysis for Research and Applications, Version 2 (MERRA-2). J. Clim. 2017, 30, 5419–5454. [Google Scholar] [CrossRef]
  30. Dacic, N.; Sullivan, J.T.; Knowland, K.E.; Wolfe, G.M.; Oman, L.D.; Berkof, T.A.; Gronoff, G.P. Evaluation of NASA’s high-resolution global composition simulations: Understanding a pollution event in the Chesapeake Bay during the summer 2017 OWLETS campaign. Atmos. Environ. 2020, 222, 117133. [Google Scholar] [CrossRef] [PubMed]
  31. Xu, X.; Wu, H.; Yang, X.; Xie, L. Distribution and transport characteristics of dust aerosol over Tibetan Plateau and Taklimakan Desert in China using MERRA-2 and CALIPSO data. Atmos. Environ. 2020, 237, 117670. [Google Scholar] [CrossRef]
  32. Yousefi, R.; Wang, F.; Ge, Q.; Shaheen, A. Long-term aerosol optical depth trend over Iran and identification of dominant aerosol types. Sci. Total Environ. 2020, 722, 137906. [Google Scholar] [CrossRef]
  33. Jin, Q.; Crippa, P.; Pryor, S.C. Spatial characteristics and temporal evolution of the relationship between PM2.5 and aerosol optical depth over the eastern USA during 2003–2017. Atmos. Environ. 2020, 239, 117718. [Google Scholar] [CrossRef]
  34. Xu, X.; Xie, L.; Yang, X.; Wu, H.; Cai, L.; Qi, P. Aerosol optical properties at seven AERONET sites over Middle East and Eastern Mediterranean Sea. Atmos. Environ. 2020, 243, 117884. [Google Scholar] [CrossRef]
  35. Ali, A.; Nichol, J.E.; Bilal, M.; Qiu, Z.; Mazhar, U.; Wahiduzzaman, M.; Almazroui, M.; Islam, M.N. Classification of aerosols over Saudi Arabia from 2004–2016. Atmos. Environ. 2020, 241, 117785. [Google Scholar] [CrossRef]
  36. Zhao, H.; Gui, K.; Ma, Y.; Wang, Y.; Wang, Y.; Wang, H.; Zheng, Y.; Li, L.; Zhang, L.; Che, H.; et al. Climatological variations in aerosol optical depth and aerosol type identification in Liaoning of Northeast China based on MODIS data from 2002 to 2019. Sci. Total Environ. 2021, 781, 146810. [Google Scholar] [CrossRef]
  37. Chen, Q.; Yuan, Y.; Shuai, Y.; Tan, H. Graphical aerosol classification method using aerosol relative optical depth. Atmos. Environ. 2016, 135, 84–91. [Google Scholar] [CrossRef]
  38. Chen, Q.; Shen, W.; Yuan, Y.; Tan, H. Verification of aerosol classification methods through satellite and ground-based measurements over Harbin, Northeast China. Atmos. Res. 2019, 216, 167–175. [Google Scholar] [CrossRef]
  39. Schmeisser, L.; Andrews, E.; Ogren, J.A.; Sheridan, P.; Jefferson, A.; Sharma, S.; Kim, J.E.; Sherman, J.P.; Sorribas, M.; Kalapov, I.; et al. Classifying aerosol type using in situ surface spectral aerosol optical properties. Atmos. Chem. Phys. 2017, 17, 12097–12120. [Google Scholar] [CrossRef] [Green Version]
  40. Kahn, R.A.; Gaitley, B.J. An analysis of global aerosol type as retrieved by MISR: MISR Aerosol Type. J. Geophys. Res. Atmos. 2015, 120, 4248–4281. [Google Scholar] [CrossRef]
  41. Mao, Q.; Huang, C.; Chen, Q.; Zhang, H.; Yuan, Y. Satellite-based identification of aerosol particle species using a 2D-space aerosol classification model. Atmos. Environ. 2019, 219, 117057. [Google Scholar] [CrossRef]
  42. Penning de Vries, M.J.M.; Beirle, S.; Hörmann, C.; Kaiser, J.W.; Stammes, P.; Tilstra, L.G.; Tuinder, O.N.E.; Wagner, T. A global aerosol classification algorithm incorporating multiple satellite data sets of aerosol and trace gas abundances. Atmos. Chem. Phys. 2015, 15, 10597–10618. [Google Scholar] [CrossRef] [Green Version]
  43. Randles, C.A.; Da Silva, A.M.; Buchard, V.; Colarco, P.R.; Darmenov, A.; Govindaraju, R.; Smirnov, A.; Holben, B.; Ferrare, R.; Hair, J.; et al. The MERRA-2 Aerosol Reanalysis, 1980 onward, Part I: System Description and Data Assimilation Evaluation. J. Clim. 2017, 30, 6823–6850. [Google Scholar] [CrossRef] [PubMed]
  44. Buchard, V.; Randles, C.A.; da Silva, A.M.; Darmenov, A.; Colarco, P.R.; Govindaraju, R.; Ferrare, R.; Hair, J.; Beyersdorf, A.J.; Ziemba, L.D.; et al. The MERRA-2 Aerosol Reanalysis, 1980 Onward. Part II: Evaluation and Case Studies. J. Clim. 2017, 30, 6851–6872. [Google Scholar] [CrossRef] [PubMed]
  45. He, Q.; Zhang, M.; Huang, B.; Tong, X. MODIS 3 km and 10 km aerosol optical depth for China: Evaluation and comparison. Atmos. Environ. 2017, 153, 150–162. [Google Scholar] [CrossRef]
  46. Wei, J.; Li, Z.; Sun, L.; Peng, Y.; Liu, L.; He, L.; Qin, W.; Cribb, M. MODIS Collection 6.1 3 km resolution aerosol optical depth product: Global evaluation and uncertainty analysis. Atmos. Environ. 2020, 240, 117768. [Google Scholar] [CrossRef]
  47. Bilal, M.; Nazeer, M.; Nichol, J.; Qiu, Z.; Wang, L.; Bleiweiss, M.; Shen, X.; Campbell, J.; Lolli, S. Evaluation of Terra-MODIS C6 and C6.1 Aerosol Products against Beijing, XiangHe, and Xinglong AERONET Sites in China during 2004-2014. Remote Sens. 2019, 11, 486. [Google Scholar] [CrossRef] [Green Version]
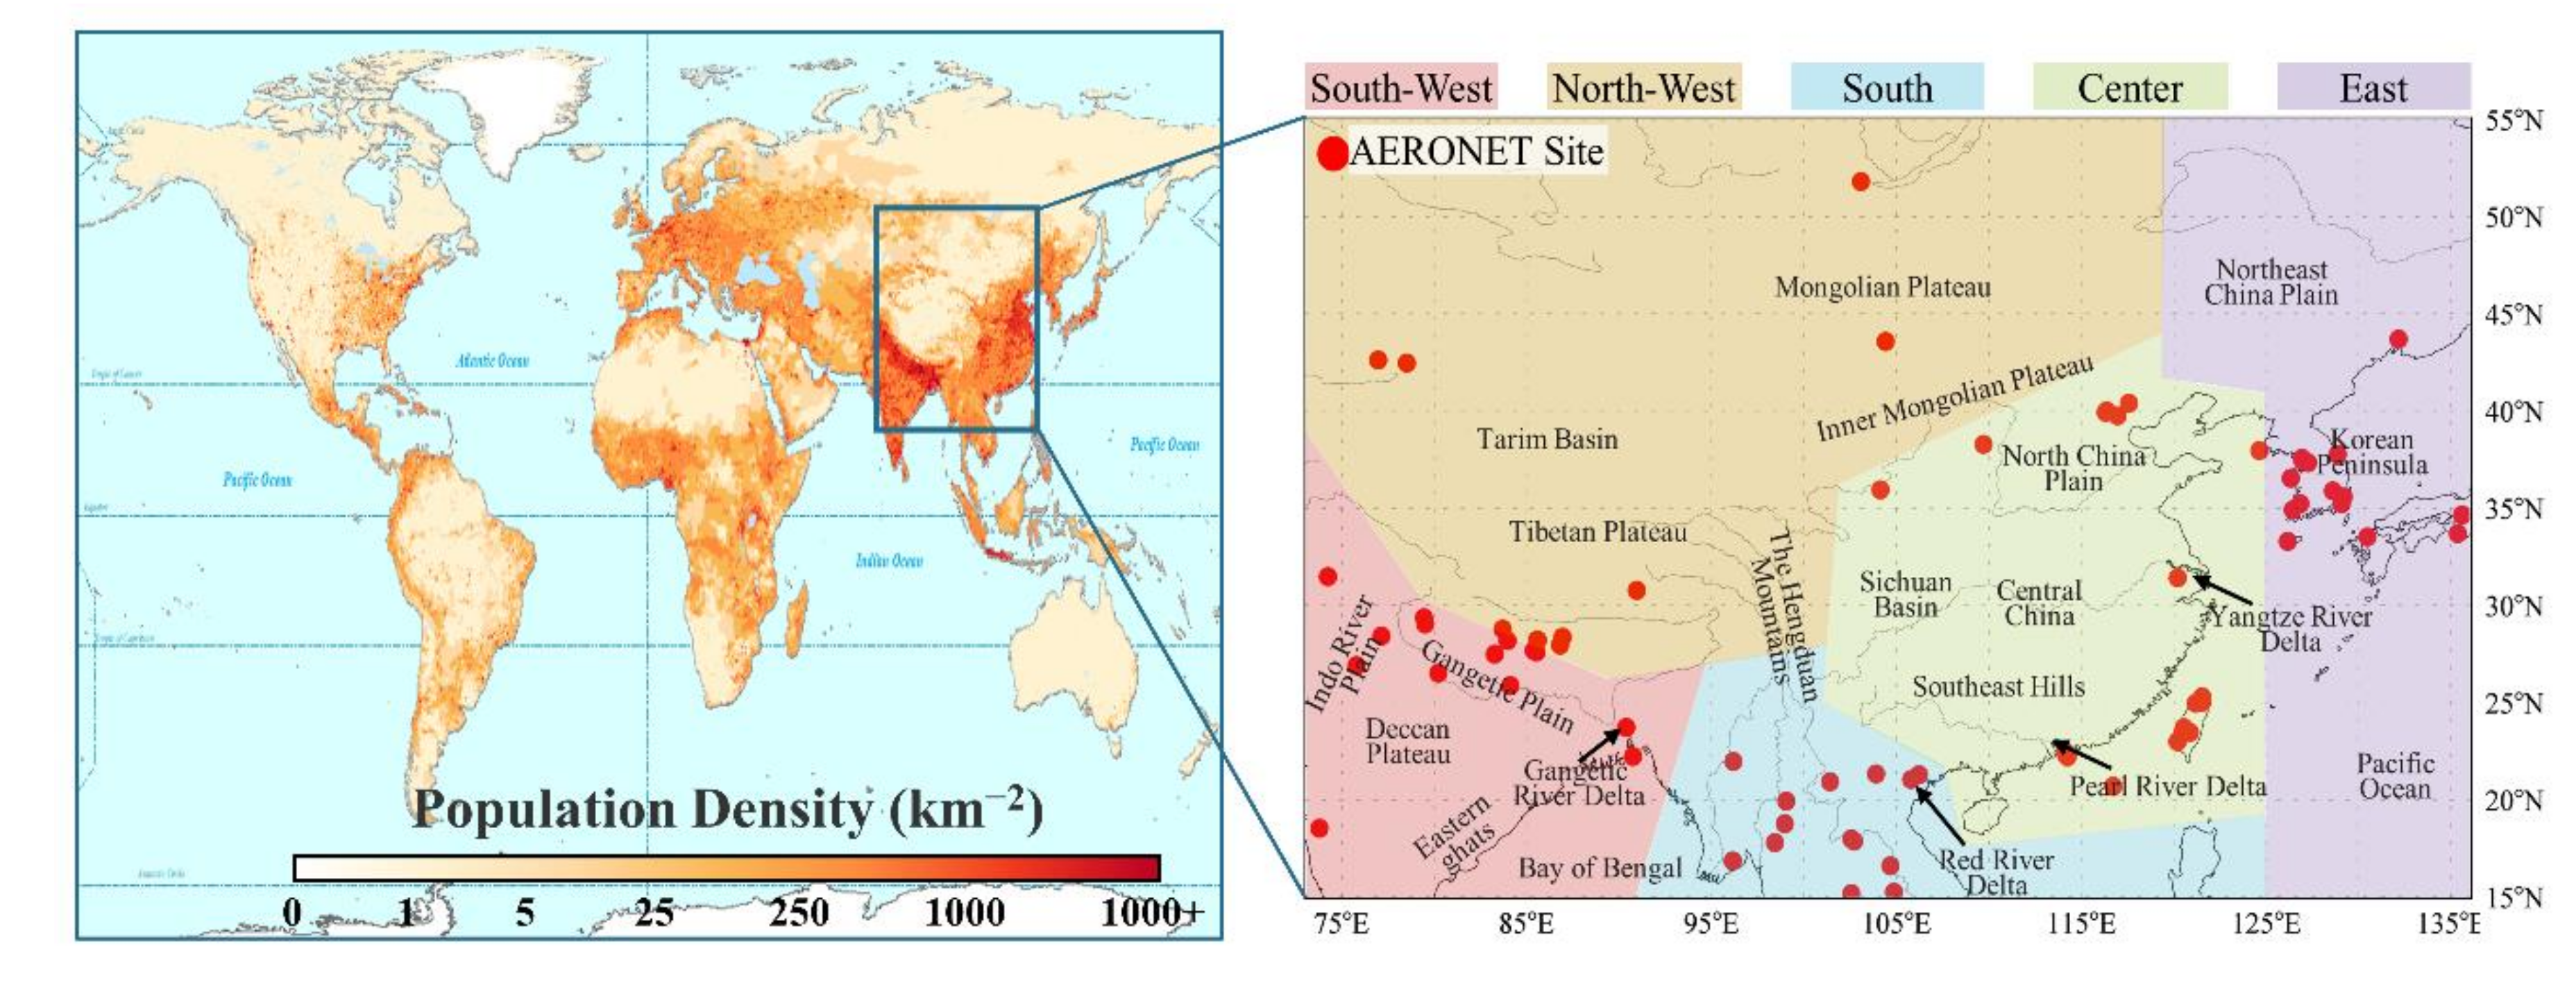
Figure 1. Geographical distribution of the world population density and the location of the study region (73°–136°E, 15°–55°N). Red dots represent the geographical distribution of AERONET sites used in the study.
Remotesensing 13 03116 g001
Figure 2. Workflow for evaluating aerosol load (relative change; variation trend) and identifying dominant aerosol types using MERRA-2, MODIS, and AERONET.
Remotesensing 13 03116 g002
Figure 3. Density scatterplots of (a) MERRA-2 and (b) MODIS AOD against the AERONET AOD. Solid red lines are regression lines. Dotted lines represent the 1:1 line. Dashed lines constrain the expected error (EE) envelopes. Box plots of AOD difference for MERRA-2, MODIS, and AERONET against AERONET AOD (c). Red, blue, and yellow represent difference in MERRA-2 minus MODIS AOD, difference in MERRA-2 minus AERONET AOD, and MODIS minus AERONET AOD versus AERONET AOD, respectively. The black horizontal solid line denotes the zero AOD difference. In each box, the upper, middle, and lower horizontal lines denote 75th, median, and 25th percentiles, respectively.
Remotesensing 13 03116 g003
Figure 4. The R and RMB values of MERRA-2 and MODIS against AERONET AOD under site scales.
Remotesensing 13 03116 g004
Figure 5. Spatial distribution of annual average AOD from (a) MERRA-2 and (b) MODIS; (c) spatial correlation and (d) relative difference between MERRA-2 and MODIS AOD values during 2000–2019.
Remotesensing 13 03116 g005
Figure 6. Relative change and variation trend of annual frequency of heavy aerosol load using MERRA-2 and MODIS dataset during 2000–2019 (small black dot on the variation trend map denotes p < 0.05).
Remotesensing 13 03116 g006
Figure 7. Variation trend of annual AOD using AERONET, MERRA-2, and MODIS datasets over five sub-regions during the study period.
Remotesensing 13 03116 g007
Figure 8. Spatial distribution of (a) CO, (b) DD, (c) MIX, (d) UI, and (e) BB aerosol proportion; (f) the total proportion of five types of aerosols based on MODIS dataset.
Remotesensing 13 03116 g008
Figure 9. Spatial distribution of (a) first, (b) second, (c) third, (d) fourth, and (e) fifth dominant aerosol type; (f) the total proportion of each type for five dominant conditions based on MODIS dataset.
Remotesensing 13 03116 g009
Figure 10. Relative change and variation trend of five aerosol type proportions using MODIS dataset during 2000–2019.
Remotesensing 13 03116 g010
Publisher’s Note: MDPI stays neutral with regard to jurisdictional claims in published maps and institutional affiliations.