Article

Observing and Predicting Coastal Erosion at the Langue de Barbarie Sand Spit around Saint Louis (Senegal, West Africa) through Satellite-Derived Digital Elevation Model and Shoreline

1
Institut de Recherche pour le Développement, LEGOS (IRD/CNRS/CNES/Université de Toulouse), 31400 Toulouse, France
2
Centre National d’Etudes Spatiales (CNES), 31400 Toulouse, France
3
Leidi Laboratory, Department of Geography, Territorial Dynamics and Development, Gaston Berger University (UGB), SN-SL, Saint Louis 46024, Senegal
4
Laboratory of Sedimentology, Department of Geology, Faculty of Sciences and Technics, Cheikh Anta Diop University (UCAD), SN-DK, Dakar 12500, Senegal
5
Service Hydrographique et Océanographique de la Marine (SHOM), 29240 Brest, France
*
Author to whom correspondence should be addressed.
These authors contributed equally to this work.
Remote Sens. 2021, 13(13), 2454; https://doi.org/10.3390/rs13132454
Submission received: 3 May 2021 / Revised: 11 June 2021 / Accepted: 20 June 2021 / Published: 23 June 2021

Abstract

:
Coastal erosion at Saint Louis in Senegal is affecting the local population that consists of primarily fishermen communities in their housing and their access to the sea. This paper aims at quantifying urban beach erosion at Saint Louis, Senegal, West Africa which is located on the northern end of the 13 km long Langue de Barbarie sand spit. The coastal evolution is examined quantitatively over a yearly period using Pleiades sub-metric satellite imagery that allows for stereogrammetry to derive Digital Elevation Models (DEMs). The comparison with ground truth data shows sub-metric differences to the satellite DEMs. Despite its interest in remote areas and developing countries that cannot count on regular surveys, the accuracy of the satellite-derived topography is in the same order as the coastal change itself, which emphasizes its current limitations. These 3D data are combined with decades-long regular Landsat and Sentinel-2 imagery derived shorelines. These observations reveal that the sand spit is stretching, narrowing at its Northern part while it is lengthening downdrift Southward, independently from climatological changes in the wave regime. A parametric model based on a stochastic cyclic sand spit behaviour allows for predicting the next northern opening of a breach and the urban erosion at Saint Louis.

Graphical Abstract

1. Introduction

The African continent contains the largest percentage of dynamic sandy coasts worldwide (66% [1]). Hence, it makes the African continent particularly exposed to sea-level rise and coastal erosion. Given this, and the fact that the majority of the population lives close to the coastline [2,3], it is paramount to understand and act upon identified threats to ensure the sustainability of these coastal environments. This is, even more, highlighted given that 80% of the West African population lives at the coast coinciding with the presence of major mega-cities and infrastructures which need increased protection against increasing hazards [4,5,6]. At the same time, climate change will exacerbate sea level rise and sea hazards, and will compound the current problems [7,8,9]. Coastal management is traditionally carried out by implementing “stabilization” of the cross-shore position and shape of the shoreline. However, this approach has been proven not always effective due to the lack of consideration of the integrated complexity of coastal dynamics [10]. Alternatively, an increasing interest in adaptable, sustainable and effective coastal protection measures to preserve these highly variable sandy coastlines can be observed recently. For example, dynamic cobble revetment and protection that mimic natural beach profiles (see a review [11]), or nature-based solution to anticipate coastal vulnerability due to sea hazards and climate change [12]. These solutions stabilise the upper beach and provide over-topping protection. Before such a solution can be implemented, it is necessary to quantify the morphodynamics of the beach such as the natural trend and variability. In coastal engineering, access to detailed coastal topography is, therefore, crucial [13,14] for the implementation of concrete solutions, planning and risk mitigation [15]. Besides local conventional topography measurements with, e.g., GPS, high-resolution digital elevation models (DEMs) derived from space are emerging as an efficient alternative, covering large regional as sand spits (inaccessible) areas to quantify the evolution of beaches [16,17,18,19,20,21,22].
Sand spits are particularly dynamic areas and their morphological evolution relies on many parameters such as sediment availability, human interactions, or sea-level rise [23,24,25]. The understanding of a sand spit evolution represents a major challenge due to their socio-economic and ecological matters [26,27,28]. This is why the satellite monitoring of sand spits provides the following interests: obtaining data merely with a regional coverage [29], and offering an effective and accurate methodology for monitoring their morphological evolution as it was done on the Douro estuary [30].
Conventional coastal monitoring in situ measurements collected with Real Time Kinematic GPS (RTK-GPS) systems, or newer approaches with drones or video-based techniques [31,32,33,34] are reliable, but limited to the local scale. Yet, to accurately estimate erosional coastal processes, it is essential to fully understand beach morphodynamics at a regional scale. DEMs derived from remote sensing techniques such as airborne LiDAR (Light Detection and Ranging) are among one of the solutions to obtain these data accurately [16] at a larger spatial scale however airborne LiDAR acquisitions remain costly. Alternatively, on-demand optical satellites such as Pleiades (CNES/Airbus) or WorldView-3 deliver images with decimetric resolution and worldwide coverage. These types of satellites embody an interest in the monitoring of rapid evolution such as the impact of a storm on beach erosion at regional scale [19,20,35]. These agile satellites also offer the novel opportunity to derive topography and bathymetry DEMs from a single overpass, [17,36,37], with a vertical accuracy and precision for topography that is similar to state-of-the-art survey methodologies for coastal monitoring (0.35 m R M S E 0.48 m [37]).
This work aims to improve our understanding of the observed severe erosion of the urbanized area of Saint Louis (Senegal, West Africa), a UNESCO world heritage historical city, built on the dynamic Langue de Barbarie sand spit [38,39]. We analyze the local and regional beach dynamics related to the Southwards extension and narrowing of the Langue de Barbarie where a breach was artificially conducted in 2003, leading to morphological lengthening of the sand spit and increased erosion at the Saint Louis urban area. This work also offers a pioneering opportunity to combine regular revisit and long term Landsat and Sentinel-2 missions with new possibilities offered by the sub-metric very high-resolution satellite-derived DEMs in a coastal engineering study with a new detailed regional vision of the topography evolution over time.

2. Materials

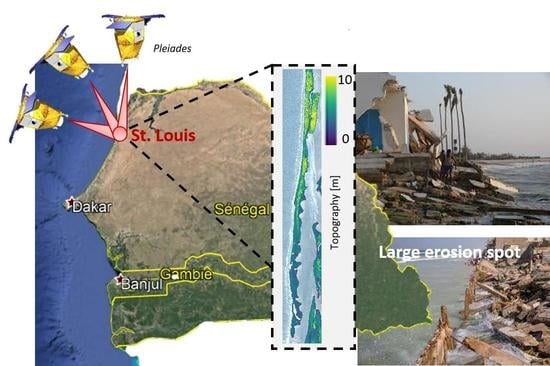
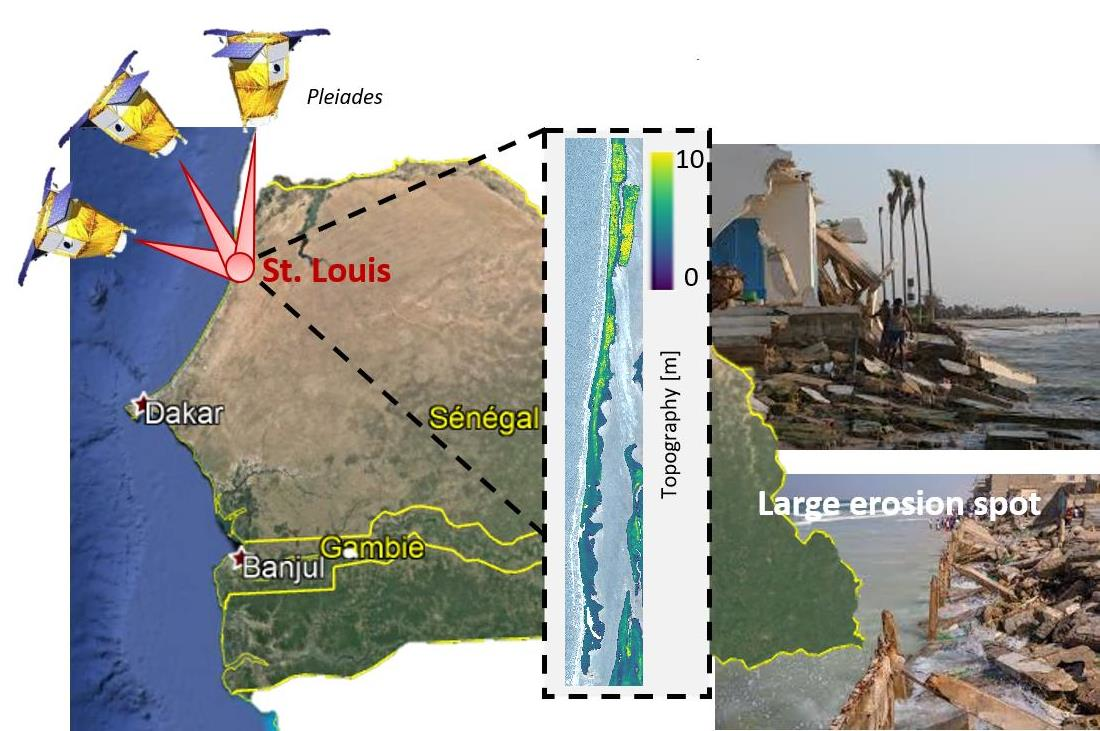
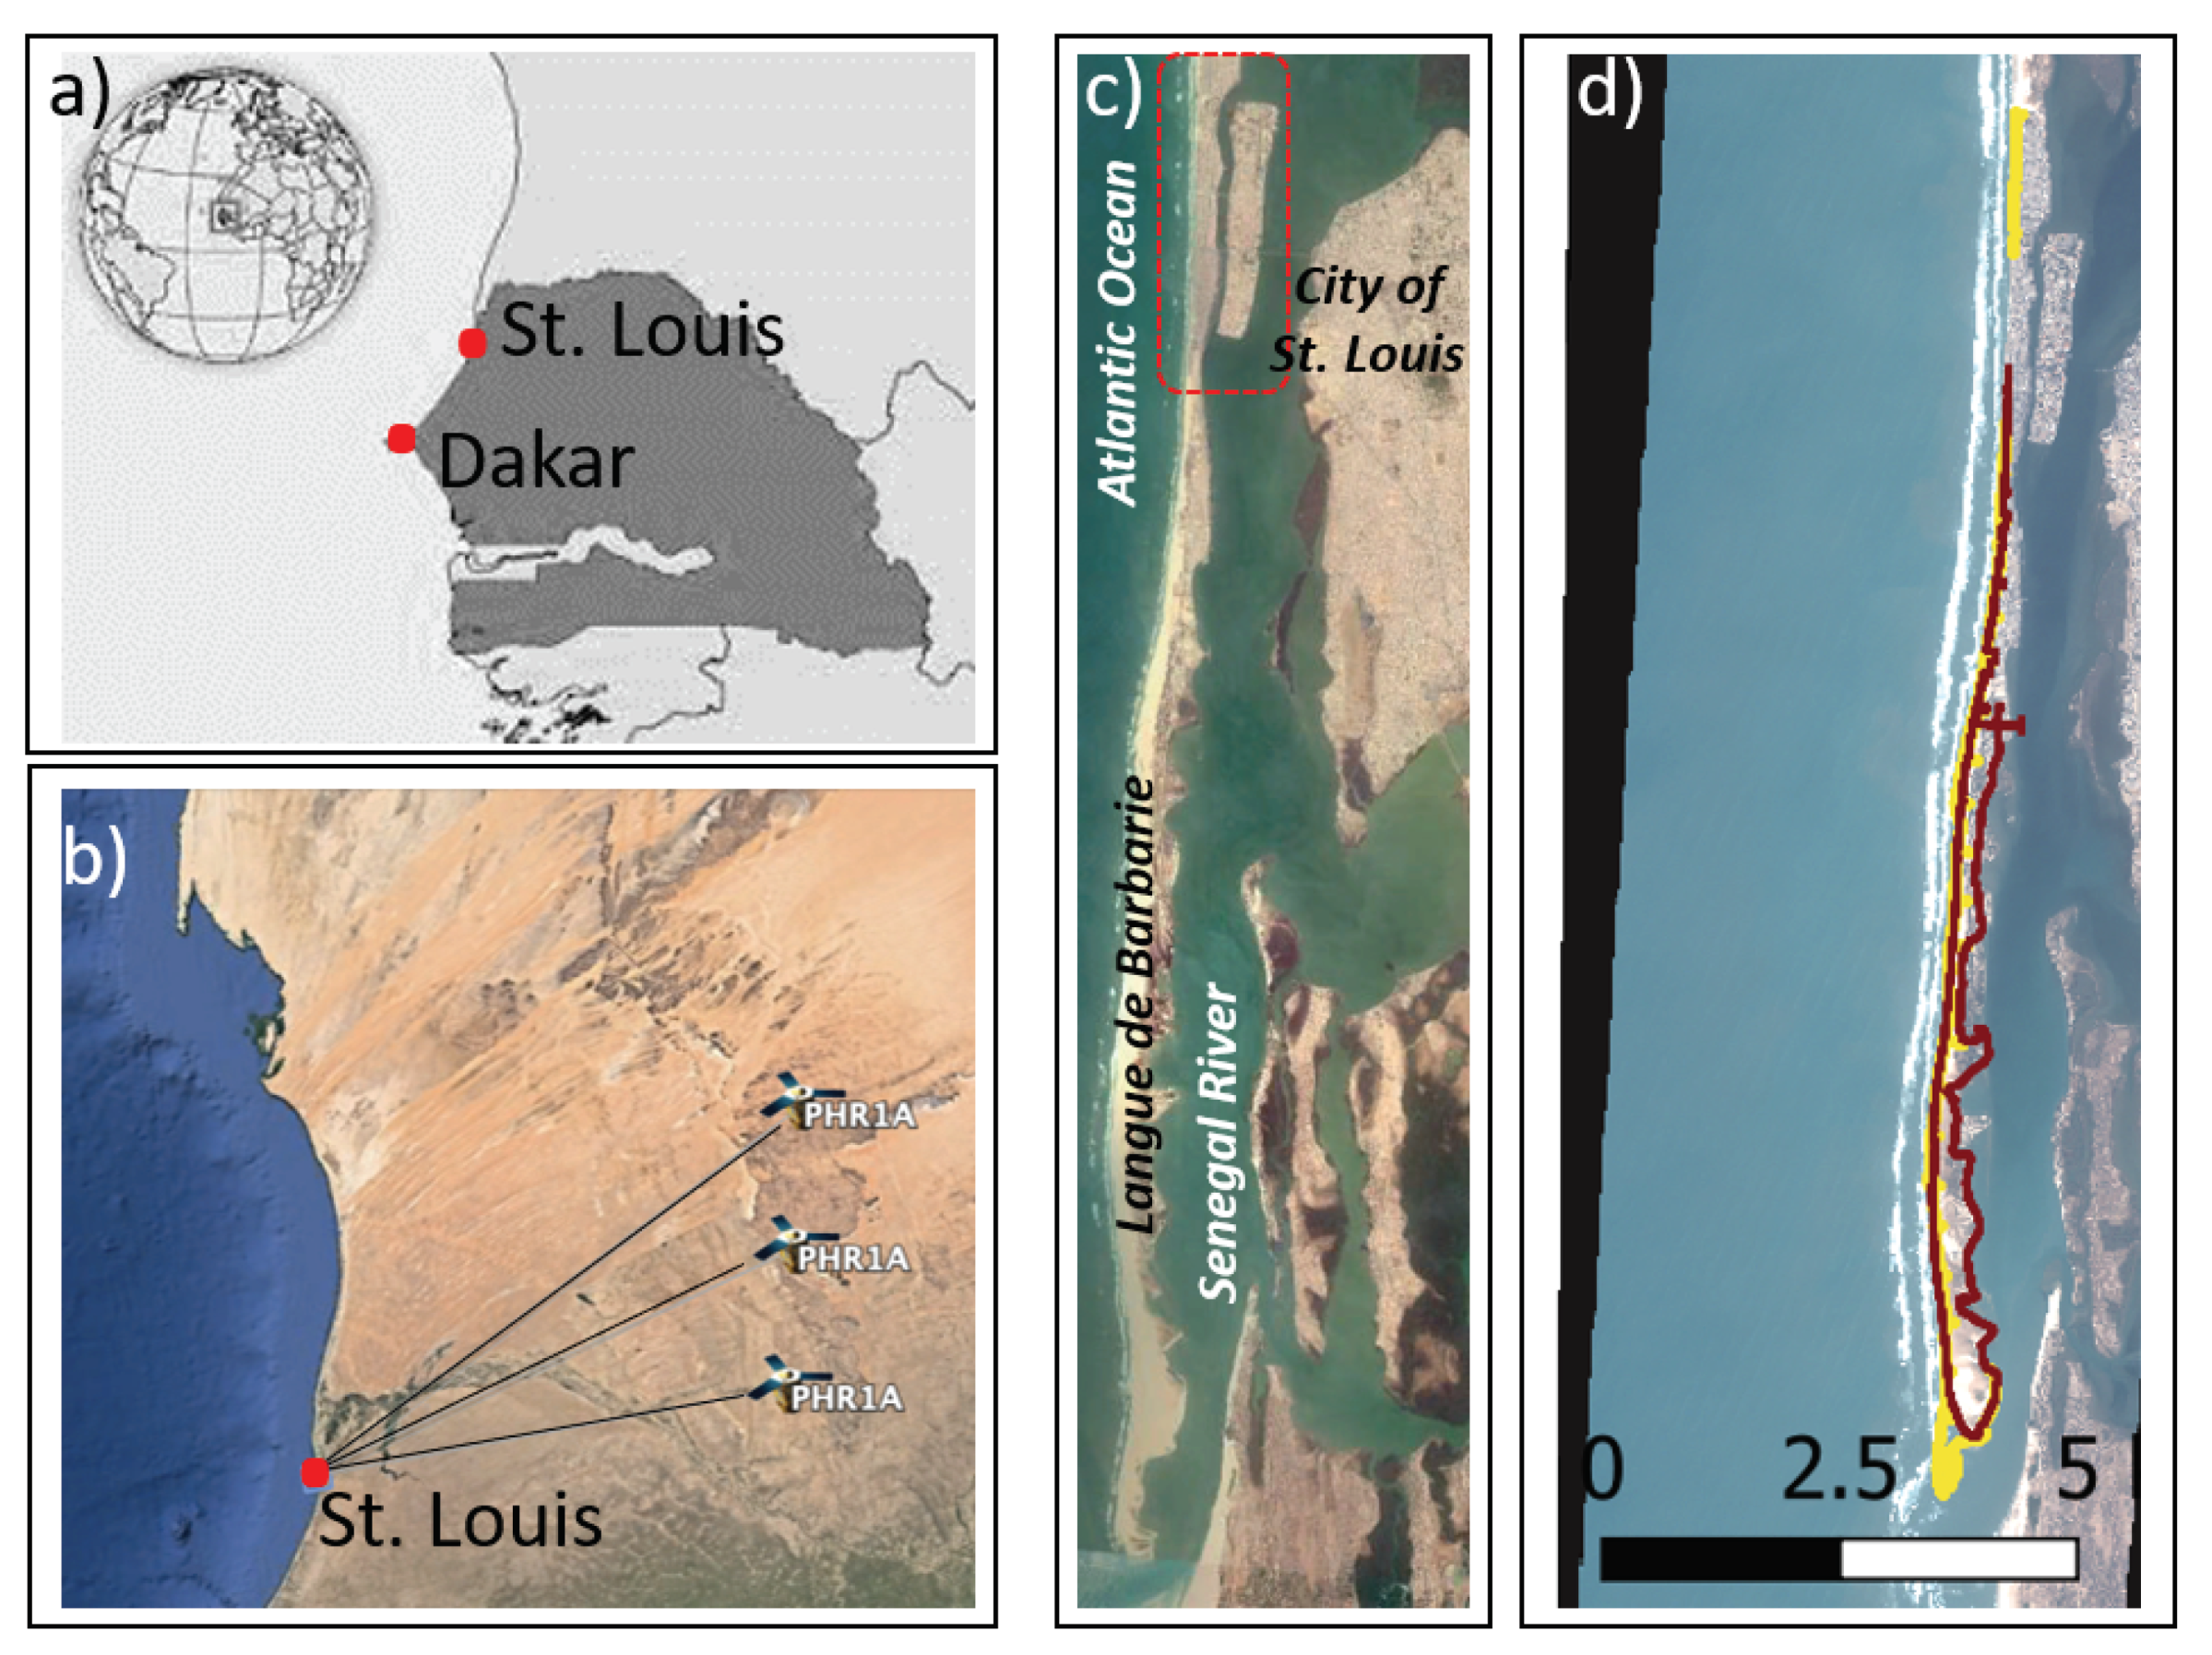
2.1. Study Site: Saint Louis (Senegal)

The Langue de Barbarie (Northern Senegal, Figure 1) is located between Saint Louis and the mouth of the Senegal River and the Atlantic ocean. Due to a strong hydro-sedimentary environment—dominated by strong oblique waves (mainly in the northwest direction) which results in one of the most powerful littoral sediment transports (LST) in the world—the sand spit is very dynamic [38,39]. Thus, the coastline around Saint Louis and the Langue de Barbarie is subject to a large Southwards sediment transport, leading to significant morphological changes and ultimately erosion [38,40]. The tidal regime is semi-diurnal and micro-tidal: 0.5 m at neap tides and 1.6 m at spring tides. Over the last century, the length of the sand spit fluctuated between 10 km and 30 km and primarily migrated Southwards. A major flood in Saint Louis in October 2003 required an urgent decision—an artificial breach was initiated in the barrier island to alleviate extreme water levels on the Senegal River at the city of Saint Louis. The breach which was initially 4 m wide, rapidly widened to function as the new river mouth. The width of the river mouth increased to nearly 2 km in October 2006 and the former river mouth further downstream closed [38,40]. During the post-breach (after 2003) period, the width of the new river entrance stabilized between 0.5 km and 1 km. This stabilisation is linked to a balance between the hydraulic efficiency of the river, including tidal flow, and the energy of the incident waves and sediment bypass [38,41]. From 2003 to 2011, the length of the sand spit, and the position of the river mouth have been stable, while from 2012 onward the sand spit has migrated Southward with a migration rate of about 600 m/year [42]. Simultaneously (after the post-2003 breach), the sand spit has shown cross-shore erosion trends, at a rate of −4.2 m/year [4], which seems to be directly linked to the artificial breach in 2003 [40,42].

2.2. Satellite Images

2.2.1. On-Demand Very High Resolution Pleiades Images

The Pleiades satellites, 1A and 1B—respectively launched in 2011 and 2012—orbit out-of-phase at an altitude of 694 km. In addition to single or (tri)stereo images, the Pleiades constellation has the capability to acquire a burst of up to 12 images during a single pass. At Saint Louis, such burst and tri-stereo images (>3 to 12 images) are collected bi-yearly (Figure 1b). In this work, we use the satellite data collected on the 2 March 2019 and the 11 March 2020. The meteorological conditions for the two satellite acquisitions are given further down. Panchromatic and multi-spectral images were collected with a respective ground pixel-resolution of 0.5 m and 2 m.
The tri-stereo Pleiades images were collected at the across-orbit angle 25 , and 17 , for March 2019 and March 2020, respectively, resulting in a difference of 42 between the two acquisitions. For each of the two acquisitions, the time difference between the individual images is set to d T 6 s. This gives a base to height ratio for the two data sets of B / H = 0.12 . In general, for flat areas a low B/H value gives a better height accuracy of the stereoscopy [43]. The Pleiades images were acquired at an approximately equal tidal elevation of +0.8 m.
Around the same time of the satellite acquisitions (from 2 to 5 March 2019 and 7–10 March 2020), field campaigns were carried out to obtain ground-truth data-sets over a distance 13 km along the Langue de Barbarie (Figure 1c), at low tide conditions (0.8 m). An RTK-GPS system was used to carry out topographic surveys, that serve as the ground-truth to validate satellite-derived topography (Figure 1d).

2.2.2. Regular-Revisit Long Term Landsat and Sentinel-2 Images

Landsat optical satellites were launched by the National Aeronautics and Space Administration (NASA) in 1984 for Landsat 5 (L5), 1999 for Landsat 7 (L7) and 2013 for Landsat 8 (L8). They orbit at an altitude of 705 km and have a cycle of about 16 days. They provide multi-spectral imagery with a 30 m resolution.
Sentinel-2A and 2B were launched in 2013 and 2015, respectively, and are part of the European program Copernicus. They orbit at an altitude of 786 km, the resolution of their imagery is 10 m, and they can revisit the same location every 5 days. Landsat and Sentinel imagery is freely available, and regular visits to the same location provide a wealth of data [29,44]. This allows to monitor a specific area with a good resolution on a regional scale and to follow fast events such as storms.

3. Methods

3.1. Pleiades-Derived Topography

The coastal DEMs (Digital Elevation Models) are derived from the sensor-level Pleiades panchromatic images (0.5 m resolution) using a tri-stereogrammetry method with the AMES Stereo Pipeline (ASP) software [45] to produce a 2 m resolution DEM. Another robust open-access tool—the CNES Algorithms to Reconstruct Surface (CARS)—was also used to produce DEMs of the study site [46,47]. For the tri-stereo methodology—both ASP and CARS—three panchromatic images are taken as input (0.5 m resolution), are correlated pair by pair, and then a final correlation between the two correlated pairs gives the output DEM. Both methods use the Rational Polynomial Coefficient (RPC)—which is provided with the imagery—and gives a relationship between the satellite image coordinates and the ground coordinates. The planimetric coordinates were referenced to the ellipse and the resulting DEM was subsequently orthorectified.
Then a co-registration algorithm that removes DEM offsets, checks for altitude-dependent biases, checks for sensor-specific and higher-order altitude-related biases [48] is applied. This algorithm. [49] is developed based on the method of Nuth and Kääb [48], and is a robust analytical solution based on the residuals of the pairwise elevation difference, and the aspect and slope of the study site to correct for bias and errors between the DEMs. Finally, all the resulting DEMs were vertically fixed using a set of ground control points (GCPs) collected during the in situ acquisitions of March 2019. It is only after this post-processing sequence that the DEMs [50] of March 2019 and March 2020 are compared to infer a Spatio-temporal evolution of the Langue de Barbarie.
The AMES Stereo Pipeline software has a feature that ortho-rectifies a sensor-level satellite image using its geometry by the accompanied RPC file, and in the process creates a DEM at a set resolution [45]. The method is as follows: a DEM is calculated from three raw satellite images (panchromatic or multispectral) using the tri-stereogrammetry method described above. This DEM is automatically ortho-rectified, after which the satellite images at the sensor are projected onto the DEM [45], so that the output images are fully ortho-rectified.
To validate the satellite-based topography method, an inter-comparison between in situ data and Pleiades-derived topographies has been realized Section 4.1. DEMs were individually median-filtered in two dimensions (over 10 m longshore, and 5 m cross-shore). The obtained beach profiles were averaged and the vertical offset between the Pleiades data and the in situ data has been removed from the Pleiades data.
The uncertainty of the method at the lower beach related to high-frequency unresolved hydrodynamics is estimated using the swash excursion length, computed as follows:
s w a s h = 1.1 2 ( 1.56 T 2 H S ( 0.5625 β 2 + 0.004 ) ) 1 2
wherein T is the wave period, H S the significant wave height and β the beach slope derived from Pleiades imagery. This equation is the up-to-date reference formulation relevant for a wide range of conditions [51,52].

3.2. Multi-Sensor Shorelines

Waterlines are detected from the ortho-rectified satellite imagery using the Normalized Difference Water (NDW) index in Section 4.2. The NDWI is a fraction between the green and near infra-red bands.
N D W I = G r e e n b a n d I n f r a R e d b a n d G r e e n b a n d + I n f r a R e d b a n d
As water bodies largely absorb light in the visible to the infrared electromagnetic spectrum domain, NDWI uses green and near-infrared bands, respectively, G r e e n b a n d and I n f r a R e d b a n d parameters in Equation (2) to identify water bodies [53]. Once waterbodies are distinguished, the shoreline is determined as the intersect between these bodies. The calculated NDWI ranges values [ 1 ; 0 ] representing bright surfaces with no vegetation or water content. The shorelines mapped Figure 5 are derived from Landsat and Sentinel-2 satellite imagery using the open-access tool CoastSat [44]. This python toolkit uses Landsat 5-7-8 for 2003 to 2014, and Sentinel-2 for 2015 to 2020 data from Google Earth Engine, and provides multi-year time series of any sandy coast in the world. Cropping those images around our study site enabled the easy retrieval of the Langue de Barbarie shorelines and tip positions. To be consistent with the Pleiades data, the shorelines have been mapped around March for each year. Sentinel-2 imagery allows coastal monitoring of fast events as it can revisit the same location within few days (approximately every 5 days for our study site) [29].
The volume of beach sand was calculated by multiplying the area of the sand spit tip obtained from the coastlines (CoastSat [44]) and the mean land height obtained from Pleiades DEMs. To properly understand the magnitudes obtained on the sand volumes of the tip of the Langue de Barbarie, the annual LST was calculated from the ERA5 data by annually averaging the results from Kaczmarek [54], Kamphuis [55], and Bayram’s formula [56]. The spit growth rates, derived from that LST estimates, has been computed as follows:
R S = Q B S ( D B + D C )
wherein Q is the LST, B S the constant spit width, D B the berm height and D C the depth of closure [27].

4. Results

4.1. Comparison with Ground Truth

Three cross-shore transects (TA, TB and TC; Figure 2a) have been selected on the Langue de Barbarie sand spit to illustrate the performance of the satellite-derived topography in comparison to the field data. These cross-shore transects are at the same location for the 2019 and 2020 data sets. For the inter-comparison, the DEMs used are the ones produced with ASP [45], as the RMSE is higher than 3 m for the DEMs produced with CARS [46,47].
The beach profiles are generally well captured by the Pleiades derived topography (Figure 2a) considering a root mean squared error between 0.71 m R M S E 1.19 m in March 2019, and 0.97 m R M S E 1.07 m in March 2020 (Table 1). The overall RMS errors for 2019 and 2020 are R M S E 2019   = 1.31 m and R M S E 2020   = 1.15 m, respectively. Considering that the in situ surveys and Pleiades acquisitions were few days apart, small morphological changes may have occurred at the lower-beach zone within this period resulting in minor differences. It is also apparent that the stereoscopy method underperforms in 2019 at the lower beach face as for 0 m to 30 m cross-shore no topography could be derived (Figure 2b).
The annual change in topography can be observed on the beach cross-shore transects (Figure 2b). An accretion is observed at the Northern transect, which is closer to the urban area according to Figure 1c, and the beach seems relatively stable for the other two (TB and TC ; Figure 2b). TA shows a greater discrepancy with in situ measurements than the other two transects. This can be explained by the particularly energetic wave climate during the 2019 survey (Table 2)which can impact the lower beach [57].
To estimate the extent of the lower beach swash zone related uncertainty, the horizontal swash excursion has been calculated using an empirical parametrization Equation (1) and ocean forcing (Table 2) with a constant beach slope β 4% (value estimated in Section 4.2). For 2019, the horizontal swash excursion is estimated at ≃31 m and ≃12.9 m in 2020. The projected horizontal tidal excursion for both acquisitions is ≃20 m. This width seems to correspond to the 2019 Pleiades lack of data, as emphasized in Figure 2b.

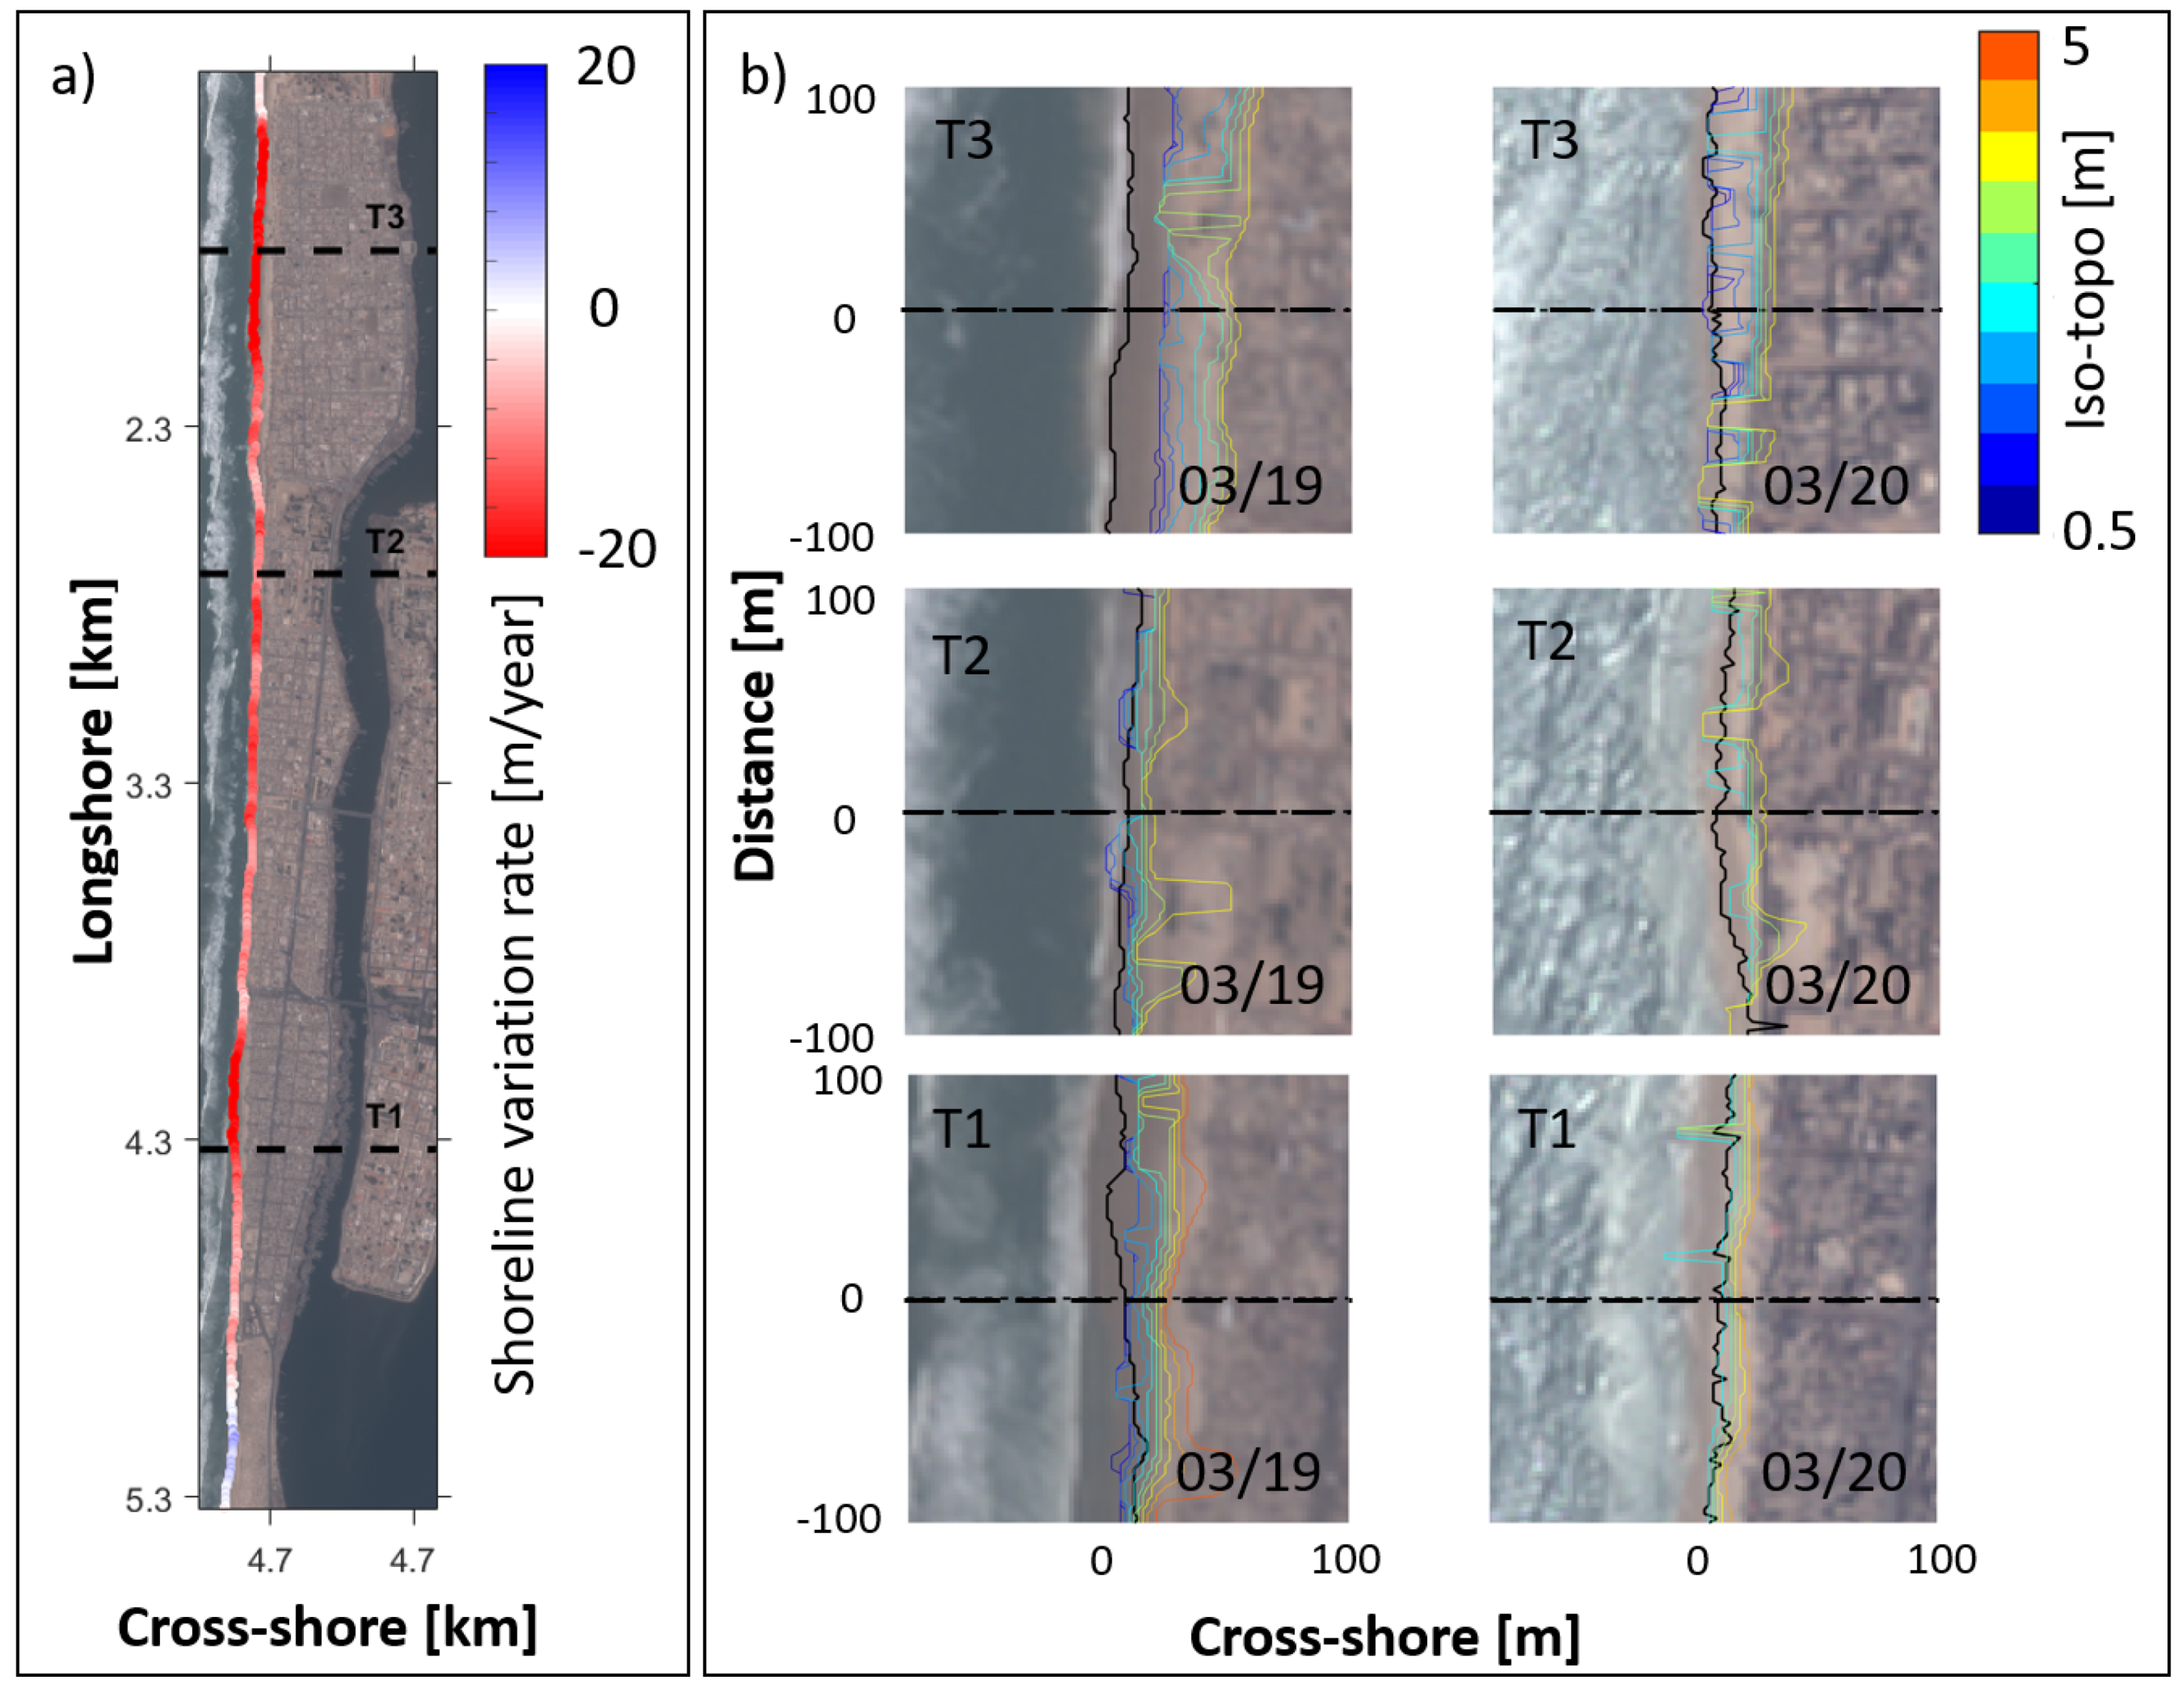
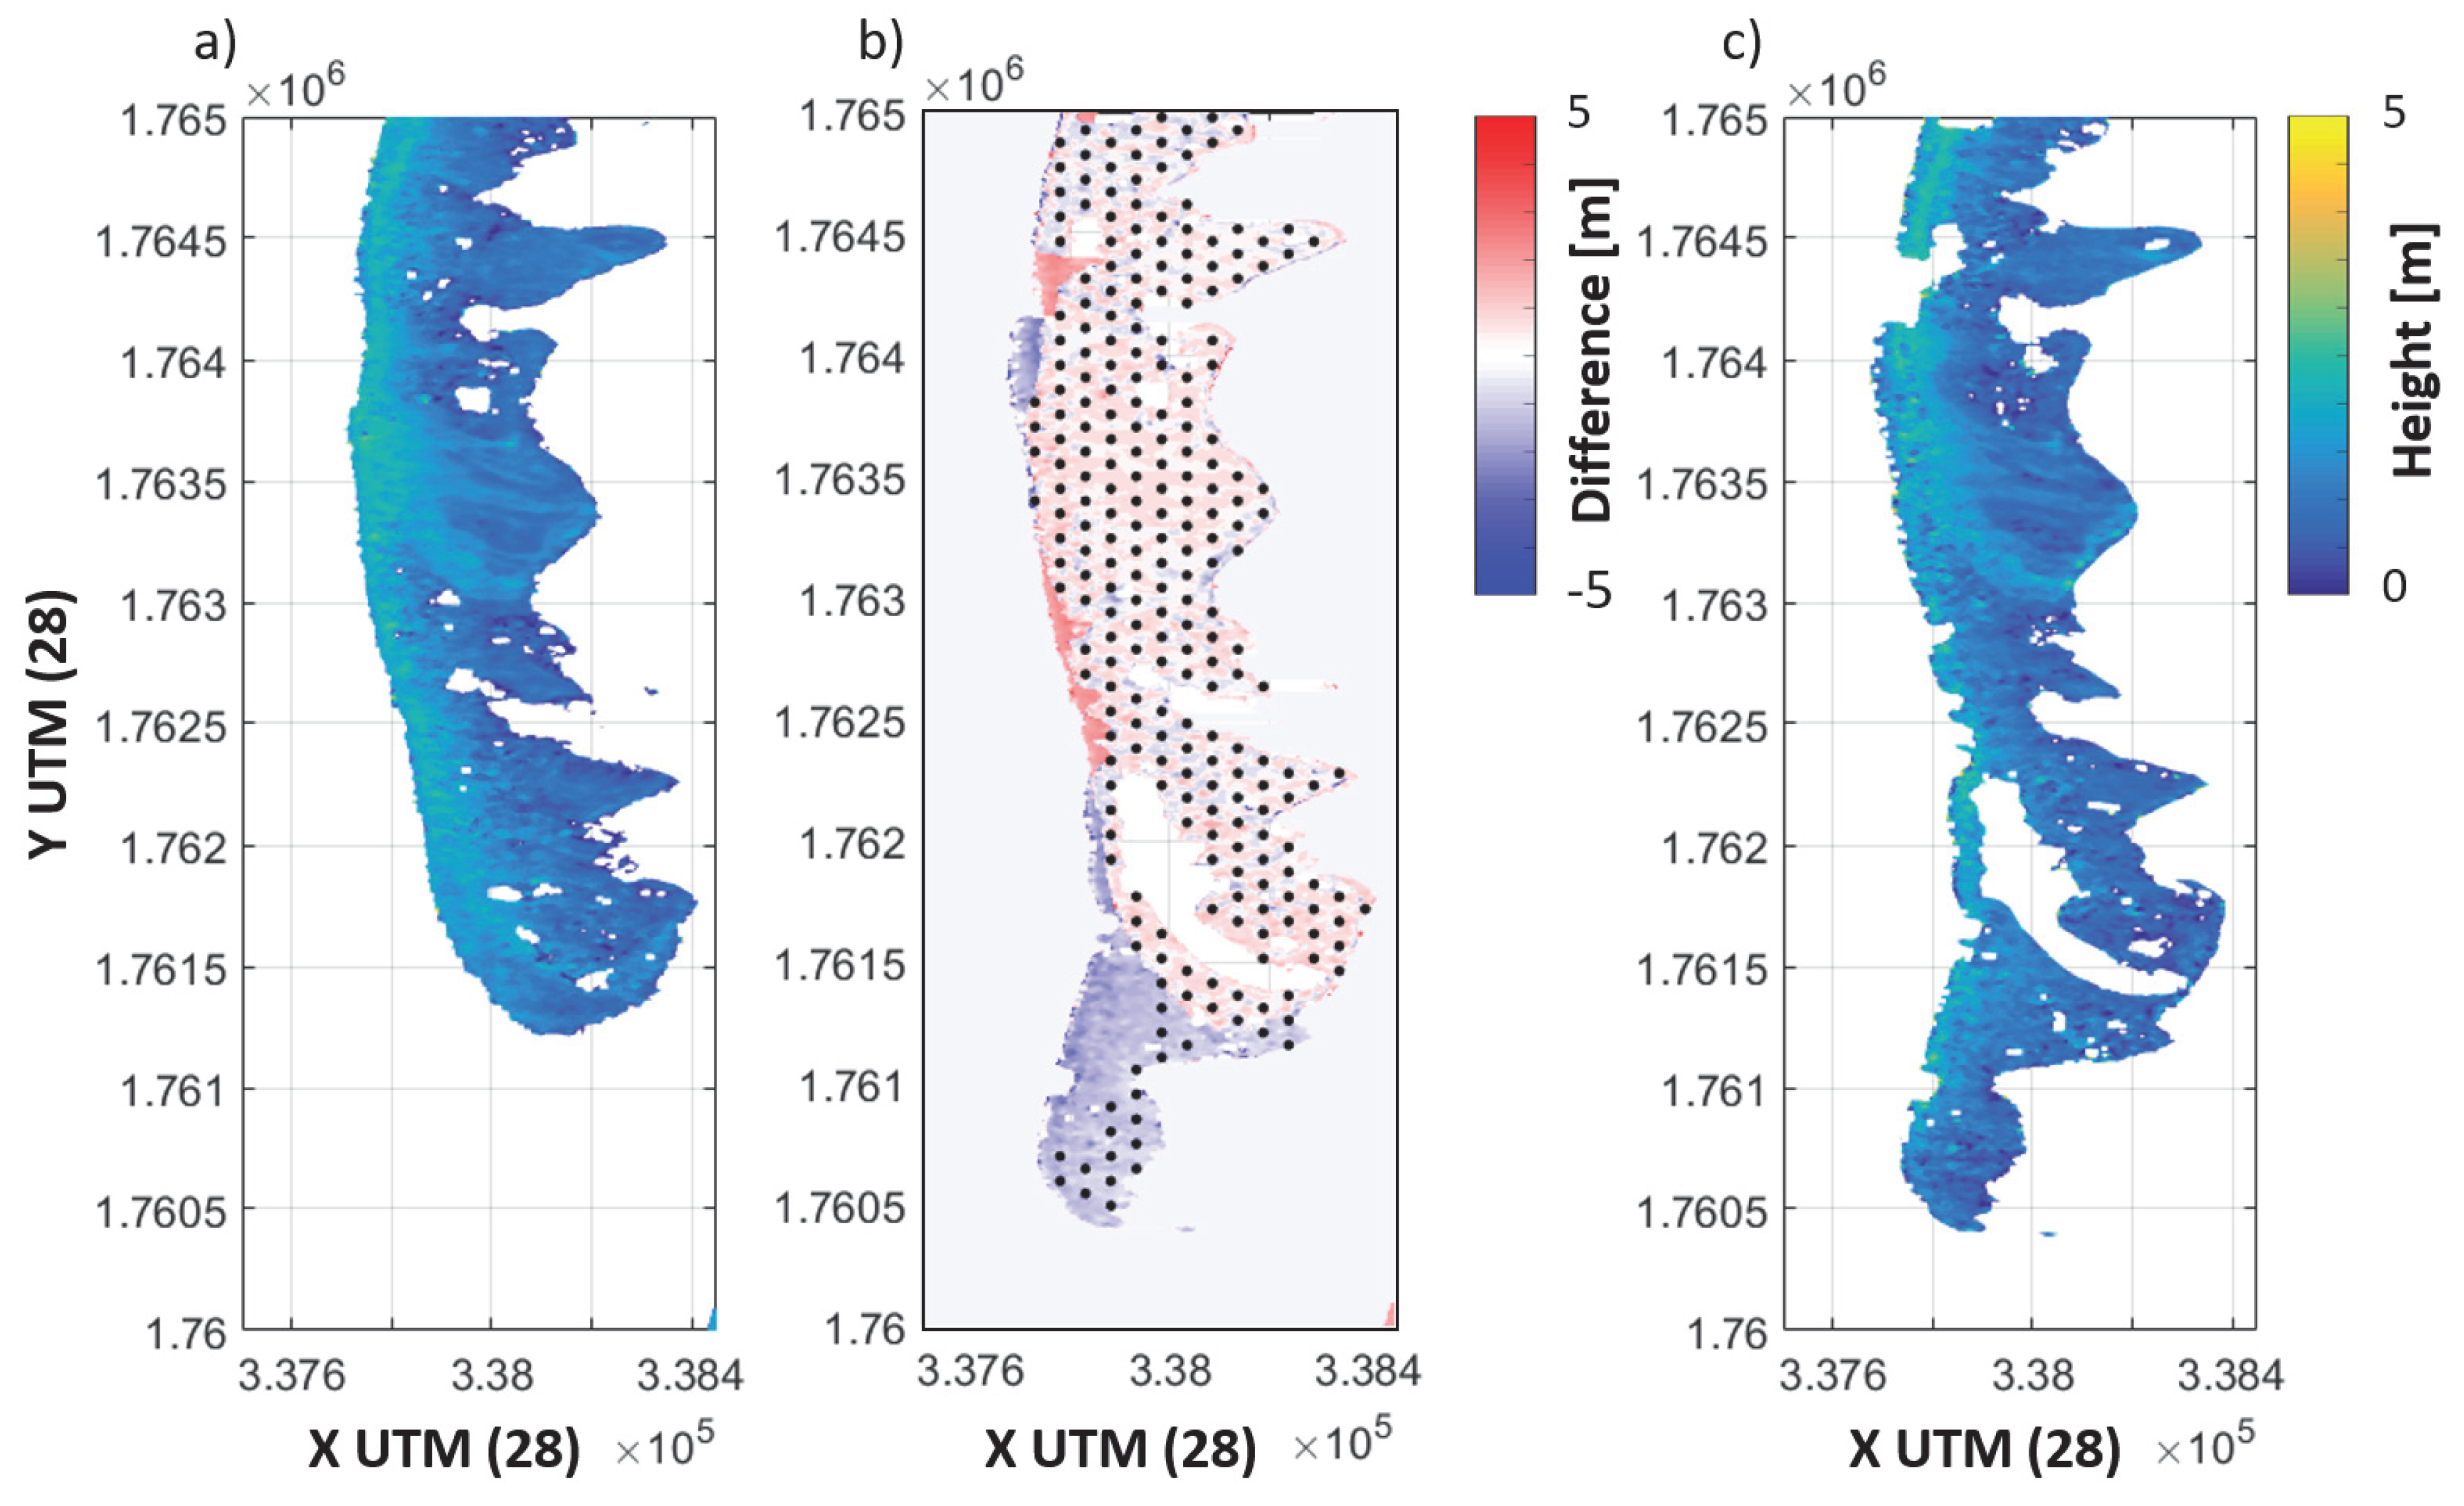
4.2. Erosion within the Urban Area

Figure 3a, the shoreline changes were calculated from the difference between the 2019 and 2020 waterline position. Two cross-shore transects that experience the largest rates of shoreline change were selected (100 m D i s t a n c e 400 m corresponding to T3, and 1400 m D i s t a n c e 1500 m corresponding to T1, Figure 3a).
The iso-topographies position (Figure 3b) allows an estimate of the average slope of the beach at ≃4%, and shows a beach-narrowing that is also visible on the zoomed satellite images (Figure 3b). This narrowing is particularly noticeable for transects T1 and T3, where the rates of shoreline change are the highest: ≃−20 m/year for both (Figure 3a). The beach at T2 seems stable and its rate of shoreline change is lower (≃−5 m). However wave conditions were different between the two Pleiades acquisitions: as the tide was the same (0.8 m—low tide conditions; Table 2), the swell was more energetic in 2019 resulting in a more expressed beach run-up.
A previous study explained the observed erosion trends in the urban area from 2004 to 2020 (North side of Saint Louis—corresponding to transect T1; Figure 3b) as a response to the 2003 Langue de Barbarie breach [42]. Not only an erosion trend was identified, but the erosion rate has also accelerated over the last two decades (from 2000 to 2020) in the vicinity of the fish market [42]. The erosion trend is still observable from the Pleiades satellite imagery in the urban area (Figure 3).

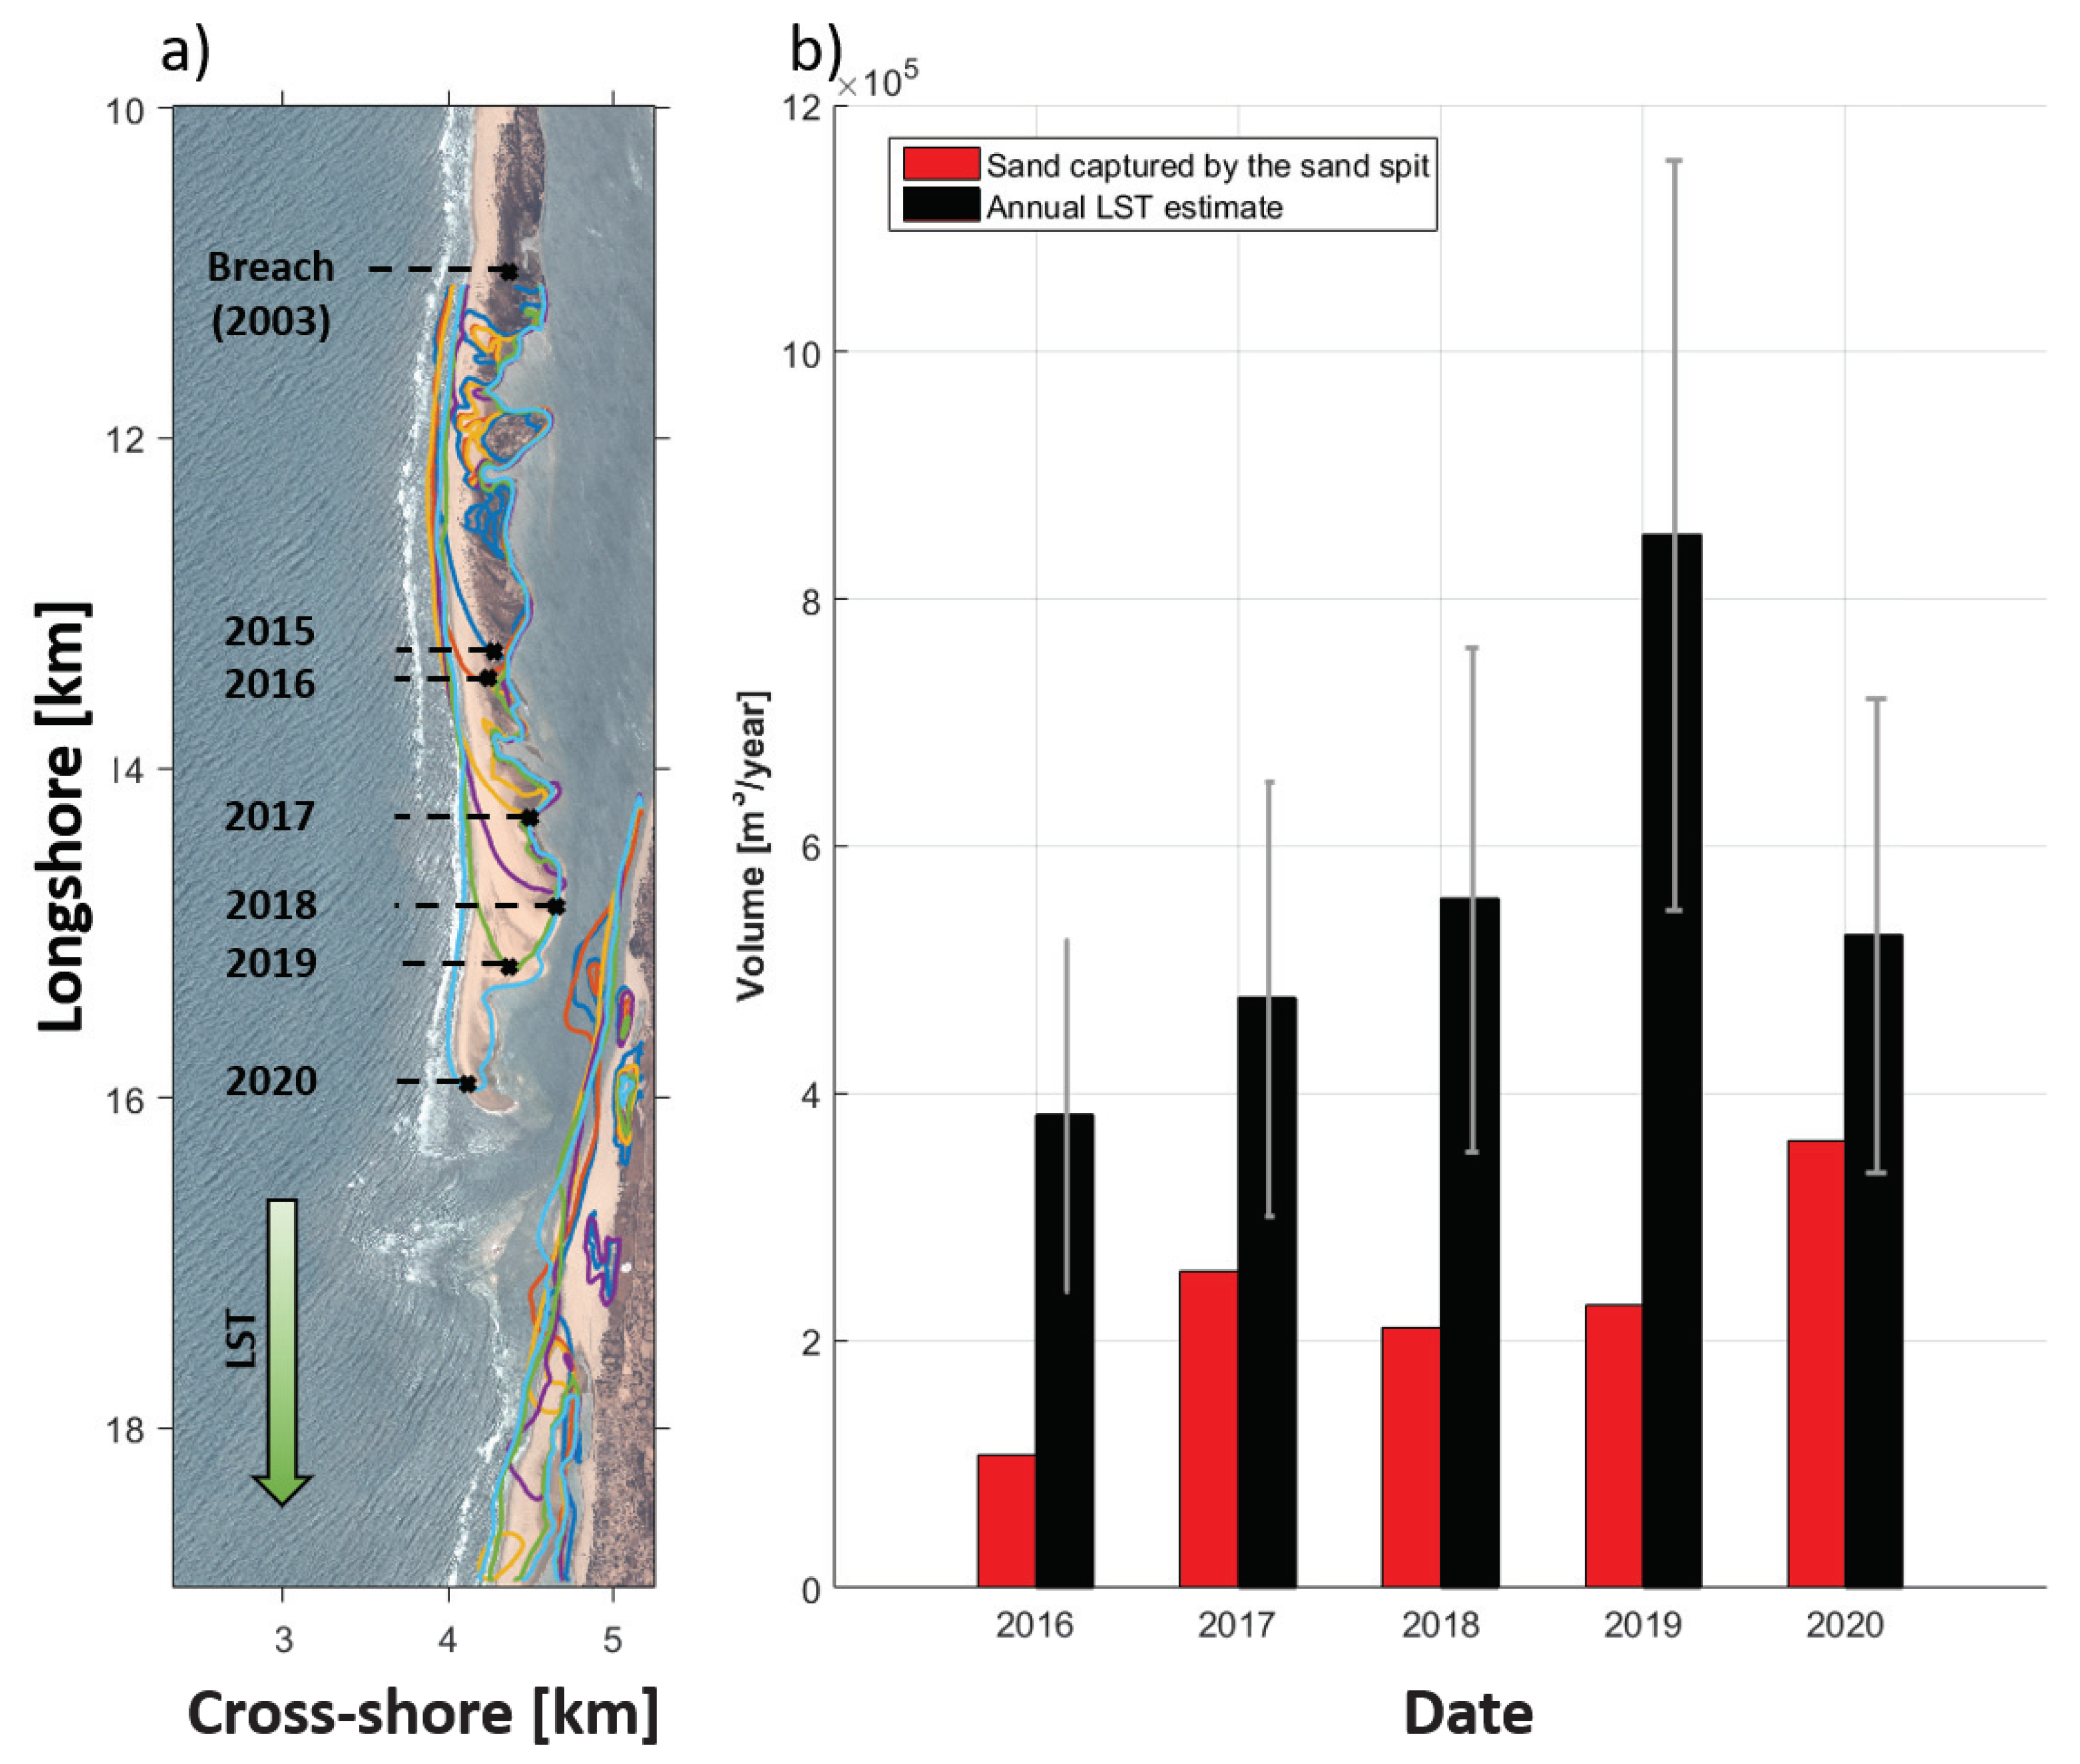
4.3. Sand Spit Extension

Figure 4a,c shows that from 2019 to 2020, the length of the sand spit increased and the Langue de Barbarie stretched southward at an average migration rate of 740 m/year. The inland sand spit remained stable, and the Southern part of the spit gained a large volume within a year (Figure 4b). The spots that lost volume on the Atlantic ocean side (Figure 4b) are immediately followed by spots that gained volume in the Southern direction, which is also the direction of the LST.
The longshore sediment transport rates, provided by the SOGREAH firm (1994) [38,42,58], give a drift volume from North to South which ranged between 600 to 700 × 10 3 m 3 /year, and appears to be the direct cause of the southward stretching and narrowing of the sand spit in the northern part (Figure 4a,c). The accretion at the Southern tip of the sand spit is particularly noticeable in Figure 4b represented by the red colours. A large portion of the inland sand spit remained stable with a vertical change inferior to 1 m—stippled area Figure 4b—between 2019 and 2020. One can notice that the major morphological changes occurred at the Southern tip of the Langue de Barbarie, and several spots along the Atlantic face of the sand-spit.
Over the region of interest determined Figure 5a, the average topography elevation was estimated to be H a v e r a g e = 1.07 m with the 2019 and 2020 Pleiades DEMs. Migration rates tremendously vary over the past 5 years (Table 3), as does sand volume dragged from North to South by the LST and captured by the sand spit which shows great variability (Figure 5b). From 2015 to 2020, the alongshore migration of the sand spit is averaged to be approximately 230 × 10 3 m 3 / year . This represents 35 % of the North to South drift volume ([38,39]), meaning that the sand spit extension has the potential to capture a large quantity of the alongshore sand drift.
The coastlines shown in Figure 5a are derived from Sentinel-2 satellite imagery with the CoastSat tool [44] highlight the southward accretion trend of the Langue de Barbarie over the last 5 years. Since 2015, the position of the tip of the sand spit has shifted increasingly southward, with migration rates ranging from 160 m/year to 870 m/year (Table 3).
The calculated migration rates based on a sand conservation Equation [27], and thus the LST (Table 3), show here a large difference with the satellite-derived observations, proving that the southward sand spit growth is not only ruled by climate control on wave regime but has an intrinsic dynamics. Based on the sand spit tip positions from 2015 to 2020, and the median LST ( Q = 530 × 10 3 m 3 /year), a parametric model of the Langue de Barbarie sand spit intrinsic stochastic growth over time t can be expressed as:
x L = 1.85 × 10 6 Q ( t T ) 4.46 × 10 6 Q
With p v a l u e 0.01 , x being the position of the tip of the spit from the northern end, and L representing the maximum spit extension value ( L = 32 km). The T value represents a cycle duration (here T = 35 year, derived from the extrapolation of the fitted data Figure 6a). Here we define a spit cycle as the moment when the elongation of the Langue de Barbarie reached its maximum, causing the closure of the mouth of the Senegal River when x L 1 . According to our model, the sand spit migration rates increase with time, which is consistent with the Coastsat-derived migration rates (Table 3). Similarly, the spit width W averaged over an alongshore distance of 1 km at transect Y—which is located at 1 km South of the defined urban area and represented Figure 2a—can be expressed as:
W W m a x = t T 2 t T + 1
With p v a l u e 0.01 , and W m a x = 354 m the maximum width at transect Y. We can first observe a phase of rapid decrease of the sand spit width since 2008—that decrease being correlated with the southwards lengthening of the Langue de Barbarie (Figure 6)—and a second phase of a width accretion. Considering Equation (5), the erosion trend of the beach located under the urban area will reduce and inverse to accretion after 2030 (Figure 6b).
Cycle 1 is defined from the start of Landsat data acquisitions in 1984, to 2003 which is the date of the artificial breach, as shown in Figure 6. Cycle 2 is the new sand-spit cycle initiated after the spit breaching. Considering our modeling, we can estimate that the river mouth will probably close around 2040.

5. Discussion

5.1. Satellite-Based Coastal Monitoring for Coastal Engineering: Potential Strengths

This work shows the potential of very high-resolution satellites use for coastal monitoring, and in particular, the monitoring of sediment dynamics (review in [18]) and quantifying spatial and temporal volumetric beach evolution [22,59]. Satellites cover larger regions than classical surveys methods, allow an overall understanding of beach morphodynamics, enable the accessibility of remote data sources and open the possibility of forthcoming precision improvements. Satellites make it possible to have a large bank of data available over a long time period in developing countries. The erosion rate and shoreline position derived from Pleiades and Sentinel-2 time series allows to identify of the most vulnerable hot-spots along this coastal stretch (Section 4.2), and emphasizes the role of large-scale dynamics to study small scale beach dynamics. This is highlighted by the erosion trend in the urban area (Northern Langue de Barbarie), and the stretching of the sand spit towards the South while the Northern part is narrowing (Section 4.3). This erosion is probably a joint result of sequestering of part of the sand load transported by the LST in the post-2003 breach—which is now the new river-mouth—and a reinforced tidal prism through this new mouth [40,60].
The potential of very high-resolution satellites, such as Pleiades, for coastal monitoring, has been highlighted in our study, and the investigation on the Saint Louis coastline changes will continue. A protection structure is to be built from December 2020 to protect the urban area in the North part of the sand spit [61], and to protect the most threatened inhabitants. After assessing pre-construction beach variability to design the structure, the satellite monitoring will continue to monitor the efficiency of that protection, and its impact downstream.

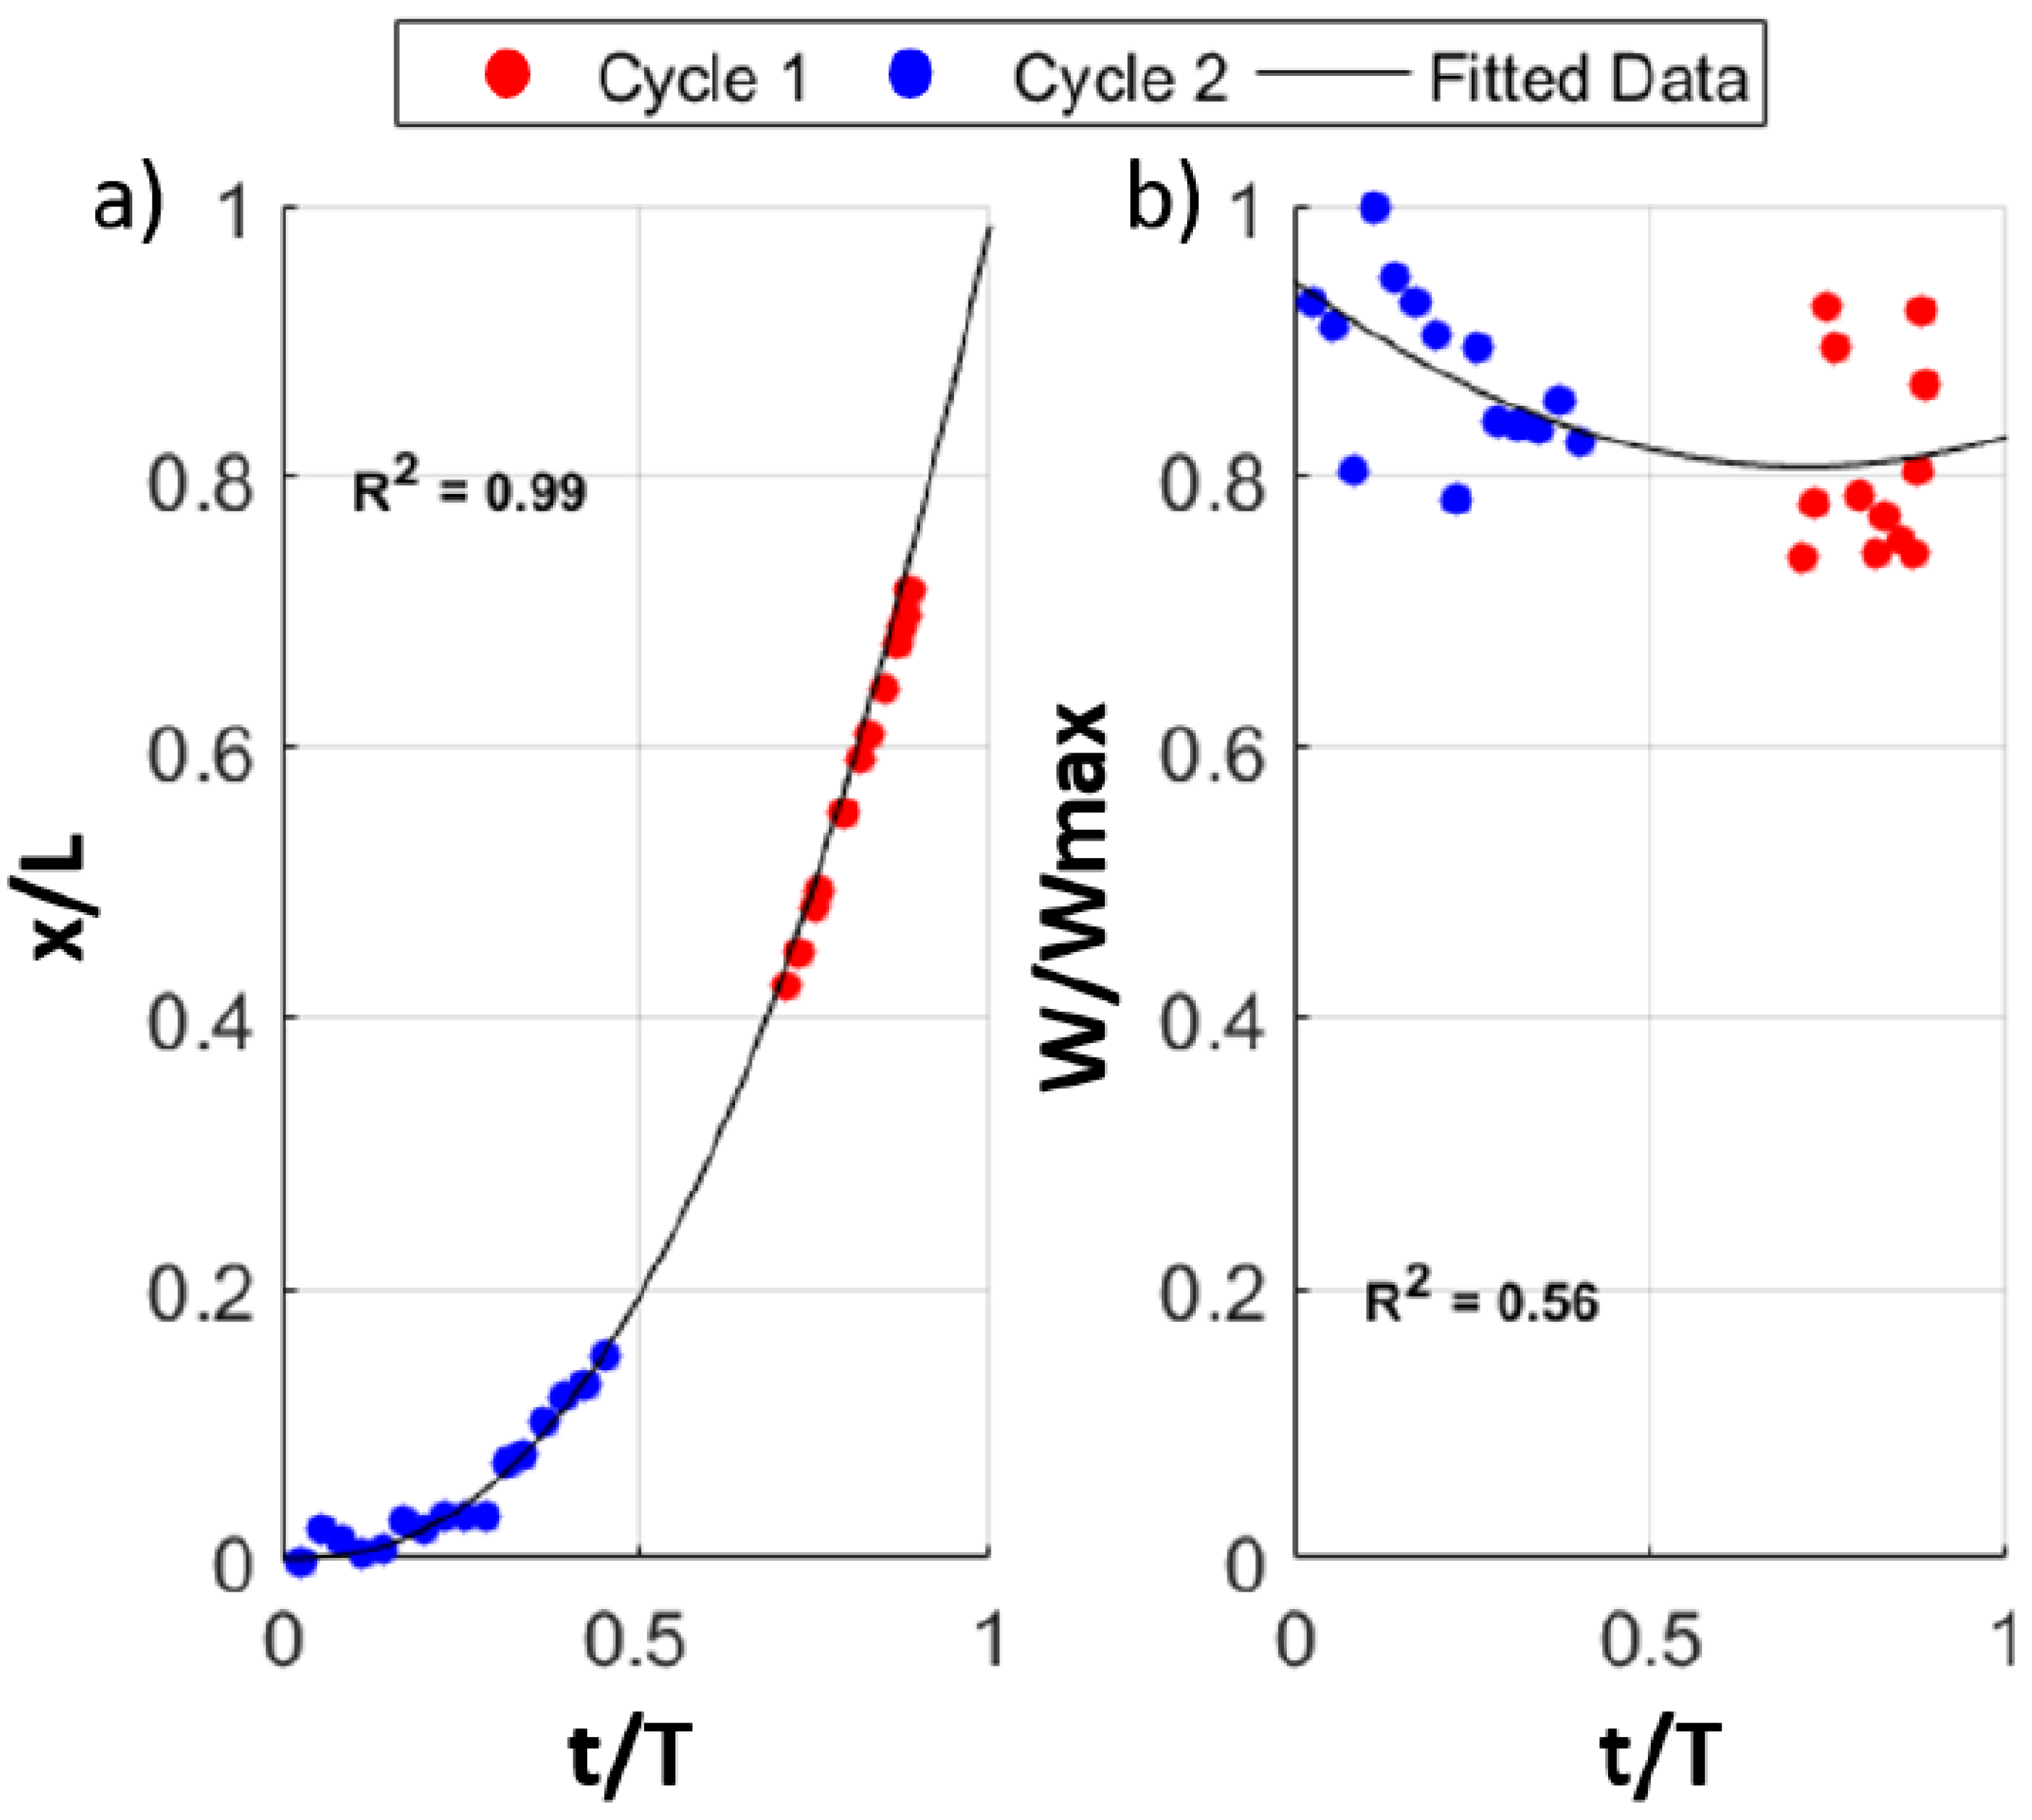
5.2. The Langue de Barbarie Sand Spit Stochastic Cyclic Evolution: Predicting Next Breaching and Erosion in Saint Louis

Pleiades data allows monitoring the short-term morphological changes of the Langue de Barbarie sand spit. From 1984 to 2020, the Northern spit elongation, calculated from various observations (CORONA, LANDSAT, SPOT, aerial photographs and field measurements, Sentinel-2, Pleiades; [38,42]) has tremendously fluctuated from low values (<170 m/year), to highest values (>1200 m/year). The use of remote-sensing methods allows the coverage of regional areas, such as the Langue de Barbarie which is 10 to 20 km long, and allows long-term monitoring of sand spits morphological changes [24,27,30,38,42]. Sentinel-2 data represents an even greater interest in that field as an every 8 day image is collected for our study site [29], enabling the monitoring of fast-events—such a tool would have permitted the monitoring of the post-2003 artificial breach period in our case with the dramatic widening of the breach.
The Langue de Barbarie developed downdrift in conjunction with the river-mouth diversion and its southwards migration [40]. Energetic swells—as is the case in Saint Louis—cause a massive sand accumulation and is prone to a rapid spit elongation, much more than less energetic waves that are responsible for small sand accumulation, and spit curvature [24]. The 2003 breach had dramatic consequences onto the Langue de Barbarie: the spit sand further downdrift was recycled into river-mouth bars, while the rest was transported southwards by longshore currents, strongly impacting the infrastructures into the Langue de Barbarie [4,40,42]. Nowadays, the Northern spit of the Langue de Barbarie is still lengthening (Figure 6), explained by the lower bypassing and sharp increase of the LST as it happened from 2012 to 2013, generating the ensuing exceptionally rapid elongation of the Langue de Barbarie spit between June 2013 and May 2015 (≃2 km) [38]. The results with shoreline tracking by [42] with a longer period of observation of regular revisit satellite missions (Landsat and Sentinel-2) confirmed that after 2012, the sand spit migrates Southwards with an average rate of 590 m/year. The results found in Section 4.3 are part of the sand spit extension trend, and modelling of the Langue de Barbarie morphological evolution was drawn as Equation (4). This simple deterministic spit growth equation provides a first-pass useful model of a sand spit development independent of climate forcing, proving that the changes in wave regime are not the main driving factor. Interactions between sediment transport and fluid flow create morphological feedbacks and lead to self-organized patterns [62], that explains the differences found Table 3 (satellite-measured spit growth rate versus “forced” spit growth rate [27]) and why those “forced” spit growth rates are much lower than the satellite-derived measurements. Other parameters such as human interactions, sediment availability, and sea-level rise also play a substantial role in the longer-term [25,26,63].
As the Langue de Barbarie extents Southwards in a 35 years cycle, the sand spit width is decreasing (Figure 6) [64]. From 2008, our results indicate an acceleration in the spit-narrowing process south of the defined urban area, and thus an erosion acceleration in that zone. Considering our model (Equation (5)), the erosion trend on the Langue de Barbarie is temporary: by 2030, this trend will reverse and the beach will start accreting again as this urban area will be located far from the river mouth and thus be free from its influence. Our model (Equation (4)) also predicts that by 2040, the spit length will reach its maximum and will likely cause the river mouth closure at the southern end: a new breach will potentially naturally or artificially have to be made to prevent Saint Louis city from flooding.
Our cyclic model relies on the LST, and enables a long term (decades) description and forecast of the Langue de Barbarie morphodynamics. The stretching (Figure 5) and narrowing seem to be the direct cause of the erosion found at Saint Louis, especially around urbanized areas (Northern Langue de Barbarie) where sediment availability is limited (Section 4.2). Pradhan et al. (2015) [26] demonstrated a similar evolution on a sand spit in India: a continuous elongation of the sand spit caused the erosion of the upstream beaches. With the topography only, one sees just the emerged tip of the “iceberg” ([14]). Nearshore bathymetry in addition to the satellite topographies, a coastal continuum, could improve the volumetric calculations and the understanding of the observed sand spit dynamics in support of our observations ([21]).
To generalize its applicability to other sand-spits, this model could be extended and calibrated using other sand-spit with similar environmental conditions and which morphology is wave-dominated.

5.3. Limitations

DEMs derived from tri-stereogrammetry methods to obtain topography estimation present promising results and constitute a new way to estimate morphological changes of a coastal area. However, it comports limits that are to take into account [65] like the difficulties encountered by Pleiades when analyzing water surfaces, and areas with no texture [66]. The global RMSE between in situ measurements and Pleiades estimations is 1.15 m R M S E 1.31 m (Section 4.2) and those results are not as good as what was found in Almeida et al. (2019) [37] study. The difference between the two studies can be explained by the flatness of the Langue de Barbarie topography (≃2.56 m above sea level). The flatness of a site has an indirect impact on the DEM accuracy [67]—low reflectance and texture of the raw optical satellite image result from specific ground characteristics, altering the calculation of the disparity that is converted into ground elevation. The signal-metric changes induced by a storm or at seasonal scale—is about the same order as the noise: this study show the potential of the method but highlight the need for more accuracy and further developments. However, as the slopes at our beach/dune system are weak (≃4%, Section 4.2), the tri-stereo method does not produce large errors and dependency on the view monitoring as it is the case for cliffs 3D-reconstitution [68]. Our study site has a limited set of GCPs. Increasing the number of GCPs would improve the correction of DEMs, and decrease the overall RMSE.
A large uncertainty arises from the satellite-derived DEM. Other open-access tools can generate a surface model with a stereo-method, such as MicMac [69]. In previous studies the vertical mean error of the surface models ranged as follows: 0.35 m ≤ ASP ≤ 0.48 m [37], and 0.17 m ≤ MicMac ≤ 0.34 m [70]. In our work, we used ASP and CARS to perform a tri-stereo, but the RMSE between in situ data and the CARS produced-DEMs were not satisfying enough to use them in our beach morphology study. Those values compete with the centimetric-errors obtained with the LiDAR method for the assessment of coastal processes [71,72,73] which vertical accuracy ranged from 0.05 m to 0.15 m [74].
The most dynamic part of the beach is the lower beach, which is the most challenging section for stereoscopy due to hydrodynamics (swash) between images, tide level at the moment of the acquisition (time of acquisition not flexible) and the lack of texture (Section 4.2). The DEMs are validated punctually at control points to estimate the uncertainty/error in the waterline estimations (horizontal displacement of an iso-level)—impacting the calculated erosion rate Figure 3—and volume change (vertical evolution), so the validation of those parameters apply for the two latter and no assessment can be drawn from the Pleiades DEMs. It is also to observe that the transect TA shows a greater difference between the D-GPS transects and the Pleiades estimations than TB and TC: the beach profile trend is yet found by the satellite, but despite the correction applied on the DEMs data, the lower beach relief morphology (0 m ≃Cross-shore≃ 40 m; Figure 2b) does not match between the in situ data, and the satellite-derived topography. It is especially notable in the 2019 data that there is no estimation of the topography for cross-shore values [ 0 , 30 ] m (Figure 2b). That is to link to the fact that the waves conditions during the Pleiades acquisition in March 2019 were particularly energetic ( H S   = 2.3 m, and T = 17 s; Table 2), which induces an important run-up on the beach. As the tri-stereo method is not the most suitable for the topography of the lower beach, the study of the bathymetry of the near-shore and intertidal zone would provide more accurate results.

5.4. The Impact of Satellite Acquisition Geometry on DEM Accuracy

The DEMs obtained from stereo methods have their accuracy relying on several parameters that are to determine before ordering a Pleiades image set [43,68,75]. In March 2019, a set of 10 images is available, allowing to study the impact of two input parameters on the DEM reliability. The RMSE between the DEMs and the in situ data set has been calculated for two regions of interest: over the whole Pleiades DEM and the urban area emphasized Figure 1c.
Over the 2019 Pleiades sequence, the RMSE standard deviation for the B/H ratio is 0.08 on the whole satellite image, and 0.05 in the urban area. That emphasizes the fact that the Base to Height (B/H) ratio does have a strong impact on the DEM accuracy. However, as the along-orbit Angle parameter does not highlight a trend when the whole DEM is considered, it shows a greater variability within the urban area with a 0.27 standard deviation value. The DEMs accuracy is better in two cases: when the stereo-estimation is built from very close to Nadir along-orbit angle, or when the stereo-estimation is built from large alongshore angles [ 18 , 12 , 11 , 16 ] .
When the terrain presents more irregularities in the topography—like in the urban area with the presence of buildings—the stereo method works better and the provided DEM is more accurate when using high along-orbit angles in between the used satellite-pair images [66,68]. However, as the topography-study site is very low over the largest inland part, the conclusion is that neither the B/H ratio nor the along angle parameter have a huge impact on our method-accuracy. However, considering the results and the method limitations, the ideal conditions for a Pleiades acquisition would be at low tide, and during the summer to avoid heavy swells conditions.

6. Conclusions

In this article, 2m Digital Elevation Models (DEMs) derived from sub-metric Pleiades optical satellites were used to monitor coastal changes around Saint Louis (Senegal, West Africa) along the Langue de Barbarie sand spit over a year (March 2019–March 2020). The tri-stereo method used here to calculate the DEMs gives a metric root mean squared differences when compared to RTK-GPS surveys. By bringing together the local erosion at the urban area with the larger scale extension of the Langue de Barbarie sand spit, this work offers a new vision of regional morphodynamics and how the scales are tangled. Even if a standalone use for coastal studies is not yet conceivable at this stage considering the encountered accuracy limitations, satellite-based topography monitoring appears as a breakthrough in decade-old technological barriers of linking coastal spatio-temporal scales, which is crucial to understand coastal behaviour, and for coastal engineering.
Using available long term satellite monitoring, a stochastic model for the morphological evolution of the Langue de Barbarie sand spit-free from climate forcing—has also been proposed and offers the possibility to anticipate its behaviour and erosion trends over time. This will allow the implementation of efficient and sustainable infrastructures to combat the erosion in Saint Louis [76].

Author Contributions

A.T. did the analyses and wrote the manuscript, R.A. and E.W.J.B. supervised and validated; B.A.S., A.N., M.S., T.G. collected in situ-measurements used in the analyses; R.A. and E.W.J.B. revised the manuscript at different stages and collaborated on the ideas. All authors have read and agreed to the published version of the manuscript.

Funding

This research was funded by AFD (Agence Française de Développement—France), ADM (Agence de Développement Municipal—Senegal), and IRD (Institut de Recherche et de Développement); Surveys were funded under the PEA MEPELS. Erwin Bergsma was funded through a Post-doctoral fellowship of the French Space Agency (CNES).

Data Availability Statement

Not applicable.

Acknowledgments

The authors would like to thank the SHOM for the topograpic in situ measurements, UCAD and UGB for their time and help in Saint Louis.

Conflicts of Interest

The authors declare no conflict of interest.

Abbreviations

The following abbreviations are used in this manuscript:
DEMDigital Elevation Model
RTKReal Time Kinematic
ASPAmes Setero Pipelines
RPCRational Polynomial Coefficient
NDWINormalized Difference Water Index
RMSERoot Mean Squared Error
LSTLongshore Sediment Transport

References

  1. Luijendijk, A.; Hagenaars, G.; Ranasinghe, R.; Baart, F.; Donchyts, G.; Aarninkhof, S. The state of world’s beaches. Sci. Rep. 2018, 8, 6641. [Google Scholar] [CrossRef] [PubMed]
  2. Small, C.; Nicholls, R. A global analysis of human settlement in coastal zones. J. Coast. Res. 2003, 19, 584–599. [Google Scholar]
  3. Nicholls, R.; Small, C. Improved estimates of coastal population and exposure to hazards released. Eos Trans. Am. Geophys. Union 2011, 83, 301–305. [Google Scholar] [CrossRef] [Green Version]
  4. Ndour, A.; Laïbi, R.A.; Sadio, M.; Degbe, C.G.; Diaw, A.T.; Oyédé, L.M.; Anthony, E.J.; Dussouillez, P.; Sambou, H.; hadji Balla Dièye, E. Management strategies for coastal erosion problems in west Africa: Analysis, issues, and constraints drawn from the examples of Senegal and Benin. Ocean. Coast. Manag. 2018, 156, 92–106. [Google Scholar] [CrossRef]
  5. Alves, B.; Angnuureng, D.B.; Morand, P.; Almar, R. A review on coastal erosion and flooding risks and best management practices in West Africa: What has been done and should be done. J. Coast. Conserv. 2020, 24, 1–22. [Google Scholar] [CrossRef]
  6. Dada, O.; Almar, R.; Morand, P.; Menard, F. Towards West African coastal social-ecosystems sustainability: Interdisciplinary approaches. Ocean. Coast. Manag. 2021, 211, 105746. [Google Scholar] [CrossRef]
  7. Jongman, B. Effective adaptation to rising flood risk. Nat. Commun. 2018, 9. [Google Scholar] [CrossRef] [Green Version]
  8. Sinay, L.; Carter, R.W.B. Climate Change Adaptation Options for Coastal Communities and Local Governments. Climate 2020, 8, 7. [Google Scholar] [CrossRef] [Green Version]
  9. Temmerman, S.; Meire, P.; Bouma, T.J.; Herman, P.M.J.; Ysebaert, T.; Vriend, H.J.D. Ecosystem-based coastal defence in the face of global change. Nature 2013, 504, 79–83. [Google Scholar] [CrossRef] [PubMed]
  10. Marzougui, W.; Oueslati, A. Les plages de la côte d’Ejjehmi-Soliman (golfe de Tunis, Tunisie): Exemple d’accélération de l’érosion marine dans une cellule sédimentaire artificiellement tronçonnée. Physio-Geo 2017, 11, 21–41. [Google Scholar] [CrossRef]
  11. Bayle, P.M.; Blenkinsopp, C.E.; Conley, D.; Masselink, G.; Beuzen, T.; Almar, R. Performance of a dynamic cobble berm revetment for coastal protection, under increasing water level. Coast. Eng. 2020, 159, 103712. [Google Scholar] [CrossRef]
  12. Maiolo, M.; Mel, R.A.; Sinopoli, S. A Stepwise Approach to Beach Restoration at Calabaia Beach. Water 2020, 12, 2677. [Google Scholar] [CrossRef]
  13. Gesch, D.; Brock, J.; Parrish, C.; Rogers, J.; Wright, C. Introduction: Special issue on advances in topobathymetric mapping, models, and applications. J. Coast. Res. 2016, 76, 1–3. [Google Scholar] [CrossRef]
  14. Anthony, E.J. Wave influence in the construction, shaping and destruction of river deltas: A review. Mar. Geol. 2015, 361, 53–78. [Google Scholar] [CrossRef]
  15. McBride, R.; Taylor, M.; Byrnes, M. Coastal morphodynamics and Chenier-Plain evolution in southwestern Louisiana, USA: A geomorphic model. Geomorphology 2007, 88, 367–422. [Google Scholar] [CrossRef]
  16. Le Mauff, B.; Juigner, M.; Ba, A.; Robin, M.; Launeau, P.; Fattal, P. Coastal monitoring solutions of the geomorphological response of beach-dune systems using multi-temporal LiDAR datasets (Vendée coast, France). Geomorphology 2018, 304, 121–140. [Google Scholar] [CrossRef]
  17. Collin, A.; Hench, J.L.; Pastol, Y.; Planes, S.; Thiault, L.; Schmitt, R.J.; Holbrook, S.J.; Davies, N.; Troyer, M. High resolution topobathymetry using a Pleiades-1 triplet: Moorea Island in 3D. Remote Sens. Environ. 2018, 208, 109–119. [Google Scholar] [CrossRef]
  18. Salameh, E.; Frappart, F.; Almar, R.; Baptista, P.; Heygster, G.; Lubac, B.; Raucoules, D.; Almeida, L.P.; Bergsma, E.W.J.; Capo, S.; et al. Monitoring Beach Topography and Nearshore Bathymetry Using Spaceborne Remote Sensing: A Review. Remote Sens. 2019, 11, 2212. [Google Scholar] [CrossRef] [Green Version]
  19. Benveniste, J.; Cazenave, A.; Vignudelli, S.; Fenoglio-Marc, L.; Shah, R.; Almar, R.; Andersen, O.; Birol, F.; Bonnefond, P.; Bouffard, J.; et al. Requirements for a Coastal Hazards Observing System. Front. Mar. Sci. 2019, 6, 348. [Google Scholar] [CrossRef] [Green Version]
  20. Melet, A.; Teatini, P.; Le Cozannet, G.; Jamet, C.; Conversi, A.; Benveniste, J.; Almar, R. Earth Observations for Monitoring Marine Coastal Hazards and Their Drivers. Surv. Geophys. 2020, 41, 1489–1534. [Google Scholar] [CrossRef]
  21. Bergsma, E.W.J.; Almar, R.; Rolland, A.; Binet, R.; Brodie, K.L.; Bak, A.S. Coastal morphology from space: A showcase of monitoring the topography-bathymetry continuum. Remote Sens. Environ. 2021, 261, 112469. [Google Scholar] [CrossRef]
  22. Turner, I.L.; Harley, M.D.; Almar, R.; Bergsma, E.W. Satellite optical imagery in Coastal Engineering. Coast. Eng. 2021, 167, 103919. [Google Scholar] [CrossRef]
  23. Aubrey, D.; Gaines, A. Rapid formation and degradation of barrier spits in areas with low rates of littoral drift. Mar. Geol. 1982, 49, 257–277. [Google Scholar] [CrossRef]
  24. Allard, J.; Bertin, X.; Chaumillon, E.; Pouget, F. Sand spit rhythmic development: A potential record of wave climate variations? Arçay Spit, western coast of France. Mar. Geol. 2008, 253, 107–131. [Google Scholar] [CrossRef]
  25. Stancheva, M.; Ratas, U.; Orviku, K.; Palazov, A. Sand Dune Destruction Due to Increased Human Impacts along the Bulgarian Black Sea and Estonian Baltic Sea Coasts. J. Coast. Res. 2011, 64, 324–328. [Google Scholar]
  26. Pradhan, U.; Mishra, P.; Mohanty, P.K.; Behera, B. Formation, Growth and Variability of Sand Spit at Rushikulya River Mouth, South Odisha Coast, India. Procedia Eng. 2015, 116, 963–970. [Google Scholar] [CrossRef] [Green Version]
  27. Duc Anh, N.Q.; Tanaka, H.; Tam, H.S.; Tinh, N.X.; Tung, T.T.; Viet, N.T. Comprehensive Study of the Sand Spit Evolution at Tidal Inlets in the Central Coast of Vietnam. J. Mar. Sci. Eng. 2020, 8, 722. [Google Scholar] [CrossRef]
  28. Nahon, A.; Idier, D.; Sénéchal, N.; Fénièes, H.; Mallet, C.; Mugica, J. Imprints of wave climate and mean sea level variations in the dynamics of a coastal spit over the last 250 years: Cap Ferret, SW France. Earth Surf. Process. Landf. 2019, 44, 2112–2126. [Google Scholar] [CrossRef]
  29. Bergsma, E.W.; Almar, R. Coastal coverage of ESA’ Sentinel 2 mission. Adv. Space Res. 2020, 65, 2636–2644. [Google Scholar] [CrossRef]
  30. Teodoro, A.; Pais-Barbosa, J.; Gonçalves, H.; Veloso-Gomes, F.; Taveira-Pinto, F. Extraction of Cabedelo sand spit area (Douro estuary) from satellite images through image processing techniques. J. Coast. Res. 2011, SI 64, 1740–1744. [Google Scholar]
  31. Holman, R.; Plant, N.; Holland, T. cBathy: A robust algorithm for estimating nearshore bathymetry. JGR Oceans 2013, 118, 2595–2609. [Google Scholar] [CrossRef]
  32. Bergsma, E.W.J.; Conley, D.C.; Davidson, M.A.; O’Hare, T.J.; Almar, R. Storm Event to Seasonal Evolution of Nearshore Bathymetry Derived from Shore-Based Video Imagery. Remote Sens. 2019, 11, 519. [Google Scholar] [CrossRef] [Green Version]
  33. Bergsma, E.; Almar, R. Video-based depth inversion techniques, a method comparison with synthetic cases. Coast. Eng. 2018, 138, 199–209. [Google Scholar] [CrossRef]
  34. Angnuureng, D.B.; Jayson-Quashigah, P.N.; Almar, R.; Stieglitz, T.C.; Anthony, E.J.; Aheto, D.W.; Appeaning Addo, K. Application of Shore-Based Video and Unmanned Aerial Vehicles (Drones): Complementary Tools for Beach Studies. Remote Sens. 2020, 12, 394. [Google Scholar] [CrossRef] [Green Version]
  35. Eustáquio Amaro, V.; Santana Gomes, L.R.; Ferreira de Lima, F.G.; Scudelari, A.C.; Freitas Neves, C.; Vieira Busman, D.; Silva Santos, A.L. Multitemporal Analysis of Coastal Erosion Based on Multisource Satellite Images, Ponta Negra Beach, Natal City, Northeastern Brazil. Mar. Geod. 2015, 38, 1–25. [Google Scholar] [CrossRef]
  36. Almar, R.; Bergsma, E.W.J.; Maisongrande, P.; de Almeida, L.P.M. Wave-derived coastal bathymetry from satellite video imagery: A showcase with Pleiades persistent mode. Remote Sens. Environ. 2019, 231, 111263. [Google Scholar] [CrossRef]
  37. Almeida, L.; Almar, R.; Bergsma, E.; Berthier, E.; Baptista, P.; Garel, E.; Dada, O.; Alves, B. Deriving High Spatial-Resolution Coastal Topography From Sub-meter Statellite Stereo Imagery. Remote Sens. 2019, 11, 590. [Google Scholar] [CrossRef] [Green Version]
  38. Sadio, M.; Anthony, E.J.; Diaw, A.T.; Dussouillez, P.; Fleury, J.T.; Kane, A.; Almar, R.; Kestenare, E. Shoreline Changes on the Wave-Influenced Senegal River Delta, West Africa: The Roles of Natural Processes and Human Interventions. Water 2017, 9, 357. [Google Scholar] [CrossRef] [Green Version]
  39. Almar, R.; Kestenare, E.; Boucharel, J. On the key influence of remote climate variability from Tropical Cyclones, North and South Atlantic mid-latitude storms on the Senegalese coast (West Africa). Environ. Res. Commun. 2019, 1, 071001. [Google Scholar] [CrossRef] [Green Version]
  40. Anthony, E.J. Patterns of Sand Spit Development and Their Management Implications on Deltaic, Drift-Aligned Coasts: The Cases of the Senegal and Volta River Delta Spits, West Africa. In Sand and Gravel Spits; Randazzo, G., Jackson, D., Cooper, J., Eds.; Coastal Research Library; Springer: Cham, Switzerland, 2015; pp. 21–36. [Google Scholar]
  41. Anthony, E.J.; Aagaard, T. The lower shoreface: Morphodynamics and sediment connectivity with the upper shoreface and beach. Earth-Sci. Rev. 2020, 210, 103334. [Google Scholar] [CrossRef]
  42. Bergsma, E.; Sadio, M.; Sakho, I.; Almar, R.; Garlan, T.; Gosselin, M.; Gauduin, H. Sand-spit evolution and inlet dynamics derived from space-borne optical imagery: Is the Senegal-river inlet closing? J. Coast. Res. 2020, 95, 372–376. [Google Scholar] [CrossRef]
  43. Jacobsen, K.; Topan, H. Corrigendum to “DEM generation with short base length Pleiades triplet”. Int. Arch. Photogramm. Remote Sens. Spat. Inf. Sci. 2015, XL-3/W2, 297. [Google Scholar] [CrossRef] [Green Version]
  44. Vos, K.; Splinter, K.D.; Harley, M.D.; Simmons, J.A.; Turner, I.L. CoastSat: A Google Earth Engine-enabled Python toolkit to extract shorelines from publicly available satellite imagery. Environ. Model. Softw. 2019, 122, 104528. [Google Scholar] [CrossRef]
  45. Shean, D.; Alexandrov, O.; Moratto, Z.; Smith, B.; Joughin, I.; Porter, C.; Morin, P. An automated, open-source pipeline for mass production of digital elevation models (DEMs) from very-high-resolutioncommercial stereo satellite imagery. ISPRS J. Photogramm. Remote Sens. 2016, 116, 101–117. [Google Scholar] [CrossRef] [Green Version]
  46. Youssefi, D.; Michel, J.; Sarrazin, E.; Buffe, F.; Cournet, M.; Delvit, J.M.; L’Helguen, C.; Melet, O.; Emilien, A.; Bosman, J. CARS: A Photogrammetry Pipeline Using Dask Graphs to Construct A Global 3D Model. In Proceedings of the IGARSS 2020—2020 IEEE International Geoscience and Remote Sensing Symposium, Waikoloa, HI, USA, 26 September–2 October 2020; pp. 453–456. [Google Scholar] [CrossRef]
  47. Michel, J.; Sarrazin, E.; Youssefi, D.; Cournet, M.; Buffe, F.; Delvit, J.; Emilien, A.; Bosman, J.; Melet, O.; L’Helguen, C. A new satellite imagery stereo pipeline designed for scalability, robustness and performance. ISPRS Int. Arch. Photogramm. Remote Sens. Spat. Inf. Sci. 2020, 2, 171–178. [Google Scholar] [CrossRef]
  48. Nuth, C.; Kääb, A. Co-registration and bias corrections of satellite elevation data sets for quantifying glacier thickness change. Cryosphere 2011, 5, 271–290. [Google Scholar] [CrossRef] [Green Version]
  49. McNabb, R. PyBob: A Python Package of Geospatial Toolsand Version 0.25; Github: San Francisco, CA, USA, 2019. [Google Scholar]
  50. Tahoun, M.; Reulke, R.; Hassanien, A.E. Co-registration of Satellite Images Based on Invariant Local Features. Intell. Syst. 2015, 323, 653–660. [Google Scholar]
  51. Stockdon, H.F.; Holman, R.A.; Howd, P.A.; Sallenger, A.H. Empirical parameterization of setup, swash, and runup. Coast. Eng. 2006, 53, 573–588. [Google Scholar] [CrossRef]
  52. Melet, A.; Meyssignac, B.; Almar, R.; Le Cozannet, G. Under-estimated wave contribution to coastal sea-level rise. Nat. Clim. Chang. 2018, 8, 234–239. [Google Scholar] [CrossRef]
  53. McFeeters, S. The use of the Normalized Difference Water Index (NDWI) in the delineation of open water features. Int. J. Remote Sens. 1996, 17, 1425–1432. [Google Scholar] [CrossRef]
  54. Kaczmarek, L.M.; Ostrowski, R.; Pruszak, Z.; Rozynski, G. Selected problems of sediment transport and morphodynamics of a multi-bar nearshore zone. Estuar. Coast. Shelf Sci. 2005, 62, 415–425. [Google Scholar] [CrossRef]
  55. Kamphuis, W. Alongshore Sediment Transport Rate. J. Waterw. Port Coast. Ocean. Eng. 1991, 117, 622–640. [Google Scholar] [CrossRef]
  56. Bayram, A.; Larson, M.; Hanson, H. A new formula for the total longshore sediment transport rate. Coast. Eng. 2007, 54, 700–710. [Google Scholar] [CrossRef]
  57. Dail, H.J.; Merrifield, M.A.; Bevis, M. Steep beach morphology changes due to energetic wave forcing. Mar. Geol. 2000, 162, 443–458. [Google Scholar] [CrossRef]
  58. SOGREAH. Etudes De Faisabilité Et D’avant Projet Sommaire De L’émissaire Deltaand Rapport Final: Grenoble, France; Technical Report; SOGREAH: Grenoble, France, 1994. [Google Scholar]
  59. Eamer, J.B.; Walker, I.J. Quantifying spatial and temporal trends in beach–dune volumetric changes using spatial statistics. Geomorphology 2013, 191, 94–108. [Google Scholar] [CrossRef]
  60. Niang, A.; Kane, A. Morphological and Hydrodynamic Changes in the Lower Estuary of the Senegal River: Effects on the Environment of the Breach of the ‘Langue De Barbarie’ Sand Spit in 2003. In The Land/Ocean Interactions in the Coastal Zone of West and Central Africa; Estuaries of the World; Diop, S., Barusseau, J.P., Descamps, C., Eds.; Springer: Cham, Switzerland, 2014; pp. 23–40. [Google Scholar]
  61. Ndour, A.; Ba, K.; Almar, A.; Almeida, P.; Sall, M.; Diedhiou, P.M.; Floc’h, F.; Daly, C.; Grandjean, P.; Boivin, J.-P.; et al. On the Natural and Anthropogenic Drivers of the Senegalses (West Africa) Low Coast Evolution: Saint Louis Beach 2016 COASVAR Experiment and 3D Modeling of Short Term Coastal Protection Measures. J. Coast. Res. 2016, 95, 583–587. [Google Scholar] [CrossRef]
  62. Coco, G.; Murray, A.B. Patterns in the sand: From forcing templates to self-organization. Geomorphology 2007, 91, 271–290. [Google Scholar] [CrossRef]
  63. Tribe, H. The Geomorphology of Farewell Spit and Its Sensitivity to Sea-Level Rise. Master’s Thesis, School of Geography, Environment and Earth Sciences, Victoria University of Wellington, Wellington, New Zealand, 2008. [Google Scholar]
  64. Dean, R.; Dalrymple, R. Long-term processes. In Coastal Processes with Engineering Applications; Cambridge University Press: Cambridge, UK, 2001; pp. 35–70. [Google Scholar]
  65. Amante, C. Estimating Coastal Digital Elevation Model Uncertainty. J. Coast. Res. 2018, 34, 1382–1397. [Google Scholar] [CrossRef] [Green Version]
  66. Loghin, A.M.; Otepka-Schremmer, J.; Pfeifer, N. Potential of Pléiades and WorldView-3 Tri-Stereo DSMs to Represent Heights of Small Isolated Objects. Sensors 2020, 20, 2695. [Google Scholar] [CrossRef] [PubMed]
  67. Yamazaki, D.; Ikeshima, D.; Tawatari, R.; Yamaguchi, T.; O’Loughlin, F.; Neal, J.; Sampson, C.; Kanae, S.; Bates, P. A high-accuracy map of global terrain elevations. Geophys. Res. Lett. 2017, 44, 5844–5853. [Google Scholar] [CrossRef] [Green Version]
  68. Letortu, P.; Jaud, M.; Théry, C.; Nabucet, J.; Taouki, R.; Passot, S.; Augereau, E. The potential of Pléiades images with high angle of incidence for reconstructing the coastal cliff face in Normandy (France). Int. J. Appl. Earth Obs. Geoinf. 2020, 84, 101976. [Google Scholar] [CrossRef]
  69. Rupnik, E.; Daakir, M.; Pierrot Deseilligny, M. MicMac—A free, open-source solution for photogrammetry. Open Geospat. Data Softw. Stand 2017, 2, 1–9. [Google Scholar] [CrossRef]
  70. Rupnik, E.; Pierrot-Deseilligny, M.; Delorme, A. 3D reconstruction from multi-view VHR-satellite images in MicMac. ISPRS J. Photogramm. Remote Sens. 2018, 139, 201–211. [Google Scholar] [CrossRef]
  71. Sallenger, A.H., Jr.; Krabill, W.; Swift, R.; Brock, J.; List, J.; Hansen, M.; Holman, R.; Manizade, S.; Sontag, J.; Meredith, A.; et al. Evaluation of airborne topographic lidar for quantifying beach changes. J. Coast. Res. 2003, 19, 125–133. [Google Scholar]
  72. Chen, B.; Yang, Y.; Wen, H.; Ruan, H.; Zhou, Z.; Luo, K.; Zhong, F. High-resolution monitoring of beach topography and its change using unmanned aerial vehicle imagery. Ocean. Coast. Manag. 2018, 160, 103–116. [Google Scholar] [CrossRef]
  73. Rotnicka, J.; Dłużewski, M.; Dąbski, M.; Rodzewicz, M.; Włodarski, W.; Zmarz, A. Accuracy of the UAV-Based DEM of Beach–Foredune Topography in Relation to Selected Morphometric Variables, Land Cover, and Multitemporal Sediment Budget. Estuaries Coasts 2020, 43, 1939–1955. [Google Scholar] [CrossRef]
  74. Nelson, A.; Reuter, H.; Gessler, P. Chapter 3 DEM Production Methods and Sources. Dev. Soil Sci. 2009, 33, 65–85. [Google Scholar] [CrossRef]
  75. Hasegawa, H.; Matsuo, K.; Koarai, N.; Watanabe, N.; Masaharu, H.; Fukushima, Y. DEM accuracy and the base to height (B/H) ratio of stereo images. Int. Arch. Photogramm. Remote Sens. 2000, 33, 356–359. [Google Scholar]
  76. Morris, R.; Boxshall, A.; Swearer, S. Climate-resilient coasts require diverse defence solutions. Nat. Clim. Chang. 2020, 10, 485–487. [Google Scholar] [CrossRef]
Figure 1. (a) Localisation of the city of Saint Louis (Senegal). (b) Data acquisition by Pleiades satellite. (c) Overview of the Langue de Barbarie and localisation of the urban area in red. (d) localisation of the in situ data—March 2019 in red and March 2020 in yellow with a km scale.
Remotesensing 13 02454 g001
Figure 2. (a) Satellite image superposed from March 2019 with chosen transects for inter-comparison and zoom onto the chosen transects. (b) Inter-comparison (Pleiades—dashed lines, and D-GPS—continuous lines) over the chosen transects in March 2019 and March 2020 [45].
Remotesensing 13 02454 g002
Figure 3. (a) Erosion rate within a year derived from Pleiades images in the urban area—calculated from the difference between the waterlines position of 2019 and 2020. (b) Iso-topographies derived from Pleiades onto the chosen transects which height ranging from 0.5 m to 5 m (color lines), and associated waterline position (black lines).
Remotesensing 13 02454 g003
Figure 4. (a) Sand spit natural area morphology derived from Pleiades—March 2019. (b) DEMs difference (2020–2019) with stippled area represents the vertical change (<1 m). (c) Sand spit natural area morphology derived from Pleiades—March 2020.
Remotesensing 13 02454 g004
Figure 5. (a) Sand spit tip’ position and shorelines derived from S2-satellite over time using Coastsat Open-Access tool [44]. (b) Volume of sand annually captured by the sand spit (red) compared to the annual LST estimates obtained from ERA5 data (black) with its standard deviation (gray).
Remotesensing 13 02454 g005
Figure 6. (a) Sand spit tip’ positions for cycle 1 (1984–2003; red) and cycle 2 (2003–2020; blue) derived from CoastSat tool [44] and fitted data expressed as Equation (4). (b) Sand spit averaged width evolution between transect Y = 1.7705 × 10 6 Y UTM (28) and 1 km South with its fitted data expressed as Equation (5) (Right).
Remotesensing 13 02454 g006
Table 1. Difference between satellite-based DEM and RTK-GPS survey (RMS error) for each cross-shore transect.
TransectsRMSE (m) 03/19RMSE (m) 03/20
T11.190.92
T21.010.97
T30.721.07
Table 2. Waves and wind parameters during the Pleiades acquisitions.
DateWind Speed (kt)Wind Dir (°)Hs (m)Wave Dir (°)T (s)Tide (m)
2 March 201911802.3290170.8
17 March 2020143601.835080.8
Table 3. Migration rates over the years derived from satellite measurements and Equation (3).
DateMigration Rate CoastSat [44] (m/Year)Migration Rate Estimates (Equation (3)) (m/Year)
2015/2016160210
2016/2017870250
2017/2018550280
2018/2019460350
2019/2020740270
Publisher’s Note: MDPI stays neutral with regard to jurisdictional claims in published maps and institutional affiliations.

