Abstract
Recent advances in structure-from-motion (SfM) techniques have proliferated the use of unmanned aerial vehicles (UAVs) in the monitoring of coastal landform changes, particularly when applied in the reconstruction of 3D surface models from historical aerial photographs. Here, we explore a number of depth map filtering and point cloud cleaning methods using the commercial software Agisoft Metashape Pro to determine the optimal methodology to build reliable digital surface models (DSMs). Twelve different aerial photography-derived DSMs are validated and compared against light detection and ranging (LiDAR)- and UAV-derived DSMs of a vegetated coastal dune system that has undergone several decades of coastline retreat. The different studied methods showed an average vertical error (root mean square error, RMSE) of approximately 1 m, with the best method resulting in an error value of 0.93 m. In our case, the best method resulted from the removal of confidence values in the range of 0–3 from the dense point cloud (DPC), with no filter applied to the depth maps. Differences among the methods examined were associated with the reconstruction of the dune slipface. The application of the modern SfM methodology to the analysis of historical aerial (vertical) photography is a novel (and reliable) new approach that can be used to better quantify coastal dune volume changes. DSMs derived from suitable historical aerial photographs, therefore, represent dependable sources of 3D data that can be used to better analyse long-term geomorphic changes in coastal dune areas that have undergone retreat.
1. Introduction
The reliability of three-dimensional data is a crucial component in the physical analysis of exogenous geomorphic processes. These types of data can now be gathered much more accurately thanks to recent improvements in and accessibility of modern light detection and ranging (LiDAR), differential global navigation satellite system (DGNSS), and unmanned aerial vehicle (UAV) systems [1]. Despite the wide range of available technologies, the production of high-quality digital elevation models (DEMs) still requires significant investments in personnel time, hardware, and software [2]. In many cases, the high frequency and dense spatial accuracy provided by modern topographic acquisition systems such as UAVs is still not able to provide historical (multi-decadal) datasets due to their relatively recent (previous 10 years) widespread availability. There is a growing need for reliable long-term 3D data across all geomorphic disciplines, especially in studies on rapidly changing dynamic coastal environments [3]. Reliable long-term 3D data would help improve geomorphic predictions such as shoreline variation models [4,5], and would help establish trends for dune erosion or changes of beach configuration [6,7], particularly under rising sea level rise scenarios [8]. Coastal change models are normally based on simplified hydrodynamic assumptions that attempt to present broad-scale global shoreline movement patterns [9] or are tested using synthetic scenarios that are specifically designed to emulate the large range of natural sandy shoreline behaviour [10]. When accounting for real coastal topography, the input data are usually 2D surveyed cross-sections of the coast, which are then integrated across multiple alongshore profiles to present a simplified 3D beach sediment budget [11]. As argued by [12], one of the main reasons why geomorphological models struggle to reproduce real-world behaviour in coastal settings is the predominance of short-term observations, which fail to understand the full character of longer-term morphological evolution, and therefore cannot fully quantify the main driving phenomena and constraints on coastal change [13]. Models accounting for more accurate long-term predictions of coastal change would, therefore, be useful, especially for site-specific cases where long-term 3D data are usually scarce [8].
A new possibility to gather long-term 3D datasets is now provided by the structure-from-motion (SfM) methodology, which in coastal monitoring is mainly used to build 3D models from UAV-derived images [1,14,15,16], especially to detect post-storm variations of the beach configuration [17,18,19]. In coastal monitoring, SfM techniques have also been applied using low cost cameras for terrestrial surveys of cliffs [20], using poles with the addition of multi-view stereo (MVS) techniques [21] or even kite-derived images [22,23].
SfM techniques can also offer a new analysis of historical aerial photographs (APs). Moreover, digital surface models (DSMs), which are elevation models in a 2.5D raster format (meaning that to each pixel (XY) only a Z value is given [24]), have recently been tested using historical aerial photographs as the image source to study riverine environments [25], areas of complex topography [26,27], glacial surfaces [28,29,30], and landscape evolution [24,30,31,32]. Products deriving from the SfM process of historical aerial photographs have also been used for archeological purposes and have been validated against DGNSS and UAV measurements [33]. Historical aerial photographs have been recently used as valuable sources for long-term analyses of areas with tall vegetation [34], comparing the resulting point clouds with modern airborne laser scanning data.
In coastal environments, the first papers to test this novel application were by [35,36], even though only [37] and [36] tried to quantify volumetric changes to assess coastal erosion issues. SfM techniques using more recent oblique aerial photographs were tested by [38] to measure the topographic changes of a coastal cliff. As demonstrated by [36], SfM approaches applied to historical aerial photographs can be used to quantify volumetric changes along sandy coastlines if several key requirements are fulfilled during the image preparation and processing stages. Volume changes, particularly in coastal dune fields, need to be quantified at the best achievable spatiotemporal scale, considering the essential role that dunes play in the evolutionary process of a coastal site [39,40,41,42].
The SfM analysis of historical aerial photographs requires several factors to be considered in any derivation of final DSMs. Commercial software programs usually follow a black box method, since no access to algorithms is provided [43,44]. The self-calibrating bundle adjustment routines provided by commercial software and applied to historical aerial photographs can produce positional errors in planimetry of up to 10 m if the calibration parameters of the camera are unknown [45]. Unfortunately, calibration certificates are quite rare [36,45], as are documents relating to the planning and operation of the flights [45]. According to [35], the scale and special characteristics of each archival photogrammetric dataset are the most important factors affecting the choice of self-calibration model. Therefore, is necessary to analyse every archival dataset with an independent and empirical method, depending on its own particular characteristics [35].
Commercial software programs have several options to treat the point cloud generated through the SfM method, but these options are usually not entirely exploited by the users. The aim of this paper is, therefore, to refine the structure-from-motion methodology using a commercial software (Agisoft Metashape Pro) to build reliable DSMs from historical aerial photographs. Twelve methods were used to build and refine the dense point cloud (DPC). Four different DPCs were built using the four options available in the software to filter the depth maps: (i) disabled, (ii) mild, (iii) moderate, and (iv) aggressive. Each DPC was then filtered to remove poor confidence values calculated by the software during the DPC reconstruction. In particular, we chose to clean the DPC in three ways: (i) without any further DPC cleaning (keeping all confidence values calculated by the software); (ii) by removing points from the DPC with confidence values between 0 and 2; (iii) by removing points from the DPC with confidence values between 0 and 3. Therefore, a total of twelve methods were adopted, resulting in twelve final DSMs.
The study site was chosen to compare archival aerial-derived DSMs to recent topographic data acquired from more accurate LiDAR and UAV technologies. Our study, therefore, assesses if the SfM analysis applied to historical aerial photographs can provide a robust method for building reliable, long-term (decadal) 3D models of coastal dune volume loss on retreating coasts.
2. Study Area
The study site is located in the Murlough beach and dune complex of Dundrum Bay (County Down, Northern Ireland, UK) (Figure 1). A wide sandy beach covers a large part of the bay, dominated by a unique geomorphic beach system known as multiple inter-tidal bars (MITB) [46], as well as an extensive ebb tidal delta feature, which effectively divides the southwest part of Newcastle and Murlough beaches from the eastern site of Ballykinler. A vegetated dune field dating back to the mid–late Holocene [47,48] extends from Newcastle to the inlet channel and from the latter to Ballykinler. A steep gravel ridge, representing the high tide mark [49], lies along the dune toe. The tidal environment is high mesotidal, with a mean spring tidal range of 3.85 m. Short-period wind waves with a mean significant wave height of 1 m are typical [49,50]. Modal winds are common from south and southwest directions, while storm winds are also common from the southeast quadrant [50,51]. The dune system of the Murlough Special Area of Conservation (SAC) has been managed by the National Trust since the 1960s.
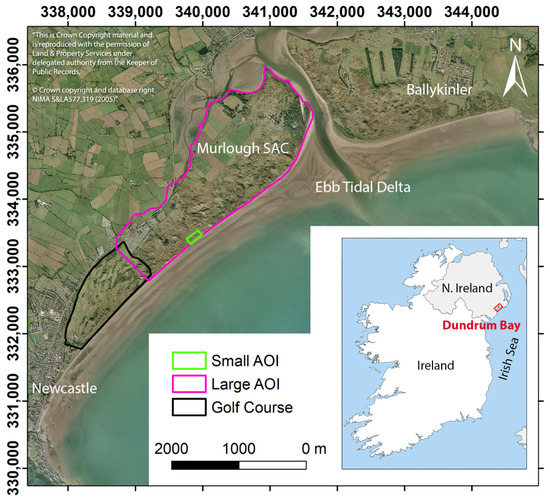
Figure 1.
Location of the study area with indications of the two areas of interest (AOIs). The background 2005 orthophoto was provided by the Ordnance Survey of Northern Ireland (OSNI). The graticule is in the TM75/Irish Grid (transverse mercator) projection. SAC stands for Special Area of Conservation.
Two areas of interest (AOIs) were chosen to perform comparisons between aerial-photograph-derived DSMs and a DSM derived from LiDAR and UAV surveys. A small AOI measuring approximately 220 m long and 100 m wide is located on a small portion of the coastal dune system (Figure 1). A larger AOI, approximately extending from the Royal County Down Golf Course, Newcastle, to the tidal inlet in the east (Figure 1), was chosen a posteriori based on the aerial photo overlap resulted from SfM process.
3. Materials and Methods
3.1. Historical Aerial Photographic Dataset
Six aerial photographs dated from 1963 were provided by the Ordnance Survey of Northern Ireland (OSNI). The aerial photographs (APs) were black and white with a 1:10,000 scale. Each photograph was scanned at 1200 dpi to obtain a high pixel resolution and to simplify ground control point (GCP) positioning and the surface matching during the SfM process. According to [27], the optimal scanning resolution to apply the SfM process on historical aerial photos is between 800 and 1600 dpi. The typical black border of archive aerial photographs was removed using a batch process in Adobe Photoshop [36]. The batch process was launched using the same selection area and taking care to select the largest area possible to maximise the overlap between images (Figure 2a). The final size achieved for each image (.TIFF format) was 9184 × 10352 pixels, with an average weight of 278 Mb per image.
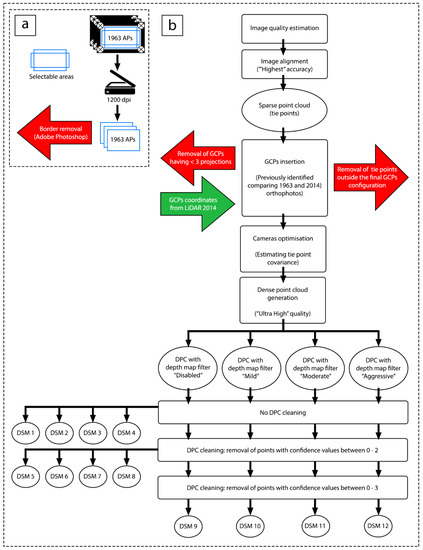
Figure 2.
Preparation workflow of aerial photographs (APs) from 1963 prior to the structure-from-motion process (a) and main steps (b) of the SfM process adopted for the APs from 1963 to produce the 12 digital surface models.
3.1.1. SfM Processing of Historical Aerial Photographs
The SfM process was performed by means of the commercial software Agisoft Metashape Pro (version 1.6.3; 64 bit). Prior to beginning the SfM process, a quality check performed by the software was made of each image, resulting in none having a coefficient quality lower than 0.63. Software specifications recommend to only use images with a coefficient quality higher than 0.5, since poor-quality input images can adversely affect alignment results, and therefore can also affect the following steps in the photogrammetric process [52]. Image alignment was performed by selecting “highest” as the accuracy in order to generate a denser sparse point cloud (SPC, a.k.a. tie points) at the end of this step (Figure 2b).
GCPs were identified by comparing the 2014 LiDAR-derived orthophotos and the 1963 aerial photographs by identifying locations where changes were minimal over the five decades. GCP coordinates (X,Y,Z) were retrieved from the 2014 LiDAR-derived DSM by carefully selecting points where the Z value was not influenced by nearby walls, buildings, or tall vegetation (Figure 3a–i). Highly dependent on local landscape changes (natural and anthropic) in the area during the 50 years in between, this was the most laborious but important step, since poor GCP recognition and distribution can adversely influence the final DSM output [34,35]. For the entire dataset, a total of 28 GCPs were identified, with a good spatial spread across the area represented by the six aerial photographs (Figure 4a).
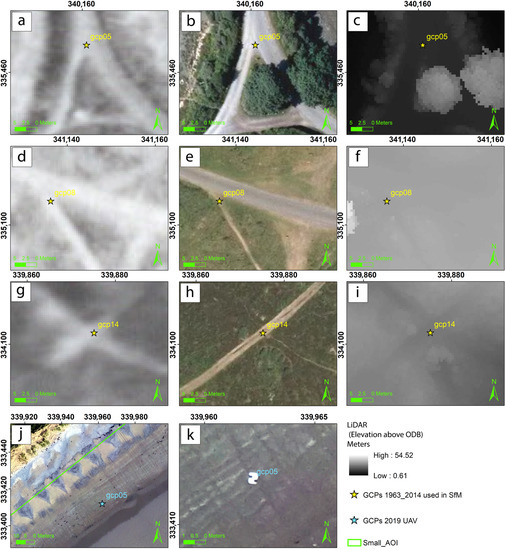
Figure 3.
Examples of co-registration ground control points (GCPs) in the historical and recent datasets. GCP05 in the 1963 aerial photograph (a), 2014 orthophoto (b), and 2014 light detection and ranging dataset (c). GCP08 in the 1963 aerial photograph (d), 2014 orthophoto (e), and 2014 light detection and ranging dataset (f). GCP14 in the 1963 aerial photograph (g), 2014 orthophoto (h), and 2014 light detection and ranging dataset (i). GCP05 in the 2019 unmanned aerial vehicle (UAV) image (j) and its enlargement (k). Note that GCP05 shown in (j,k) is not the same one shown in (a–c). Aerial photography images from 1963 and 2014 were provided by the Ordnance Survey of Northern Ireland. ODB stands for Ordnance Datum Belfast.
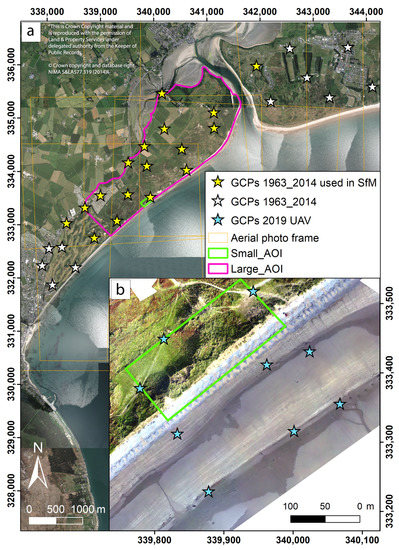
Figure 4.
Ground control point (GCPs) locations for both the structure-from-motion (SfM) of 1963 aerial photographs (a) and 2019 unmanned aerial vehicle (UAV) datasets (b). (a) The background is the 2014 orthophoto provided by the Ordnance Survey of Northern Ireland. (b) The background is the orthophoto produced by the SfM process from 2019 UAV images. The graticule is in TM75/Irish Grid (transverse mercator) projection.
Since each GCP must be visible in a minimum of three photographs (i.e., three projections for each GCP) to make it reliable [36], 17 of the original 28 GCPs were used in the photogrammetric process (Figure 4a). This resulted in a reduced reliable area produced by the SfM process approximately corresponding to the large AOI. Considering GCPs identified from the 1963 APs (spatial resolution 0.47 m) and from the LiDAR-derived DSM and orthophotos (spatial resolutions of 0.5 and 0.05 m, respectively), the XY accuracy of GCPs assigned in the SfM process was 0.5 m, whereas the Z accuracy was 0.069 m, as reported in the LiDAR metadata by the original contractors. After removing poorly projected GCPs, images were optimised and the SPC was manually cleaned, removing points located outside the whole GCP configuration (Figure 2b). GCPs returned mean errors on their locations of 2.3, 2.5, and 0.06 m for X, Y, and Z, respectively.
At this stage of the SfM process, various methods were used to build and refine the dense point cloud (DPC). Four different DPCs were built using the four options available in the software to filter the depth maps: (i) disabled, (ii) mild, (iii) moderate, and (iv) aggressive. For each method, we kept the DPC quality at “ultra high” to take advantage of the entire pixel number of APs. We also let the software estimate the confidence values of the four DPCs (Figure 2b).
Each DPC was then filtered to remove poor confidence values calculated by the software during the DPC reconstruction. In particular, we chose to clean the DPC in three ways: (i) without any further DPC cleaning (so keeping all the confidence values calculated by the software); (ii) by removing points from the DPC with confidence values between 0 and 2; (iii) by removing points from the DPC with confidence values between 0 and 3. Therefore, a total of twelve methods were adopted, resulting in twelve final DSMs (Figure 2b).
3.2. LiDAR Dataset
An airborne LiDAR dataset was acquired on the 4th of March 2014 for the coastal area that extends from the Newcastle town center to Ballykinler (Figure 1). The dataset was provided by the National Trust of the Murlough National Nature Reserve and the Ministry of Defence of the Ballykinler army camp. The LiDAR sensor acquired multiple returns with a point density greater than 30 ppm. Horizontal and vertical accuracy (root mean square error) values of 0.100 and 0.069 m, respectively, were reported in the metadata. The dataset was organised into tiles measuring 250 × 250 m provided by the original contractors, with a spatial resolution of 0.5 m. The flight was undertaken during high tide, meaning the topographic dataset is only reliable up to the gravel ridge, which lies at the dune toe.
3.3. UAV Dataset
A UAV survey was undertaken on the 2nd of October 2019 over the small AOI in Murlough beach (Figure 1) in ideal weather conditions, with wind speeds of less than 5 m/s. A flight plan was performed using Emotion flight planning software and an eBee fixed-wing UAV equipped with an RGB camera with 18.2 MP resolution at a flight altitude of 120 m and with 70% and 80% forward and lateral overlap, respectively. These settings enabled a ground image resolution of 0.030 m. Before the flight, nine checkerboard targets (GCPs, Figure 3l,m) were placed in order to include the foredune and the facing subaerial beach in the survey area (Figure 4b). Each GCP was measured using a DGNSS device (Trimble R10), with mean accuracy values of +/−0.016 m (horizontal) and 0.017 m (vertical). A total of 210 images were taken during a flight time of 17 min (divided into two subsequent flights), covering an area of 0.224 km.
SfM Processing of UAV Images
As was done for the APs, the SfM processing of UAV images was performed using Agisoft Metashape Pro (version 1.6.3; 64 bit) according to the following subsequent steps: (i) image alignment at the highest accuracy level; (ii) GCP positioning; (iii) manual cleaning of the SPC in the area outside the GCP spatial configuration; (iv) optimisation of camera alignment; (v) generation of the DPC with “ultra high” accuracy and the filter “disabled” for the depth maps; (vi) DPC cleaning by removing points with confidence values between 0 and 3, namely points where the software was unsure about the position; (vii) DSM and orthophoto generation from the dense point cloud. The final UAV-derived DSM reached a resolution of 0.030 m. GCPs returned mean errors on their locations of 0.026, 0.033, and 0.025 m for X, Y, and Z, respectively. A summary of the main characteristics of each SfM product is presented in Table 1.

Table 1.
Main outputs of the structure-from-motion process performed on unmanned aerial vehicle images.
3.4. 1963 DSM Accuracy Assessment and Validation
The quality of the DSMs produced by the twelve methods adopted for the processing of the 1963 APs was investigated by comparing Z values derived from the 2014 LiDAR-derived DSM, which were more reliable. The accuracy assessment was only possible for the large AOI (Figure 1), since areas with minimal changes such as roads, parking areas, and footpaths had to be identified between 1963 and 2014. In total, 512 independent points (a.k.a. check points) where topographic changes between 1963 and 2014 were supposed to be minimal were used in the validation. The root mean square error (RMSE), mean absolute error (MAE), standard deviation error (SDE), and the coefficient of determination (R2) were estimated on the same point population to check the quality of the twelve 1963 DSMs.
3.5. Geomorphic Changes and Volumetric Variation
Using the best DSM from the accuracy assessment, quantitative analyses were performed within the small AOI to estimate volume variations from 1963 to 2019. DEMs of differences (DoDs) and shorelines (i.e., stable vegetation lines) between each period were produced. Shorelines were digitised on the orthophoto of each dataset. DoDs were cut accordingly to the most recent shoreline for each period of comparison in order to avoid the influence of the dune vegetation as much as possible, which can complicate surface expression in the DSM derivation process. For each shoreline, an error was calculated as the root sum of the squares of the individual uncertainties associated with each dataset where the shoreline was digitised. Volume calculations were performed from the lowest elevation among the three DSMs (1.12 m above Ordnance Datum Belfast). Areas that experienced elevation changes small enough to be within the limit of detection (LoD) of each DSM comparison were removed from volumetric calculations. The LoD is a commonly used threshold in geomorphology when DoDs are analysed [44,53,54]. The LoD was considered equal to the standard deviation of the RMSE of each validated dataset (UAV-, LiDAR-, and AP-derived DSMs). Volume uncertainty was, therefore, estimated by multiplying the LoD for the area that experienced significant changes (i.e., above or below LoD).
4. Results
4.1. Accuracy Assessment of Aerial-Photograph-Derived DSMs
Among the twelve DSMs produced by adopting different depth map filtering and DPC cleaning modes (see Section 3.1.1), the best results were shown by the DSM produced with a “disabled” filter for the depth maps and with DPC cleaning performed removing points with confidence values ranging from 0 to 3. This method gave the smallest error values in terms of RMSE, MAE, and SDE and the strongest relationship (R2) between the 2014 LiDAR elevations and the elevations extracted from the AP-derived DSM (Table 2). The twelve DSMs showed RMSE values ranging between 0.93 and 1.12 m; with MAE values showing a larger variability, ranging from 0.86 to 1.25 m; and with SDE values that were restricted between 0.042 and 0.050 m. The variability was also very low among the R2 values, which were between 0.991 and 0.994 (Table 2 and Figure 5). This also means that the elevation residuals between the LiDAR and the AP-derived DSMs were quite consistent (following a linear trend) over the entire study site (i.e., 512 check points) and for each elevation range (Figure 5). The frequency distributions of elevation residual were normal, with a slightly positive skew in the majority of cases. The majority of residuals were included between +1 and −1 m (Figure 5).

Table 2.
Errors and coefficients of determination (R2) for each method used to improve the dense point cloud. Error values were calculated for 512 independent check points used to validate 1963 aerial-photograph-derived digital surface models against the 2014 light detection and ranging digital surface model.
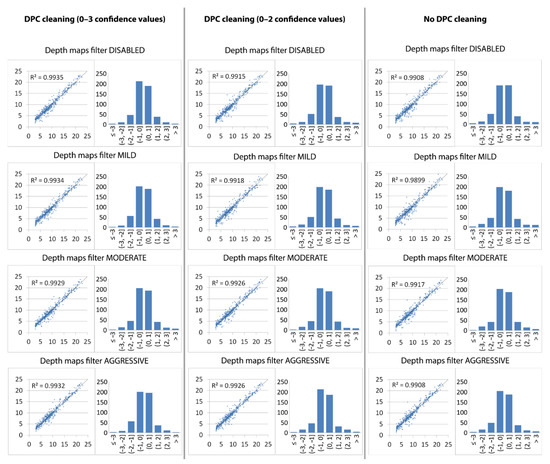
Figure 5.
Comparison between each method used to build the dense point cloud (DPC) from 1963 aerial photographs. Scatter plots of elevations and frequency distributions of elevation residuals between 1963 digital surface models (DSMs) and 2014 light detection and ranging (LiDAR) datasets are compared. Values in the X-axes of scatter plots are LiDAR elevations, while Y-axis values are DSM elevations; all values are given in meters. Values in the X-axes of frequency distributions are elevation residuals given in meters, while values in the Y-axes are number of check points (n = 512).
The elevation residuals from the best DSM resulting from the SfM process of APs showed a spatial pattern—the lowest values were concentrated where the best overlap between APs was possible, namely where all six aerial photographs overlap, in the central part of the large AOI (Figure 6). This was also the area that included the small AOI where the UAV survey was performed. Outside this area of maximum overlap, the largest differences were found in the dune area—cold colours (positive values) were more common moving towards the SW near the golf course, while warm colours (negative values) were more frequent moving towards NE near the tidal inlet and the sand spit (Figure 6). Cold colours (positive values) mean that the LiDAR elevations are higher than the elevations from the 1963 APs derived from DSM, and vice versa.
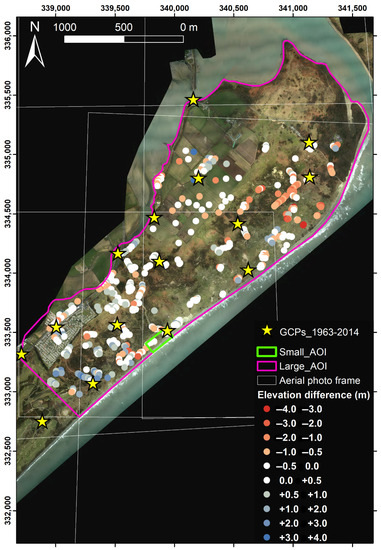
Figure 6.
Elevation difference between the digital surface model (DSM) derived from the light detection and ranging (LiDAR) survey from 2014 and the aerial photograph (AP) derived from the DSM from 1963 using the best structure-from-motion method resulting from the accuracy assessment. Cold colors (positive values) mean that the LiDAR-derived DSM is higher than the AP-derived DSM, and vice versa. The background 2014 orthophoto is derived from the LiDAR survey. The graticule is in TM75/Irish Grid (transverse mercator) projection.
The tie points variance in the SPC from the image alignment and camera optimisation (common to all twelve methods; Figure 2b) was good (cold colors in Figure 7a) in both the large AOI and in the small AOI. The dense point cloud confidence values varied between the three DPC cleaning modes. With no re-motion for poor DPC confidence values, the points used by the software to build the DSM covered a wider area, however with high uncertainty regarding their identification (warm colors in Figure 7b). With confidence values ranging between 0 and 2 removed from the DPC, the software then relied on more solid points, despite a restriction in the overall area (Figure 7c). With confidence values ranging between 0 and 3 removed, the area containing reliable 3D points became smaller, corresponding to the area of the maximum overlap between APs, however with more certainty in their identification and location (Figure 7d).
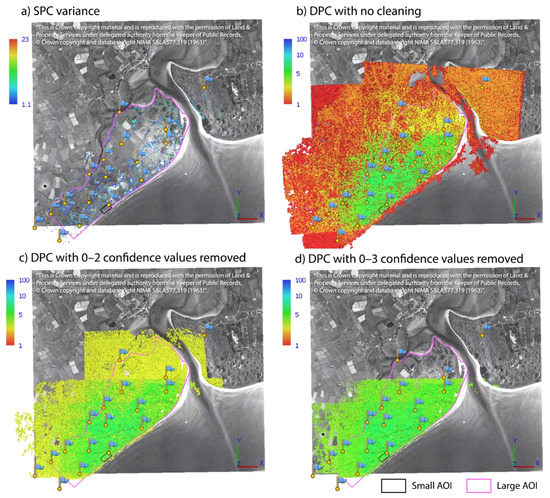
Figure 7.
(a) Sparse point cloud (SPC or tie points) variance values from image alignment and camera optimisation for all 12 methods applied. (b) Dense point cloud (DPC) confidence values for the methods that did not involve cleaning of the DPC. (c) Dense point cloud confidence values for the methods that involved cleaning of the DPC for confidence values in the range of 0–2. (d) Dense point cloud confidence values for the methods that involved cleaning of the DPC for confidence values in the range of 0–3. Blue flags represent the 17 ground control points used in the structure-from-motion process. The color bars (b–d) are logarithmic scales. The background 1963 aerial photograph was provided by the Ordnance Survey of Northern Ireland (OSNI).
A further qualitative check on how the twelve methods performed the DSM reconstruction from 1963 APs is given in Figure 8. A reference transect was chosen within the small AOI and each 1963 DSM was compared to the recent and more reliable topography of the 2014 LiDAR and 2019 UAV-derived DSMs. The dune topography was well-outlined until the foredune crest using each of the 12 methods; a greater variation is visible in the stoss dune faces, with decreasing noise from the methods with no DPC cleaning to the methods where the DPC cleaning was performed, with confidence values between 0 and 3 being removed (Figure 8). Despite the variation between the twelve methods used to reconstruct the topography of the dune slipface, a clear subsequent erosion of the 1963 foredune was observed.
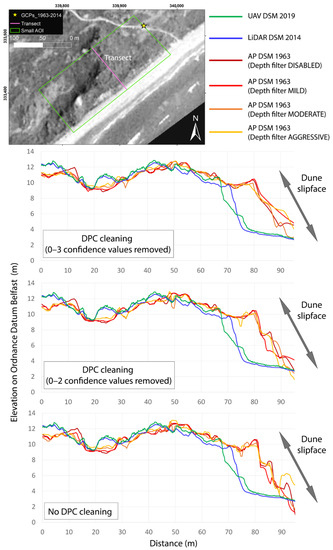
Figure 8.
Reference transect showing the differences between structure-from-motion methods used to build the 1963 digital surface model and the DSMs derived from light detection and ranging (LiDAR) and unmanned aerial vehicle (UAV) datasets. In the top right, the transect location is shown on the 1963 orthophoto derived from the SfM process. The graticule in TM75/Irish Grid (transverse mercator) projection.
4.2. Geomorphic Changes and Volumetric Variation
Further details of the 1963 foredune erosion in the small AOI can be seen in the DoDs and the shorelines shown in Figure 9. From 1963 to 2014, the shorelines (i.e., stable vegetation lines) experienced retreat distances of 5 ± 2 m (min) to 21 ± 2 m (max). These values were also representative of locations where the minimum and maximum elevation differences occurred (Figure 9a). From 1963 to 2014, total amounts of 11,139 ± 3429 m3 were eroded over a total length of 220 m. From 2014 to 2019, the shorelines remained relatively stable, with a maximum retreat distance of 7 ± 1 m and maximum seaward advance distance of 5 ± 1 m. General accretion volumes of 1921 ± 323 m3 affected the gravel ridge, with some erosion spots corresponding to a recent line of beach cusps detected during the 2019 UAV survey (Figure 9b). The overall period from 1963 to 2019 showed minimum retreat distances of 6 ± 2 m up to maximum values of 25 ± 2 m (Figure 9c), with eroded volumes of 9423 ± 3360 m3. To give an extra qualitative visualisation of the shoreline retreat over the last 56 years, the three shorelines were superimposed on the best 1963 DSM that resulted from the SfM analyses (Figure 10).
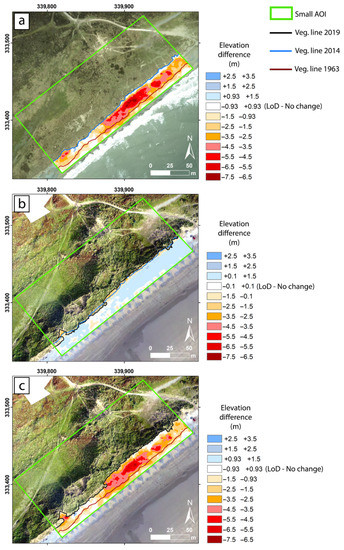
Figure 9.
DEMs of difference (DoDs) in the areas between the seaward limit of the small area Of interest and each shoreline (i.e., stable vegetation line): (a) geomorphic changes from 1963 to 2014 superimposed on the orthophoto produced from the 2014 light detection and ranging dataset; (b) geomorphic changes from 2014 to 2019 superimposed on the orthophoto derived from the structure-from-motion (SfM) process of the 2019 unmanned aerial vehicle (UAV) dataset; (c) geomorphic changes from 1963 to 2019 superimposed on the orthophoto derived from the SfM process of the 2019 UAV dataset. Graticules are in TM75/Irish Grid (transverse mercator) projection.
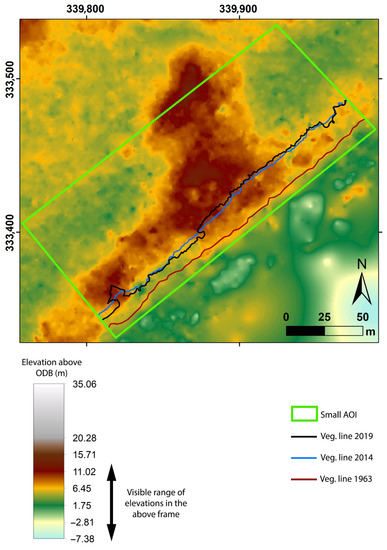
Figure 10.
Small area of interest showing the best 1963 digital surface model (DSM) resulting from the structure-from-motion process. Shorelines (vegetation lines) from 1963, 2014, and 2019 are superimposed on the 1963 DSM. The graticule is in TM75/Irish Grid (transverse mercator) projection and elevations are above the Ordnance Datum Belfast (ODB).
5. Discussion and Conclusions
All twelve adopted methods for depth map filtering and DPC cleaning gave an average error in Z of approximately 1 m. The more DPC cleaning performed and the less aggressive depth map filters adopted, the higher the accuracy of the topographic reconstruction. In our case, performing a good DPC cleaning process (0–3 confidence values removed from the DPC) was far more important than the filter adopted for the depth map reconstruction. Despite small differences in the computed Z errors were found among the adopted methods (RMSE values: 0.93–1.17 m), the largest disadvantage emerged from the removal of points from the DPC with confidence values ranging between 0 and 3, which resulted in a consistent restriction of the modeled area (Figure 7d). This aspect is highly important when approaching SfM techniques used on historical aerial photos, since the AOI cannot be entirely decided a priori compared to UAV surveys, where an ad hoc image capture must be planned according to the AOI [55]. Therefore, the DPC cleaning always has to be performed according to the objectives of the study, the quality of the aerial photographs, and the characteristics of the study site. The best method that emerged from our analyses cannot be considered valid in every topographic setting—robust validation of the SfM outputs always has to be performed depending on the objectives to be achieved and the environmental constraints of the study site. As argued by [35], the adoption of self-calibration routines provided by commercial software does not always guarantee good results, because such datasets are very dependent on local variables that cannot be extrapolated to other areas.
Despite all twelve methods demonstrating good performance in the reconstruction of the inner part of the large AOI (Table 2 and Figure 5) and recreating a similar topography up to the foredune crest, it is not clear why they differed so much in the slipface of the foredune (Figure 8). The small AOI was present on each of the six APs, therefore poor overlap between images was not a reason. Nevertheless, poor topographic reconstruction is also possible with good image overlap if the photographs are taken from similar viewpoints and with greater distances between the ground and cameras [30]. On the other hand, differences in camera orientation between images can influence the illumination of imaged areas and consequently alter the sharpness of homogeneous surfaces, thereby affecting the number and quality of identified tie points [1,56,57,58]. Having no information on flight conditions for the aerial survey, no precise considerations were carried out on the 1963 APs. Nevertheless, significant changes to camera orientation axes, even though estimated by the software, can be largely excluded (Table 3). The only exception was the yaw axis, which revealed a 180° direction change performed by the aircraft to take the second strip of photos (Table 3), but that should not have changed the illumination between the two strips. Variations in camera elevation can also adversely influence the image matching [1,59]. In our case, the maximum estimated difference between the images was 41 ± 25 m (Table 3), which could have disturbed the matching of homogeneous surfaces in the foredune slipface. Furthermore, that area, being very steep and narrow if compared to its rear, could have disturbed the image matching and could consequently have been interpretated by each depth map filter in different ways (Figure 8). One study [60] using APs with similar survey acquisition elevations (3000–4000 m) and similar image resolutions (0.42–0.49 m) found absolute Z errors of 0.6–0.8 m, even though more recent APs (from 1980s to 2000s) were used. The same authors using another set of APs found an error of 1.2 m with coeval photos (1962), a similar scale (1:10,000), and more than double resolution (0.20 m) if compared to that used in our study. Having the actual camera specifications and flight characteristics could slightly improve the error, as demonstrated by [60], even though it is very rare that APs come with all of these specifications [36].

Table 3.
Orientation values for each axis (Yaw, Pitch and Roll) estimated by the software for each 1963 aerial photograph. The variance of each axis and the estimated camera elevation is also listed. The values, being a product of the image alignment, are common to all 12 methods used to reconstruct the 1963 digital surface models.
The main cause of the different reconstruction results for the foredune slipface was probably due to the fact that the area is outside the GCP configuration. Indeed, many authors have argued that for SfM-derived DSMs, better reliability occurs in the area delimited by GCPs [16,59,61,62]. Despite the GCPs being well-spread across the large AOI (Figure 4a) and one GCP being in the small AOI (Figure 8), the lack of GCPs on the seaward side makes the area outside the entire GCP configuration less reliable in the seaward area. For this reason, coastal areas sometimes containing artificial structures such as groynes or jetties could help extend GCP configurations further seaward and provide a more reliable topographic reconstruction of the coastal fringe. Similar issues are well known in the reconstruction of former glacial topographies, which are often unlikely to be fixed over long periods of time due to the degrading permafrost and glacial recession [63]. In these environments, ground control points are limited to stable (non-glacial) locations within the image scene, which may leave large areas of the surface model unconstrained and subject to greater errors [63]. The DSMs derived from the SfM process of aerial photographs are usually a partial coverage dataset [36,37], since good aerial coverage of the final DSM depends on a good number and spatially uniform distribution of GCPs and a good overlap between photographs. Furthermore, aerial photographs typically come with a black or white border with indentations at the four corners, which reduce the overlap area between photos and the chance to place extra GCPs in this area. As stated by [25], image overlap or configuration and image texture are crucial drivers in the tie point generation and in the bundle adjustment phases.
The level of uncertainty provided by the AP-derived DSMs is not comparable to the LoD achievable today with modern spatial acquisition technologies such as LiDAR, DGNSS, UAVs, or even recent satellite data. Nevertheless, aerial photographs seem to be the most common documents available for identifying 3D geomorphic features in the period ranging from the 1930s to 1990s (depending on local photos available) [45,64,65]; therefore, a vertical uncertainty of barely 1 m is acceptable. One study [36] found Z error values (RMSE) varying between 0.50 to 0.91 m over two study sites and three different AP datasets. Another study [2] measured the RMSE in Z of 1.049 m, whereas [27] measured RMSE values in Z ranging between 2.11 and 1.98 m, analysing APs with resolutions of 800 and 1600 dpi over a complex topography. The uncertainty could be improved if a reliable and automatic method could be developed to remove the influence of vegetation from the DSM. When dealing with complex topography such as the vegetated dune area of this study site or glacial topographies in steep mountains, vertical differences may increase, mainly due to the influence of poorly constrained topographies because of a limited viewshed, shading, and steep terrain [63]. The relationship between slope and topographic error is indeed well known [63], and it has been found that in very steep terrain, horizontal errors are closely coupled to the vertical ones [66,67,68]. We chose to validate the AP-derived DSMs against other more accurate DSMs, knowing that the vegetation would have been included. Therefore, during the validation stage, a crucial aspect is to identify areas where minimal changes occur.
Another option would be to measure the check points with a DGNSS, even though in our case, given the large area of AOI, not every measuring site would have been physically reachable. If the LiDAR data are accurate enough (here the values were 0.100 and 0.069 m for X–Y and Z, respectively) to detect long-term geomorphic processes (e.g., dune erosion over several decades), the SfM approach for historical aerial photos can also be adopted elsewhere without the use of a DGNSS and with a reliable GCP configuration, as demonstrated by [34,36]. The option of validating AP-derived DSMs against LiDAR data is a common approach, especially when the AOIs are large [34,36] or where the field sites are not easily accessible [2,38]. In some cases, DEMs derived from SfM process of historical APs can also be validated against more recent and more accurate DEMs [26,29]. Furthermore, finding sufficient check points that are easily and precisely identifiable to be measured with a DGNSS can be problematic in actively changing landscapes [28]. As already highlighted by [36], SfM approaches using historical aerial photos can be used to approximately quantify volume variations on sandy coastlines, albeit with consideration of the LoD in any volume calculations [44,53]. Furthermore, photos taken at low tide are preferred if volume calculations of the supratidal and intertidal beach are performed.
Despite no information being available for 1963 APs in terms of flight conditions and camera characteristics, the twelve applied methods gave a very satisfactory vertical error of approximately 1 m, with a maximum RMSE of 0.93 m. In our case, the best combination of steps in the SfM process resulted from removing confidence values ranging between 0 and 3 from the DPC and disabling the filter for the depth map reconstruction. Some issues arose in the reconstruction of the slipface of the foredune, likely due to the paucity of GCPs on the seaward side of the AOIs. This represents a typical limitation in the use of SfM process for historical aerial photographs and possibly explains the lack of adoption of this method for coastal geomorphological studies. AP-derived DSMs can be used to quantify approximate volumetric changes if reliable estimations of the Z error and LoD of the DoDs are provided. Despite these limitations, the SfM process of historical aerial photographs is promising and represents an opportunity to build long-term 3D datasets of coastal dune volumes to add to other existing datasets at sites. Reliable long-term 3D datasets could be used to better refine the numerical modeling of shoreline variation, dune erosion, or even hydrodynamic models of the subaerial beach if the GCP configuration can be improved in seaward areas.
Author Contributions
Conceptualization, D.R., D.W.T.J., and E.G.; methodology, E.G. and D.R.; fieldwork, E.G., M.B., and D.R.; software, E.G.; validation, E.G.; data curation, E.G.; writing—original draft preparation, E.G.; writing—review and editing, M.B., D.R., D.W.T.J., and J.A.G.C.; funding acquisition, D.W.T.J. and J.A.G.C. All authors have read and agreed to the published version of the manuscript.
Funding
This work is part of the MarPAMM project, funded by the European Union’s Interreg V-A Programme (https://www.mpa-management.eu). This work is a contribution to the Natural Environment Research Council project NE/F019483/1.
Informed Consent Statement
Not applicable.
Data Availability Statement
The data presented in this study are available on request from the corresponding author.
Acknowledgments
We would like to thank the Murlough National Nature Reserve of the National Trust and the Ministry of Defence of the Ballykinler army camp for providing us the LiDAR dataset and facilitating the access to the study site. The Ordnance Survey of Northern Ireland is acknowledged for the use of aerial photography.
Conflicts of Interest
The authors declare no conflict of interest.
Abbreviations
The following abbreviations are frequently used in this manuscript:
| AOI | Area of Interest |
| AP | Aerial Photograph |
| DEM | Digital Elevation Model |
| DoD | DEM of Difference |
| DPC | Dense Point Cloud |
| DSM | Digital Surface Model |
| GCP | Ground Control Point |
| DGNSS | Differential Global Navigation Satellite System |
| LiDAR | Light Detection And Ranging |
| LoD | Limit of Detection |
| MAE | Mean Absolute Error |
| OSNI | Ordnance Survey of Northern Ireland |
| RMSE | Root Mean Square Error |
| SDE | Standard Deviation Error |
| SfM | Structure-from-Motion |
| SPC | Sparse Point Cloud |
| UAV | Unmanned Aerial Vehicle |
References
- Guisado-Pintado, E.; Jackson, D.W.T.; Rogers, D. 3D mapping efficacy of a drone and terrestrial laser scanner over a temperate beach-dune zone. Geomorphology 2019, 328, 157–172. [Google Scholar] [CrossRef]
- Fonstad, M.A.; Dietrich, J.T.; Courville, B.C.; Jensen, J.L.; Carbonneau, P.E. Topographic structure from motion: A new development in photogrammetric measurement. Earth Surf. Proc. Land. 2013, 38, 421–430. [Google Scholar] [CrossRef]
- Splinter, K.D.; Harley, M.D.; Turner, I.L. Remote Sensing Is Changing Our View of the Coast: Insights from 40 Years of Monitoring at Narrabeen-Collaroy, Australia. Remote Sens. 2018, 10, 1744. [Google Scholar] [CrossRef]
- Montaño, J.; Coco, G.; Antolínez, J.A.; Beuzen, T.; Bryan, K.R.; Cagigal, L.; Castelle, B.; Davidson, M.A.; Goldstein, E.B.; Ibaceta, R.; et al. Blind testing of shoreline evolution models. Sci. Rep. 2020, 10, 2137. [Google Scholar] [CrossRef] [PubMed]
- Vitousek, S.; Barnard, P.L.; Limber, P.; Erikson, L.; Cole, B. A model integrating longshore and cross-shore processes for predicting long-term shoreline response to climate change. J. Geophys. Res. Earth Surf. 2017, 122, 782–806. [Google Scholar] [CrossRef]
- Stockdon, H.F.; Sallenger, A.H., Jr.; Holman, R.A.; Howd, P.A. A simple model for the spatially-variable coastal response to hurricanes. Mar. Geol. 2007, 238, 1–20. [Google Scholar] [CrossRef]
- Overbeck, J.R.; Long, J.W.; Stockdon, H.F. Testing model parameters for wave-induced dune erosion using observations from Hurricane Sandy. Geophys. Res. Lett. 2017, 44, 937–945. [Google Scholar] [CrossRef]
- Cooper, J.A.G.; Masselink, G.; Coco, G.; Short, A.D.; Castelle, B.; Rogers, K.; Anthony, E.; Green, A.N.; Kelley, J.T.; Pilkey, O.H.; et al. Sandy beaches can survive sea-level rise. Nat. Clim. Chang. 2020, 10, 993–995. [Google Scholar] [CrossRef]
- Vousdoukas, M.I.; Ranasinghe, R.; Mentaschi, L.; Plomaritis, T.A.; Athanasiou, P.; Luijendijk, A.; Feyen, L. Sandy coastlines under threat of erosion. Nat. Clim. Chang. 2020, 10, 260–263. [Google Scholar] [CrossRef]
- Ibaceta, R.; Splinter, K.D.; Harley, M.D.; Turner, I.L. Enhanced coastal shoreline modelling using an Ensemble Kalman Filter to include non-stationarity in future wave climates. Geophys. Res. Lett. 2020, 47, e2020GL090724. [Google Scholar] [CrossRef]
- McCarroll, R.J.; Masselink, G.; Valiente, N.G.; Scott, T.; Wiggins, M.; Kirby, J.A.; Davidson, M. A novel rules-based shoreface translation model for predicting future coastal change: ShoreTrans. Earth arXiv 2020. [Google Scholar] [CrossRef]
- Williams, J.J.; Conduché, T.; Esteves, L.S. Modelling long-term morphodynamics in practice: Uncertainties and compromises. In Proceedings of the Coastal Sediments 2015, 8th International Symposium on Coastal Sediment Processes, San Diego, CA, USA, 11–15 May 2015; Rosati, J.D., Cheng, J., Eds.; [Google Scholar] [CrossRef]
- Cooper, J.A.G.; Green, A.N.; Loureiro, C. Geological constraints on mesoscale coastal barrier behaviour. Glob. Planet Chang. 2018, 168, 15–34. [Google Scholar] [CrossRef]
- Turner, I.L.; Harley, M.D.; Drummond, C.D. UAVs for coastal surveying. Coast Eng. 2016, 114, 19–24. [Google Scholar] [CrossRef]
- Specht, C.; Dabrowski, P.S.; Specht, M. 3D modelling of beach topography changes caused by the tombolo phenomenon using terrestrial laser scanning (TLS) and unmanned aerial vehicle (UAV) photogrammetry on the example of the city of Sopot. Geo-Mar. Lett. 2020, 40, 675–685. [Google Scholar] [CrossRef]
- Casella, E.; Drechsel, J.; Winter, C.; Benninghoff, M.; Rovere, A. Accuracy of sand beach topography surveying by drones and photogrammetry. Geo-Mar. Lett. 2020, 40, 255–268. [Google Scholar] [CrossRef]
- Duo, E.; Trembanis, A.C.; Dohner, S.; Grottoli, E.; Ciavola, P. Local-scale post-event assessments with GPS and UAV-based quick-response surveys: A pilot case from the Emilia-Romagna (Italy) coast. Nat. Hazards Earth Syst. Sci. 2018, 18, 2969–2989. [Google Scholar] [CrossRef]
- Dohner, S.M.; Pilegard, T.C.; Trembanis, A.C. Coupling Traditional and Emergent Technologies for Improved Coastal Zone Mapping. Estuar. Coast. 2020, 1–23. [Google Scholar] [CrossRef]
- Talavera, L.; del Río, L.; Benavente, J. UAS-based High-resolution Record of the Response of a Seminatural Sandy Spit to a Severe Storm. J. Coast. Res. 2020, 95, 679–683. [Google Scholar] [CrossRef]
- Del Río, L.; Posanski, D.; Gracia, F.J.; Pérez-Romero, A.M. Application of Structure-from-Motion Terrestrial Photogrammetry to the Assessment of Coastal Cliff Erosion Processes in SW Spain. J. Coast. Res. 2020, 95, 1057–1061. [Google Scholar] [CrossRef]
- Pikelj, K.; Ružić, I.; Ilić, S.; James, M.R.; Kordić, B. Implementing an efficient beach erosion monitoring system for coastal management in Croatia. Ocean Coast. Manag. 2020, 156, 223–238. [Google Scholar] [CrossRef]
- Conlin, M.; Cohn, N.; Ruggiero, P. A quantitative comparison of low-cost structure from motion (SfM) data collection platforms on beaches and dunes. J. Coast. Res. 2018, 34, 1341–1357. Available online: https://www.jstor.org/stable/26538613 (accessed on 30 November 2020). [CrossRef]
- Duffy, J.P.; Shutler, J.D.; Witt, M.J.; DeBell, L.; Anderson, K. Tracking fine-scale structural changes in coastal dune morphology using kite aerial photography and uncertainty-assessed structure-from-motion photogrammetry. Remote Sens. 2018, 10, 1494. [Google Scholar] [CrossRef]
- Sevara, C.; Verhoeven, G.; Doneus, M.; Draganits, E. Surfaces from the Visual Past: Recovering High-Resolution Terrain Data from Historic Aerial Imagery for Multitemporal Landscape Analysis. J. Archaeol. Method Theory 2018, 25, 611–642. [Google Scholar] [CrossRef] [PubMed]
- Bakker, M.; Lane, S.N. Archival photogrammetric analysis of river–floodplain systems using Structure from Motion (SfM) methods. Earth Surf. Proc. Land. 2017, 42, 1274–1286. [Google Scholar] [CrossRef]
- Pulighe, G.; Fava, F. DEM extraction from archive aerial photos: Accuracy assessment in areas of complex topography. Eur. J. Remote Sens. 2013, 46, 363–378. [Google Scholar] [CrossRef]
- Seccaroni, S.; Santangelo, M.; Marchesini, I.; Mondini, A.C.; Cardinali, M. High resolution historical topography: Getting more from archival aerial photographs. In Proceedings of the 2nd International Electronic Conference on Remote Sensing (ECRS 2018) Sciforum Electronic Conference Series (online), 22 March–5 April 2018. [Google Scholar]
- Micheletti, N.; Lane, S.N.; Chandler, J.H. Application of archival aerial photogrammetry to quantify climate forcing of alpine landscapes. Photogramm. Rec. 2015, 30, 143–165. [Google Scholar] [CrossRef]
- Mölg, N.; Bolch, T. Structure-from-Motion Using Historical Aerial Images to Analyse Changes in Glacier Surface Elevation. Remote Sens. 2017, 9, 1021. [Google Scholar] [CrossRef]
- Mertes, J.R.; Gulley, J.D.; Benn, D.I.; Thompson, S.S.; Nicholson, L.I. Using structure-from-motion to create glacier DEMs and orthoimagery from historical terrestrial and oblique aerial imagery. Earth Surf. Proc. Land. 2017, 42, 2350–2364. [Google Scholar] [CrossRef]
- Modica, G.; Praticò, S.; Di Fazio, S. Abandonment of traditional terraced landscape: A change detection approach (a case study in Costa Viola, Calabria, Italy). Land Degrad. Dev. 2017, 28, 2608–2622. [Google Scholar] [CrossRef]
- Gomez, C.; Hayakawa, Y.; Obanawa, H. A study of Japanese landscapes using structure from motion derived DSMs and DEMs based on historical aerial photographs: New opportunities for vegetation monitoring and diachronic geomorphology. Geomorphology 2015, 242, 11–20. [Google Scholar] [CrossRef]
- Nikolakopoulos, K.G.; Soura, K.; Koukouvelas, I.K.; Argyropoulos, N.G. UAV vs. classical aerial photogrammetry for archaeological studies. J. Archaeol. Sci. 2017, 14, 758–773. [Google Scholar] [CrossRef]
- Bożek, P.; Janus, J.; Mitka, B. Analysis of Changes in Forest Structure using Point Clouds from Historical Aerial Photographs. Remote Sens. 2019, 11, 2259. [Google Scholar] [CrossRef]
- Aguilar, M.A.; Aguilar, F.J.; Fernández, I.; Mills, J.P. Accuracy assessment of commercial self-calibrating bundle adjustment routines applied to archival aerial photography. Photogramm. Rec. 2013, 28, 96–114. [Google Scholar] [CrossRef]
- Carvalho, R.C.; Kennedy, D.M.; Niyazi, Y.; Leach, C.; Konlechner, T.M.; Ierodiaconou, D. Structure-from-Motion photogrammetry analysis of historical aerial photography: Determining beach volumetric change over decadal scales. Earth Surf. Proc. Land. 2020, 45, 2540–2555. [Google Scholar] [CrossRef]
- Redweik, P.; Garzón, V.; Pereira, T.S. Recovery of stereo aerial coverage from 1934 and 1938 into the digital era. Photogramm. Rec. 2016, 31, 9–28. [Google Scholar] [CrossRef]
- Warrick, J.A.; Ritchie, A.C.; Adelman, G.; Adelman, K.; Limber, P.W. New techniques to measure cliff change from historical oblique aerial photographs and structure-from-motion photogrammetry. J. Coast. Res. 2017, 33, 39–55. [Google Scholar] [CrossRef]
- Montreuil, A.L.; Bullard, J.; Chandler, J. Detecting seasonal variations in embryo dune morphology using a terrestrial laser scanner. J. Coast. Res. 2013, 65, 1313–1318. [Google Scholar] [CrossRef]
- Mancini, F.; Dubbini, M.; Gattelli, M.; Stecchi, F.; Fabbri, S.; Gabbianelli, G. Using unmanned aerial vehicles (UAV) for high-resolution reconstruction of topography: The structure from motion approach on coastal environments. Remote Sens. 2013, 5, 6880–6898. [Google Scholar] [CrossRef]
- Scarelli, F.M.; Sistilli, F.; Fabbri, S.; Cantelli, L.; Barboza, E.G.; Gabbianelli, G. Seasonal dune and beach monitoring using photogrammetry from UAV surveys to apply in the ICZM on the Ravenna coast (Emilia-Romagna, Italy). Remote Sens. Appl. Soc. Environ. 2017, 7, 27–39. [Google Scholar] [CrossRef]
- Fabbri, S.; Giambastiani, B.M.; Sistilli, F.; Scarelli, F.; Gabbianelli, G. Geomorphological analysis and classification of foredune ridges based on Terrestrial Laser Scanning (TLS) technology. Geomorphology 2017, 295, 436–451. [Google Scholar] [CrossRef]
- Casella, V.; Chiabrando, F.; Franzini, M.; Manzino, A.M. Accuracy Assessment of a UAV Block by Different Software Packages, Processing Schemes and Validation Strategies. ISPRS Int. J. Geo-Inf. 2020, 9, 164. [Google Scholar] [CrossRef]
- James, M.R.; Robson, S.; Smith, M.W. 3-D uncertainty-based topographic change detection with structure-from-motion photogrammetry: Precision maps for ground control and directly georeferenced surveys. Earth Surf. Proc. Land. 2017, 42, 1769–1788. [Google Scholar] [CrossRef]
- Pérez, J.A.; Bascon, F.M.; Charro, M.C. Photogrammetric usage of 1956–57 USAF aerial photography of Spain. Photogramm. Rec. 2014, 29, 108–124. [Google Scholar] [CrossRef]
- Biausque, M.; Grottoli, E.; Jackson, D.W.T.; Cooper, J.A.G. Multiple intertidal bars on beaches: A review. Earth Sci. Rev. 2020, 210, 103358. [Google Scholar] [CrossRef]
- Orford, J.; Murdy, J. Murlough dunes. In Field Guide to the Coastal Environment of Northern Ireland; Knight, J., Ed.; Prepared for the Excursion Component for the International Coastal Symposium: Coleraine, UK, 25–29 March 2002; University of Ulster: Coleraine, UK, 2002; pp. 57–58. [Google Scholar]
- Orford, J.D.; Murdy, J.M.; Wintle, A.G. Prograded Holocene beach ridges with superimposed dunes in north-east Ireland: Mechanisms and timescales of fine and coarse beach sediment decoupling and deposition. Mar. Geol. 2003, 194, 47–64. [Google Scholar] [CrossRef]
- Cooper, J.A.G.; Navas, F. Natural bathymetric change as a control on century-scale shoreline behaviour. Geol. Soc. Am. 2004, 32, 513–516. [Google Scholar] [CrossRef]
- Orford, J.D. A review of tides, currents and waves in the Irish Sea. In The Irish Sea: A Resource at Risk; Sweeney, J.C., Ed.; Geographical Society of Ireland, Special Publications: Dublin, Ireland, 1989; Volume 3, pp. 18–46. [Google Scholar]
- Navas, F. Coastal Morphodynamics of Dundrum Bay, Co. Down, Northern Ireland. Ph.D. Thesis, University of Ulster, Northern Ireland, UK, 1999. [Google Scholar]
- Agisoft Metashape Pro. Image quality. In Agisoft Metashape User Manual: Professional Edition, version 1.5; Agisoft LLC: St. Petersburg, Russia, 2019. [Google Scholar]
- Wheaton, J.M.; Brasington, J.; Darby, S.E.; Sear, D.A. Accounting for uncertainty in DEMs from repeat topographic surveys: Improved sediment budgets. Earth Surf. Proc. Land. 2010, 35, 136–156. [Google Scholar] [CrossRef]
- Milan, D.J.; Heritage, G.L.; Large, A.R.G.; Fuller, I.C. Filtering spatial error from DEMs: Implications for morphological change estimation. Geomorphology 2011, 125, 160–171. [Google Scholar] [CrossRef]
- James, M.R.; Chandler, J.H.; Eltner, A.; Fraser, C.; Miller, P.E.; Mills, J.P.; Noble, T.; Robson, S.; Lane, S.N. Guidelines on the use of structure-from-motion photogrammetry in geomorphic research. Earth Surf. Proc. Land. 2019, 44, 2081–2084. [Google Scholar] [CrossRef]
- James, M.R.; Robson, S. Straightforward reconstruction of 3D surfaces and topography with a camera: Accuracy and geoscience application. J. Geophys. Res. Earth 2012, 117, F03017. [Google Scholar] [CrossRef]
- Gienko, G.A.; Terry, J.P. Three-dimensional modeling of coastal boulders using multi-view image measurements. Earth Surf. Proc. Land. 2014, 39, 853–864. [Google Scholar] [CrossRef]
- Seymour, A.C.; Ridge, J.T.; Rodriguez, A.B.; Newton, E.; Dale, J.; Johnston, D.W. Deploying fixed wing Unoccupied Aerial Systems (UAS) for coastal morphology assessment and management. J. Coast. Res. 2018, 34, 704–717. [Google Scholar] [CrossRef]
- James, M.R.; Robson, S.; d’Oleire-Oltmanns, S.; Niethammer, U. Optimising UAV topographic surveys processed with structure-from-motion: Ground control quality, quantity and bundle adjustment. Geomorphology 2017, 280, 51–66. [Google Scholar] [CrossRef]
- Ishiguro, S.; Yamano, H.; Oguma, H. Evaluation of DSMs generated from multi-temporal aerial photographs using emerging structure from motion–multi-view stereo technology. Geomorphology 2016, 268, 64–71. [Google Scholar] [CrossRef]
- Yu, J.J.; Kim, D.W.; Lee, E.J.; Son, S.W. Determining the Optimal Number of Ground Control Points for Varying Study Sites through Accuracy Evaluation of Unmanned Aerial System-Based 3D Point Clouds and Digital Surface Models. Drones 2020, 4, 49. [Google Scholar] [CrossRef]
- Zimmerman, T.; Jansen, K.; Miller, J. Analysis of UAS Flight Altitude and Ground Control Point Parameters on DEM Accuracy along a Complex, Developed Coastline. Remote Sens. 2020, 12, 2305. [Google Scholar] [CrossRef]
- Midgley, N.G.; Tonkin, T.N. Reconstruction of former glacier surface topography from archive oblique aerial images. Geomorphology 2017, 282, 18–26. [Google Scholar] [CrossRef]
- Smith, G.L.; Zarillo, G.A. Calculating Long-Term Shoreline Recession Rates Using Aerial Photographic and Beach Profiling Techniques. J. Coast. Res. 1990, 6, 111–120. Available online: http://www.jstor.org/stable/4297648 (accessed on 15 April 2020).
- Anders, F.J.; Byrnes, M.R. Accuracy of shoreline change rates as determined from maps and aerial photographs. Shore Beach 1991, 59, 17–26. [Google Scholar]
- Nuth, C.; Kohler, J.; Aas, H.F.; Brandt, O.; Hagen, J.O. Glacier geometry and elevation changes on Svalbard (1936–90): A baseline dataset. Ann. Glaciol. 2007, 46, 106–116. [Google Scholar] [CrossRef]
- Nuth, C.; Kääb, A. Co-registration and bias corrections of satellite elevation data sets for quantifying glacier thickness change. Cryosphere 2011, 5, 271–290. [Google Scholar] [CrossRef]
- Mosbrucker, A.R.; Major, J.J.; Spicer, K.R.; Pitlick, J. Camera system considerations for geomorphic applications of SfM photogrammetry. Earth Surf. Proc. Land. 2017, 42, 969–986. [Google Scholar] [CrossRef]
Publisher’s Note: MDPI stays neutral with regard to jurisdictional claims in published maps and institutional affiliations. |
© 2020 by the authors. Licensee MDPI, Basel, Switzerland. This article is an open access article distributed under the terms and conditions of the Creative Commons Attribution (CC BY) license (http://creativecommons.org/licenses/by/4.0/).