Comparison of Statistical Modelling Approaches for Estimating Tropical Forest Aboveground Biomass Stock and Reporting Their Changes in Low-Intensity Logging Areas Using Multi-Temporal LiDAR Data


 ,
, 

 , , ,
, , ,  , and
, and 
Abstract

1. Introduction
- (i)
- Evaluate the performance of ordinary least squares (OLS) regression modelling and nine machine learning algorithms: random forest (RF), several variations of k-nearest neighbour (k-NN), support vector machine (SVM), and artificial neural networks (ANN)
- (ii)
- Estimate AGB stocks and report AGB change at the landscape level using the best model from the previous step and multi-temporal LiDAR datasets.
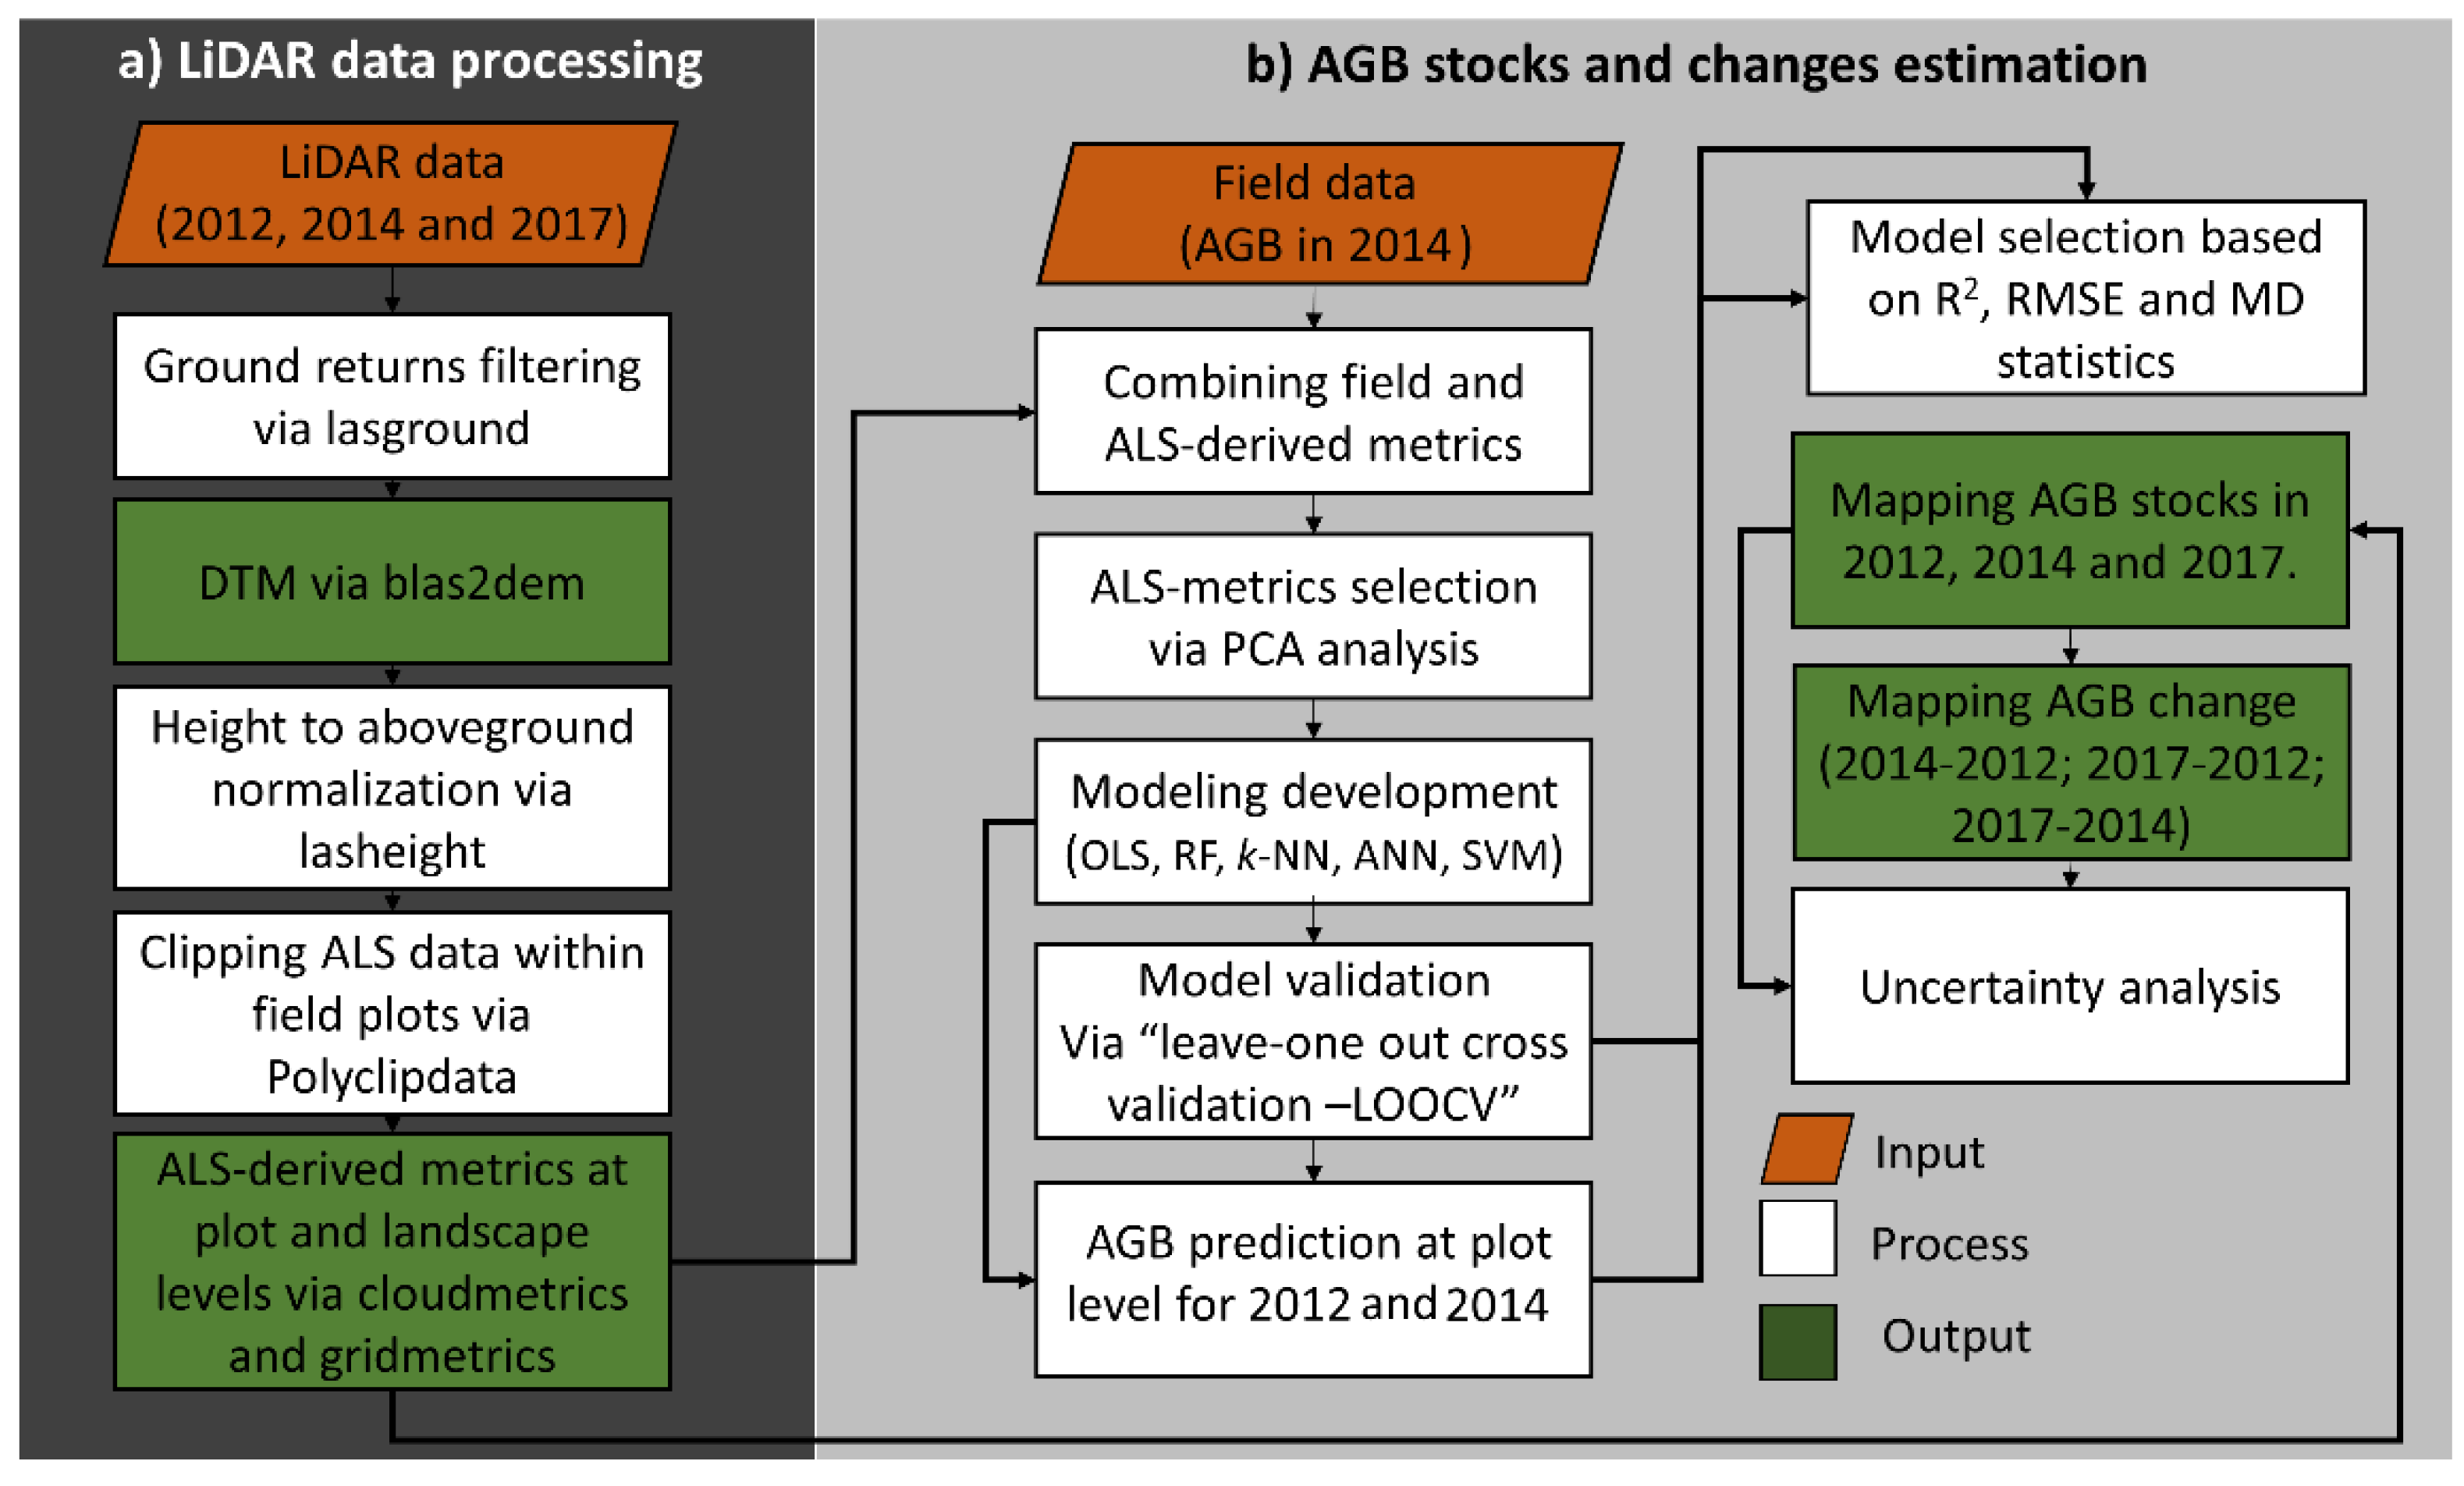
2. Materials and Methods
2.1. Study Area
2.2. Field Data
2.3. Lidar Data and Processing
2.4. Model Development and Assessment
- (i)
- Ordinary Least Squares (OLS) regression. This is a common method for modelling and predicting AGB from LiDAR metrics. The OLS model was implemented in R with the “lm” function.
- (ii)
- Random Forest (RF). The RF algorithm was implemented in R using the randomForest package [43]. In RF, ntree was set to 1000, and the other parameters (e.g. mtry) were left in RF default mode.
- (iii)
- k-Nearest Neighbour (k-NN) imputation. This is a non-parametric method used for regression and classification [44]. In this study, we conducted k-NN using the package yaImpute in R [45]. For each imputation, we set k = 1 neighbour to preserve the variance of the data [46]. Neighbour weighting methods used were the Euclidean (k-NN-EU), Mahalanobis (k-NN-MA), Most Similar Neighbour (k-NN-MSN), Independent Component Analysis (k-NN-ICA), Random Forest (k-NN-RF), and raw (unweighted) data (k-NN-RAW).
- (iv)
- Support Vector Machine (SVM). This is a non-parametric statistical method. The SVM algorithm was performed using the R package e1071 via an epsilon-regression with the default epsilon value of 0.1 [47].
- (v)
- Artificial neural network (ANN). Here, a simulation of a biological neural network system using mathematical modelling is performed [48]. Normally, three layers of neurons make up a neural network: an input layer, a hidden layer, and an output layer. The nnt package in R was used for the ANN [49]. The hidden layer neurons parameter was set to 40, and the input and hidden nodes were set to compute the logistic function, while the output node was set to compute a linear function. Before running ANN, the dataset was standardized.
3. Results
3.1. Principal Component Analysis (PCA) and Variable Selection
3.2. Model Performance
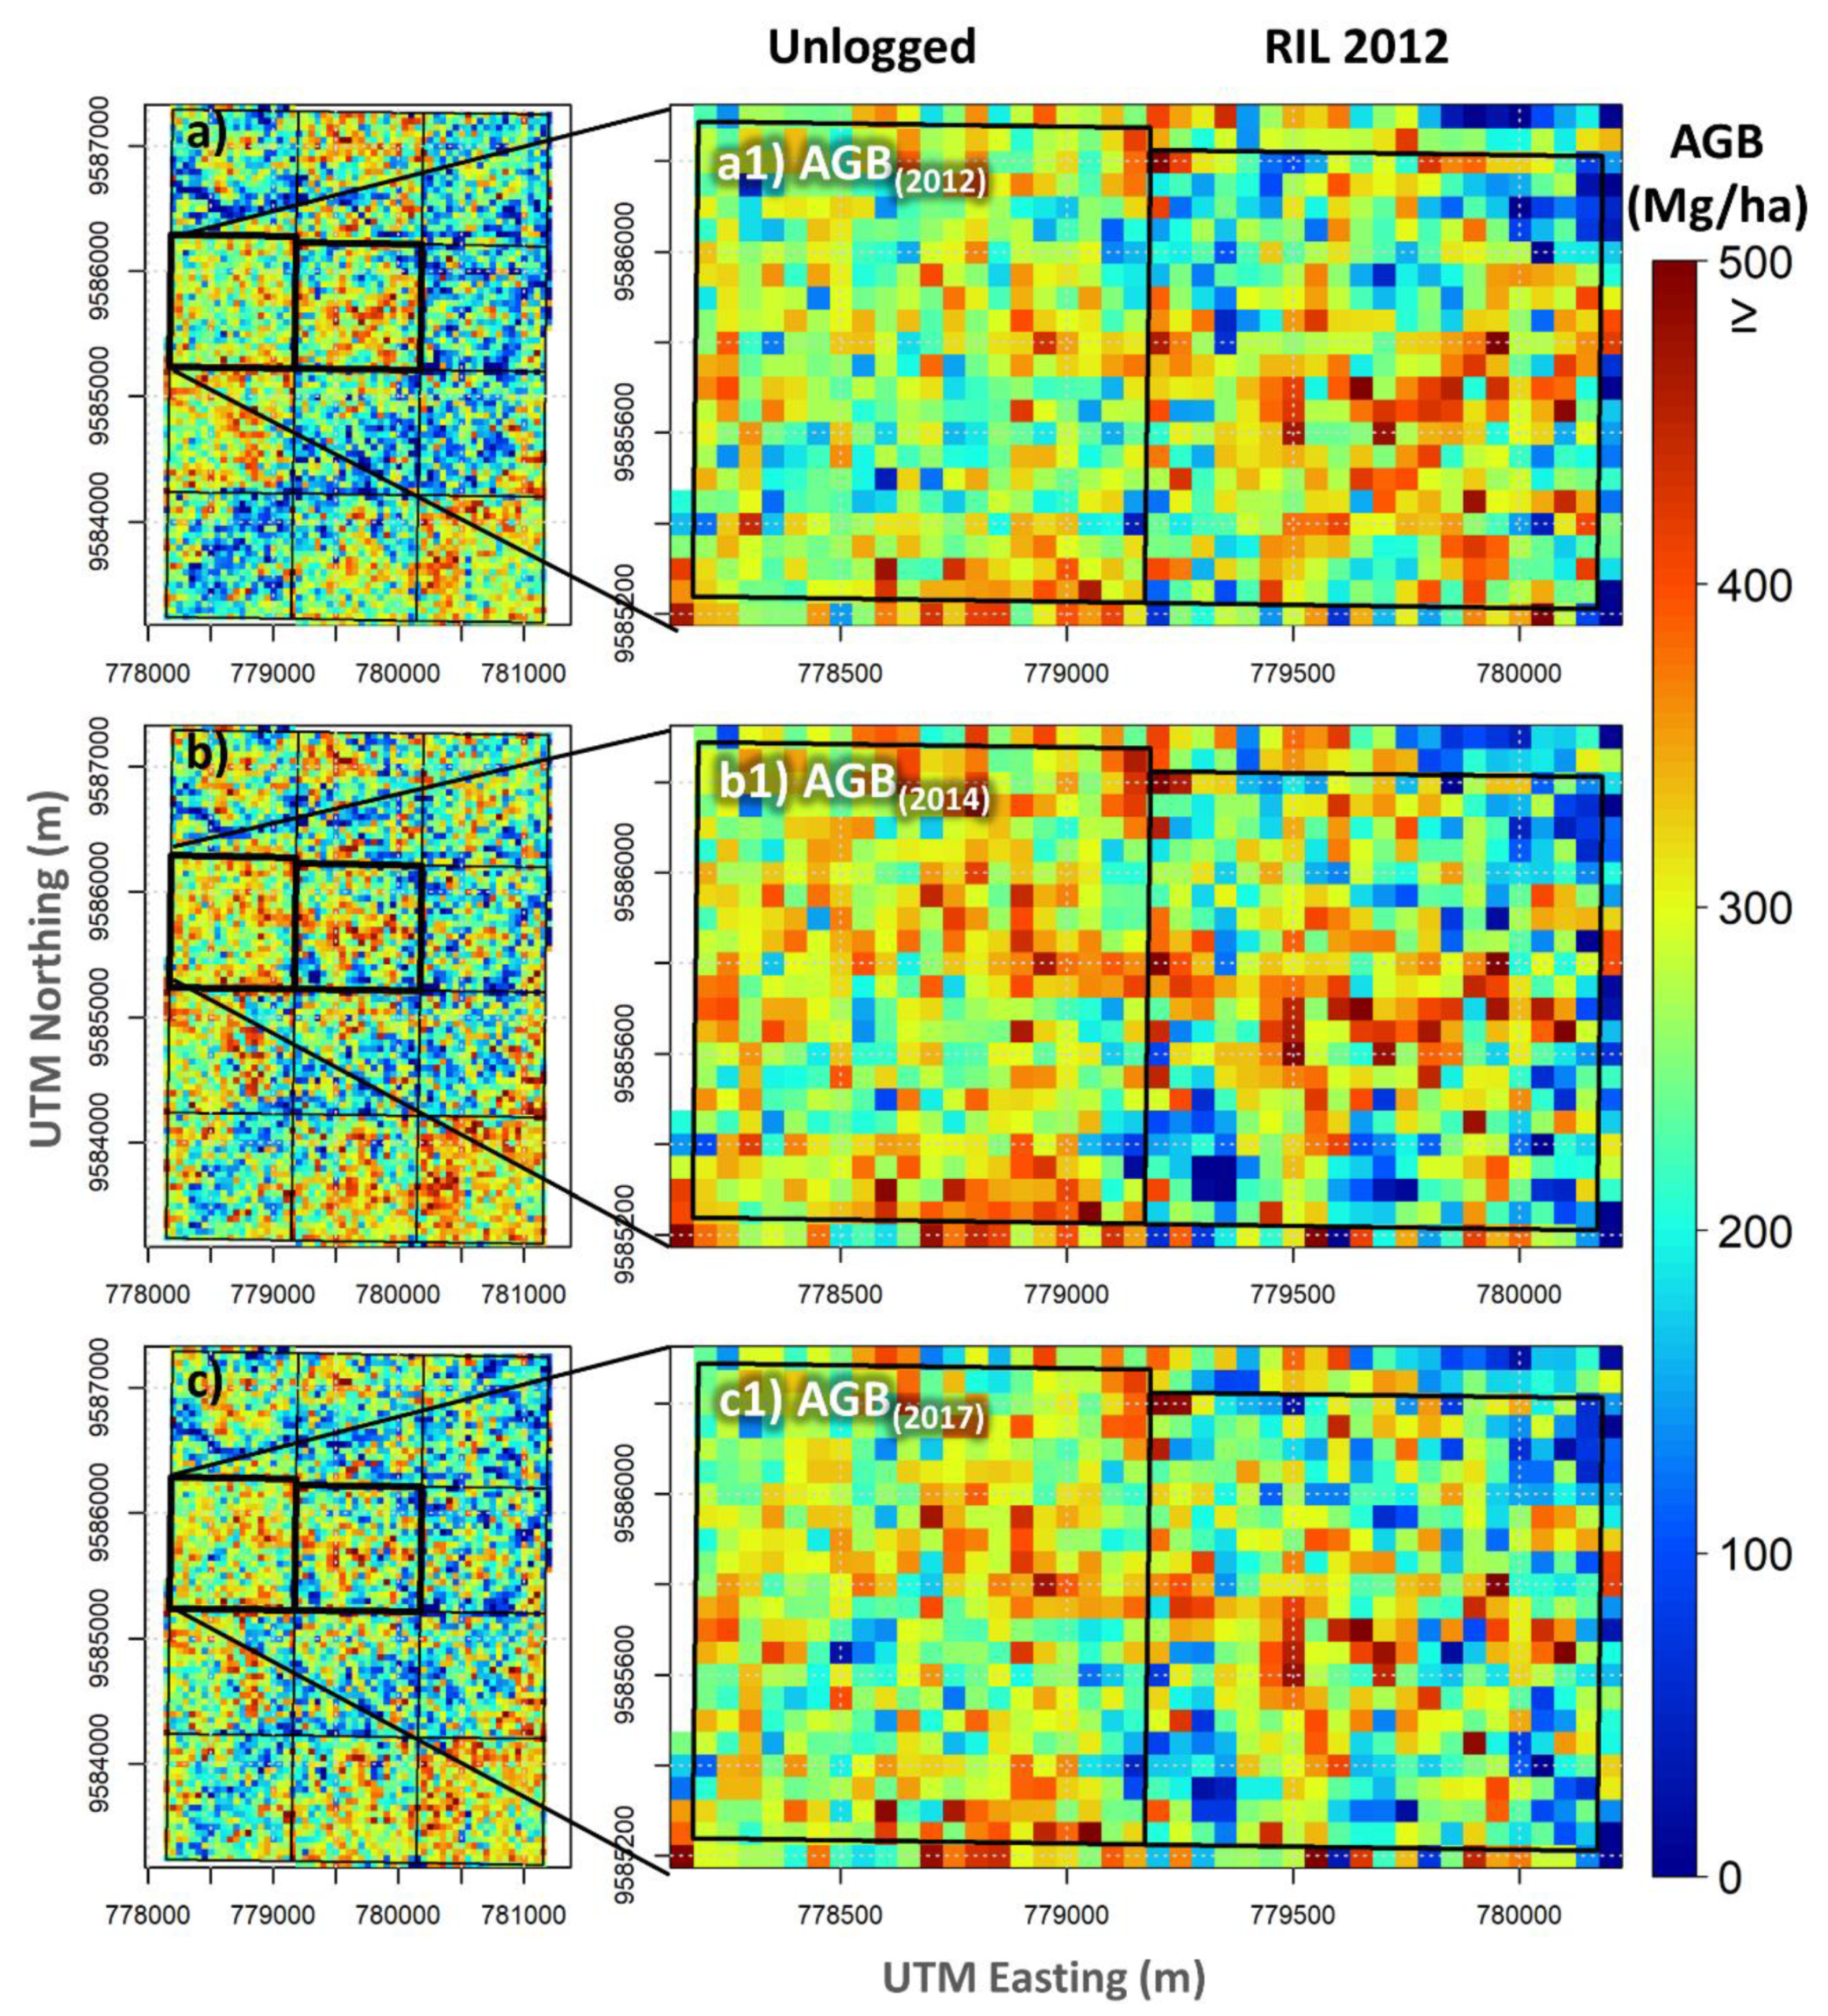
3.3. Aboveground Biomass Change Mapping and Uncertainty
4. Discussion
5. Conclusions
Author Contributions
Funding
Acknowledgments
Conflicts of Interest
References
- Gibbs, H.K.; Brown, S.; Niles, J.O.; Foley, J.A. Monitoring and estimating tropical forest carbon stocks: Making REDD a reality. Environ. Res. Lett. 2007, 2, 045023. [Google Scholar] [CrossRef]
- Thomson, A.M.; Calvin, K.V.; Chini, L.P.; Hurtt, G.; Edmonds, J.A.; Bond-Lamberty, B.; Janetos, A.C. Climate mitigation and the future of tropical landscapes. Proc. Natl. Acad. Sci. USA 2010, 107, 19633–19638. [Google Scholar] [CrossRef] [PubMed]
- Phillips, O.L.; Lewis, S.L.; Baker, T.R.; Chao, K.J.; Higuchi, N. The changing Amazon forest. Philos. Trans. R. Soc. B 2008, 363, 1819–1827. [Google Scholar] [CrossRef] [PubMed]
- Malhi, Y.; Roberts, J.T.; Betts, R.A.; Killeen, T.J.; Li, W.; Nobre, C.A. Climate change, deforestation, and the fate of the Amazon. Science 2008, 319, 169–172. [Google Scholar] [CrossRef]
- Silva, C.A.; Valbuena, R.; Pinagé, E.R.; Mohan, M.; de Almeida, D.R.; North Broadbent, E.; Klauberg, C. ForestGapR: An r Package for forest gap analysis from canopy height models. Methods Ecol. Evol. 2019, 10, 1347–1356. [Google Scholar] [CrossRef]
- Chazdon, R.L. Tropical forest recovery: Legacies of human impact and natural disturbances. Perspect Plant. Ecol. 2003, 6, 51–71. [Google Scholar] [CrossRef]
- Miles, L.; Kapos, V. Reducing greenhouse gas emissions from deforestation and forest degradation: Global land-use implications. Science 2008, 320, 1454–1455. [Google Scholar] [CrossRef]
- Marvin, D.C.; Asner, G.P.; Knapp, D.E.; Anderson, C.B.; Martin, R.E.; Sinca, F.; Tupayachi, R. Amazonian landscapes and the bias in field studies of forest structure and biomass. Proc. Natl. Acad. Sci. USA 2014, 111, 5224–5232. [Google Scholar] [CrossRef]
- Molina, P.; Asner, G.; Farjas Abadía, M.; Ojeda Manrique, J.; Sánchez Diez, L.; Valencia, R. Spatially-explicit testing of a general aboveground carbon density estimation model in a western Amazonian forest using airborne LiDAR. Remote Sens. 2016, 8, 9. [Google Scholar] [CrossRef]
- Laurin, G.V.; Chan, J.C.W.; Chen, Q.; Lindsell, J.A.; Coomes, D.A.; Guerriero, L.; Valentini, R. Biodiversity mapping in a tropical West African forest with airborne hyperspectral data. PLoS ONE 2014, 9, 97910. [Google Scholar] [CrossRef]
- Asner, G.P.; Knapp, D.E.; Broadbent, E.N.; Oliveira, P.J.; Keller, M.; Silva, J.N. Selective logging in the Brazilian Amazon. Science 2005, 310, 480–482. [Google Scholar] [CrossRef] [PubMed]
- Pearson, T.R.; Brown, S.; Casarim, F.M. Carbon emissions from tropical forest degradation caused by logging. Environ. Res. Lett. 2014, 9, 034017. [Google Scholar] [CrossRef]
- Mazzei, L.; Sist, P.; Ruschel, A.; Putz, F.E.; Marco, P.; Pena, W.; Ferreira, J.E.R. Above-ground biomass dynamics after reduced-impact logging in the Eastern Amazon. For. Ecol. Manag. 2010, 259, 367–373. [Google Scholar] [CrossRef]
- Rutishauser, E.; Hérault, B.; Baraloto, C.; Blanc, L.; Descroix, L.; Sotta, E.D.; De Oliveira, L.C. Rapid tree carbon stock recovery in managed Amazonian forests. Curr. Biol. 2015, 25, 787–788. [Google Scholar] [CrossRef]
- Silva, C.; Hudak, A.; Vierling, L.; Klauberg, C.; Garcia, M.; Ferraz, A.; Saatchi, S. Impacts of airborne lidar pulse density on estimating biomass stocks and changes in a selectively logged tropical forest. Remote Sens. 2017, 9, 1068. [Google Scholar] [CrossRef]
- Englhart, S.; Jubanski, J.; Siegert, F. Quantifying dynamics in tropical peat swamp forest biomass with multi-temporal LiDAR datasets. Remote Sens. 2013, 5, 2368–2388. [Google Scholar] [CrossRef]
- Zolkos, S.G.; Goetz, S.J.; Dubayah, R. A meta-analysis of terrestrial aboveground biomass estimation using lidar remote sensing. Remote Sens. Environ. 2013, 128, 289–298. [Google Scholar] [CrossRef]
- Asner, G.P.; Hughes, R.F.; Varga, T.A.; Knapp, D.E.; Kennedy-Bowdoin, T. Environmental and biotic controls over aboveground biomass throughout a tropical rain forest. Ecosystems 2009, 12, 261–278. [Google Scholar] [CrossRef]
- Clark, M.L.; Roberts, D.A.; Ewel, J.J.; Clark, D.B. Estimation of tropical rain forest aboveground biomass with small-footprint lidar and hyperspectral sensors. Remote Sens. Environ. 2011, 115, 2931–2942. [Google Scholar] [CrossRef]
- Houghton, R.A. Aboveground forest biomass and the global carbon balance. Glob. Chang. Biol. 2005, 11, 945–958. [Google Scholar] [CrossRef]
- Lei, Y.; Treuhaft, R.; Keller, M.; dos-Santos, M.; Gonçalves, F.; Neumann, M. Quantification of selective logging in tropical forest with spaceborne SAR interferometry. Remote Sens. Environ. 2018, 211, 167–183. [Google Scholar] [CrossRef]
- Hethcoat, M.G.; Edwards, D.P.; Carreiras, J.M.; Bryant, R.G.; Franca, F.M.; Quegan, S. A machine learning approach to map tropical selective logging. Remote Sens. Environ. 2019, 221, 569–582. [Google Scholar] [CrossRef]
- Koch, B. Status and future of laser scanning, synthetic aperture radar and hyperspectral remote sensing data for forest biomass assessment. ISPRS J. Photogramm. Remote Sens. 2010, 65, 581–590. [Google Scholar] [CrossRef]
- Gleason, C.J.; Im, J. Forest biomass estimation from airborne LiDAR data using machine learning approaches. Remote Sens. Environ. 2012, 125, 80–91. [Google Scholar] [CrossRef]
- Andersen, H.E.; Reutebuch, S.E.; McGaughey, R.J.; d’Oliveira, M.V.; Keller, M. Monitoring selective logging in western Amazonia with repeat lidar flights. Remote Sens. Environ. 2014, 151, 157–165. [Google Scholar] [CrossRef]
- Shao, G.; Shao, G.; Gallion, J.; Saunders, M.R.; Frankenberger, J.R.; Fei, S. Improving Lidar-based aboveground biomass estimation of temperate hardwood forests with varying site productivity. Remote Sens. Environ. 2018, 204, 872–882. [Google Scholar] [CrossRef]
- Domingo, D.; Lamelas, M.T.; Montealegre, A.L.; García-Martín, A.; de la Riva, J. Estimation of Total Biomass in Aleppo Pine Forest Stands Applying Parametric and Nonparametric Methods to Low-Density Airborne Laser Scanning Data. Forests 2018, 9, 158–175. [Google Scholar] [CrossRef]
- Domingo, D.; Lamelas, M.T.; Montealegre, A.L.; de la Riva, J. Comparison of regression models to estimate biomass losses and CO emissions using low density airborne laser scanning data in a burnt Aleppo pine forest. Eur. J. Remote Sens. 2017, 50, 384–396. [Google Scholar] [CrossRef]
- Latifi, H.; Nothdurft, A.; Koch, B. Non-parametric prediction and mapping of standing timber volume and biomass in a temperate forest: Application of multiple optical/LiDAR-derived predictors. Forestry 2010, 83, 395–407. [Google Scholar] [CrossRef]
- Gagliasso, D.; Hummel, S.; Temesgen, H. A comparison of selected parametric and non-parametric imputation methods for estimating forest biomass and basal area. Open J. For. 2014, 4, 42–48. [Google Scholar] [CrossRef]
- Costa, M.H.; Foley, J.A. A comparison of precipitation datasets for the Amazon basin. Geophys. Res. Lett. 1998, 25, 155–158. [Google Scholar] [CrossRef]
- Holmes, T.P.; Blate, G.M.; Zweede, J.C.; Pereira, R., Jr.; Barreto, P.; Boltz, F.; Bauch, R. Financial and ecological indicators of reduced impact logging performance in the eastern Amazon. For. Ecol. Manag. 2002, 163, 93–110. [Google Scholar] [CrossRef]
- Radambrasil, P. Projeto Radambrasil: 1973–1983, Levantamento de Recursos Naturais. Energia; Ministério das Minas e Energia, Departamento Nacional de Produção Mineral (DNPM): Rio de Janeiro, Brazil, 1983; Volumes 1–23. [Google Scholar]
- Pereira, R., Jr.; Zweede, J.; Asner, G.P.; Keller, M. Forest canopy damage and recovery in reduced-impact and conventional selective logging in eastern Para, Brazil. For. Ecol. Manag. 2002, 168, 77–89. [Google Scholar] [CrossRef]
- Rangel Pinagé, E.; Keller, M.; Duffy, P.; Longo, M.; Dos-Santos, M.N.; Morton, D.C. Long-term impacts of selective logging on Amazon Forest dynamics from multi-temporal airborne LiDAR. Remote Sens. 2019, 11, 709. [Google Scholar] [CrossRef]
- Chave, J.; Réjou-Méchain, M.; Búrquez, A.; Chidumayo, E.; Colgan, M.S.; Delitti, W.B.; Henry, M. Improved allometric models to estimate the aboveground biomass of tropical trees. Glob. Chang. Biol. 2014, 20, 3177–3190. [Google Scholar] [CrossRef]
- Mcgaughey, R.J.M.; FUSION/LDV: Software for LiDAR Data Analysis and Visualization (Version 3.80). Seattle, WA. Available online: http://forsys.cfr.washington.edu/fusion/fusionlatest.html (accessed on 15 October 2019).
- Isenburg, M. LAStools—Efficient Tools for Lidar Processing. Available online: http://www.cs.unc.edu/~isenburg/lastools/ (accessed on 8 March 2018).
- Wold, S.; Esbensen, K.; Geladi, P. Principal component analysis. Chemom. Intell. Lab. 1987, 2, 37–52. [Google Scholar] [CrossRef]
- Silva, C.A.; Klauberg, C.; Hudak, A.T.; Vierling, L.A.; Liesenberg, V.; Carvalho, S.P.E.; Rodriguez, L.C. A principal component approach for predicting the stem volume in Eucalyptus plantations in Brazil using airborne LiDAR data. For. Int. J. For. Res. 2016, 89, 422–433. [Google Scholar] [CrossRef]
- R Core Team. R: A Language and Environment for Statistical Computing; Version 3.6.1; R Foundation for Statistical Computing: Vienna, Austria, 2019. [Google Scholar]
- Fernandez, D.; Gonzalez, C.; Mozos, D.; Lopez, S. FPGA implementation of the principal component analysis algorithm for dimensionality reduction of hyperspectral images. J. Real Time Image Process. 2019, 16, 1395–1406. [Google Scholar] [CrossRef]
- Liaw, A.; Wiener, M. Classification and regression by randomForest. R News 2002, 2, 18–22. [Google Scholar]
- Altman, N.S. An introduction to kernel and nearest-neighbor nonparametric regression. Am. Stat. 1992, 46, 175–185. [Google Scholar] [CrossRef]
- Crookston, N.L.; Finley, A.O. YaImpute: An R package for kNN imputation. J. Stat. Softw. 2008, 23, 16. [Google Scholar] [CrossRef]
- Hudak, A.T.; Crookston, N.L.; Evans, J.S.; Hall, D.E.; Falkowski, M.J. Nearest neighbor imputation of species-level, plot-scale forest structure attributes from LiDAR data. Remote Sens. Environ. 2008, 112, 2232–2245. [Google Scholar] [CrossRef]
- Meyer, D.; Hornik, K.; Weingessel, A.; Chang, C.; Lin, C. Package e1071. Available online: https://cran.r-project.org/web/packages/e1071/e1071.pdf (accessed on 24 May 2019).
- Kohonen, T. An introduction to neural computing. Neural Netw. 1988, 1, 3–16. [Google Scholar] [CrossRef]
- Venable, W.N.; Ripley, B.D. Modern Applied Statistics with S; Springer: New York, NY, USA, 2002. [Google Scholar]
- Manly, B.F.; Alberto, J.A.N. Multivariate Statistical Methods: A Primer, 3rd ed.; Chapman and Hall/CRC: London, UK, 2005. [Google Scholar]
- Marcoulides, G.A.; Hershberger, S.L. Multivariate Statistical Methods: A First Course; Psychology Press: Mahwah, NJ, USA, 1997. [Google Scholar]
- Shapiro, S.S.; Wilk, M.B. An analysis of variance test for normality (complete samples). Biometrika 1965, 52, 591–611. [Google Scholar] [CrossRef]
- Breusch, T.S.; Pagan, A.R. A simple test for heteroscedasticity and random coefficient variation. Econom. J. Econom. Soc. 1979, 1287–1294. [Google Scholar] [CrossRef]
- McRoberts, R.E.; Bollandsås, O.M.; Næsset, E. Modeling and Estimating Change. In Forestry Applications of Airborne Laser Scanning, Managing Forest Ecosystems; Maltamo, M., Næsset, E., Vauhkonen, J., Eds.; Springer: Berlin/Heidelberg, Germany, 2014; Volume 27. [Google Scholar]
- McRoberts, R.E. A model-based approach to estimating forest area. Remote Sens. Environ. 2006, 103, 56–66. [Google Scholar] [CrossRef]
- Weisbin, C.R.; Lincoln, W.; Saatchi, S. A systems engineering approach to estimating uncertainty in above-ground biomass (AGB) derived from remote-sensing data. Syst. Eng. 2014, 17, 361–373. [Google Scholar] [CrossRef]
- Dalla Corte, A.P.; Rex, F.E.; Almeida, D.R.A.D.; Sanquetta, C.R.; Silva, C.A.; Moura, M.M.; Moraes, A.D. Measuring Individual Tree Diameter and Height Using GatorEye High-Density UAV-Lidar in an Integrated Crop-Livestock-Forest System. Remote Sens. 2020, 12, 863. [Google Scholar] [CrossRef]
- Mohan, M.; de Mendonça, B.A.F.; Silva, C.A.; Klauberg, C.; de Saboya Ribeiro, A.S.; de Araújo, E.J.G.; Cardil, A. Optimizing individual tree detection accuracy and measuring forest uniformity in coconut (Cocos nucifera L.) plantations using airborne laser scanning. Ecol Model. 2019, 409, 108736. [Google Scholar] [CrossRef]
- Fassnacht, F.E.; Hartig, F.; Latifi, H.; Berger, C.; Hernández, J.; Corvalán, P.; Koch, B. Importance of sample size, data type and prediction method for remote sensing-based estimations of aboveground forest biomass. Remote Sens. Environ. 2014, 154, 102–114. [Google Scholar] [CrossRef]
- Rex, F.E.; Corte, A.P.D.; Machado, S.D.A.; Silva, C.A.; Sanquetta, C.R. Estimating Above-Ground Biomass of Araucaria angustifolia (Bertol.) Kuntze Using LiDAR Data. Floresta E Ambiente 2019, 26. [Google Scholar] [CrossRef]
- Clark, D.B.; Kellner, J.R. Tropical forest biomass estimation and the fallacy of misplaced concreteness. J. Veg. Sci. 2012, 23, 1191–1196. [Google Scholar] [CrossRef]
- Nie, S.; Wang, C.; Zeng, H.; Xi, X.; Li, G. Above-ground biomass estimation using airborne discrete-return and full-waveform LiDAR data in a coniferous forest. Ecol. Indic. 2017, 78, 221–228. [Google Scholar] [CrossRef]
- de Almeida, C.T.; Galvão, L.S.; Ometto, J.P.H.B.; Jacon, A.D.; de Souza Pereira, F.R.; Sato, L.Y.; Longo, M. Combining LiDAR and hyperspectral data for aboveground biomass modeling in the Brazilian Amazon using different regression algorithms. Remote Sens. Environ. 2019, 232, 111323. [Google Scholar] [CrossRef]
- Cao, L.; Coops, N.C.; Innes, J.L.; Sheppard, S.R.; Fu, L.; Ruan, H.; She, G. Estimation of forest biomass dynamics in subtropical forests using multi-temporal airborne LiDAR data. Remote Sens. Environ. 2016, 178, 158–171. [Google Scholar] [CrossRef]
- Li, W.; Niu, Z.; Gao, S.; Huang, N.; Chen, H. Correlating the horizontal and vertical distribution of lidar point clouds with components of biomass in a picea crassifolia forest. Forests 2014, 5, 1910–1930. [Google Scholar] [CrossRef]
- Van Aardt, J.A.; Wynne, R.H.; Scrivani, J.A. Lidar-based mapping of forest volume and biomass by taxonomic group using structurally homogenous segments. Photogramm. Eng. Remote Sens. 2008, 74, 1033–1044. [Google Scholar] [CrossRef]
- Frazer, G.W.; Magnussen, S.; Wulder, M.A.; Niemann, K.O. Simulated impact of sample plot size and co-registration error on the accuracy and uncertainty of LiDAR-derived estimates of forest stand biomass. Remote Sens. Environ. 2011, 115, 636–649. [Google Scholar] [CrossRef]
- Listopad, C.M.C.S.; Masters, R.E.; Drake, J.; Weishampel, J.; Branquinho, C. Structural diversity indices based on airborne LiDAR as ecological indicators for managing highly dynamic landscapes. Ecol. Indic. 2015, 57, 268–279. [Google Scholar] [CrossRef]
- Næsset, E. Practical large-scale forest stand inventory using a small-footprint airborne scanning laser. Scand. J. For. Res. 2004, 19, 164–179. [Google Scholar] [CrossRef]
- Penner, M.; Pitt, D.G.; Woods, M.E. Parametric vs. nonparametric LiDAR models for operational forest inventory in boreal Ontario. Can. J. Remote Sens. 2013, 39, 426–443. [Google Scholar] [CrossRef]
- Haara, A.; Kangas, A. Comparing k nearest neighbours methods and linear regression–is there reason to select one over the other? Math. Comput. For. Nat. Resour. Sci. 2012, 4, 50–65. [Google Scholar]
- Fehrmann, L.; Lehtonen, A.; Kleinn, C.; Tomppo, E. Comparison of linear and mixed-effect regression models and ak-nearest neighbour approach for estimation of single-tree biomass. Can. J. Remote Sens. 2008, 38, 1–9. [Google Scholar] [CrossRef]
- Mauya, E.W.; Ene, L.T.; Bollandsås, O.M.; Gobakken, T.; Næsset, E.; Malimbwi, R.E.; Zahabu, E. Modelling aboveground forest biomass using airborne laser scanner data in the miombo woodlands of Tanzania. Carbon Balance Manag. 2015, 10, 28. [Google Scholar] [CrossRef] [PubMed]
- Valbuena, R.; Hernando, A.; Manzanera, J.A.; Görgens, E.B.; Almeida, D.R.; Silva, C.A.; García-Abril, A. Evaluating observed versus predicted forest biomass: R-squared, index of agreement or maximal information coefficient? Eur. J. Remote Sens. 2019, 52, 345–358. [Google Scholar] [CrossRef]
- Baffetta, F.; Fattorini, L.; Franceschi, S.; Corona, P. Design-based approach to k-nearest neighbours technique for coupling field and remotely sensed data in forest surveys. Remote Sens. Environ. 2009, 113, 463–475. [Google Scholar] [CrossRef]
- Asner, G.P.; Mascaro, J.; Muller-Landau, H.C.; Vieilledent, G.; Vaudry, R.; Rasamoelina, M.; Van Breugel, M. A universal airborne LiDAR approach for tropical forest carbon mapping. Oecologia 2012, 168, 1147–1160. [Google Scholar] [CrossRef]
- Görgens, E.B.; Montaghi, A.; Rodriguez, L.C.E. A performance comparison of machine learning methods to estimate the fast-growing forest plantation yield based on laser scanning metrics. Comput Electron. Agric. 2015, 116, 221–227. [Google Scholar] [CrossRef]
- d’Oliveira, M.V.; Reutebuch, S.E.; McGaughey, R.J.; Andersen, H.E. Estimating forest biomass and identifying low-intensity logging areas using airborne scanning lidar in Antimary State Forest, Acre State, Western Brazilian Amazon. Remote Sens. Environ. 2012, 124, 479–491. [Google Scholar] [CrossRef]
- Silva, C.A.; Saatchi, S.; Garcia, M.; Labriere, N.; Klauberg, C.; Ferraz, A.; Meyer, V.; Jeffery, K.J.; Abernethy, K.; White, L.; et al. Comparison of small- and large-footprint lidar characterization of tropical forest aboveground structure and biomass: A case study from Central Gabon. IEEE J. Sel. Top. Appl. Earth Obs. Remote Sens. 2018. [Google Scholar] [CrossRef]
- Csillik, O.; Kumar, P.; Mascaro, J.; O’Shea, T.; Asner, G.P. Monitoring tropical forest carbon stocks and emissions using Planet satellite data. Sci. Rep. 2019, 9, 1–12. [Google Scholar] [CrossRef] [PubMed]


| Attributes | Min | Max | Mean | sd |
|---|---|---|---|---|
| dbh (cm) | 10 | 186.00 | 32.70 | 20.16 |
| ρ (g/cm3) | 0.26 | 0.99 | 0.73 | 0.14 |
| AGB (kg·tree−1) | 22.46 | 73.70 | 18.04 | 36.84 |
| AGB ( Mg·ha−1) | 65.34 | 525.79 | 238.11 | 86.48 |
| Specifications | 2012 | 2014 | 2017 |
|---|---|---|---|
| LiDAR system | ALTM 3100 | ALTM 300 | ALTM 3100 |
| Acquisition date | 27–29 July | 26–27 December | 12 December |
| Datum | Sirgas 2000 | Sirgas 2000 | Sirgas 2000 |
| Pulse density (pulses/m2) | 13.89 | 37.5 | 22.61 |
| Flying height (m) | 850 m | 850 m | 850 m |
| Field of view (°) | 11 | 12 | 15 |
| Scanning Frequency (Hz) | 59.8 | 83.0 | 40 |
| Overlap Percentage (%) | 65 | 65 | 70 |
| Variable | Description |
|---|---|
| HMAX | Maximum height |
| HMEAN | Mean height |
| HMODE | Modal height |
| HSD | Height standard deviation |
| HVAR | Height variance |
| HCV | Height coefficient of variation |
| HIQ | Height interquartile distance |
| HSKE | Height skewness |
| HKUR | Height kurtosis |
| H20TH | Height 20th percentile |
| H25TH | Height 25th percentile |
| H30TH | Height 30th percentile |
| H40TH | Height 40th percentile |
| H50TH | Height 50th percentile |
| H60TH | Height 60th percentile |
| H70TH | Height 70th percentile |
| H75TH | Height 75th percentile |
| H80TH | Height 80th percentile |
| H90TH | Height 90th percentile |
| H95TH | Height 95th percentile |
| H99TH | Height 99th percentile |
| CR | Canopy relief ratio ((HMEAN − HMIN)/(HMAX − HMIN)) |
| COV | Canopy cover (percentage of first return above 2.00 m) |
| PCs | Ev | Eigenvectors (Eg) | |||||
|---|---|---|---|---|---|---|---|
| HMEAN | HCV | HKUR | COV | HMODE | HSKEW | ||
| PC1 | 3.27 | −0.30 | 0.11 | −0.05 | 0.02 | −0.17 | 0.13 |
| PC2 | 2.50 | −0.04 | 0.36 | −0.17 | −0.10 | −0.17 | 0.27 |
| PC3 | 1.67 | 0.05 | −0.09 | 0.45 | 0.33 | 0.02 | 0.31 |
| PC4 | 0.89 | 0.03 | −0.05 | −0.38 | 0.85 | 0.14 | 0.09 |
| PC5 | 0.77 | 0.09 | −0.10 | 0.05 | 0.05 | −0.88 | 0.07 |
| PC6 | 0.60 | −0.05 | 0.12 | 0.29 | 0.35 | −0.30 | −0.38 |
| Method | R2 | RMSE | MD | LiDAR-Derived AGB (Mg/ha) Stock in 2014 | ||
|---|---|---|---|---|---|---|
| Mg/ha | % | Mg/ha | % | |||
| OLS | 0.70 | 46.94 | 19.71 | −0.57 | −0.24 | 237.54 ± 74.56 |
| RF | 0.59 | 55.44 | 23.29 | −0.16 | −0.07 | 237.94 ± 57.77 |
| k–NN-RAW | 0.35 | 75.90 | 31.87 | −1.54 | −0.65 | 236.56 ± 81.97 |
| k-NN-EU | 0.48 | 66.90 | 28.09 | −4.09 | −1.72 | 234.01 ± 84.29 |
| k–NN-MA | 0.39 | 73.01 | 30.66 | −4.66 | −1.96 | 233.44 ± 81.64 |
| k-NN-MSN | 0.53 | 64.61 | 27.09 | −4.39 | −1.94 | 233.71 ± 89.04 |
| k-NN-ICA | 0.38 | 73.01 | 30.66 | −4.66 | −1.96 | 233.44 ± 81.64 |
| k-NN-RF | 0.40 | 74.71 | 31.21 | −3.43 | −1.44 | 234.67 ± 88.50 |
| SVM | 0.57 | 56.24 | 23.62 | 1.59 | 0.67 | 239.69 ± 60.93 |
| ANN | 0.61 | 54.48 | 22.89 | 0.09 | 0.03 | 238.20 ± 76.72 |
| Work Unit (UT) | |||||||||||||||||||
|---|---|---|---|---|---|---|---|---|---|---|---|---|---|---|---|---|---|---|---|
| Mean | sd | std Error | Mean | sd | std Error | Mean | sd | std Error | Mean | sd | std Error | Mean | sd | std Error | Mean | sd | std Error | ||
| RIL | 2006 | 112.85 | 683.75 | 4.94 | 220.69 | 104.75 | 5.04 | 193.11 | 252.29 | 5.07 | 107.84 | 665.07 | 2.38 | −27.58 | 225.25 | 1.88 | 80.26 | 703.70 | 2.90 |
| 2007 | 224.11 | 95.58 | 4.28 | 263.18 | 93.90 | 4.37 | 232.94 | 171.30 | 4.38 | 39.07 | 38.03 | 2.70 | −30.24 | 146.12 | 2.43 | 8.83 | 148.94 | 2.97 | |
| 2008 | 198.68 | 109.30 | 4.94 | 234.89 | 108.52 | 5.16 | 230.90 | 103.03 | 4.90 | 36.21 | 39.63 | 1.92 | −3.99 | 40.88 | 2.01 | 32.22 | 55.41 | 2.68 | |
| 2010 | 202.97 | 101.22 | 4.61 | 244.05 | 93.87 | 4.53 | 218.99 | 314.21 | 4.40 | 41.08 | 36.17 | 1.71 | −25.07 | 299.06 | 1.92 | 16.02 | 300.80 | 2.59 | |
| 2012 | 264.54 | 239.32 | 4.60 | 252.27 | 111.26 | 5.24 | 242.47 | 100.24 | 4.75 | −12.27 | 229.46 | 3.73 | −9.80 | 55.19 | 2.60 | −22.07 | 228.75 | 3.85 | |
| 2013 | 289.88 | 82.47 | 3.92 | 275.22 | 95.75 | 4.75 | 259.74 | 92.83 | 4.58 | −14.66 | 71.37 | 3.53 | −15.47 | 38.58 | 1.90 | −30.14 | 69.93 | 3.48 | |
| Unlogged | 284.58 | 71.48 | 3.44 | 312.09 | 74.58 | 3.59 | 294.29 | 74.25 | 3.60 | 27.51 | 32.16 | 2.68 | −17.80 | 38.08 | 1.86 | 9.71 | 46.76 | 2.29 | |
© 2020 by the authors. Licensee MDPI, Basel, Switzerland. This article is an open access article distributed under the terms and conditions of the Creative Commons Attribution (CC BY) license (http://creativecommons.org/licenses/by/4.0/).
Share and Cite
Rex, F.E.; Silva, C.A.; Dalla Corte, A.P.; Klauberg, C.; Mohan, M.; Cardil, A.; Silva, V.S.d.; Almeida, D.R.A.d.; Garcia, M.; Broadbent, E.N.; et al. Comparison of Statistical Modelling Approaches for Estimating Tropical Forest Aboveground Biomass Stock and Reporting Their Changes in Low-Intensity Logging Areas Using Multi-Temporal LiDAR Data. Remote Sens. 2020, 12, 1498. https://doi.org/10.3390/rs12091498
Rex FE, Silva CA, Dalla Corte AP, Klauberg C, Mohan M, Cardil A, Silva VSd, Almeida DRAd, Garcia M, Broadbent EN, et al. Comparison of Statistical Modelling Approaches for Estimating Tropical Forest Aboveground Biomass Stock and Reporting Their Changes in Low-Intensity Logging Areas Using Multi-Temporal LiDAR Data. Remote Sensing. 2020; 12(9):1498. https://doi.org/10.3390/rs12091498
Chicago/Turabian StyleRex, Franciel Eduardo, Carlos Alberto Silva, Ana Paula Dalla Corte, Carine Klauberg, Midhun Mohan, Adrián Cardil, Vanessa Sousa da Silva, Danilo Roberti Alves de Almeida, Mariano Garcia, Eben North Broadbent, and et al. 2020. "Comparison of Statistical Modelling Approaches for Estimating Tropical Forest Aboveground Biomass Stock and Reporting Their Changes in Low-Intensity Logging Areas Using Multi-Temporal LiDAR Data" Remote Sensing 12, no. 9: 1498. https://doi.org/10.3390/rs12091498
APA StyleRex, F. E., Silva, C. A., Dalla Corte, A. P., Klauberg, C., Mohan, M., Cardil, A., Silva, V. S. d., Almeida, D. R. A. d., Garcia, M., Broadbent, E. N., Valbuena, R., Stoddart, J., Merrick, T., & Hudak, A. T. (2020). Comparison of Statistical Modelling Approaches for Estimating Tropical Forest Aboveground Biomass Stock and Reporting Their Changes in Low-Intensity Logging Areas Using Multi-Temporal LiDAR Data. Remote Sensing, 12(9), 1498. https://doi.org/10.3390/rs12091498