Article

Assessing Meteorological and Agricultural Drought in Chitral Kabul River Basin Using Multiple Drought Indices

1
Institute of Geo-Information & Earth Observation, PMAS Arid Agriculture University Rawalpindi, Rawalpindi 46300, Pakistan
2
Interdisciplinary Research Center, COMSATS University Islamabad, Wah Campus, Rawalpindi 47040, Pakistan
3
Department of Earth Sciences, Indiana University-Purdue University Indianapolis (IUPUI), Indianapolis, IN 46202, USA
4
National Drought Monitoring Centre, Pakistan Meteorological Department, Islamabad 44000, Pakistan
*
Author to whom correspondence should be addressed.
Remote Sens. 2020, 12(9), 1417; https://doi.org/10.3390/rs12091417
Submission received: 18 February 2020 / Revised: 25 April 2020 / Accepted: 26 April 2020 / Published: 30 April 2020

Abstract

:
Drought is a complex and poorly understood natural hazard in complex terrain and plains lie in foothills of Hindukush-Himalaya-Karakoram region of Central and South Asia. Few research studied climate change scenarios in the transboundary Chitral Kabul River Basin (CKRB) despite its vulnerability to global warming and importance as a region inhabited with more than 10 million people where no treaty on use of water exists between Afghanistan and Pakistan. This study examines the meteorological and agricultural drought between 2000 and 2018 and their future trends from 2020 to 2030 in the CKRB. To study meteorological and agricultural drought comprehensively, various single drought indices such as Precipitation Condition Index (PCI), Temperature Condition Index (TCI), Soil Moisture Condition Index (SMCI) and Vegetation Condition Index (VCI), and combined drought indices such as Scaled Drought Condition Index (SDCI) and Microwave Integrated Drought Index (MIDI) were utilized. As non-microwave data were used in MIDI, this index was given a new name as Non-Microwave Integrated Drought Index (NMIDI). Our research has found that 2000 was the driest year in the monsoon season followed by 2004 that experienced both meteorological and agricultural drought between 2000 and 2018. Results also indicate that though there exists spatial variation in the agricultural and meteorological drought, but temporally there has been a decreasing trend observed from 2000 to 2018 for both types of droughts. This trend is projected to continue in the future drought projections between 2020 and 2030. The overall study results indicate that drought can be properly assessed by integration of different data sources and therefore management plans can be developed to address the risk and signing new treaties.

1. Introduction

Extreme events and their severe damages have become more common worldwide in recent years [1]. A main requirement for global change studies is assessing and monitoring the state of the Earth’s surface [2]. Drought is considered as one of the most costly and harmful but less understood natural hazards especially from lower reaches of Central Asia to South Asia [3]. The Emergency Events Database information shows that it ranks first place among all the natural hazards due to the losses caused by droughts worldwide [4]. In addition, due to the climate change, the frequency and severity are projected to increase in the future [5]. Although the impacts of droughts have been well documented, a universal definition of drought is not clear and it is hard to describe drought because it is both spatially variable and context dependent [6]. Understanding the duration of drought recovery is also important because if an area experiences a new episode prior to the full restoration of a recent drought, it will have more severe ecological implications [7]. Drought recovery is time taken by an ecosystem to revert to its pre-drought condition [8]. Better knowledge of the probability of when, why and how a drought will end would be useful for decision-makers to manage the transition from drought to replenished water supply [9]. Drought can be divided into four types: meteorological, hydrological, agricultural and socio-economic [10]. Meteorological drought is the rainfall deficit that can be immediately observed [11]. Hydrological drought is a lack of water availability in reservoirs of surface and subsurface water. Agricultural drought is measured in terms of deficiency in soil moisture, rainfall and groundwater resulting in crop yield reduction [12].
Traditional techniques of monitoring drought are based on data gathered from meteorological stations on rainfall, temperature and soil moisture [13]. For example, Palmer Drought Severity Index (PDSI), Crop Moisture Index (CMI), Rainfall Anomaly Index (RAI), Standardized Anomaly Index (SAI) and Surface Water Supply Index (SWI) [14]. However, ground tools used in conventional drought monitoring only provide localized estimates of most of the factors used to cope with the drought, such as soil moisture content. In addition, their implementation is often costly and time-consuming as well as labor-intensive and sometimes subject to failure of the instrument [15]. By incorporating satellite information on the GIS platform, the real-time monitoring of drought across large regions can be accomplished [16]. Remote sensing information transmitted by satellite offers a synoptic perspective of the Earth’s surface and can therefore be used to evaluate drought spatially based on the observing information from soil moisture, temperature, precipitation and vegetation growth [17]. In addition, remote sensing data are continuous datasets constantly available and can be used to detect the onset, duration and magnitude of drought [18].
Many studies on quantitative estimation of drought are available and these can be classified into several categories: index, stochastic, statistical, etc. [19]. The index approach utilizes drought index, like the standardized precipitation index [20]. A number of distinct indices for quantifying droughts have been developed, each with its own strengths and weaknesses and may not be applicable for all the different climate regions [21]. The vegetation condition index (VCI) utilizes for each location the minimum and maximum normalized difference vegetation index (NDVI) [22]. The utility of the NDVI based VCI has been studied for monitoring drought conditions in different regions around the world [23]. Kogan developed the land surface temperature (LST) dependent temperature condition index (TCI) for drought monitoring to eliminate the effect of seasonal temperature variations [24,25]. The team of researchers from Institute of Atmospheric Physics of China introduced soil moisture condition index (SMCI) and the precipitation condition index (PCI) to monitor drought conditions [26].
All these studies indirectly allude that a single drought index may not be enough to capture the complicated processes and drought diverse impacts. In this regard, combined drought indices are becoming more widely used [27,28]. Previous research has shown that the Microwave Integrated Drought Index (MIDI), which integrates the SMCI, PCI and TCI, is an optimal drought index for meteorological drought [28]. As microwave data (like TRMM and AMSR-E) which were previously used for precipitation and soil moisture have been redundant, in this study we will input non-microwave data to the MIDI by calling it a new index as Non-Microwave Integrated Drought Index (NMIDI). Scaled Drought Condition Index (SDCI) proved to be better than existing indices such as NDVI and Vegetation Health Index (VHI) in the Arizona and New Mexico’s arid regions [29]. In addition to the analyses of past drought events, drought prediction is of great importance too to help decision-makers [30]. Many studies have focused future drought conditions and water stress [31]. They have projected drought occurrences by using Global Circulation Models (GCMs) under future climate scenarios [32].
This drought study was conducted in the Chitral Kabul River Basin (CKRB) to assess meteorological and agricultural drought during the monsoon season using remote sensing and GIS techniques. This study area was chosen under the USAID funded project for transboundary Kabul River Basin which receives substantial flows from multiple origins including one from a mountainous area of Chitral, Pakistan [33]. It is 700 km long while 560 km lies in Afghanistan while remaining lies in Pakistan [34]. Its water is mostly used for irrigation and it is the only river of Afghanistan which empties into the ocean through Indus River of Pakistan [35,36]. Therefore, this river is a zone of conflict between both countries as there exists no treaty on use of water of this river [35,37,38]. Owing to the importance of this river basin, this study provides analysis of drought in past and its future trends so that while formulating any treaty on this basin, needs of people and their water requirement in terms of agriculture may be considered.
Previous studies show that due to climate change, the mean annual temperature at this basin will increase by 2.2 °C and 2.8 °C under Representative Concentration Pathways (RCP) 4.5 and RCP 8.5, respectively, in the following decades of the current century, whereas the precipitation has not shown a clear trend [39]. With this context, current global and regional climate changes with these future projections pose a great impact on CKRB for existing water usage, future requirements and its sharing for the people living on both sides of the border. As the water use demands of Afghanistan and Pakistan is increasing in coming decades and as climate changes affect patterns of precipitation, the strain on the Kabul River Basin will be great. This in turn, increases the strain on an already vulnerable population.
Thus, there is a need to study the drought scenario in the region using advanced remote sensing and GIS techniques for proper water management and future planning. For this purpose, various single and combined drought indices are calculated using satellite data, modeled data and blended product that combine satellite imagery with in situ station data (Climate Hazards Group Infra-Red Precipitation with Station (CHIRPS)) and also in situ ground station data for validation. Spatiotemporal drought patterns in CKRB are examined for the time series (2000–2018), and possible drought trends in CKRB are also investigated between 2020 and 2030. The broader objective is to harness remotely sensed data to get information about water consumption for the region which is poorly gaged and difficult to access physically from the perspective of drought. The main objectives are: 1) to use modeled and optically derived data as an input to non-microwave integrated drought index (NMIDI) as an alternative solution to MIDI; 2) to analyze the past trends in drought from the perspective of meteorology and agriculture; and 3) to provide future trends for the next decade in order to devise policy for constructing new dams and making water treaty between two countries. This study will provide insights into the drought scenarios of CKRB and will be very useful not only for the broader scope of the entire CKRB project on combined surface and ground water modeling but also for the policymakers on both sides of the border for water resource management and sharing, contingency planning and agricultural planning.

2. Materials and Methods
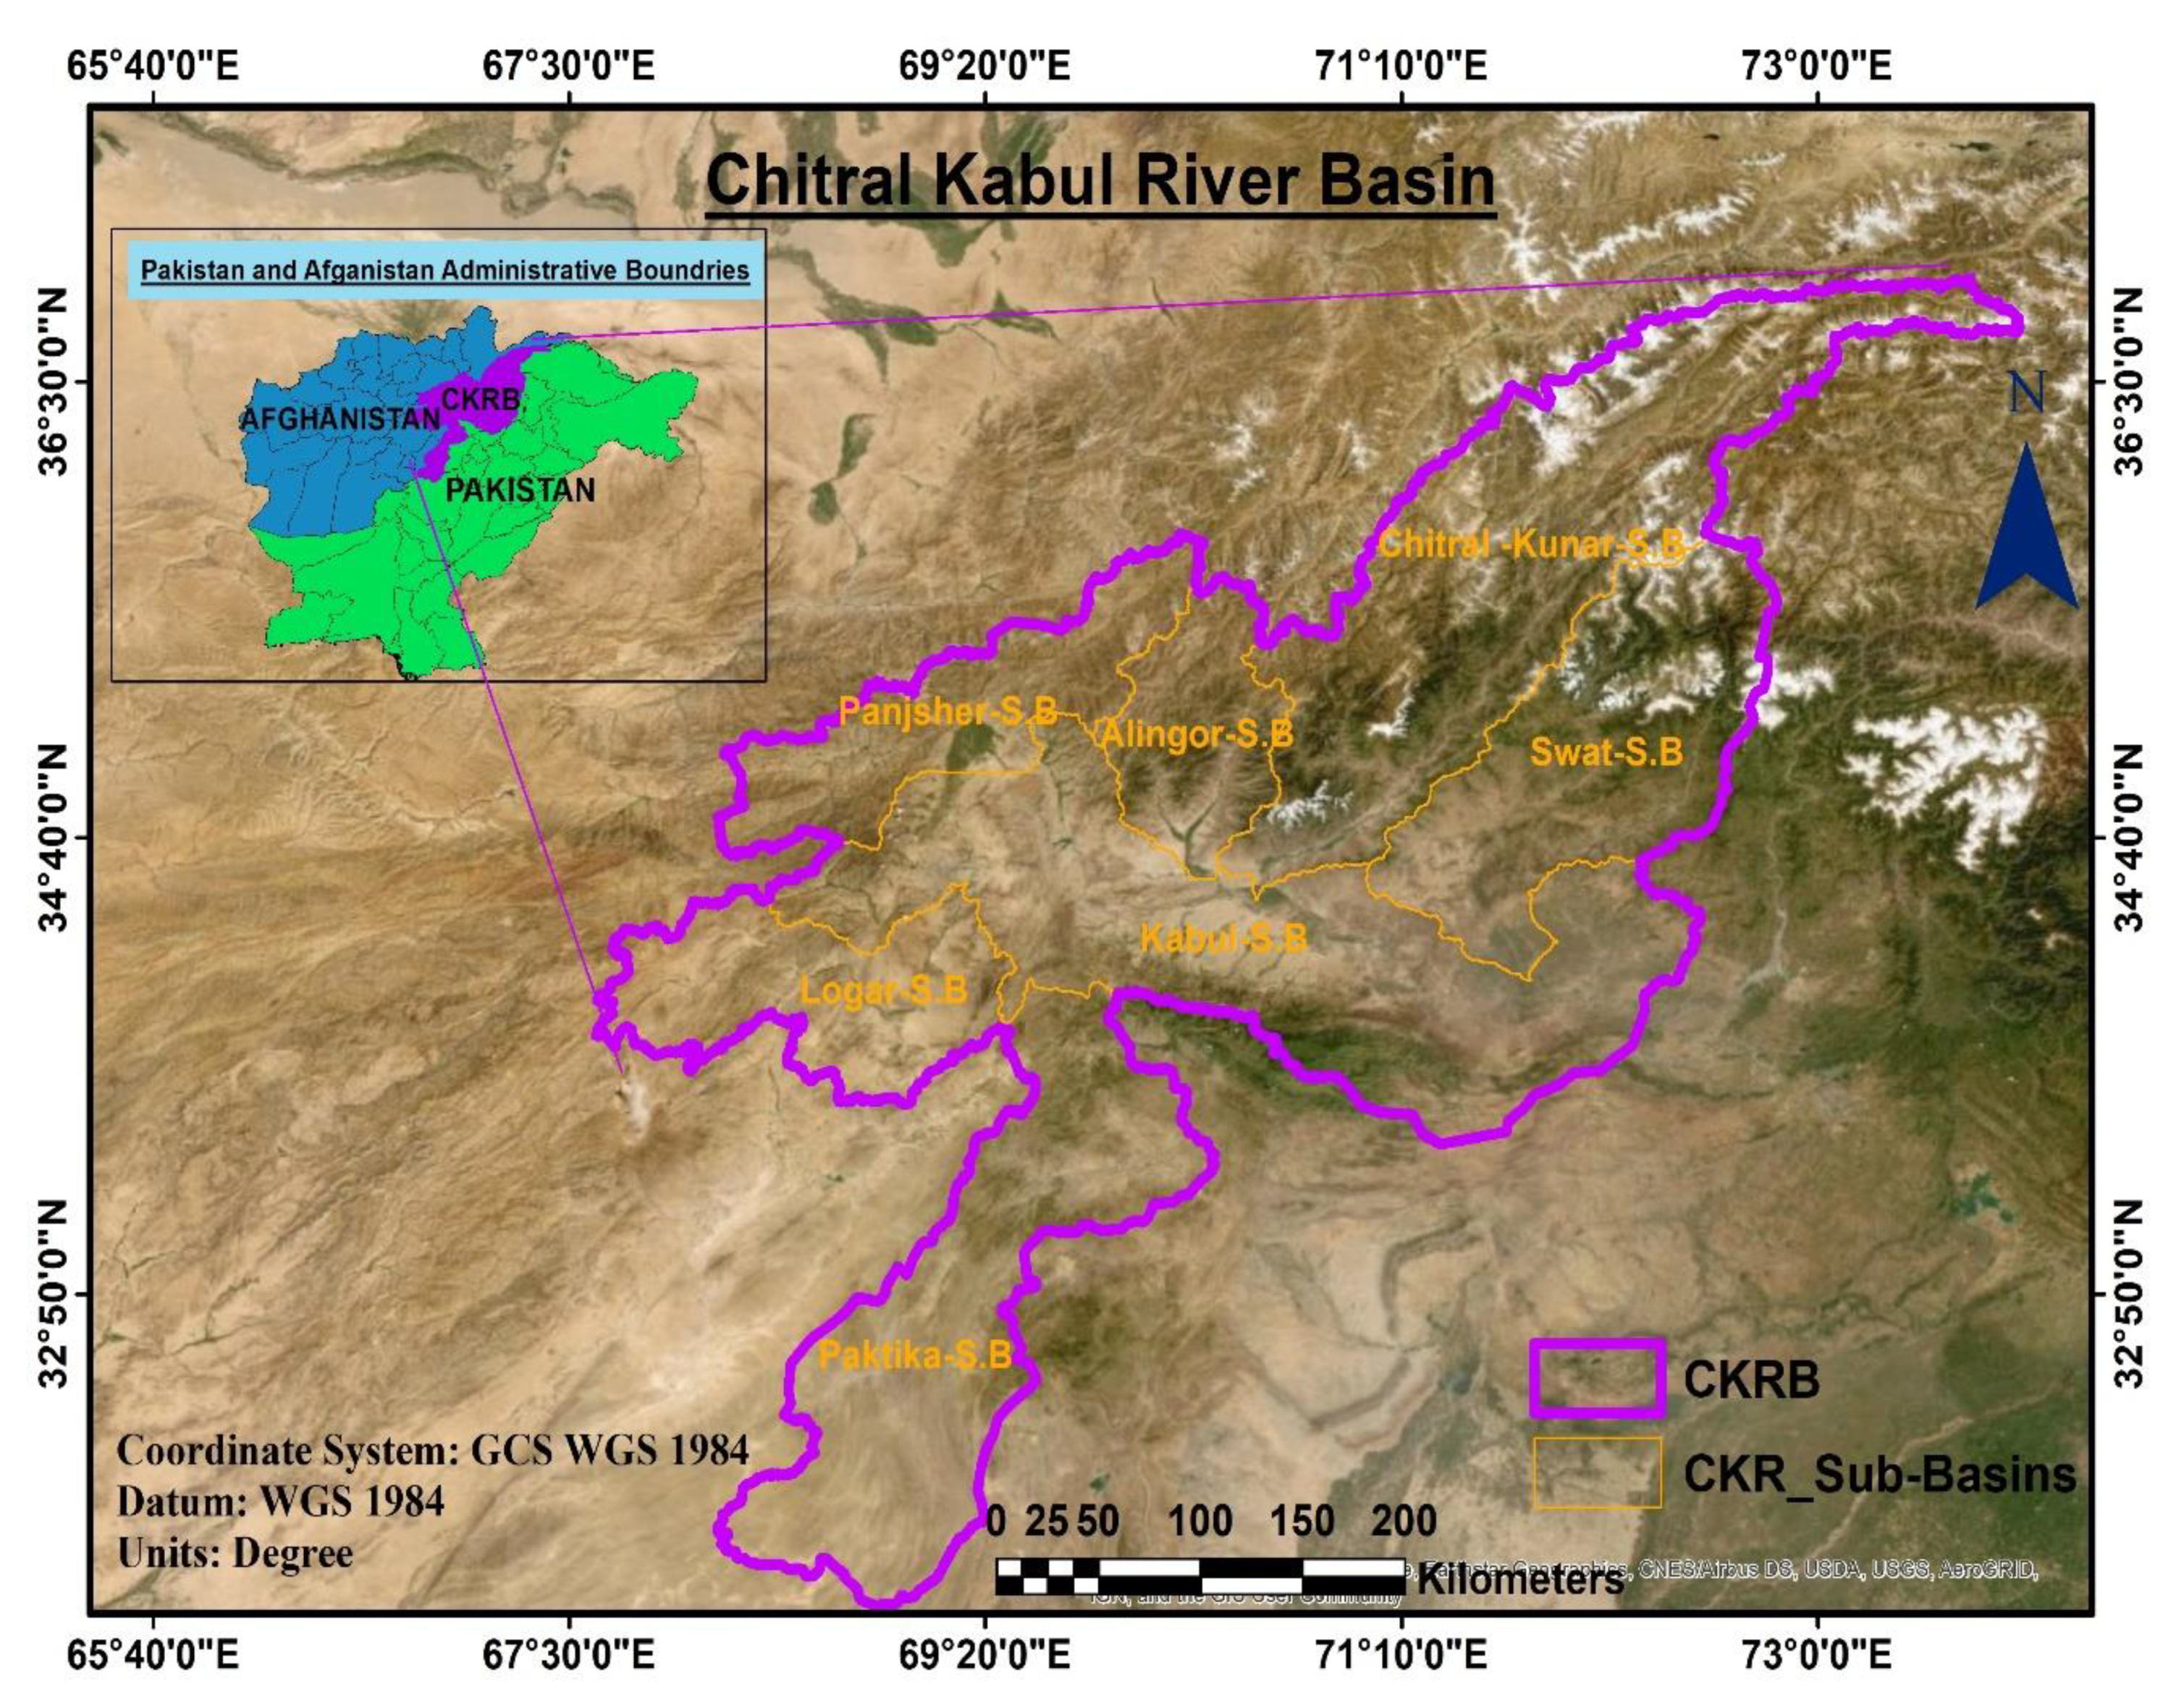
2.1. Study Area

The Kabul River Basin is located between latitudes 33°36′N and 36°55′N and longitude 67°36′E and 73°54′E and drains an area of 63,657 km2 (24,578 mi2) (Figure 1). The Kabul River Basin (KRB) is an upland surrounded by hills stretching across Pakistan’s northwest to the main eastern portion of Afghanistan. Elevation in the basin ranges between 305 m in Nowshera and 7690 m in the Konar Valley [40]. KRB’s water resources are divided between Afghanistan and Pakistan [41]. KRB’s climate is characterized by cold winters with seven months of extreme rainfall (November–May) and warm summers with less or no precipitation and stream flow, except in those rivers and streams fed by melting snow or glaciers [39]. As a result of the variability in altitude, precipitation across the basin differs significantly. In Afghanistan and Pakistan, an estimated 10 million individuals share KRB’s water resources [42].

2.2. Remote Sensing Data

Monthly dataset of Climate Hazards Group Infra-Red Precipitation with Station data (CHIRPS) was downloaded from http://chg.geog.ucsb.edu/data/chirps/ for the year 2000–2018. CHIRPS combines 0.05° resolution satellite imagery with in-situ station data to create gridded rainfall time series (Table 1).
The MODIS Land Surface Temperature (LST) data (MOD11A2) was acquired from MODIS library using MODIS packages in R software from 2000–2018. The MOD11A2 version 6 product provides 8-day, per-pixel land surface temperature (LST) which is having 1 km spatial resolution.
NDVI data was obtained as MOD13Q1 Version 6 product which provides a Vegetation Index (VI) value at a per pixel basis with 250 m spatial resolution from MODIS library using MODIS packages in R software for the year 2000–2018.
Monthly soil moisture data was obtained for the study area from FLDAS_NOAH01_C_GL_M: FLDAS Noah Land Surface Model L4 Global Monthly 0.1 × 0.1 degree (MERRA-2 and CHIRPS) for the time period 2000–2018.
Precipitation projections were downloaded from the National Aeronautics and Space Administration (NASA) Earth Exchange Global Daily Downscaled Projections (NEX-GDDP) dataset. NEX-GDDP datasets contains downscaled climate scenarios derived from the GCM simulations of the Coupled Model Inter-comparison Project Phase 5 (CMIP5) and across two RCP emissions scenarios from 21 models. Future Precipitation for the period 2020 to 2030 has been downloaded from https:/cds.nccs.nasa.gov/nex-gddp/ for two models, the Beijing Climate Center Climate System Model (BCC CSM1.1) and the Institut Pierre Simon Laplace Model (IPSL CM5A-MR) across RCP 4.5.

2.3. Meteorological Stations Data

Precipitation data was acquired from Pakistan Meteorological Department (PMD), Islamabad for Chitral, Drosh, Peshawar, Dir and Saidu Sharif ground stations for the monsoon season from 2000 to 2016.

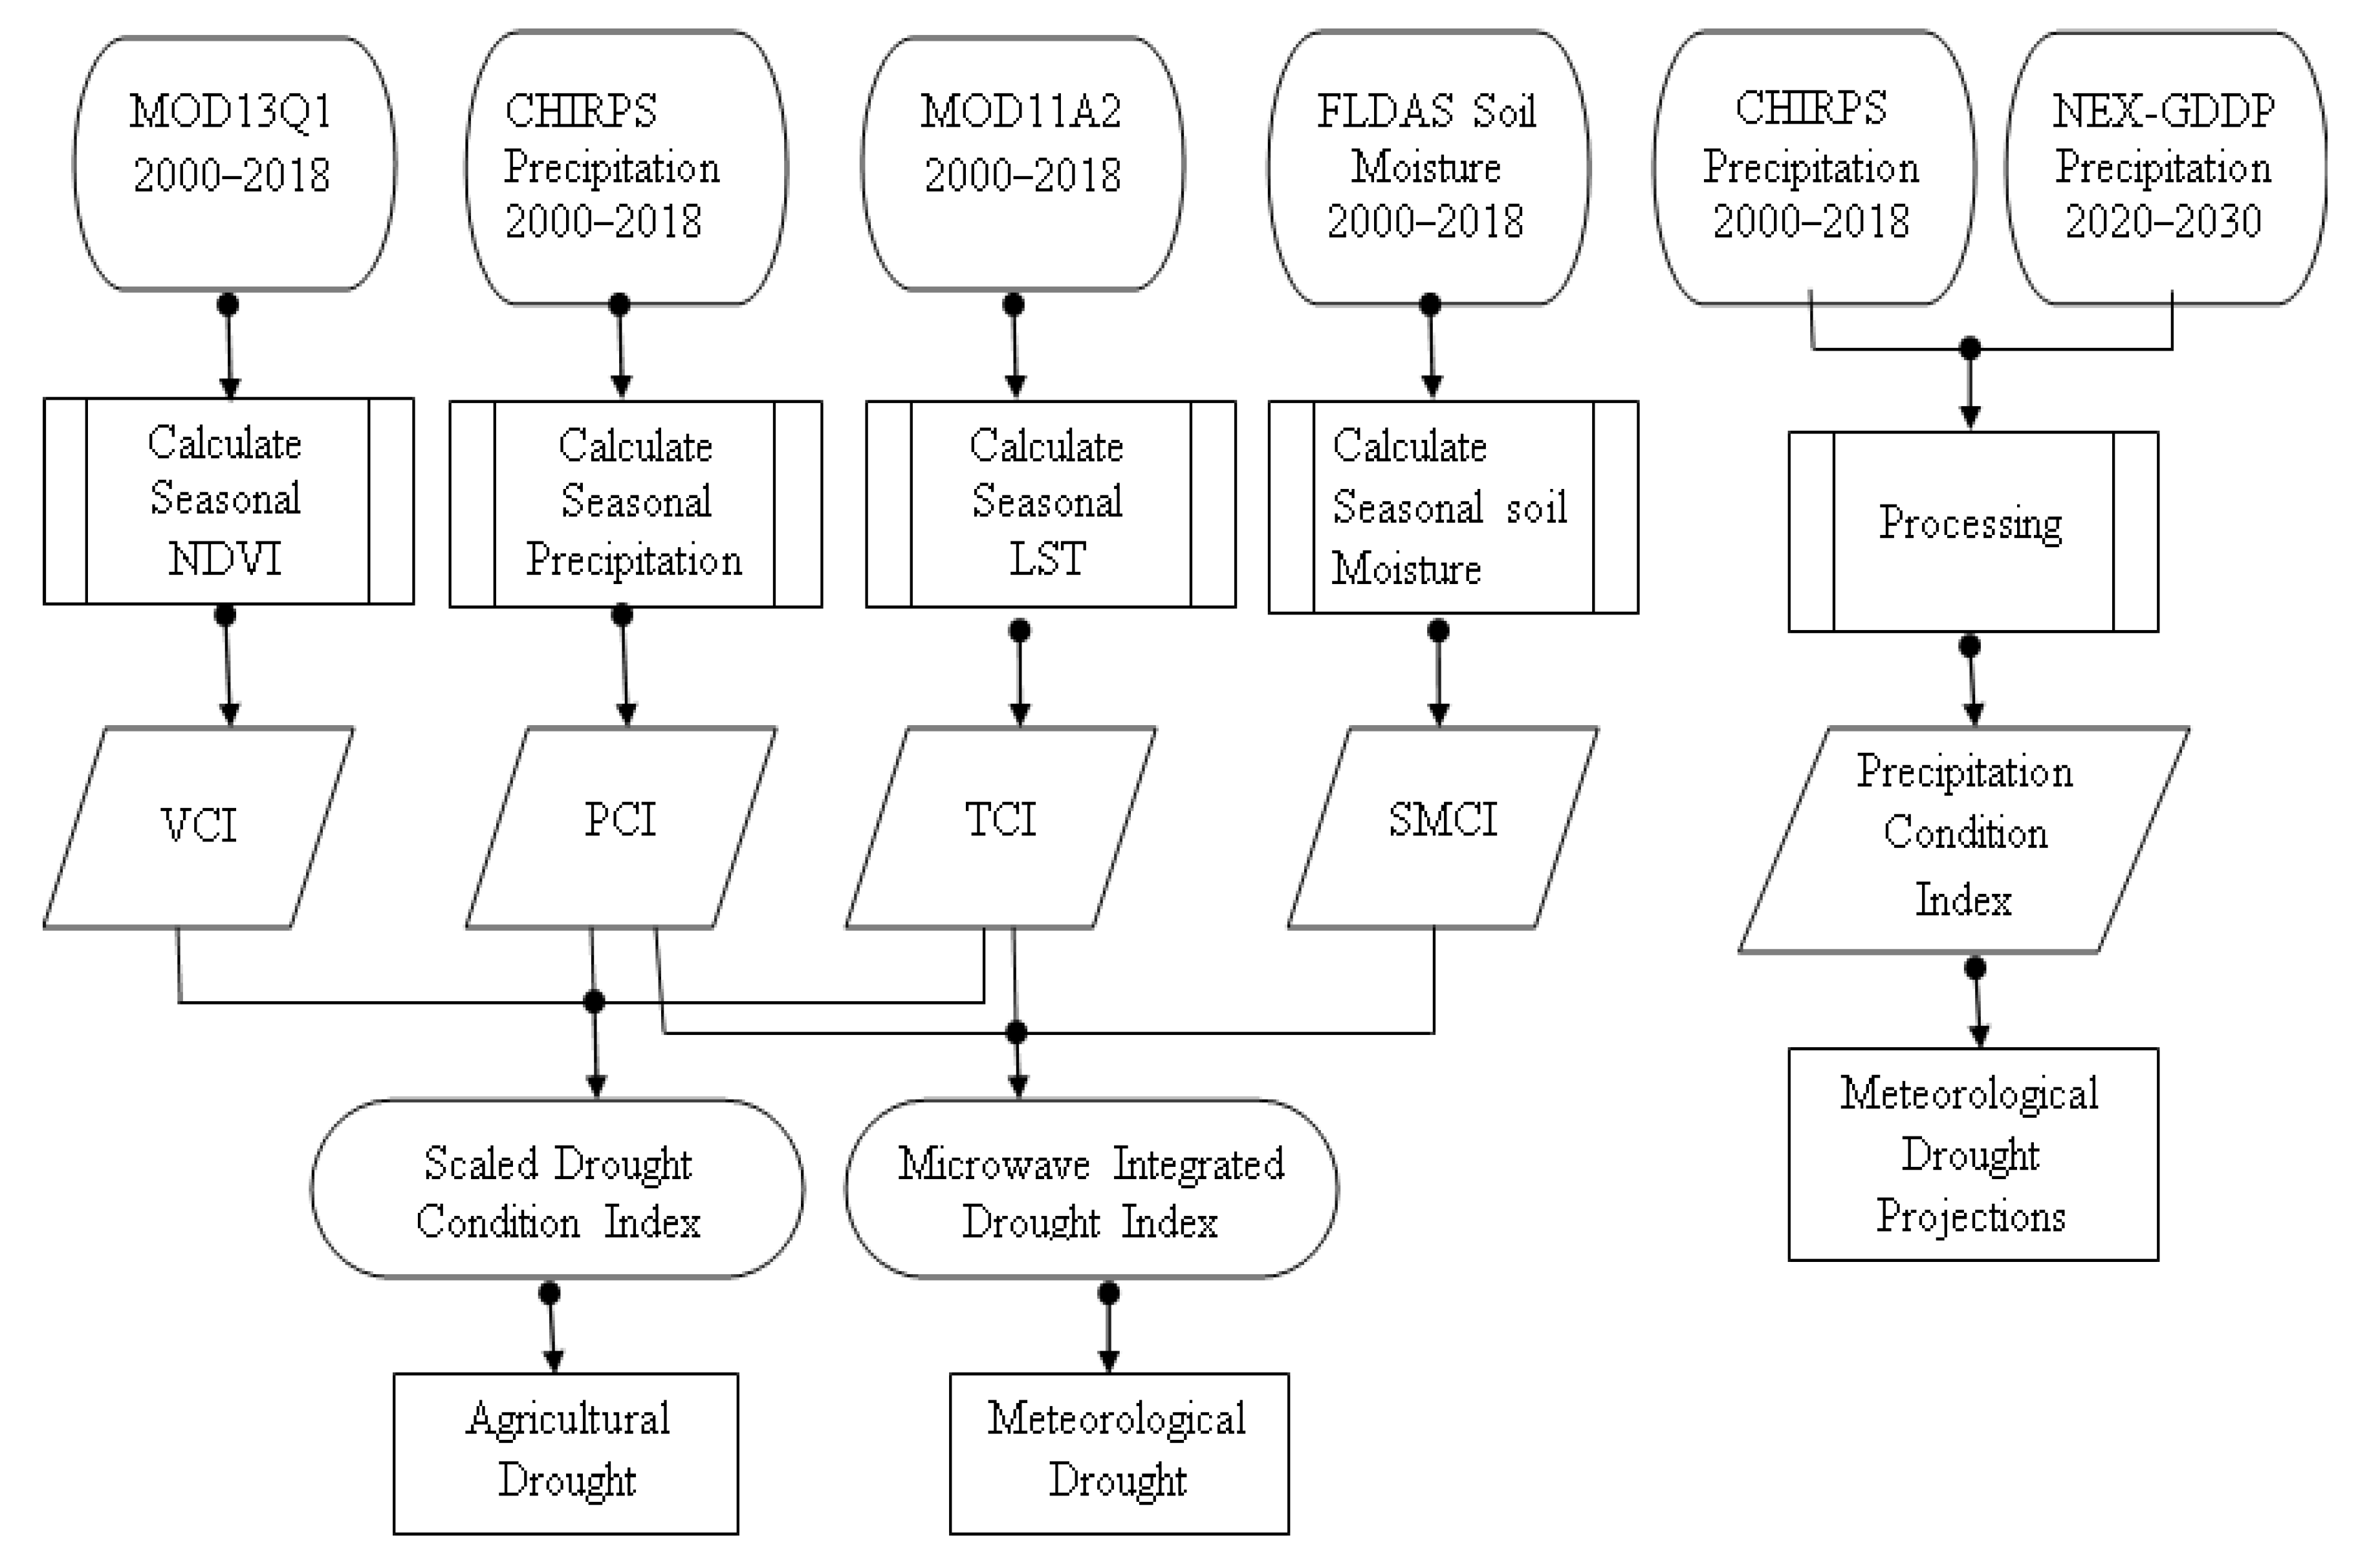
2.4. Data Processing

Processing of data includes extraction of the area of interest from the global datasets which were in TIF and NC file format. It was accomplished by the mask tool in the arc toolbox of the Arc Info GIS and netcdf packages in the R software. From the masked images, seasonal (Jun–Sep) NDVI, LST, Soil Moisture and Precipitation datasets for each year from 2000 to 2018 were prepared by the cell statistic tool in the Arc Info GIS. Upscaling and downscaling of the data to 1000 m was done by resampling (bilinear interpolation). Finally, drought indices were calculated through the algorithms explained as follows and integrated for drought monitoring. Meteorological drought was assessed by NMIDI values while agricultural drought was evaluated by SDCI during the monsoon season (Jun–Sep) from 2000 to 2018. All this procedure is presented in schematic flowchart of Figure 2.
The Vegetation Condition Index (VCI) compares the present time step with the long-term minimum NDVI and demonstrates how nearer the present time step to the minimum long-term NDVI [22]. Table 2 is showing all the equations of indices used in this research. Equation of VCI is given by;
VCI = ( NDVI j NDVI min ) ( NDVI max NDVI min )
TCI was developed from Kogan’s work with NOAA in the United States. Using AVHRR thermal bands, TCI is used to determine stress on vegetation due to temperatures and excessive wetness using AVHRR thermal bands. Conditions are estimated with respect to maximum and minimum temperatures and adjusted to represent distinct vegetation temperature responses [43].
TCI = ( LST max LST j ) ( LST max LST min )
Soil Moisture Condition Index (SMCI) was derived from soil moisture data (FLDAS) using the same algorithm as VCI [44].
SMCI = ( SM j SM min ) ( SM max SM min )
CHIRPS can provide an estimate of monthly precipitation, from which data on meteorological drought can be taken. Precipitation Condition Index (PCI) that is standardized by CHIRPS information using a comparable VCI algorithm is described for the identification of climate signal precipitation deficits [27].
PCI = ( P j P min ) ( P max P min )
where for all of the above equations “j” is the current time step and “max” and “min” are multiyear maximum and minimum, respectively.
The Scaled Drought Condition Index (SDCI), an integrated remote sensing drought index, was developed to monitor agricultural drought using multi-sensor data [29]. SDCI is calculated by empirical weighting of PCI, TCI and VCI (Figure 2).
SDCI = α TCI + β PCI + ( 1 α β ) VCI
where α + β + γ = 1
We have used the CHIRPS Precipitation Condition Index (PCI), the Soil Moisture Condition Index (SMCI) and the Temperature Condition Index (TCI) to detect and monitor meteorological drought on a timely national scale. The Non-Microwave Integrated Drought Index (NMIDI) is an integration of all three components with flexible weights [26].
NMIDI = α PCI + β SMCI + ( 1 α β ) TCI
where α + β + γ = 1

3. Data Validation

Pearson correlation between precipitation from the ground meteorological stations (PMD) and satellite based CHIRPS data was applied to evaluate the satellite observation. Ground stations data was also correlated with precipitation datasets from NEX-GDDP. T Test was applied to check the significance level of the data.

3.1. Correlation of PMD and CHIRPS’ Precipitation

CHIRPS’ mean precipitation of the monsoon season from 2000 to 2016 was correlated with mean precipitation of PMD during the same time period as shown by scatter plot in Figure 3a. There is a strong positive correlation for CHIRPS (R2 = 0.81). The T value returned from two tailed T Test is 0.016 which shows significant match between both variables. There is almost a similar trend from 2000 to 2016 between both datasets as shown in Figure 3b.

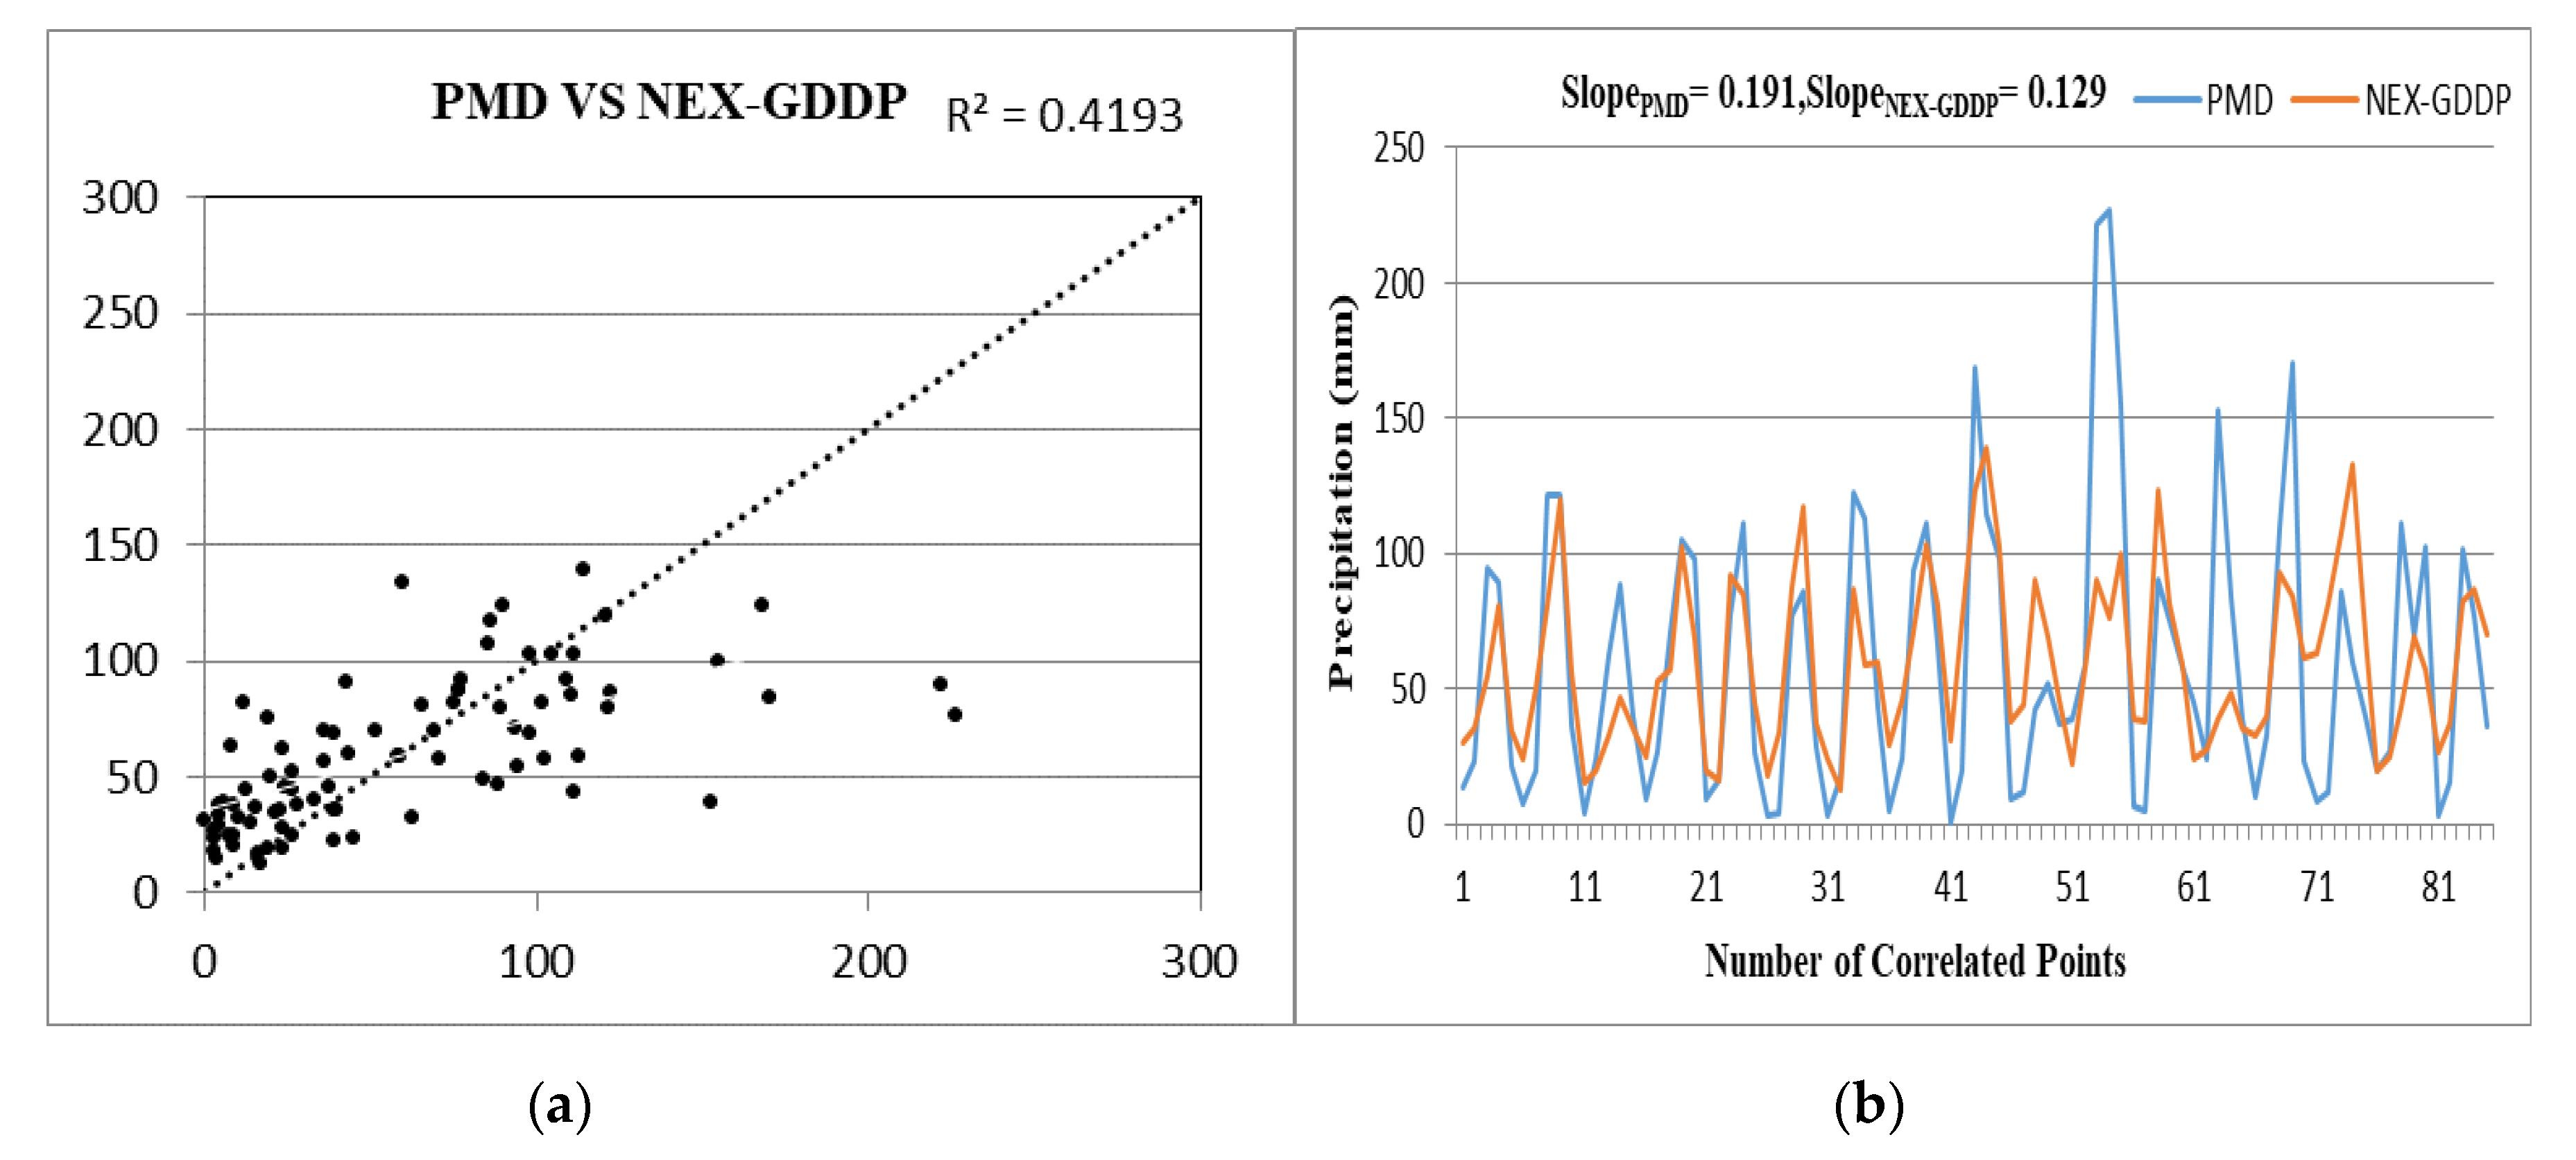
3.2. Correlation of PMD and NEX_GDDP Precipitation

NEX_GDDP dataset having precipitation projections from two models (BCC_CSM1.1 and IPSL CM5A-MR) was evaluated with PMD dataset. To validate the data from the models, we compared the historical precipitation data of these models over the same time span from 2000–2016 with that of the PMD dataset. This is shown by the scatter plot in Figure 4a. The value of R2 is 0.4193 which shows moderate positive correlation. The T value from one tailed T Test is 0.48 which does not show significant matching while the trend between both datasets from 2000 to 2016 is almost similar as shown in Figure 4b.

4. Results and Discussion

In this study, we investigate the drought scenario in the CKRB for the period 2000 to 2018 using integrated drought indices like NMIDI and SDCI.

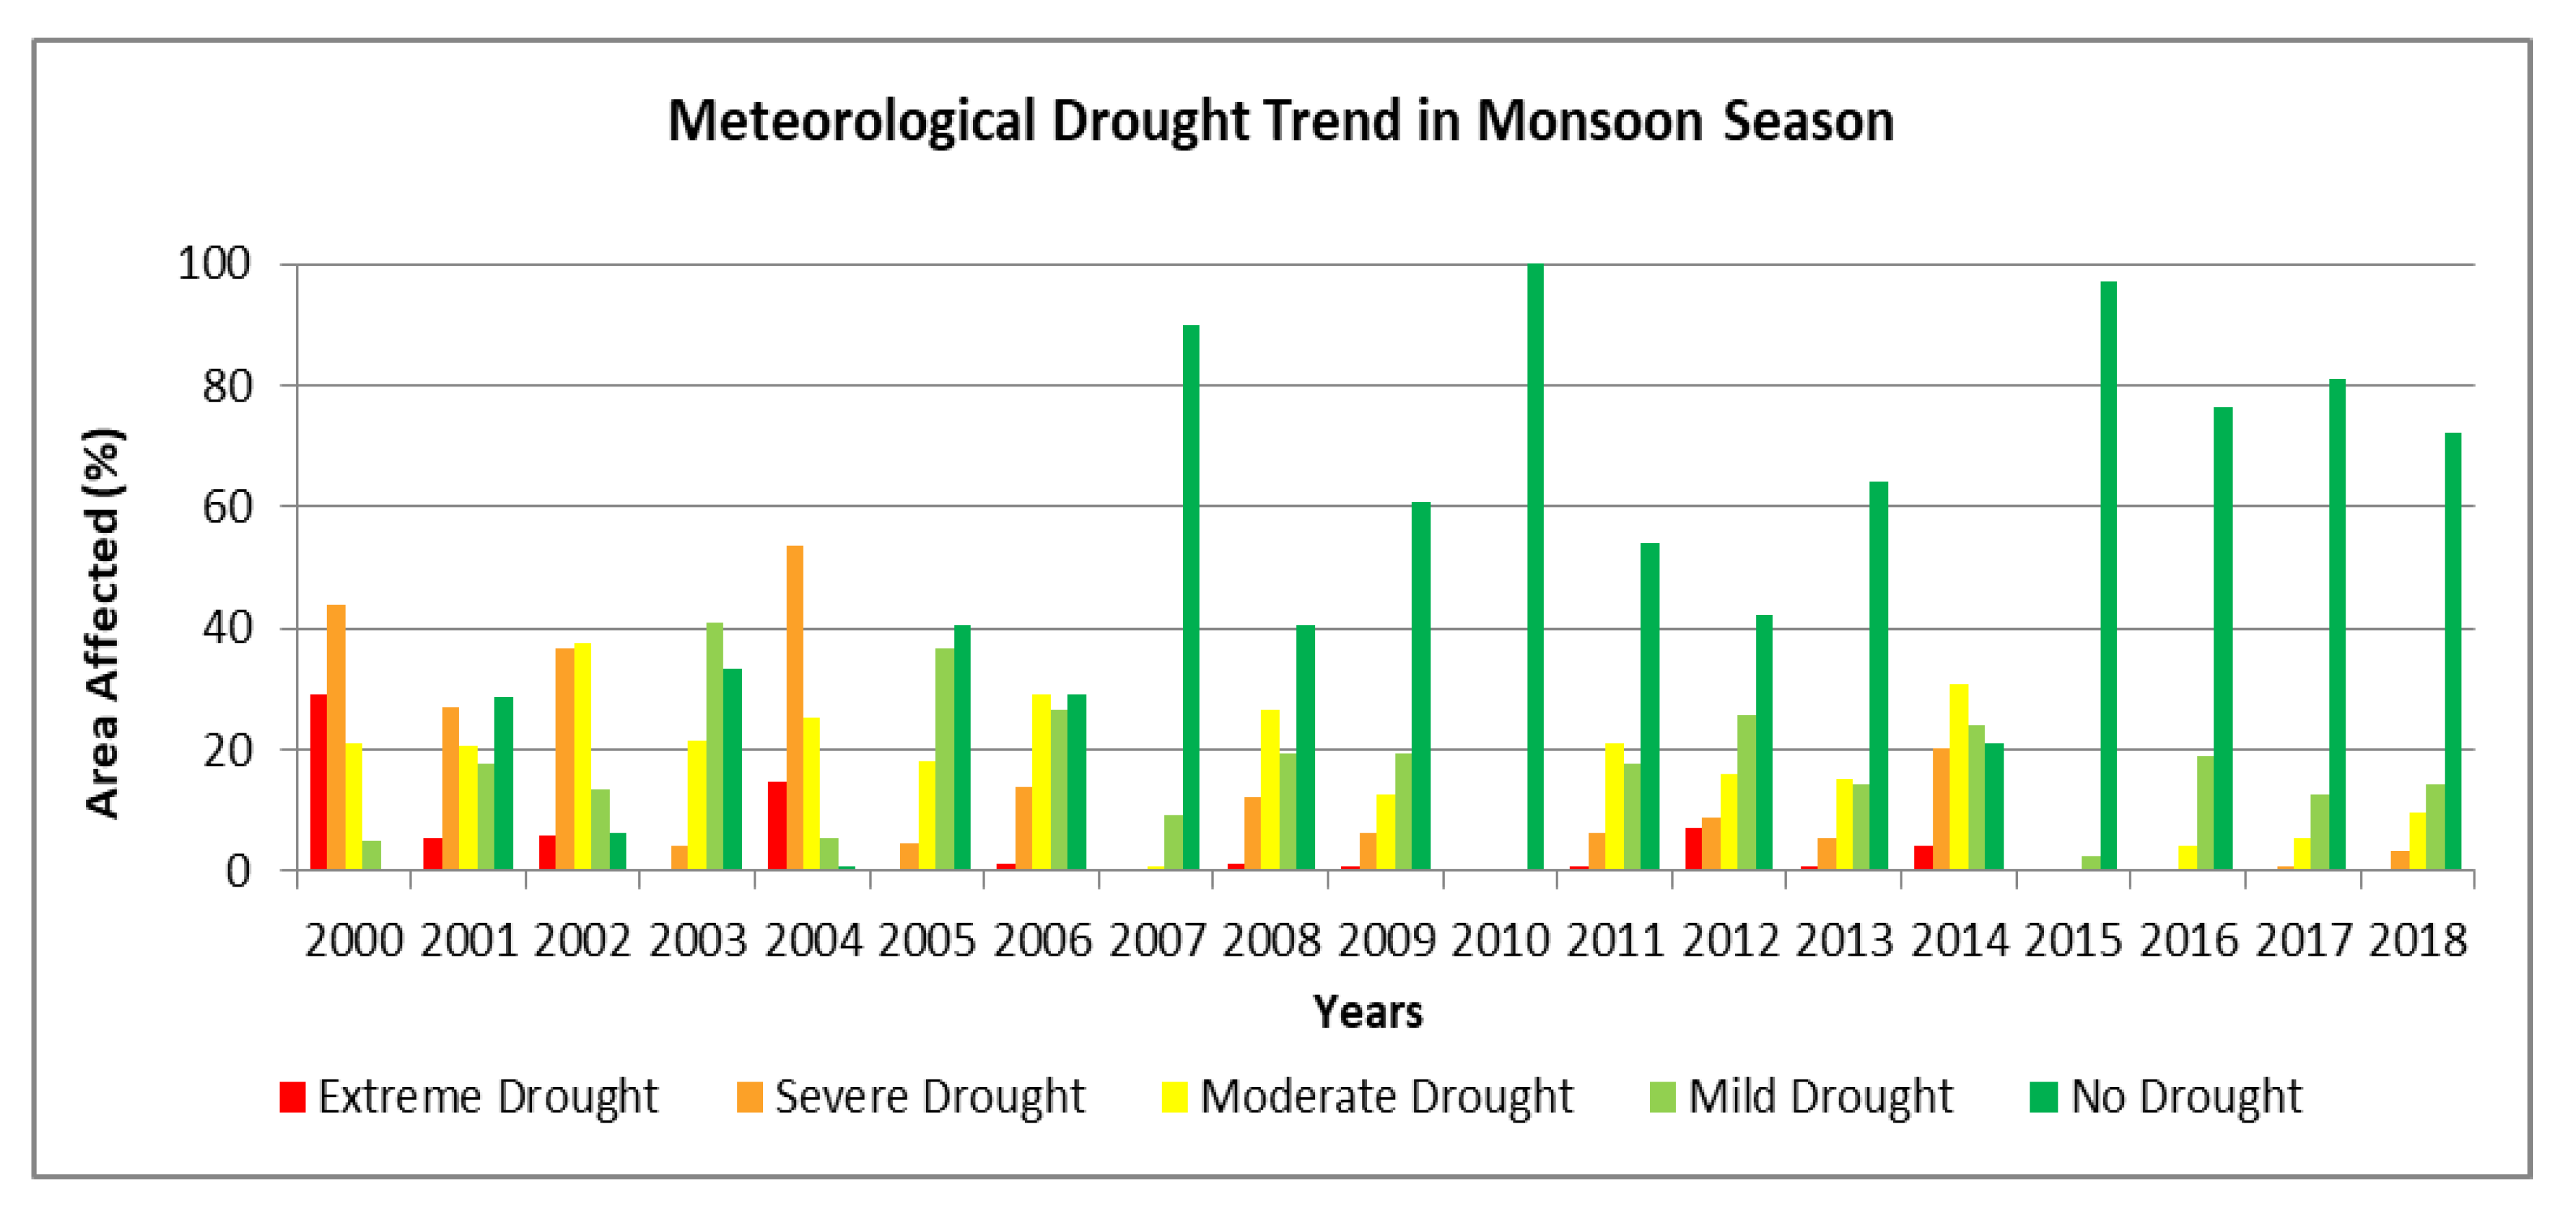
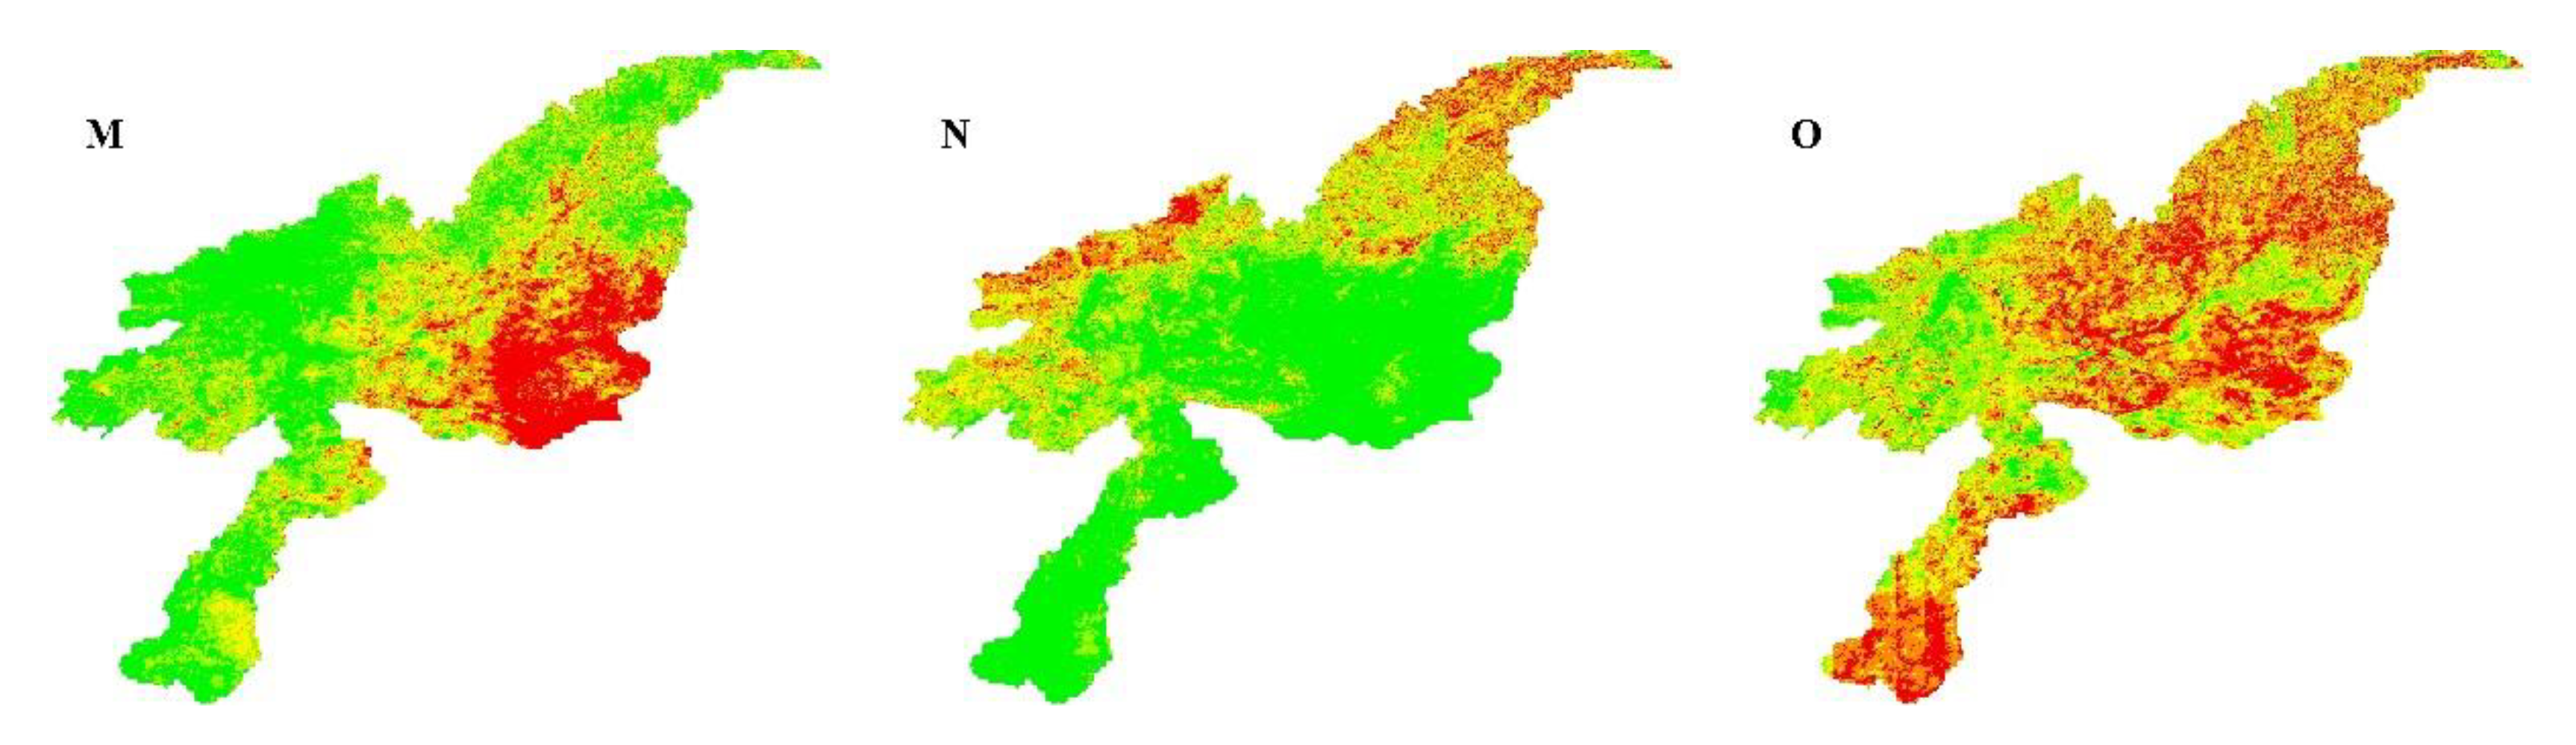
4.1. Meteorological Drought

All maps of NMIDI given below has values ranging from 0–1, where 0–0.1 shows extreme drought, 0.1–0.2 (severe drought), 0.2–0.3 (moderate drought), 0.3–0.4 (mild drought) and 0.4–1 demonstrates no drought.
Figure 5 and Figure 6 show the spatial and temporal variation of meteorological drought between 2000 and 2018, with NMIDI values varying from 0 to 1. NMIDI values were lowest in the year 2000, most of which ranged from 0 to 0.4, representing extreme to mild drought conditions. At western parts of the basin drought severity was less as compared to other parts of the basin. ‘No-drought class’ (0.4–1) had nearly negligible presence in 2000, which further confirmed this year as a drought year.
Upper and western parts of the basin had lowest NMIDI values ranging from 0 to 0.3 in 2001, indicating extreme, severe and moderate drought conditions, while other parts had higher values showing no drought conditions. This year was followed by a dry year in which most parts of the basin were under extreme to mild meteorological drought, with no drought in some areas of the western and eastern margins. A positive trend was observed in 2003 with an increase of no drought in the study area. Spatial variations in meteorological droughts have occurred, but moderate, mild and no drought has a significant presence, while the area affected by extreme and severe droughts is very low.
In 2004, the majority of the area had low NMIDI values, with a predominant severe drought class (0.2–0.3). This shows that most of the basin was under severe meteorological conditions. In the following year, the lower parts of the basin and some areas in the west have severe to mild droughts, while in other parts of the basin there was a prevalence of mild droughts represented by light color and no droughts represented by green color.
Upper and western parts of the basin have lowest NMIDI values ranging from 0 to 0.4, representing extreme, severe, moderate and mild droughts, while the remaining basin was mostly dry-free. In 2007, NMIDI had higher values in almost the entire basin, which shows that there was no drought but some areas in the upper and lower parts of the basin had mild drought. In the year following this one almost the entire margins at the north and south of the basin had extreme to moderate drought while other parts of the basin had significant values of NMIDI and no drought conditions were dominant.
In 2009, some areas in the western and lower parts of the basin had MIDI values ranging from 0 to 0.4, which showed that these areas were under extreme to mild meteorological drought. There was no drought in the remaining areas of the basin. Nearly no drought year followed this year in which the entire basin had NMIDI values from 0.4 to 1 which suggested no drought.
Drought conditions in the upper and west regions existed during the year 2011, while other areas of the basin have higher NMIDI values. Reverse trends have been observed in the following years (2012 and 2013) where the upper parts of the basin have drought conditions in one year and the lower parts have no drought and vice versa.
Drought conditions were again experienced in 2014, and the majority of the NMIDI values in the area range from 0–0.4 indicating conditions of drought. The no drought class dominated in the subsequent years up to 2018. In 2015, almost the entire basin had no drought conditions while in the subsequent years up to 2018, upper parts of the basin have meteorological drought with low severity while other parts have NMIDI values ranging from 0.4 to 1 representing no drought.
Temporal trend of meteorological drought has been represented by the variation of area for each class in a particular monsoon season of a year as shown in the Figure 7. We can determine that more area was affected by extreme meteorological drought in 2000 (29%) and 2004 (14.7%), but since then a decreasing trend has been observed up to 2018. The area representing extreme and severe drought is getting peak in 2000 and 2004 but since then there is decreasing trend up to 2018. Severe and moderate drought area also has decreasing trend from 2000 to 2018 but mild drought has a slight increasing trend. The no drought area is very low in 2000 but as we move to 2018, there is an overall increase in the no drought area and is highest in the year 2007, 2010 and 2015.

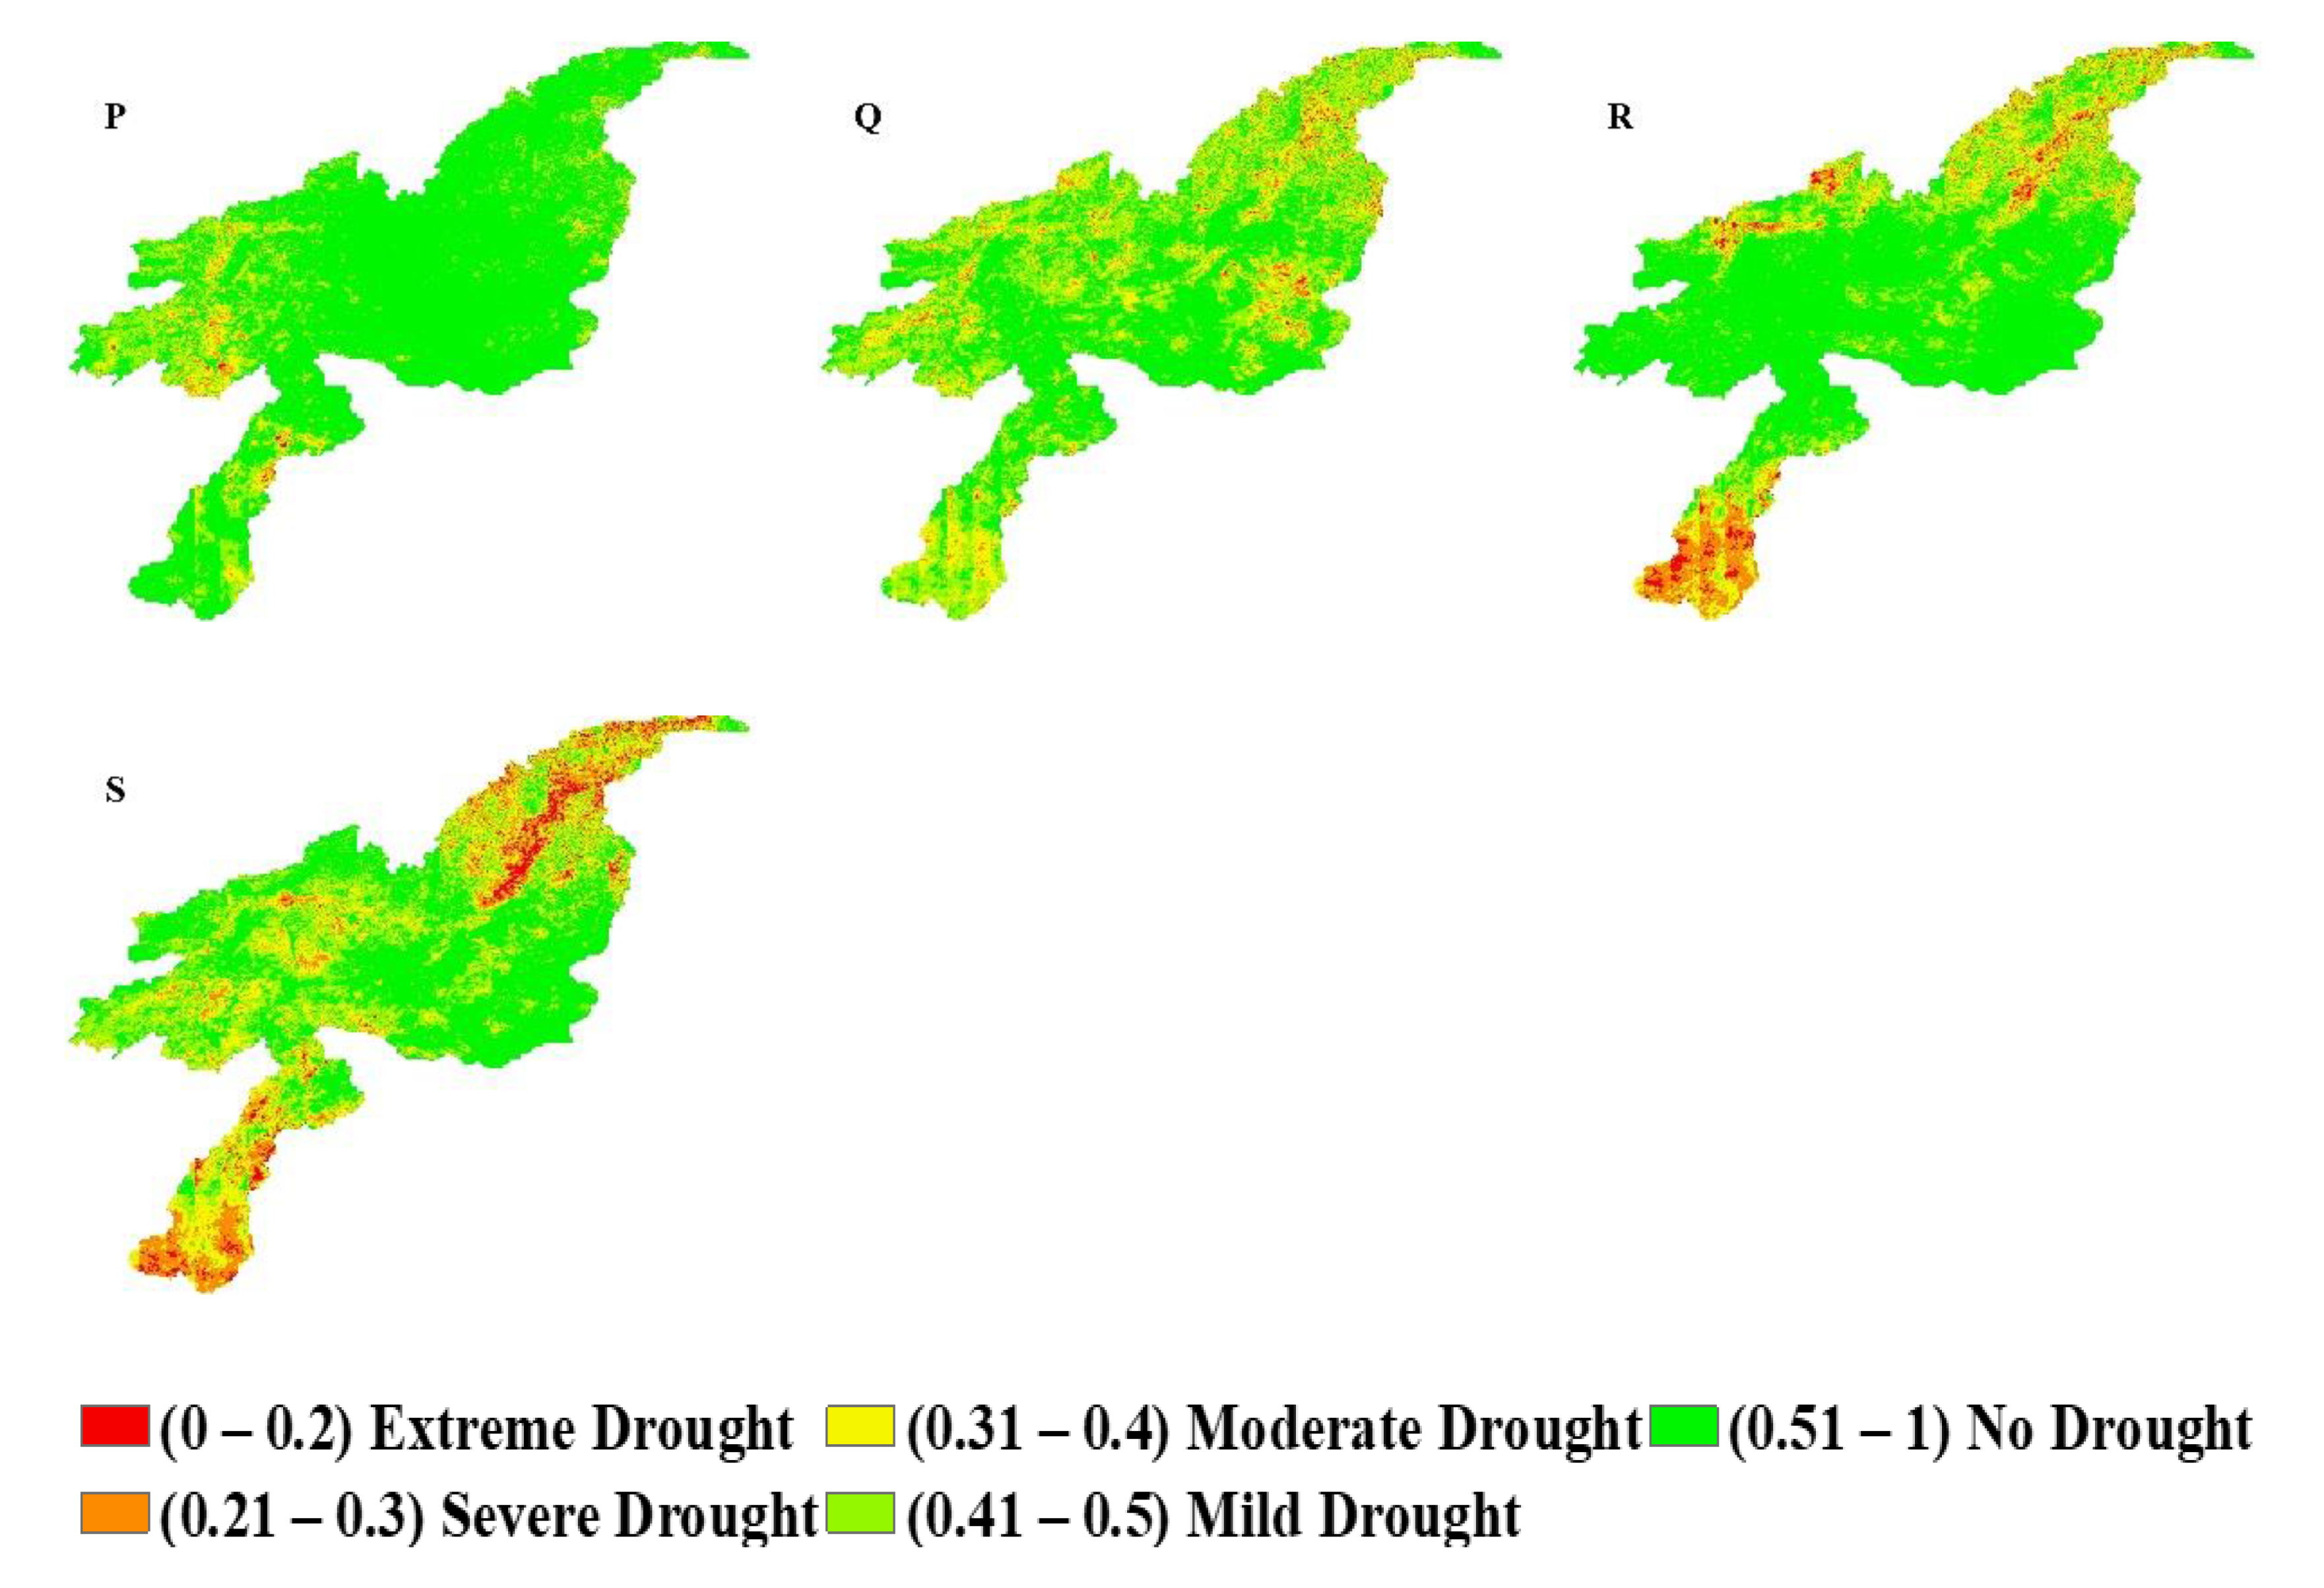
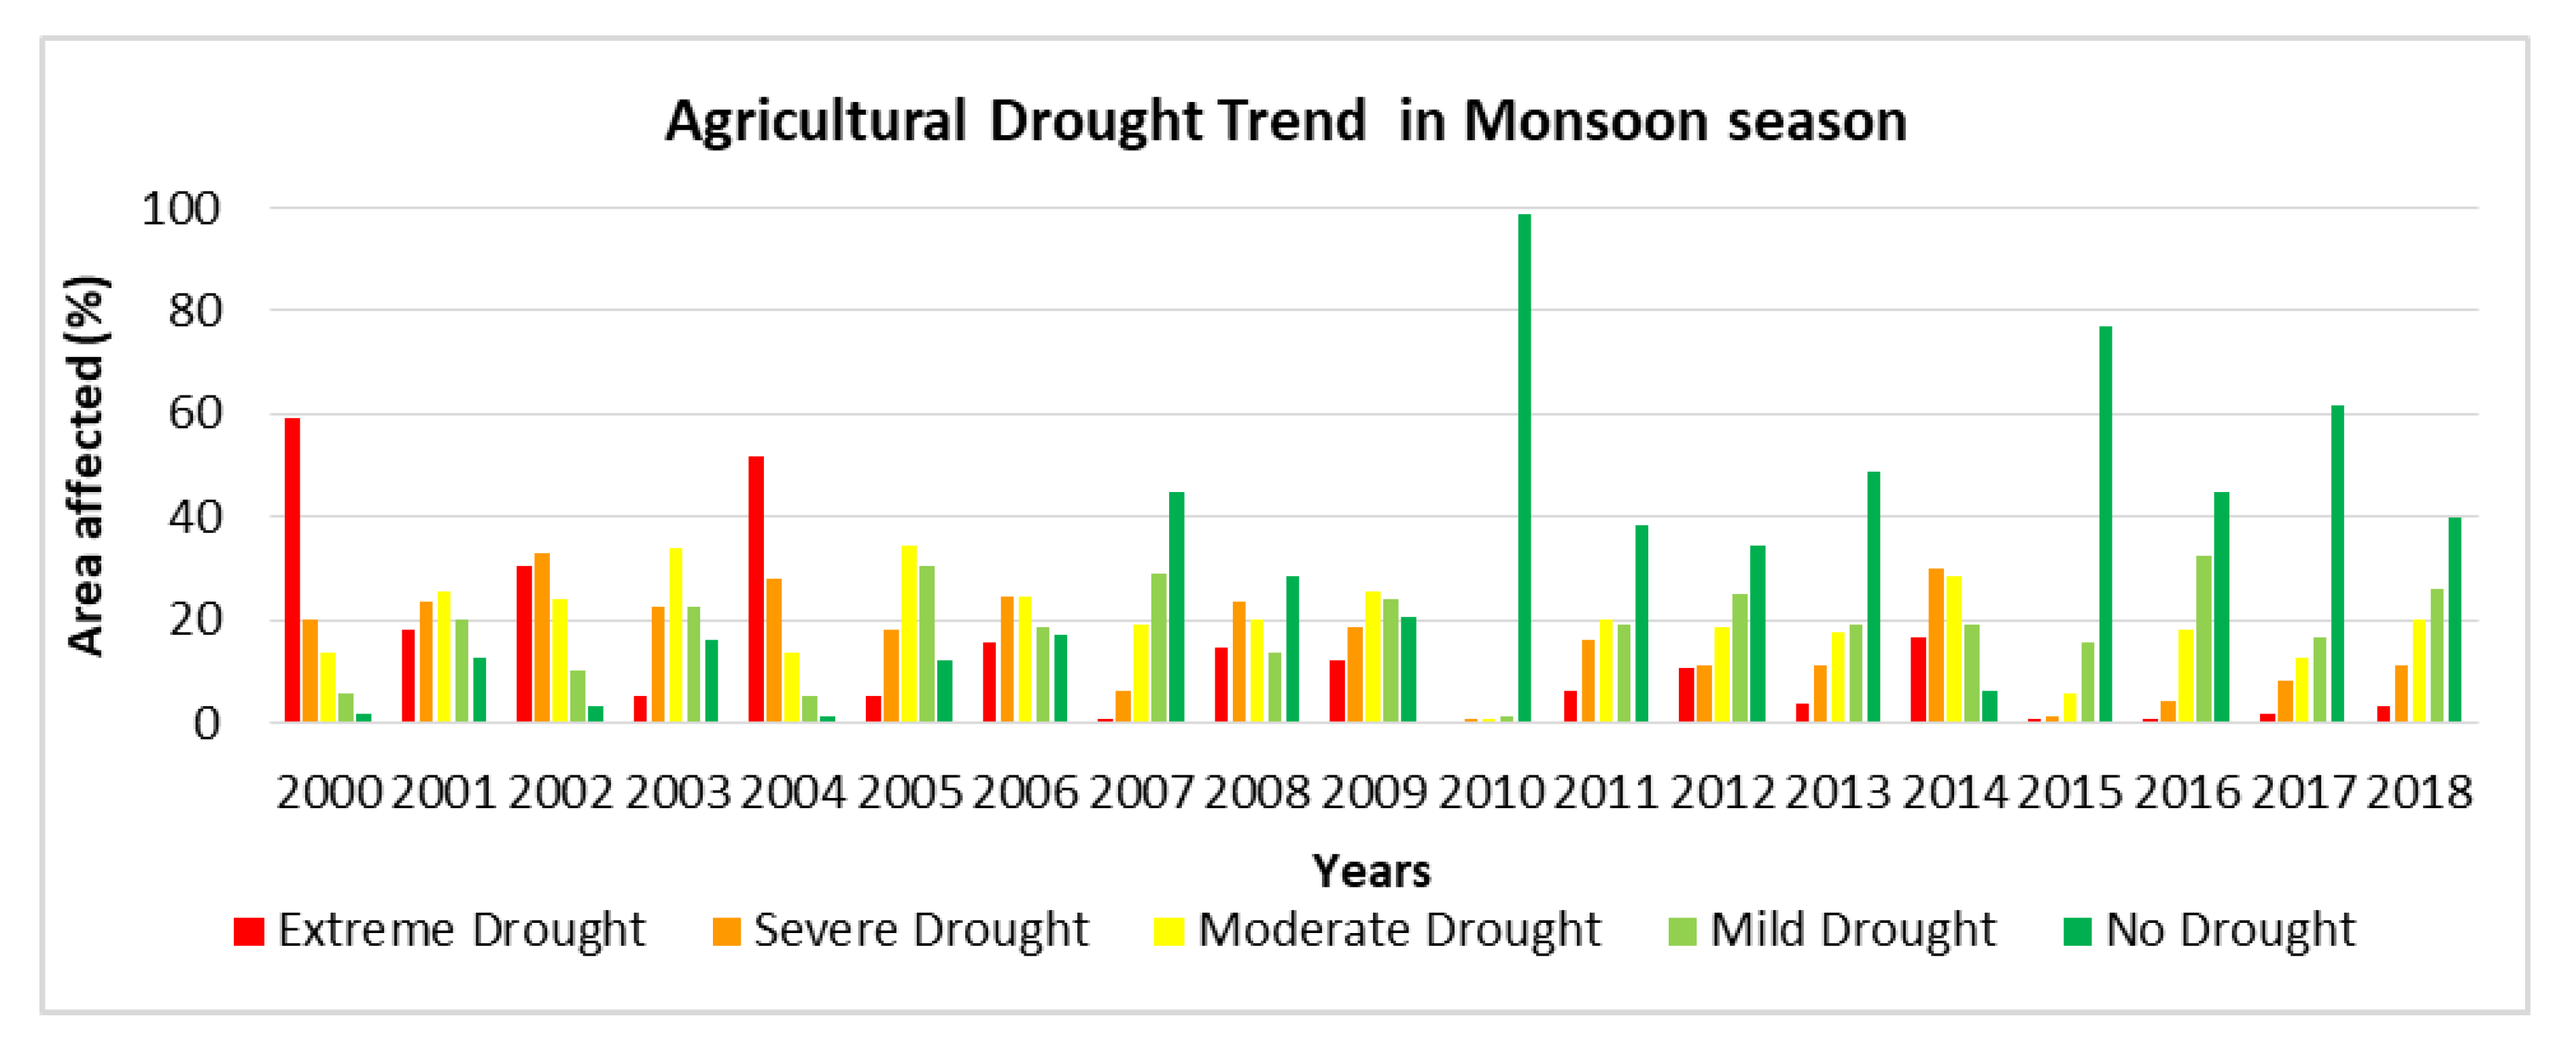
4.2. Agricultural Drought

All SDCI maps provided below have values ranging from 0–1 where 0–0.2 indicates extreme drought, 0.2–0.3 (severe drought), 0.3–0.4 (moderate drought), 0.4–0.5 (mild drought) and 0.5–1 represents no drought.
Figure 8 and Figure 9 demonstrates the spatiotemporal variation of the agricultural drought between 2000 and 2018. Figure 8 shows that the SDCI values in 2000 mostly range from 0–0.2 (represented by red color in map) which indicates that most of the area is under extreme agricultural drought. Over all, most of the area is under drought SDCI values range from 0–0.5 showing extreme, severe, moderate and mild drought while no drought area (0.5–1) is almost negligible.
In 2001 there was a decrease in drought severity when contrasted with the earlier year. Upper and western parts of the basin have low estimation of SDCI (0–0.3) representing extreme to severe drought while middle and eastern parts have moderate to mild drought with some green patches showing no drought class. Most of the basin prevails in the state of drought in 2002 but the severity of drought has decreased as compared with 2000. Most areas have SDCI values ranging from 0–0.5 which indicate conditions of drought. The severity of the drought decreased the next year, with the majority of the basin experiencing extreme to moderate drought.
There is a similar pattern in 2004where virtually all areas were facing conditions of drought. Extreme drought class was dominating the area (shown by red color in the map) followed by severe, moderate and mild drought. No drought class has very limited presence.
The spatial variability in the SDCI values occurred in the following year as much of the region was under extreme to moderate drought but there was also significant area of no drought class. In the year 2006, western and middle parts of the basin were experiencing extreme to mild drought (represented by red, yellow and golden color in the map) while other parts have considerable greenness showing no drought. In 2007 we observed positive trend as the map show an overall increase in SDCI values where no drought class was abundant.
In 2008 and 2009, there was a reverse pattern as the western parts of the basin faced drought conditions while the eastern parts had no drought in 2008, while the situation was the opposite in 2009. In 2010 the basin as a whole has higher SDCI values mainly ranging from 0.5 to 1 reflecting no drought class.
The upper and west parts encountered drought conditions in the following year, while other areas of the basin had higher SDCI values. In the subsequent years, up to 2013 there was reverse trend where the upper parts faced drought conditions in one year while the lower parts did not have drought while vice versa.
Drought conditions were again encountered in 2014 and most areas had drought conditions with SDCI values ranging from 0–0.5. The no drought class dominated in the subsequent years up to 2018, of which 2015 was the wettest year in which no drought conditions prevailed (Figure 9).
Agricultural drought in the monsoon season has been indicated by the expanse of area effected by each drought class in a specific year as shown in Figure 10. In the year 2000, peak is observed in the area of extreme drought class which has a decreasing trend as we move towards 2018. There is also a decreasing trend in the areas of severe, moderate and mild drought class from 2000 to 2018. There is an increasing trend in the area of no drought class from 2000 to 2018 where its area is lowest in the year 2000 and 2004 but starts increasing up to 2018 showing positive trend except in the year 2014 where it has slightly decreased.
In this study we have used precipitation data from CHIRPS for calculation of PCI and have correlated it with the rain gauge data. From correlation, we can conclude that for areas with less or no in situ meteorological stations data, CHIRPS can be a good source for providing precipitation datasets to monitor meteorological drought.
The results indicate that in the years 2000 and 2004 almost the entire basin has meteorological and agricultural drought so these years were considered as drought years. In previous research drought studies showed that Barkhan (Balochistan, Pakistan) was facing the longest drought between 1999 and 2001, spanning over 22 months [45]. Our research also confirms the findings of another research which found drought in this basin till 2003 [39]. This shows that drought indices used in this study (NMIDI for meteorological drought and SDCI for agricultural drought) have captured the drought scenarios in CKRB.
The north western sides of the basin were mostly having drought conditions and overall drought severity in these parts of the basin was also high. The reason for this severity is that monsoonal rainfall does not reach these parts of the basin due to mountainous terrain and they are highly dependent on rainfall. As deficiency of precipitation is the main component in drought occurrence so that is why these parts are most vulnerable to drought. Meteorological drought occurs due to deficiency of rainfall and its time period defines the severity of drought over an area. If the rainfall deficiency occurs over a longer period of time then it enhances the evapotranspiration and causes reduction in soil moisture which ultimately tends to arise the agriculture drought over the area. As long as the rainfall remains below normal, the meteorological drought severity increases over the period of time and cause more severity in the agriculture drought and impact the crop and vegetation of that area.
Results also show that meteorological drought has an impact on agricultural drought. As it has been observed in this study that the area facing meteorological drought in a particular year was experiencing agricultural drought as well. This shows that they are interdependent and agricultural drought usually occurs after meteorological drought. In this study, drought indicators such as precipitation, soil moisture, land surface temperature and NDVI were utilized for drought assessment. In addition to it, other datasets like snow, ground water, surface runoff and evapotranspiration could help in improving drought monitoring studies in the CKRB. There are less meteorological stations in the study area which limits validation of the results with the in situ drought indices. Moreover, if the observation stations are increased the drought monitoring studies could be enhanced.

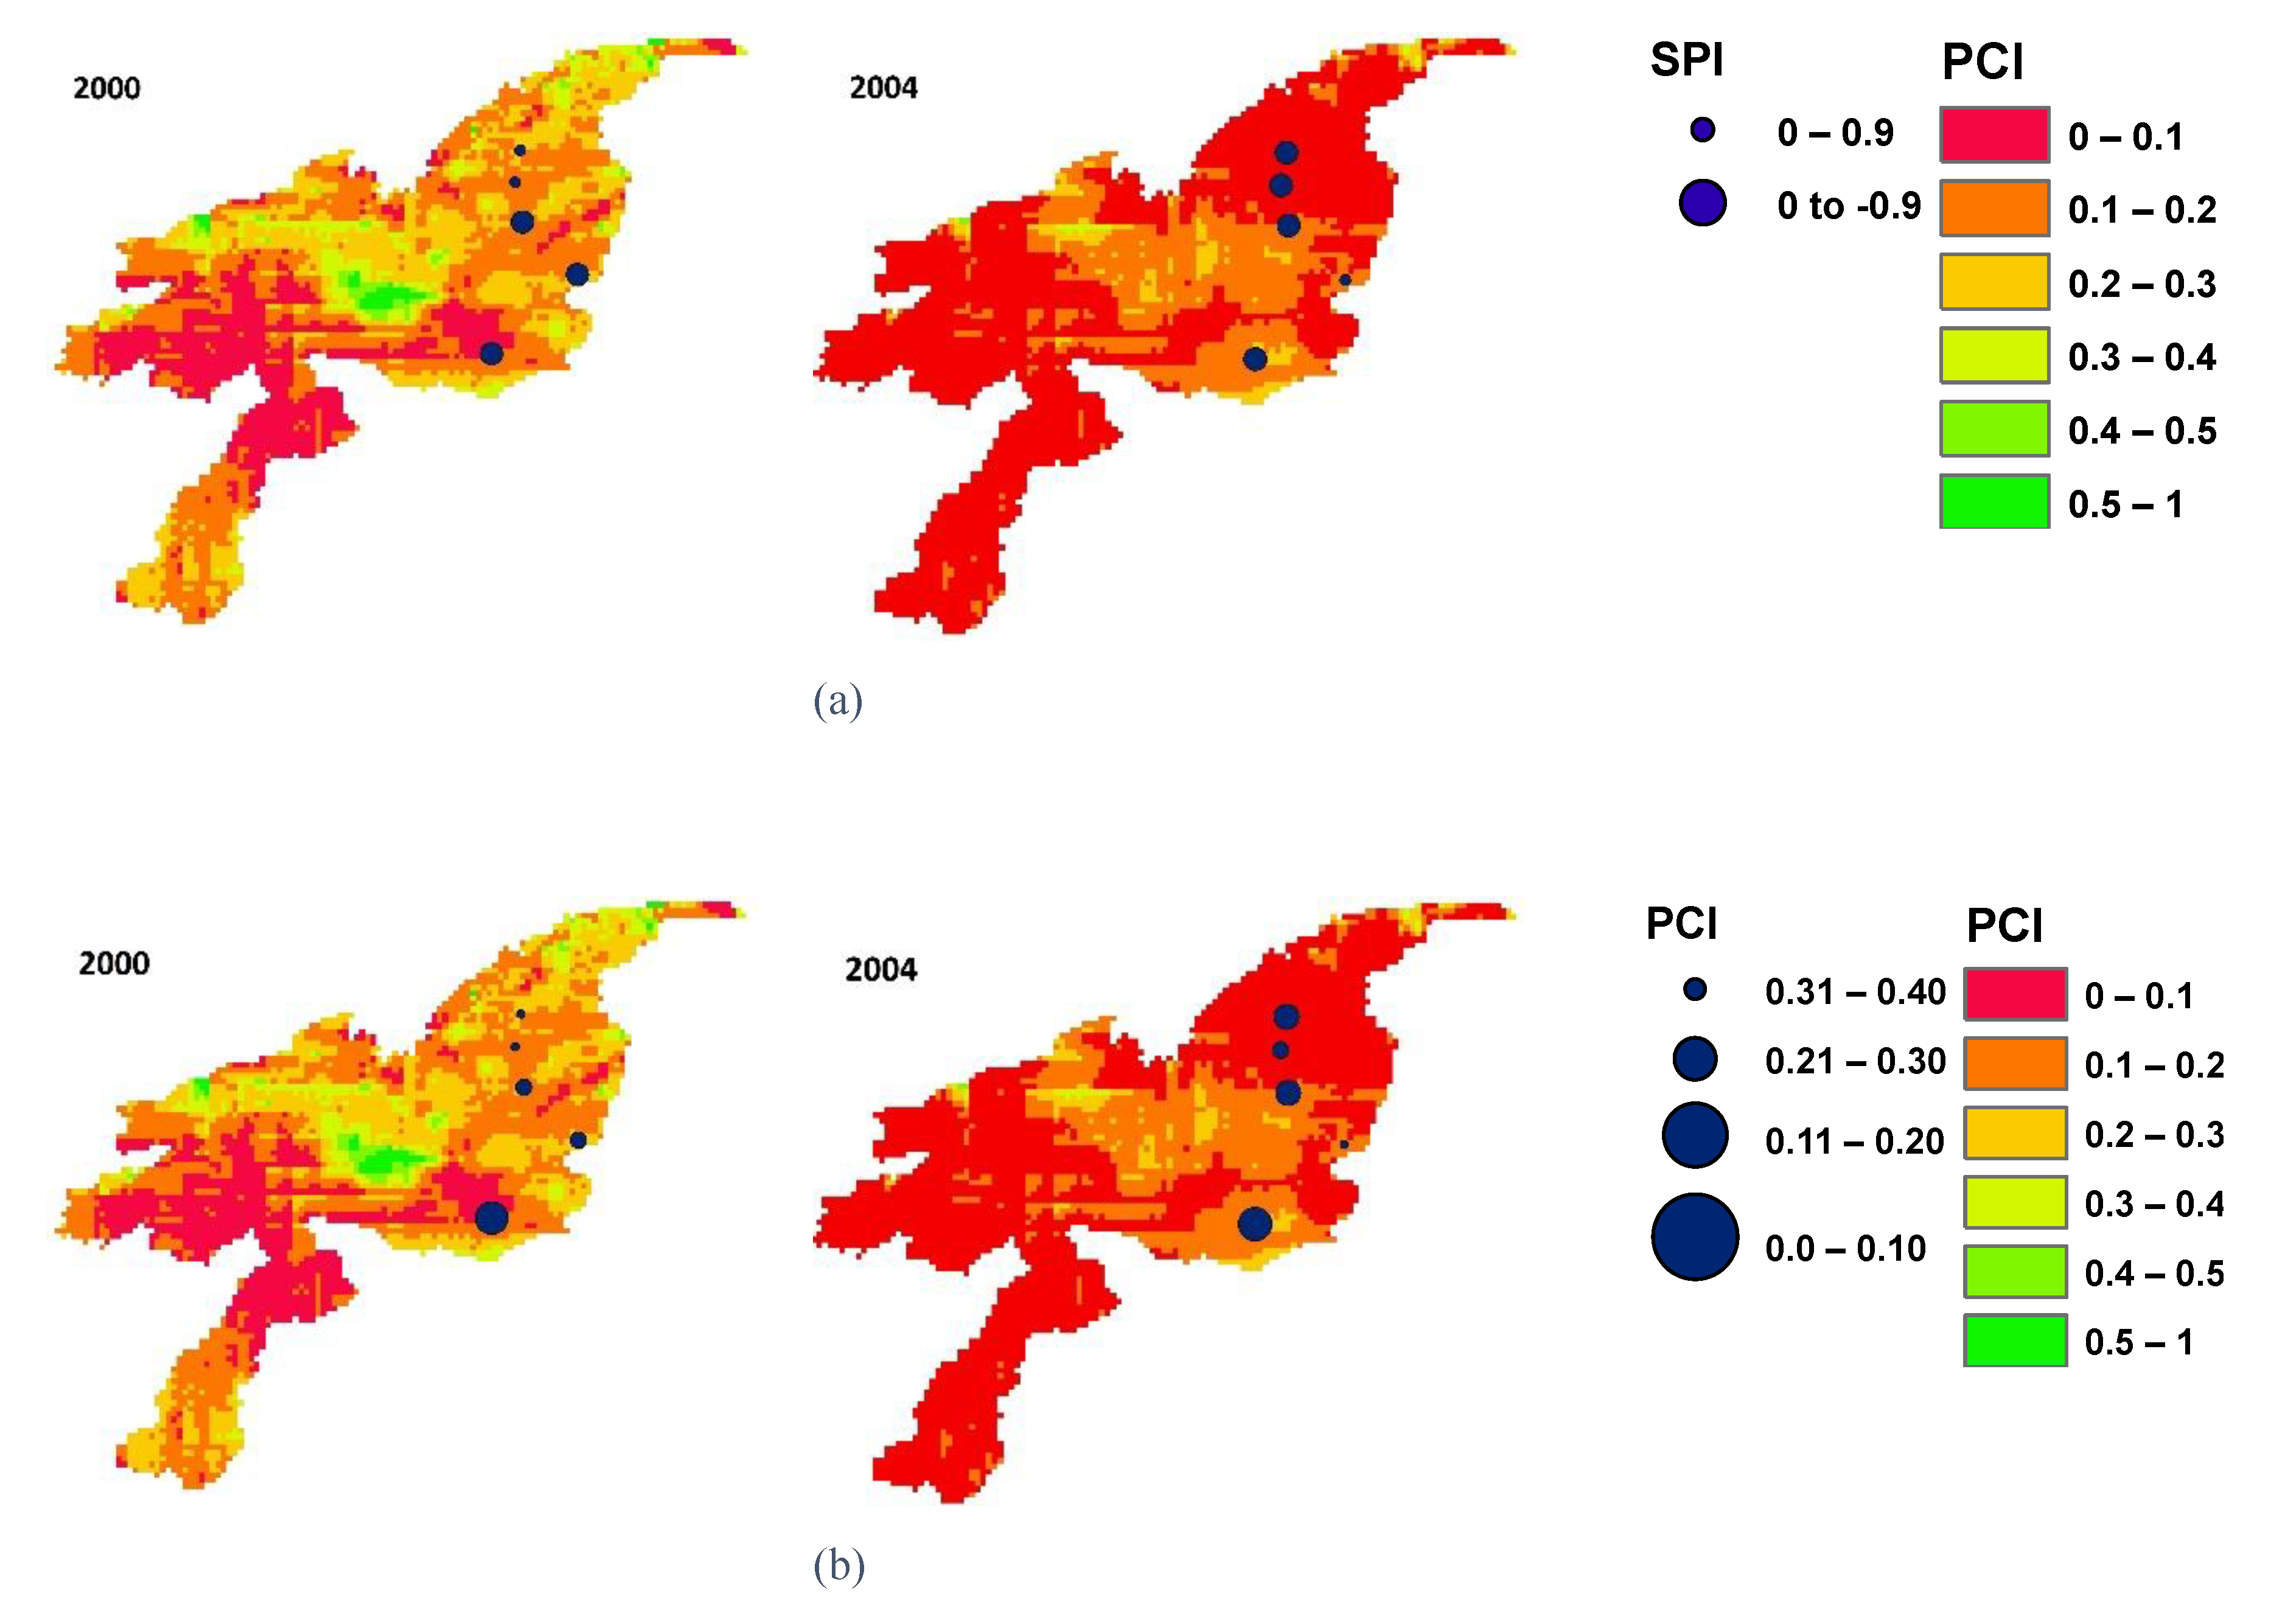
4.3. Comparison of Modeled Derived PCI with SPI-3 and PCI Calculated from Rain Gauge Station Data

Spatial distribution of meteorological drought in 2000 and 2004 which is represented by the PCI values derived from CHIRPS data is presented in Figure 11. Most of the area has low values of PCI, mostly ranging from 0 to 0.3 indicating extreme to moderate drought. SPI-3 calculated from in situ station data shows mild wet to mild drought conditions. PCI calculated from station’s data varies from 0 to 0.3 representing extreme to moderate meteorological drought. Both indices obtained from station’s data have identified the areas under drought and these results are in accordance with results obtained from model derived PCI.

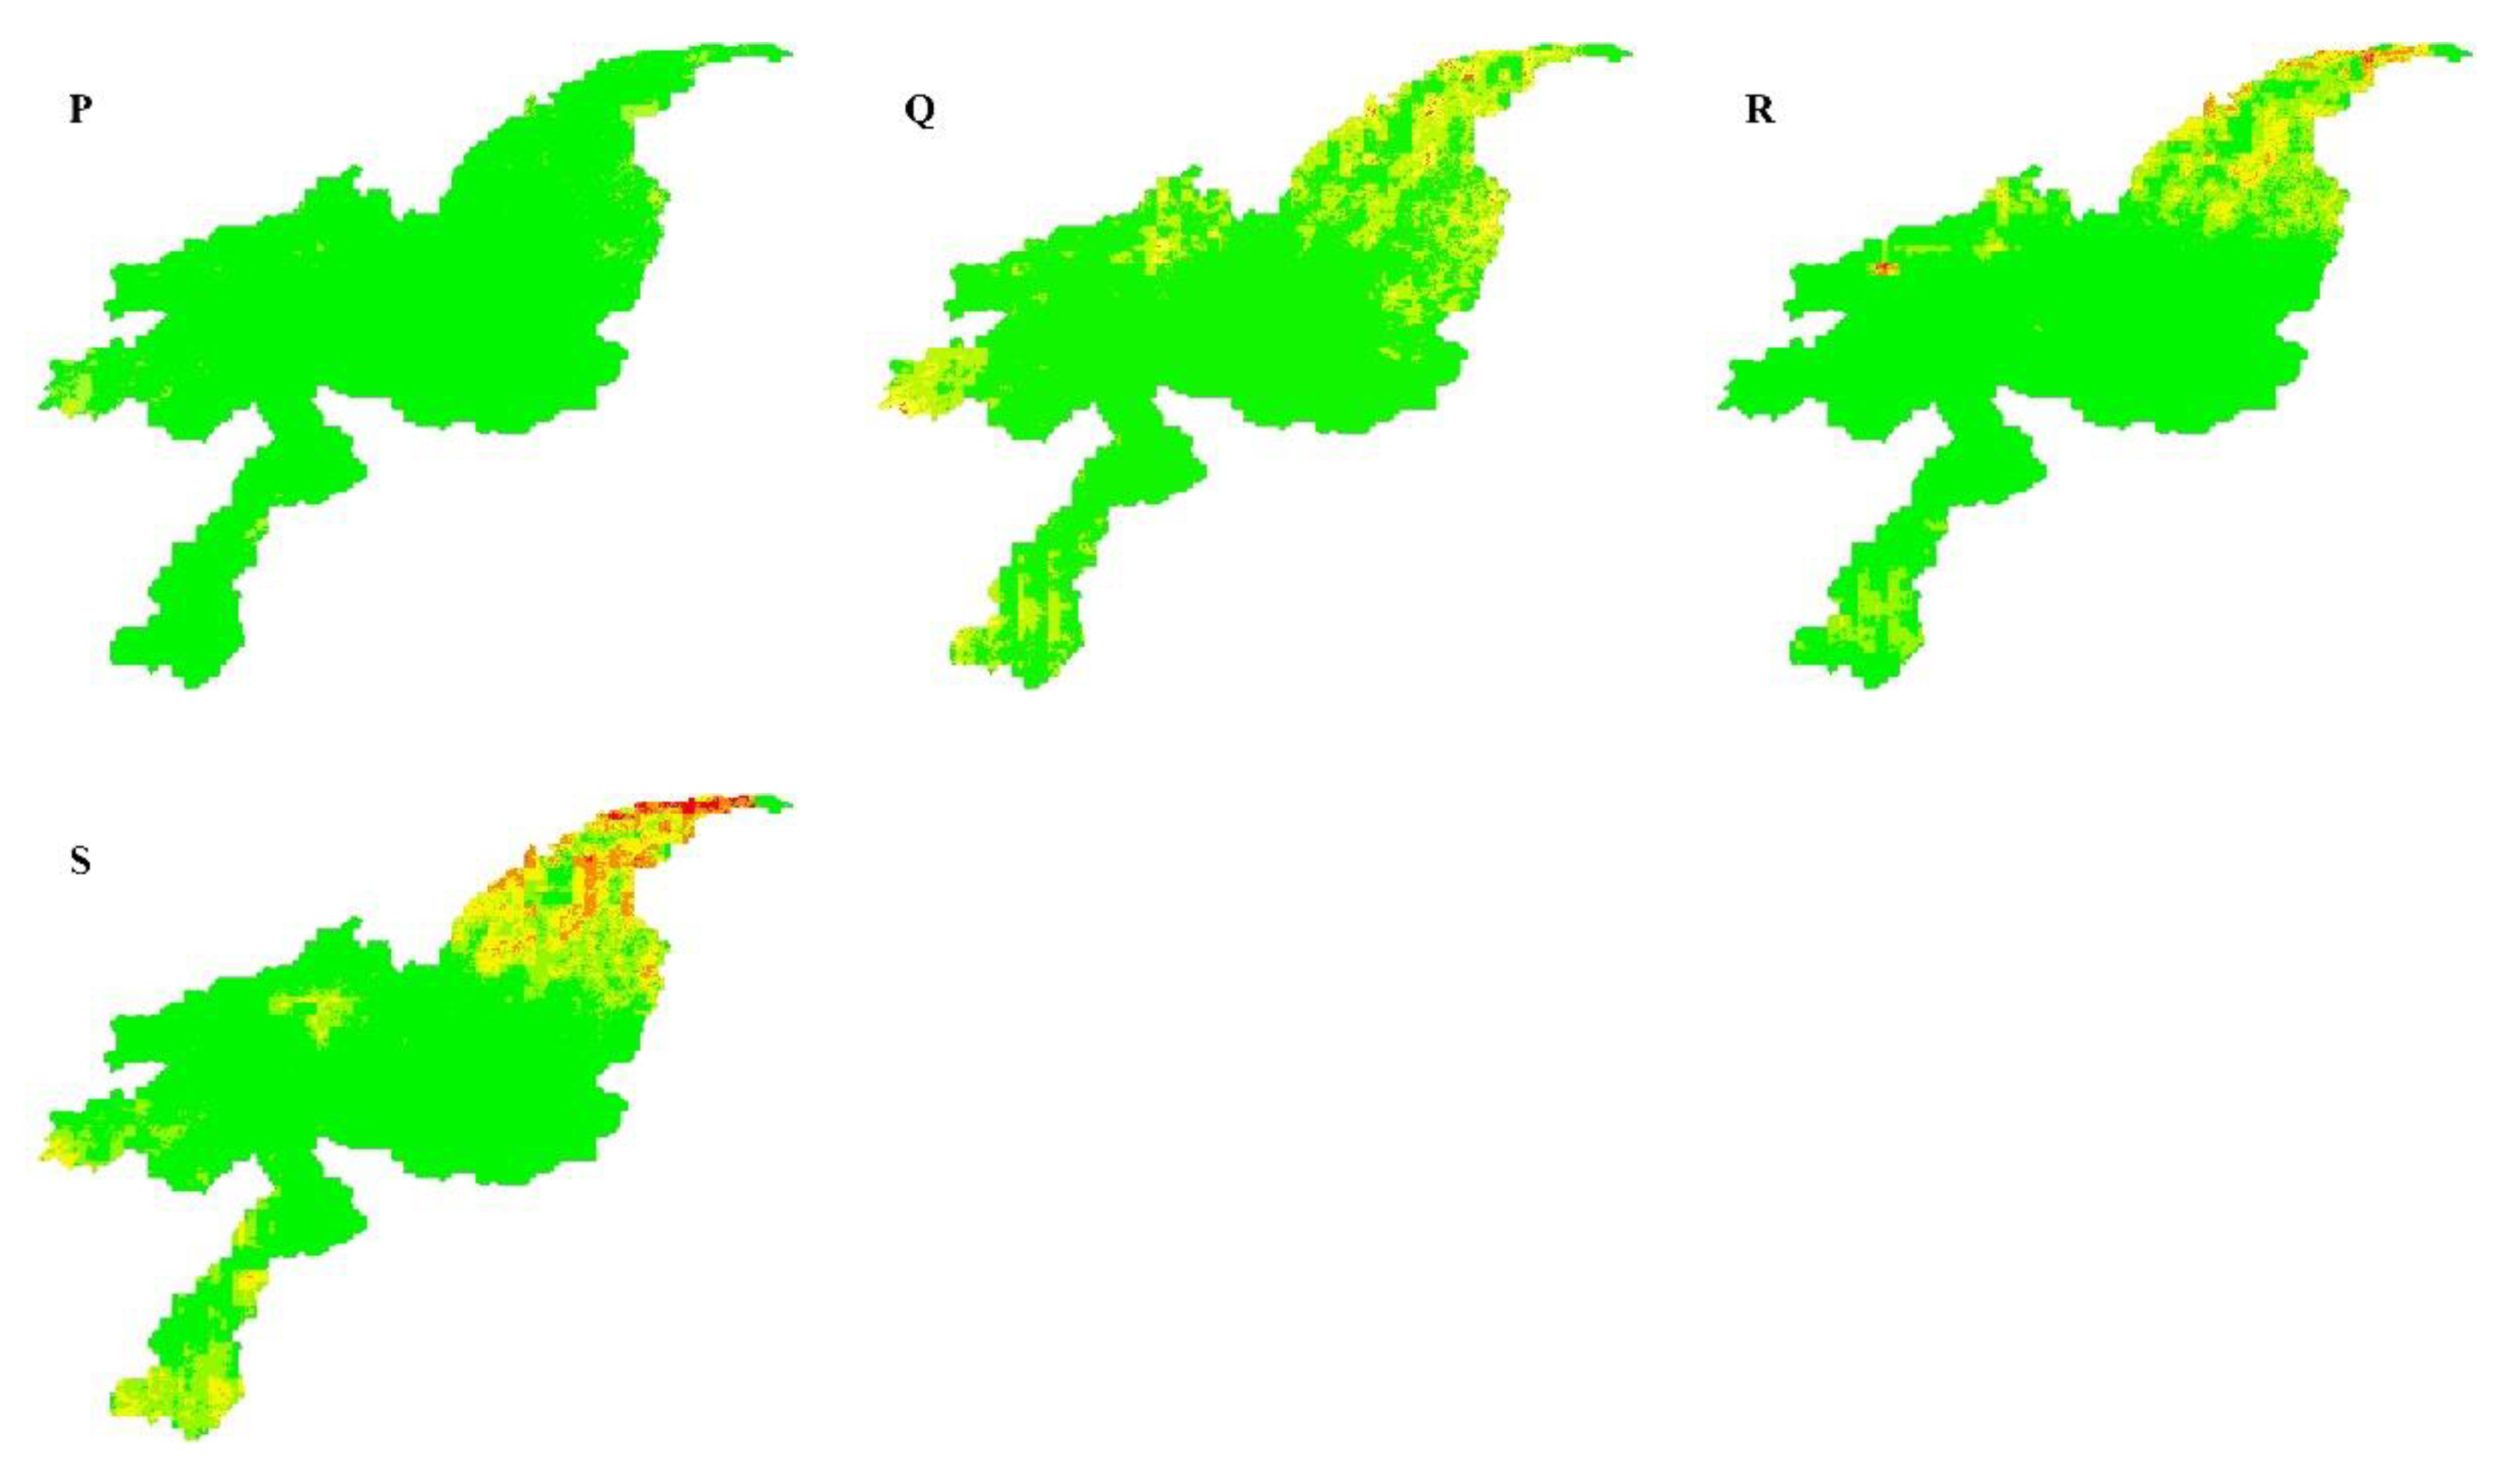
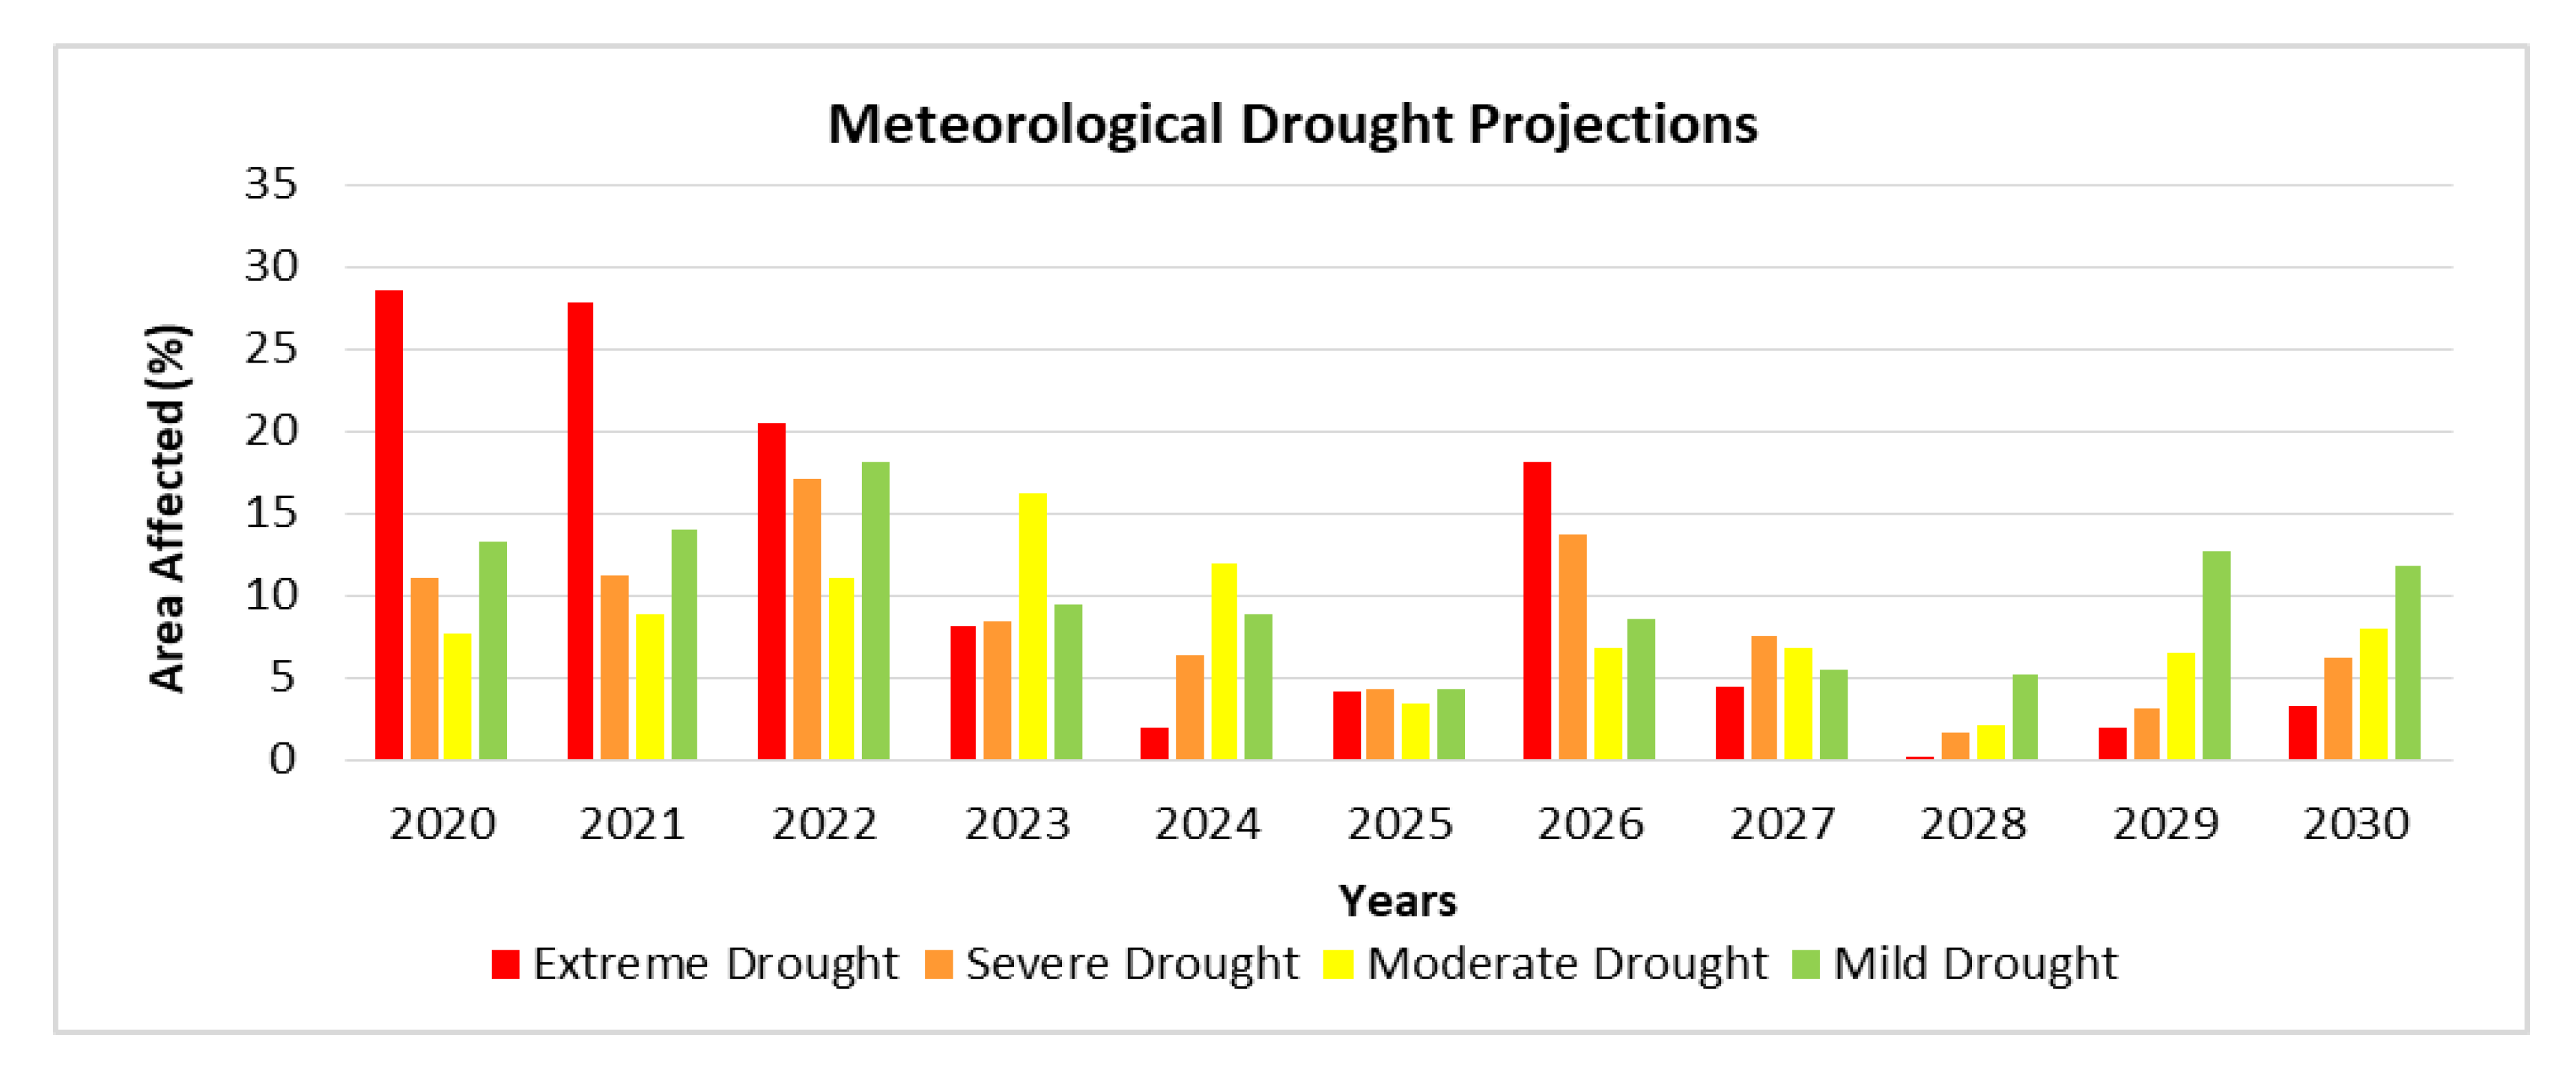
4.4. Future Drought Projections

PCI was calculated from historical precipitation and precipitation projections to investigate the future drought trend from 2020 to 2030. Meteorological drought for the study area was investigated for the monsoon (Jun–Sep) season.
Temporal trend of meteorological drought in monsoon season from 2020 to 2030 has been characterized by the percentage of area affected by each drought class in a specific year as indicated in Figure 12. The results show that area affected by extreme drought is more in 2020 which is 28.62% of the whole area but there is a decreasing trend from 2020 to 2030. Overall the meteorological drought has a decreasing trend up to 2030. This decrease in drought indicates more wide spread and high amount of seasonal precipitation may be occur. Moreover, the monsoonal rainfall may approach this region during this period that would ultimately decrease the temperature and evapotranspiration and this region would be less susceptible towards drought in terms of intensity and area.

5. Conclusions

Drought scenarios for the monsoon season (Jun–Sep) were investigated in the CKRB between 2000 and 2018 and future drought projections were calculated between 2020 and 2030. Results indicated that 2000 and 2004 were the years having lowest values of NMIDI representing extreme agricultural drought but this trend has changed towards 2018. The area of severe and moderate drought class had a declining trend from 2000 to 2018 but mild drought had a slightly rising trend which showed that drought severity had declined towards 2018. The area having no drought was very low in 2000 but as we proceeded to 2018, there was an overall increase in the no drought area and was highest in the year 2010, 2015 and 2017. A comparable trend was observed for the meteorological drought similar to agricultural drought as in the year 2000 peak was observed in the area of extreme drought class which then showed a decreasing trend as we proceeded towards 2018. In the areas of severe, moderate and mild drought from 2000 to 2018, there also a declining trend was observed.
This study concluded that 2000 was the driest year which experienced agricultural as well as meteorological drought in monsoon season followed by 2004. Results showed that there was spatial variation in the agricultural and meteorological drought but temporally a decreasing trend was observed from 2000 to 2018. This trend has persisted in future projections between 2020 and 2030, where the severity of drought is high between 2020 and 2022 but a decreasing trend has since been observed.
This study recommends that by analyzing the water demand in the next decade in the context of past two decades, water sharing mechanism must be documented between the two countries who share the water of this region. It is also necessary that crop water requirement must be kept in mind for sowing crops in irrigated regions. We also recommend that new modified index NMIDI may be used for drought studies by using modeled and optical data regardless of the issues of microwave data availability.

Author Contributions

Conceptualization, M.H.A.B., M.A. (Muhammad Abid) and W.J.; methodology, M.H.A.B. and W.J.; software, M.R.K. and M.A. (Muhammad Amin); validation, M.R.K., S.A. and M.A. (Muhammad Amin); formal analysis, M.R.K., M.H.A.B, W.J. and M.A. (Muhammad Amin); investigation, S.A. and W.J.; resources, M.H.A.B., W.J. and S.A.; data curation, R.K., W.J. and S.A.; writing—original draft preparation, M.R.K.; writing—review and editing, M.H.A.B., M.R.K. and W.J.; visualization, W.J.; supervision, M.H.A.B., W.J. and M.A. (Muhammad Abid); project administration, M.A. (Muhammad Abid) and M.H.A.B.; funding acquisition, M.A. (Muhammad Abid). All authors have read and agreed to the published version of the manuscript.

Funding

This research was funded by Partnerships for Enhanced Engagement in Research (PEER) cycle 5 project, grant number AID-OAA-A-11-00012 titled ‘Satellite enhanced snow-melt flood and drought predictions for the Kabul River basin with surface and groundwater modeling’.

Acknowledgments

Authors acknowledge administrative support from the office of Nazarbayev University Research and Innovation System, Kazakhstan regarding release of funding under the umbrella of Partnerships for Enhanced Engagement in Research (PEER) cycle 5 project Grant Award Number AID-OAA-A-11-00012. Authors are indebted to the administration of Arid Agriculture University to facilitate us during the process of this research. Authors also acknowledge the anonymous reviewers whose valuable suggestions helped us a lot in improving the quality of this paper.

Conflicts of Interest

There is no conflict of interests.

References

  1. Liu, Y.; Wang, X.; Guo, M.; Tani, H.; Matsuoka, N.; Matsumura, S. Spatial and Temporal Relationships among NDVI, Climate Factors, and Land Cover Changes in Northeast Asia from 1982 to 2009. GISci. Remote Sens. 2011, 48, 371–393. [Google Scholar] [CrossRef]
  2. Ahmad, F. Detection of change in vegetation cover using multi-spectral and multi-temporal information for district Sargodha, Pakistan. Soc. Nat. 2012, 24, 557–571. [Google Scholar] [CrossRef] [Green Version]
  3. Jiao, W.; Zhang, L.; Chang, Q.; Fu, D.; Cen, Y.; Tong, Q. Evaluating an Enhanced Vegetation Condition Index (VCI) Based on VIUPD for Drought Monitoring in the Continental United States. Remote Sens. 2016, 8, 224. [Google Scholar] [CrossRef] [Green Version]
  4. Wu, J.; He, B.; Lü, A.; Zhou, L.; Liu, M.; Zhao, L. Quantitative assessment and spatial characteristics analysis of agricultural drought vulnerability in China. Nat. Hazards 2010, 56, 785–801. [Google Scholar] [CrossRef]
  5. Dai, A. Increasing drought under global warming in observations and models. Nat. Clim. Chang. 2012, 3, 52–58. [Google Scholar] [CrossRef]
  6. Zhang, L.; Jiao, W.; Zhang, H.; Huang, C.; Tong, Q. Studying drought phenomena in the Continental United States in 2011 and 2012 using various drought indices. Remote Sens. Environ. 2017, 190, 96–106. [Google Scholar] [CrossRef]
  7. Sawada, Y.; Koike, T. Ecosystem resilience to the Millennium drought in southeast Australia (2001–2009). J. Geophys. Res. Biogeosci. 2016, 121, 2312–2327. [Google Scholar] [CrossRef]
  8. Ahmadi, B.; Ahmadalipour, A.; Moradkhani, H. Hydrological drought persistence and recovery over the CONUS: A multi-stage framework considering water quantity and quality. Water Res. 2019, 150, 97–110. [Google Scholar] [CrossRef]
  9. Parry, S.; Prudhomme, C.; Wilby, R.L.; Wood, P.J. Drought termination. Prog. Phys. Geogr. Earth Environ. 2016, 40, 743–767. [Google Scholar] [CrossRef] [Green Version]
  10. Dracup, J.A.; Lee, K.S.; Paulson, E.G. On the statistical characteristics of drought events. Water Resour. Res. 1980, 16, 289–296. [Google Scholar] [CrossRef]
  11. Egeru, A.; Barasa, B.; Nampijja, J.; Siya, A.; Makooma, M.T.; Majaliwa, M.G.J. Past, Present and Future Climate Trends Under Varied Representative Concentration Pathways for a Sub-Humid Region in Uganda. Climate 2019, 7, 35. [Google Scholar] [CrossRef] [Green Version]
  12. Makokha, G.O.; Wang, L.; Zhou, J.; Li, X.; Wang, A.; Wang, G.; Kuria, D. Quantitative drought monitoring in a typical cold river basin over Tibetan Plateau: An integration of meteorological, agricultural and hydrological droughts. J. Hydrol. 2016, 543, 782–795. [Google Scholar] [CrossRef]
  13. Yan, N.; Wu, B.; Boken, V.K.; Chang, S.; Yang, L. A drought monitoring operational system for China using satellite data: Design and evaluation. Geomat. Nat. Hazards Risk 2014, 7, 264–277. [Google Scholar] [CrossRef]
  14. Ebaid, H.M. Real time drought monitoring using Remote Sensing approaches A Case Study: Western desert of Kharga and Dakhla Regions. Int. J. Geomat. Geosci. 2016, 6, 1638–1652. [Google Scholar]
  15. Himanshu, S.; Singh, G.; Kharola, N. Monitoring of drought using satellite data. Int. Res. J. Earth Sci. 2015, 3, 66–72. [Google Scholar]
  16. Yaduvanshi, A.; Srivastava, P.K.; Pandey, A.C. Integrating TRMM and MODIS satellite with socio-economic vulnerability for monitoring drought risk over a tropical region of India. Phys. Chem. Earth Parts A/B/C 2015, 83–84, 14–27. [Google Scholar] [CrossRef]
  17. Sholihah, R.I.; Trisasongko, B.H.; Shiddiq, D.; La Ode, S.I.; Kusdaryanto, S.; Panuju, D.R. Identification of Agricultural Drought Extent Based on Vegetation Health Indices of Landsat Data: Case of Subang and Karawang, Indonesia. Procedia Environ. Sci. 2016, 33, 14–20. [Google Scholar] [CrossRef] [Green Version]
  18. Cai, G.; Du, M.; Liu, Y. Regional Drought Monitoring and Analyzing Using MODIS Data—A Case Study in Yunnan Province. In Computer and Computing Technologies in Agriculture IV; Springer: Berlin/Heidelberg, Germany, 2011; pp. 243–251. [Google Scholar] [CrossRef] [Green Version]
  19. AghaKouchak, A.; Farahmand, A.; Melton, F.S.; Teixeira, J.; Anderson, M.C.; Wardlow, B.D.; Hain, C.R. Remote sensing of drought: Progress, challenges and opportunities. Rev. Geophys. 2015, 53, 452–480. [Google Scholar] [CrossRef] [Green Version]
  20. McKee, T.B.; Doesken, N.J.; Kleist, J. The relationship of drought frequency and duration to time scales. In Proceedings of the 8th Conference on Applied Climatology, Anaheim, CA, USA, 17–22 January 1993; pp. 179–183. [Google Scholar]
  21. Xu, X.; Xie, F.; Zhou, X. Research on spatial and temporal characteristics of drought based on GIS using Remote Sensing Big Data. Clust. Comput. 2016, 19, 757–767. [Google Scholar] [CrossRef]
  22. Kogan, F.N. Application of vegetation index and brightness temperature for drought detection. Adv. Space Res. 1995, 15, 91–100. [Google Scholar] [CrossRef]
  23. Dutta, D.; Kundu, A.; Patel, N.R.; Saha, S.K.; Siddiqui, A.R. Assessment of agricultural drought in Rajasthan (India) using remote sensing derived Vegetation Condition Index (VCI) and Standardized Precipitation Index (SPI). Egypt. J. Remote Sens. Space Sci. 2015, 18, 53–63. [Google Scholar] [CrossRef] [Green Version]
  24. Zhang, J.; Mu, Q.; Huang, J. Assessing the remotely sensed Drought Severity Index for agricultural drought monitoring and impact analysis in North China. Ecol. Indic. 2016, 63, 296–309. [Google Scholar] [CrossRef]
  25. Kogan, F.N. Global Drought Watch from Space. Bull. Am. Meteorol. Soc. 1997, 78, 621–636. [Google Scholar] [CrossRef]
  26. Zhang, A.; Jia, G. Monitoring meteorological drought in semiarid regions using multi-sensor microwave remote sensing data. Remote Sens. Environ. 2013, 134, 12–23. [Google Scholar] [CrossRef]
  27. Jiao, W.; Wang, L.; Novick, K.A.; Chang, Q. A new station-enabled multi-sensor integrated index for drought monitoring. J. Hydrol. 2019, 574, 169–180. [Google Scholar] [CrossRef]
  28. Jiao, W.; Tian, C.; Chang, Q.; Novick, K.A.; Wang, L. A new multi-sensor integrated index for drought monitoring. Agric. For. Meteorol. 2019, 268, 74–85. [Google Scholar] [CrossRef] [Green Version]
  29. Rhee, J.; Im, J.; Carbone, G.J. Monitoring agricultural drought for arid and humid regions using multi-sensor remote sensing data. Remote Sens. Environ. 2010, 114, 2875–2887. [Google Scholar] [CrossRef]
  30. Chandrasekar, K.; Sneha, L.; Ramana, K.V.; Rao, P.V.N. Monitoring of Agricultural Drought using Satellite based Drought Severity Index over Andhra Pradesh State of India. Int. J. Adv. Remote Sens. GIS 2017, 6, 2343–2359. [Google Scholar] [CrossRef]
  31. Törnros, T.; Menzel, L. Addressing drought conditions under current and future climates in the Jordan River region. Hydrol. Earth Syst. Sci. 2014, 18, 305–318. [Google Scholar] [CrossRef] [Green Version]
  32. Kamali, B.; Houshmand Kouchi, D.; Yang, H.; Abbaspour, K. Multilevel Drought Hazard Assessment under Climate Change Scenarios in Semi-Arid Regions—A Case Study of the Karkheh River Basin in Iran. Water 2017, 9, 241. [Google Scholar] [CrossRef]
  33. Yıldız, D. Afghanistan’s Transboundary Rivers and Regional Security. World Sci. News 2015, 16, 40–52. [Google Scholar]
  34. King, M.; Sturtewagen, B. Making the Most of Afghanistan’s River Basins: Opportunities for Regional Cooperation; EastWest Institute: New York, NY, USA, 2010. [Google Scholar]
  35. Atef, S.S.; Sadeqinazhad, F.; Farjaad, F.; Amatya, D.M. Water conflict management and cooperation between Afghanistan and Pakistan. J. Hydrol. 2019, 570, 875–892. [Google Scholar] [CrossRef]
  36. Wi, S. Interactive comment on “Calibration approaches for distributed hydrologic models using high performance computing: Implication for streamflow projections under climate change” by S. Wi et al. Hydrol. Earth Syst. Sci. Discuss. 2015, 11, C5911–C5931. [Google Scholar]
  37. Akhtar, F.; Awan, U.K.; Tischbein, B.; Liaqat, U.W. Assessment of Irrigation Performance in Large River Basins under Data Scarce Environment—A Case of Kabul River Basin, Afghanistan. Remote Sens. 2018, 10, 972. [Google Scholar] [CrossRef] [Green Version]
  38. Kakakhel, S. Afghanistan-Pakistan Treaty on the Kabul River Basin? Available online: https://www.thethirdpole.net/en/2017/03/02/afghanistan-pakistan-treaty-on-the-kabul-river-basin/ (accessed on 9 April 2020).
  39. Sidiqi, M.; Shrestha, S.; Ninsawat, S. Projection of Climate Change Scenarios in the Kabul River Basin, Afghanistan. Curr. Sci. India 2018, 114, 1304. [Google Scholar] [CrossRef]
  40. Dey, B.; Sharma, V.K.; Rango, A. A Test of Snowmelt-Runoff Model for a Major River Basin in Western Himalayas. Hydrol. Res. 1989, 20, 167–178. [Google Scholar] [CrossRef]
  41. Lashkaripour, G.R.; Hussaini, S.A. Water resource management in Kabul river basin, eastern Afghanistan. Environmentalist 2007, 28, 253–260. [Google Scholar] [CrossRef]
  42. Bokhari, S.A.A.; Ahmad, B.; Ali, J.; Ahmad, S.; Mushtaq, H.; Rasul, G. Future Climate Change Projections of the Kabul River Basin Using a Multi-model Ensemble of High-Resolution Statistically Downscaled Data. Earth Syst. Environ. 2018, 2, 477–497. [Google Scholar] [CrossRef]
  43. Du, L.; Tian, Q.; Yu, T.; Meng, Q.; Jancso, T.; Udvardy, P.; Huang, Y. A comprehensive drought monitoring method integrating MODIS and TRMM data. Int. J. Appl. Earth Obs. 2013, 23, 245–253. [Google Scholar] [CrossRef]
  44. Hao, C.; Zhang, J.; Yao, F. Combination of multi-sensor remote sensing data for drought monitoring over Southwest China. Int. J. Appl. Earth Obs. 2015, 35, 270–283. [Google Scholar] [CrossRef]
  45. Naz, F.; Dars, G.H.; Ansari, K.; Jamro, S.; Krakauer, N.Y. Krakauer. Drought Trends in Balochistan. Water 2020, 12, 470. [Google Scholar] [CrossRef] [Green Version]
Figure 1. Geographical location of our study area (Chitral Kabul River Basin (CKRB)).
Remotesensing 12 01417 g001
Figure 2. Flow chart diagram of methodology used in this research. Data used had different resolutions and for generating final results, all data was resampled to 1000 m resolution. Two sets of drought indices were used to understand the climatic impact in from of meteorological drought while impact on agriculture was investigated in form of agricultural drought.
Remotesensing 12 01417 g002
Figure 3. (a) Correlation of Pakistan Meteorological Department (PMD) and Climate Hazards Group Infra-Red Precipitation with Station (CHIRPS); (b) slope of mean seasonal precipitation from PMD and CHIRPS where on the y axis is precipitation (mm) while the x axis is the number of correlated points from 2000 to 2016.
Remotesensing 12 01417 g003
Figure 4. (a) Correlation of PMD and National Aeronautics and Space Administration (NASA) Earth Exchange Global Daily Downscaled Projections (NEX-GDDP); (b) slope of mean seasonal precipitation from PMD and NEX-GDDP CHIRPS where on the y axis is precipitation (mm) while the x axis is the number of correlated points from 2000 to 2016.
Remotesensing 12 01417 g004
Figure 5. Meteorological drought in CKRB for the year 2000 (A), 2001 (B), 2002 (C), 2003 (D), 2004 (E), 2005 (F), 2006 (G), 2007 (H) 2008 (I), 2009 (J), 2010 (K), 2011 (L), 2012 (M), 2013 (N) and 2014 (O).
Remotesensing 12 01417 g005
Figure 6. Meteorological drought in CKRB for the year 2015 (P), 2016 (Q), 2017 (R) and 2018. (S).
Remotesensing 12 01417 g006
Figure 7. Temporal trend of meteorological drought in monsoon season from 2000 to 2018 (Jun–Sep).
Remotesensing 12 01417 g007
Figure 8. Agricultural drought in CKRB for the year 2000 (A), 2001 (B), 2002 (C), 2003 (D), 2004 (E), 2005 (F), 2006 (G), 2007 (H) 2008 (I), 2009 (J), 2010 (K), 2011 (L), 2012 (M), 2013 (N) and 2014 (O).
Remotesensing 12 01417 g008aRemotesensing 12 01417 g008b
Figure 9. Agricultural drought in CKRB for the year 2015 (P), 2016 (Q), 2017 (R) and 2018 (S).
Remotesensing 12 01417 g009
Figure 10. Temporal trend of meteorological drought in monsoon season from 2000 to 2018.
Remotesensing 12 01417 g010
Figure 11. Spatial distribution of drought monitored by modeled derived PCI in drought years with validation by (a) SPI-3 (upper row) and (b) PCI (lower row) derived from the station data.
Remotesensing 12 01417 g011
Figure 12. Temporal trend of meteorological drought from 2020 to 2030 over CKRB.
Remotesensing 12 01417 g012
Table 1. Remote sensing data.
S. No.DataSourceData UtilityS.RFile Format
1Climate Hazards Group Infra-Red Precipitation with Station data (CHIRPS)http://chg.geog.ucsb.edu/data/chirps/Precipitation Condition Index (PCI)0.05°Geo tiff
2MODIS Land Surface Temperature (LST), (MOD11A2)MODIS packages in R Console.Temperature Condition Index (TCI)1 kmGeo tiff
3Normalized Difference Vegetation Index (MOD13Q1)MODIS packages inn R Console.Vegetation Condition Index (VCI)250 mGeo tiff
4Monthly Soil moisture
(in soil layer depth of 0–10 cm, 10–40 cm and 40–100 cm)
FLDAS_NOAH01_C_GL_M
https://disc.gsfc.nasa.gov/datasets/FLDAS_NOAH01_C_GL_M_V001/summary?keywords=FLDAS
Soil Moisture Condition Index (SMCI)1° × 1°NC file
5Precipitation Projections(NASA) Earth Exchange Global Daily Downscaled Projections (NEX-GDDP) https://cds.nccs.nasa.gov/nex-gddp/.Precipitation Condition Index (PCI)0.25°NC file
Table 2. Equations of all indices used in this study.
Drought IndexFormulaSource
Vegetation Condition Index (VCI) ( NDVI j NDVI min ) ( NDVI max NDVI min ) (Kogan, 1995) [22]
Temperature Condition Index (TCI) ( LST max LST j ) ( LST max LST min ) (Du et al., 2013) [43]
Soil Moisture Condition Index (SMCI) ( SM j SM min ) ( SM max SM min ) (Hao et al., 2015) [44]
Precipitation Condition Index (PCI) ( P j P min ) ( P max P min ) (Jiao et al., 2019) [27]
Scaled Drought Condition Index (SDCI) α TCI + β PCI + ( 1 α β ) VCI (Rhee et al., 2010) [29]
Microwave Integrated Drought Index (MIDI) α PCI + β SMCI + ( 1 α β ) TCI (Zhang and Jia, 2013) [26]
Non-Microwave Integrated Drought Index (NMIDI) α PCI + β SMCI + ( 1 α β ) TCI (Baig et al., this paper)

