Article

Analysis of the Recent Agricultural Situation of Dakhla Oasis, Egypt, Using Meteorological and Satellite Data

1
Arid Land Research Center, Tottori University, Tottori 680-0001, Japan
2
Faculty of Foreign Studies, Sophia University, Tokyo 102-8554, Japan
3
Faculty of Horticulture, Chiba University, Matsudo 271-8510, Japan
*
Author to whom correspondence should be addressed.
Remote Sens. 2020, 12(8), 1264; https://doi.org/10.3390/rs12081264
Submission received: 17 March 2020 / Revised: 8 April 2020 / Accepted: 15 April 2020 / Published: 16 April 2020

Abstract

:
Dakhla Oasis is the most highly populated oasis in Egypt. Although the groundwater resource is very large, there is essentially no rainfall and the aquifer from which the water is drawn is not recharged. Therefore, for the future development and sustainability of Dakhla Oasis, it is important to understand how land and water are used in the oasis and meteorological conditions there. In this study, meteorological and satellite data were used to examine the recent agricultural situation and water use. The results showed that the meteorological conditions are suitable for plant production, and the maximum vegetation index value was comparable to the Nile delta. The cultivated area increased between 2001 and 2019 by 13.8 km2 year−1, with most of the increase occurring after the 2011 revolution (21.2 km2 year−1). People living in Dakhla Oasis derive their income primarily from agricultural activity, which requires abundant water. Thus, the increasing demand for water is likely to put pressure on the groundwater resource and limit its sustainability.

1. Introduction

Agriculture in Egypt depends mainly on water from the Nile River. Thus, the Nile River delta and valley areas are intensively cultivated [1,2]. However, since the 1990s, the Egyptian government has embarked on various national settlement and agricultural development projects in the western Egyptian desert, such as the Toshka, East Oweinat, and ongoing 1.5 Million Feddan projects since 2015, inaugurated by President Sisi in preparation for expected future population growth [3,4].
In the western desert, there are a number of oases that depend on fossil water (artesian groundwater). As a response to overpopulation in the delta, including in the Egyptian capital of Cairo, and along the Nile River, the New Valley Project was initiated in 1959 by the Egyptian government to exploit abundant fossil water resources and encourage emigration from overpopulated areas [1]. Unfortunately, accurate evaluation of the performance of the New Valley Project is difficult, because precise data since the 2011 revolution from this and the Toshka and East Oweinat projects have been lacking. However, failures in water management (over-irrigation and salinization, in particular) have reportedly resulted in the abandonment of many reclaimed lands [1].
Dakhla is the biggest oasis in the western Egyptian desert; in 2010, Dakhla Oasis supported about 82,000 inhabitants living in 17 different settlements [5]. Groundwater is the only water resource for all activities in this oasis, including agriculture. Although the potential of this water resource is very large [5], future agricultural development of the Dakhla Oasis depends on the sustainability of the fossil water resource, which is strongly related to the agricultural system and the amount of water used for irrigation. Additionally, there is concern that the East Oweinat and 1.5 Million Feddan projects have drawn excessive amounts of fossil water from the aquifer. Therefore, it is important to understand current land, water use, and meteorological conditions in Dakhla Oasis to ensure the future sustainability of agricultural activities there.
Although the geology of the oasis has been well studied (e.g., [5,6,7,8]), less is known about the agricultural situation and water use in the oasis [1,9]. In this study, the agricultural situation of Dakhla Oasis, including yearly changes since 2000 in the cultivated land area, is examined by using meteorological and satellite data and by conducting interviews with farmers, and the implications for the future sustainable development of the oasis are discussed.

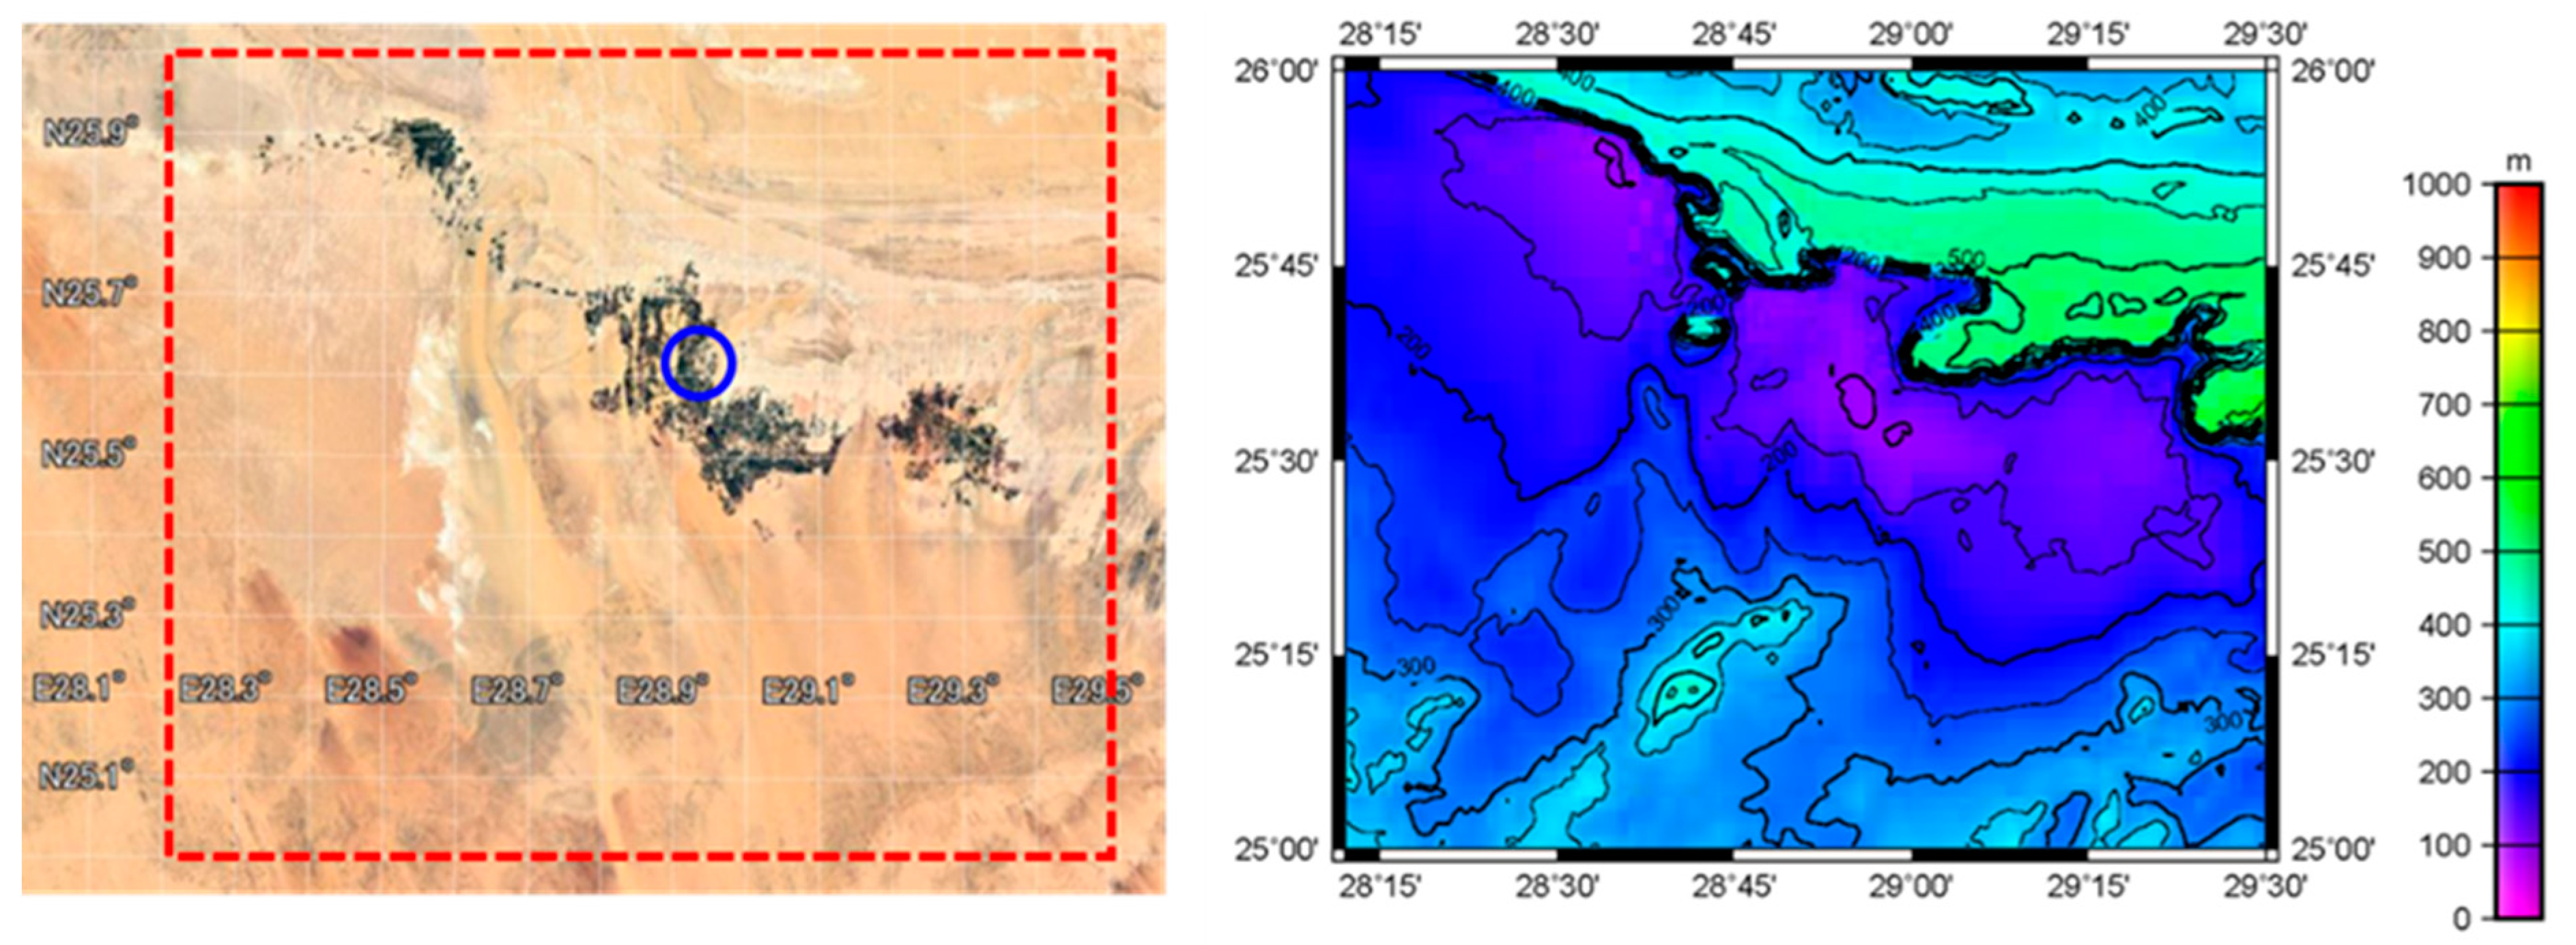
2. Overview of the Western Desert and Dakhla Oasis

The normalized difference vegetation index (NDVI), based on data acquired by a Moderate Resolution Imaging Spectroradiometer (MODIS), shows that vegetation coverage in Egypt is high only along the valley of the Nile River and in the Nile delta area; little vegetation grows far from the Nile River (Figure 1). However, in the desert west of the Nile River (called the western desert) (Figure A1), there are five oases, namely the Kharga, Dakhla, Farafra, Bahareya, and Siwa oases, where spring water is available and which have been cultivated since time immemorial by people following traditional lifestyles. The groundwater that supports these oases is fossil water from the Nubian Sandstone Aquifer System, which was last restored during the wet period from 4000 to 8000 years BP (e.g., [7,10]).
In 1959, the Egyptian government initiated the New Valley Project, an ambitious plan to create a second valley (in addition to the Nile valley) in the western desert that would be able to absorb surplus population from along the Nile River. This project covered a vast area and included the Kharga, Dakhla, and Farafra oases [1]. In addition, in the 1990s, the Egyptian government started two more settlement and agricultural development projects in the western desert, the Toshka and East Oweinat projects, to absorb future population growth (Figure 1). The Toshka project included the construction of a canal to carry irrigation water from Lake Nasser through the Kharga depression to Farafra Oasis, and the East Oweinat project enlarged the land area available for agriculture in the southern part of the western desert by developing water resources from the Nubian Sandstone Aquifer [3]. An ongoing land reclamation project in the western desert is the 1.5 Million Feddan Project, which aims to increase the agricultural land by converting desert lands to agricultural lands. Its goal is to reduce the food gap and increase the populated area through the creation of new urban communities [4]. However, the excessive drawdown of groundwater by such a large-scale project is expected to lower the groundwater table around the five oases, which also utilize water from the Nubian Sandstone Aquifer System [3].
Dakhla Oasis is located 190 km west of Kharga Oasis (Figure 1). Because the land of the oasis is highly fertile and rich in water, Dakhla supports a higher population than Kharga Oasis. The Dakhla depression extends 155 km in the east–west direction, and it ranges in elevation from 0 to 100 m above sea level. The area suitable for agriculture is 155 km long and 60 km wide (Figure 2). According to the aridity index of the United Nations Environment Programme [11], the region around the oasis is hyper-arid, because the annual rainfall is around 0 mm [12].

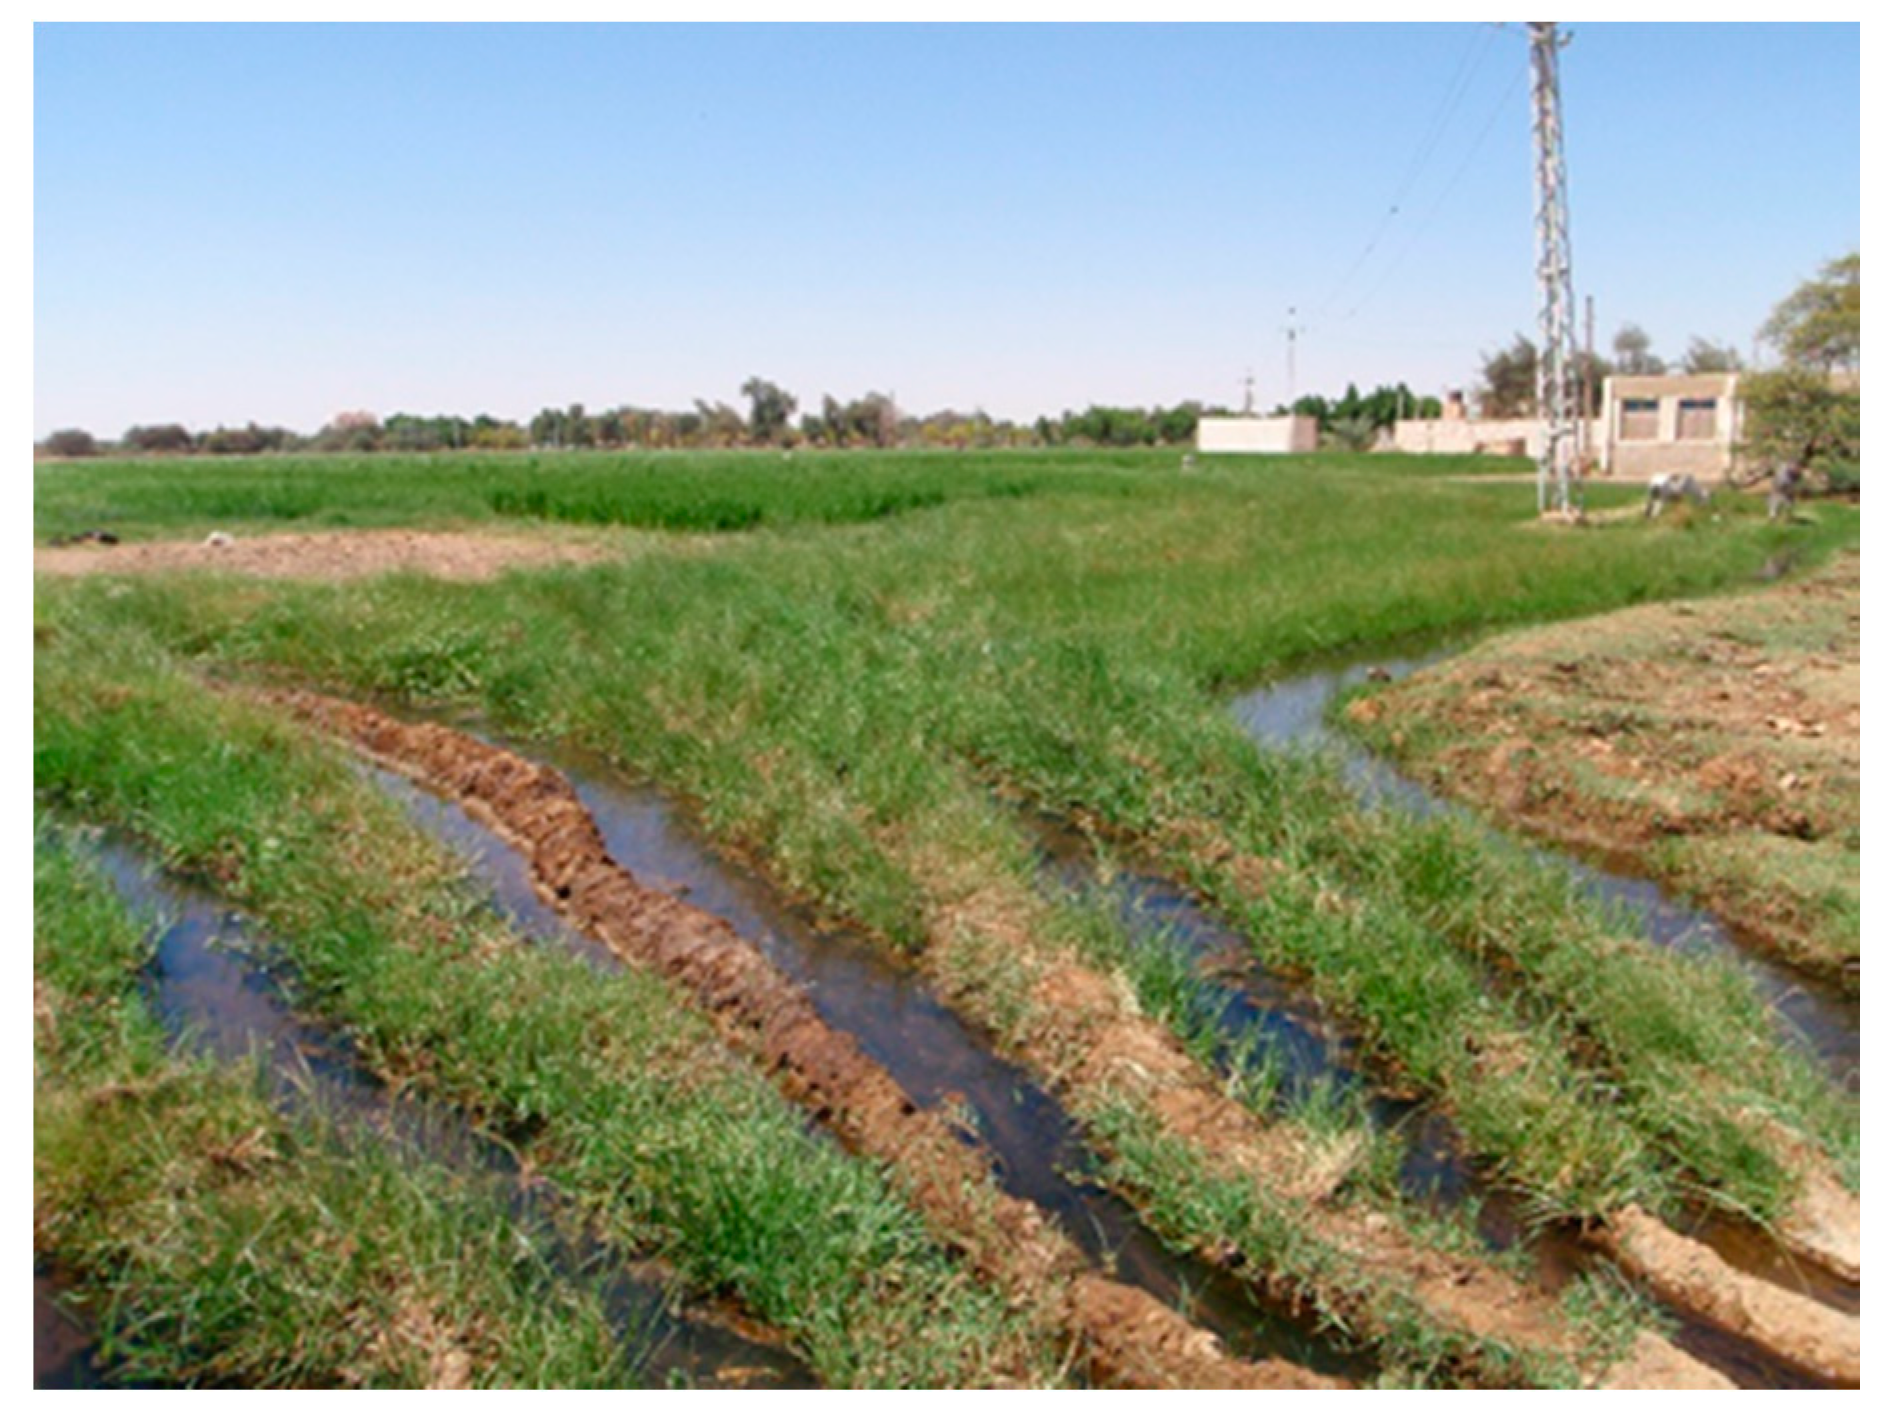
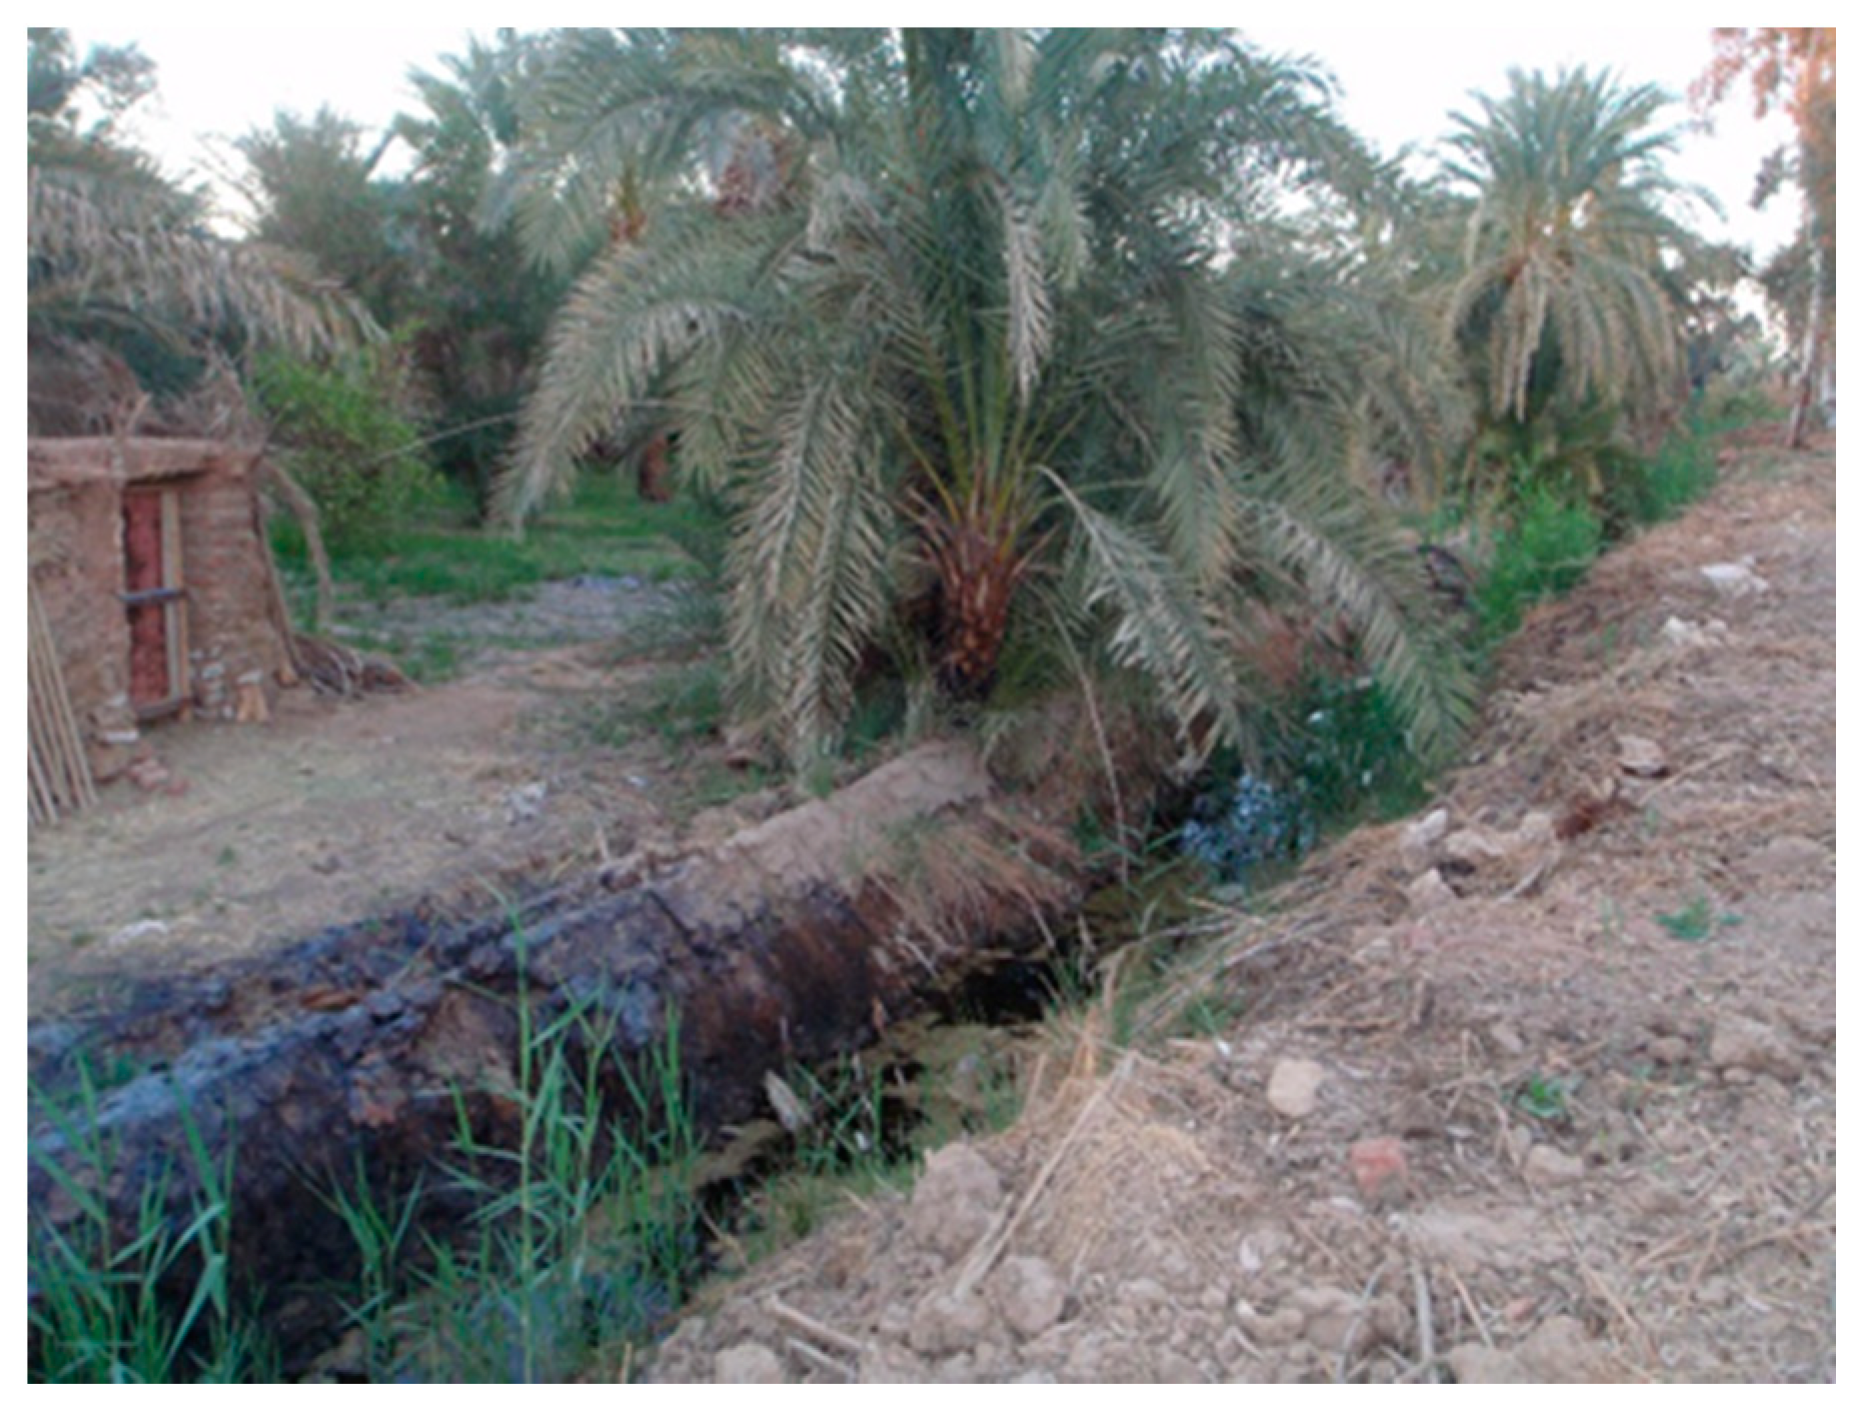
3. Irrigation and Cultivation in Dakhla Oasis

In Dakhla Oasis, wells are used to extract the groundwater. For example, in Rashda Village (Figure 2), there are an estimated 70 wells and springs (see [1] for details). Government wells are owned and managed by the Egyptian Ministry of Irrigation (Figure A2). They are generally 1200 m deep and designed to last 50 years [1]. There are 12 government wells in Rashda. Artesian wells, which are dug in the traditional way, are owned and managed collectively by local cultivators and are referred to here as local wells. Their depth is usually 85 m or less, and they are expected to last about 20 years [1]. There are 29 local wells in Rashda. The groundwater has low salinity but contains high concentrations of iron [5].
Irrigation water from wells is distributed to parcels of cultivated land via main and branch canals. Each government and local well district manages irrigation according to the basin irrigation system. Interviews with farmers in Rashda Village indicated that in a government well district, 22 m3 of water is distributed to each feddan (1 feddan = 0.42 ha) once every 12 days from October to April, and 40 m3 of water is distributed to each feddan once every 12 days from May to September. In contrast, in a local well district, 30 m3 of water is distributed to each feddan once every 10 days throughout the year [1].
The most commonly grown crops in government well districts are wheat or clover hay (berseem) in winter and rice in summer, under the following rotation [9]: wheat (winter) → rice (summer) → clover hay (winter) → fallow (summer) (Figure A3 and Figure A4). Water management practices, the crop types grown, and crop rotation are all decided by the Egyptian Department of Agriculture in government well districts. However, Department of Agriculture rules are not strictly applied in areas irrigated by local wells [9].

4. Data and Analysis Methods

4.1. Meteorological and Soil Data and Analyses

The climate of Dakhla Oasis during 2007–2016 was examined by using Surface Synoptic Observations (SYNOP) meteorological data collected at Dakhla meteorological station (25.5°N, 28.967°E; elevation, 117 m above sea level). To examine the effect of global warming, the annual average temperature change during the 29 years from 1988 to 2016 was also analyzed using data downloaded from the U.S. National Climatic Data Center (now the National Center for Environmental Information [13]). Because solar radiation data are not collected at Dakhla meteorological station, data collected during 2008–2010 at the Kharga Oasis meteorological station (25.45°N, 30.533°E; elevation, 73 m above sea level) were used. However, the proportion of missing data is high, and no solar radiation observations have been made since 2011.
The daily potential evapotranspiration, (ETp) (mm day−1) was calculated as follows [14]:
ETp = 0.408 Δ ( R n G ) + γ ( 900 T ) U ( e s e a ) Δ + γ ( 1 + 0.34 U )
where Δ is the slope of the water vapor pressure curve (kPa °C−1), Rn is the daily net radiation (MJ m−2 day−1), G is the daily soil heat flux (MJ m−2 day−1), γ is the psychrometric constant (kPa °C−1), T is air temperature (°C), U is the wind speed (m s−1) at 2 m above ground level, es is the saturation vapor pressure (kPa), and ea is the actual vapor pressure (kPa). The daily reference evapotranspiration (ET) (mm day−1) was estimated by multiplying the ETp by the crop coefficient for the respective crop types defined in [14].
The particle size distribution of soil samples collected from farmland in Rashda Village was analyzed by using differential scattering, obtained by laser beam diffraction (Microtrac MT3300EX, PSA, Tokyo, Japan). A soil bulk density of 100 mL soil samples was determined by the oven-dried method. Specific gravity was measured by the pycnometer method. Porosity was calculated from the observed soil bulk density and the specific gravity.

4.2. Analysis of the Cultivated Area of Dakhla Oasis Using Satellite Data from 2001 to 2019

The MODIS NDVI data were used to detect cultivated areas (km2) in Dakhla Oasis (MOD13Q1 NDVI product: MODIS/Terra vegetation indices, 16-day L3 global 250 m SIN grid, downloaded from Earth Explorer [15]). An NDVI threshold value of 0.3 was used; this value was determined by the authors in El-Gammal et al. [16], who studied the NDVI threshold classification for detecting healthy plant growth in Egypt.
The analysis area (about 100 km × 100 km) is shown in Figure 2 (25–26°N, 28.2–29.5°E). The area used for agriculture within the analysis area was calculated by multiplying the total number of pixels with NDVI values greater than 0.3 by the area of one pixel (0.25 km × 0.25 km). The beginning of February (the first 16 days in February) was chosen for the analysis, when peak NDVI values are observed in Dakhla Oasis.

4.3. Satellite Analysis of Typical Farmland in Rashda Village from 2011 to 2019

The NDVI was also used to examine seasonal changes in the amount of vegetation growing on typical farmland in a government well district in Rashda village, near Dakhla Oasis. The study site was the Zimam Bahri sub-district of the government Well No. 3 Irrigation District (area 22 ha; center location 25°35′35″N, 28°55′17″E) [9].
LANDSAT-7/ETM+ (36 scenes) and LANDSAT-8/OLI (143 scenes) (downloaded from Earth Explorer [15]), were selected polygonally to calculate the average NDVI values in the Zimam Bahri sub-district. The NDVI in each pixel is estimated from the reflectance of Enhanced Thematic Mapper, Plus (ETM+) bands 3 (0.63–0.69 μm) and 4 (0.76–0.9 μm) and Operational Land Imager (OLI) bands 4 (0.63–0.68 μm) and 5 (0.845–0.885 μm) as follows:
NDVI = ρ N I R ρ R E D ρ N I R + ρ R E D
ρ λ = ρ λ c o s ( θ S Z ) = ρ λ s i n ( θ S E )
ρ λ = M ρ Q c a l + A ρ
where ρNIR and ρRED are the reflectances of near infrared and red wavelengths, λ is the wavelength, θSZ is the solar zenith angle, θSE is the solar elevation angle, ρλ is the reflectance with no consideration of solar elevation, Mρ and Aρ are scaling coefficients, and Qcal is the Digital Number (DN). The Level-1 data of LANDSAT-7/ETM+ are calibrated mutually to LANDSAT-8OLI data (using the USGS LANDSAT Level-1 Data Product [17]).

5. Results

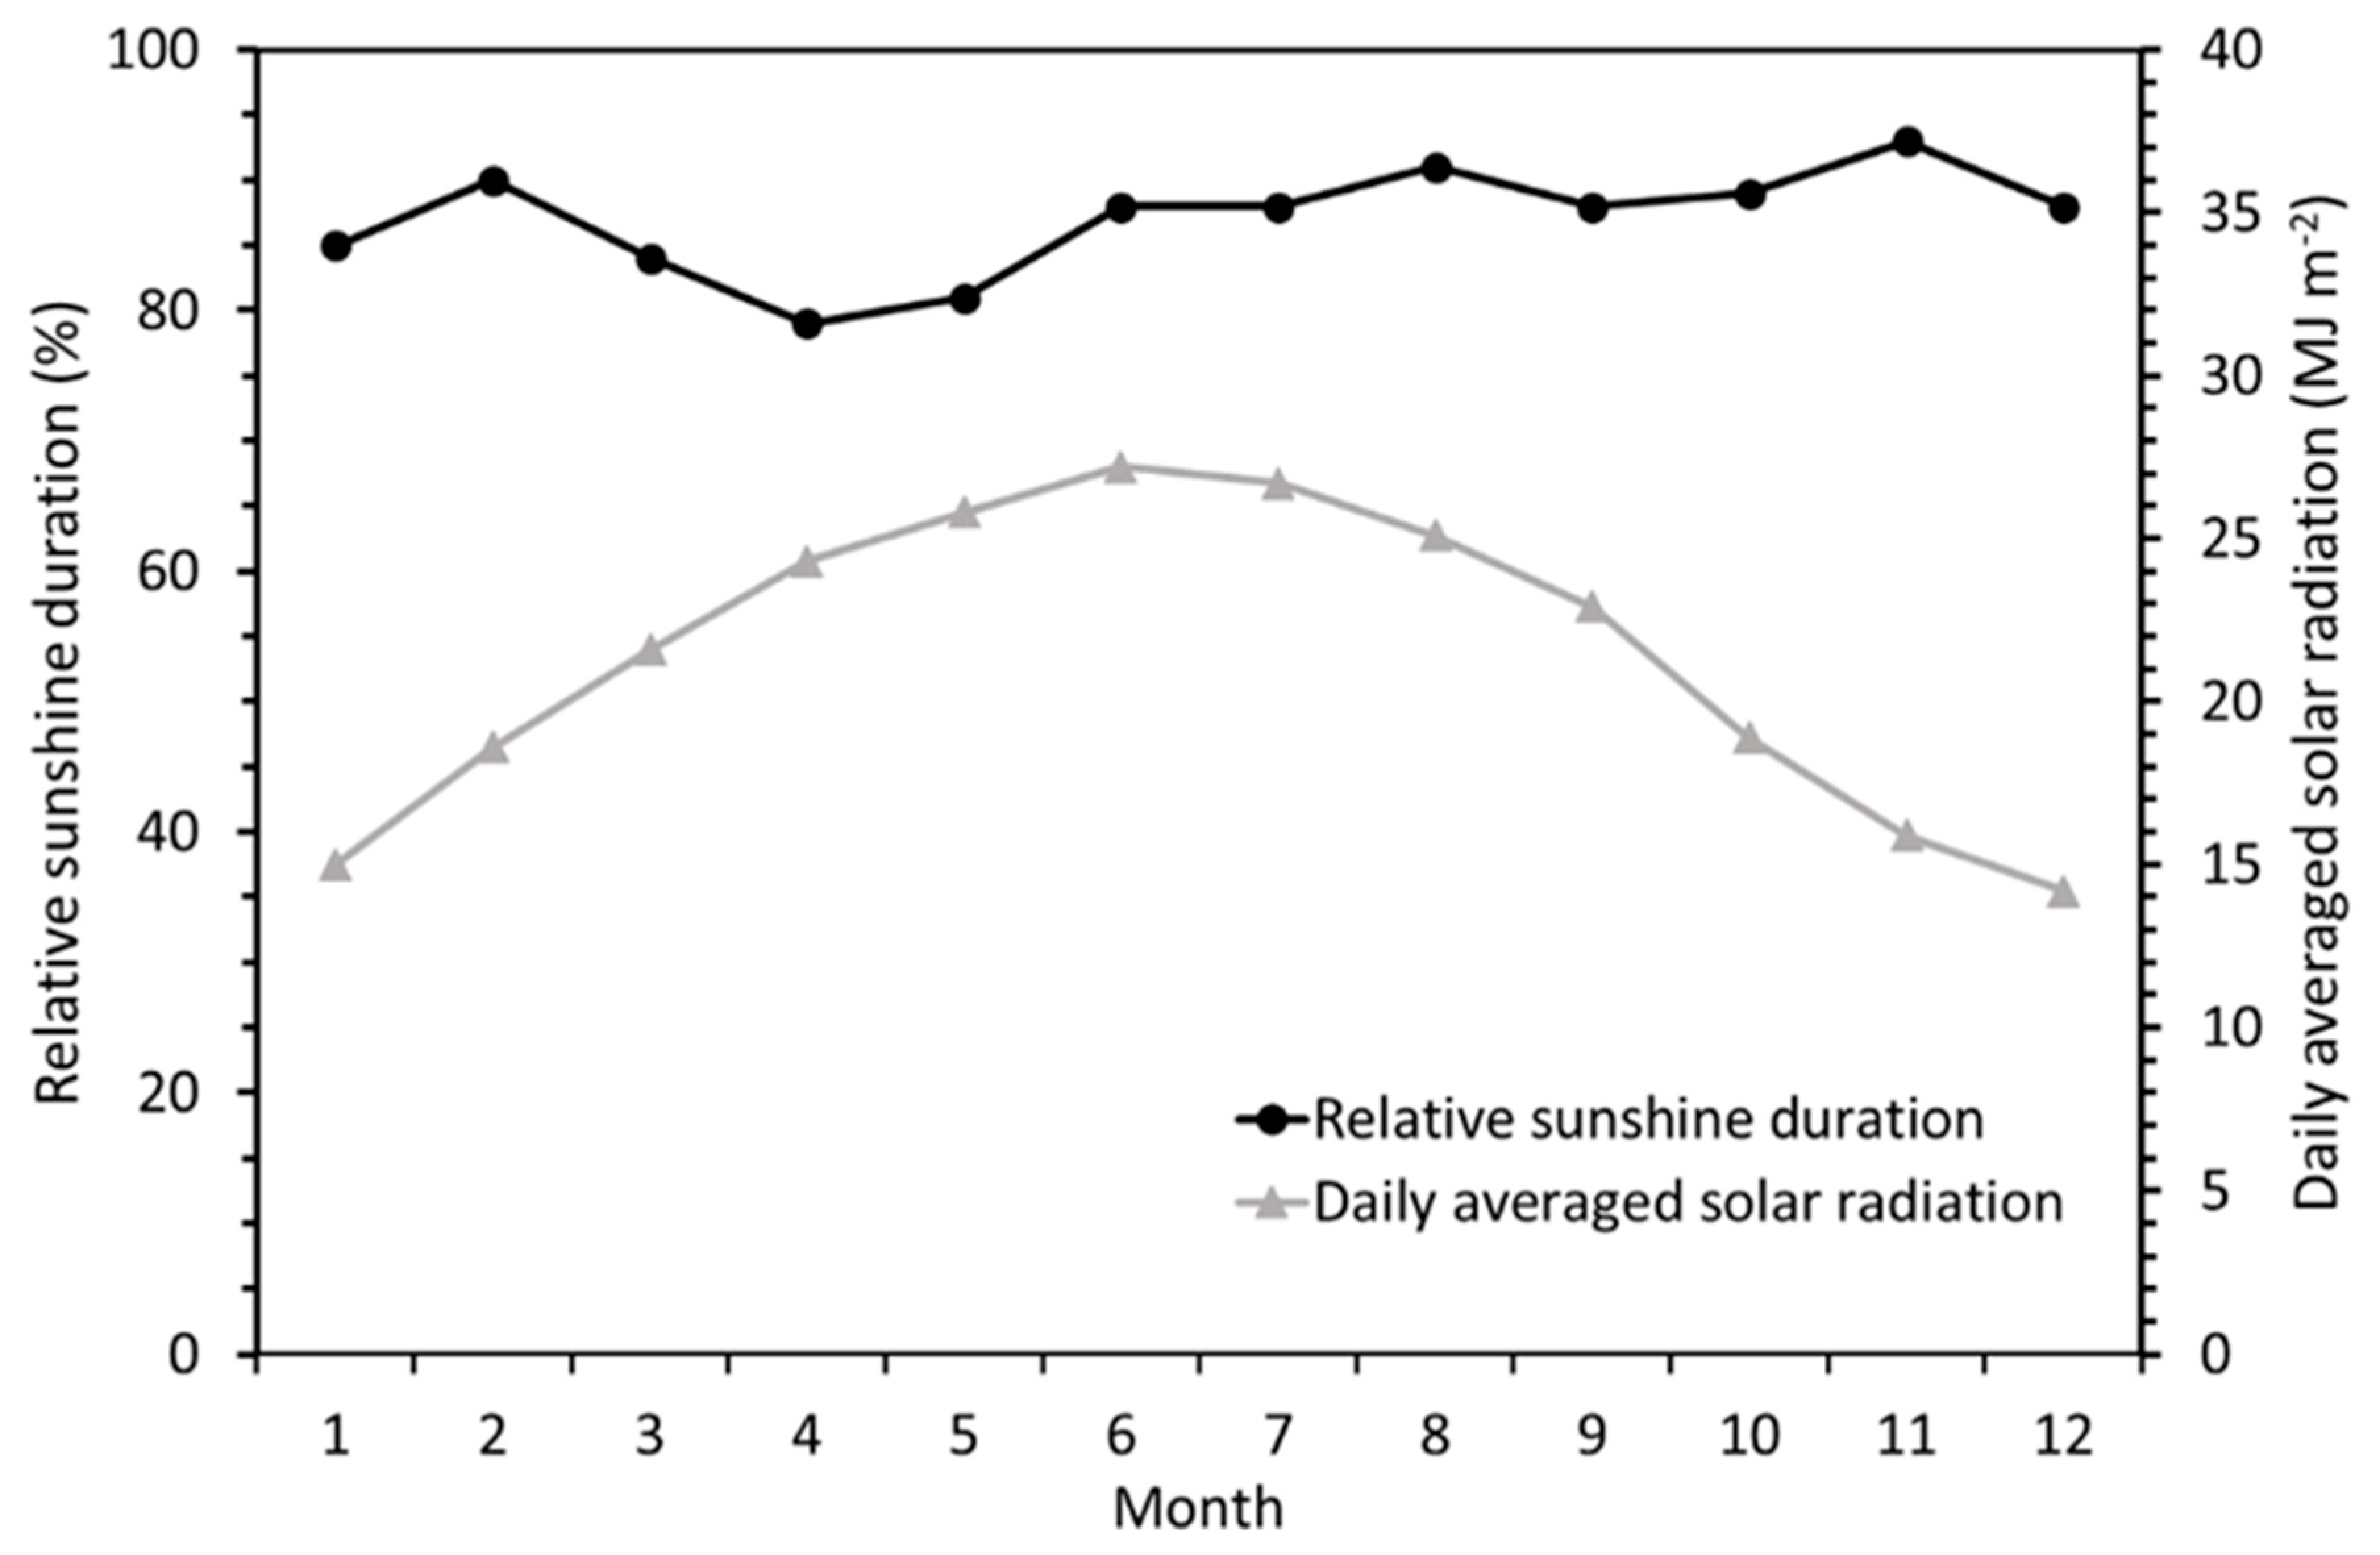
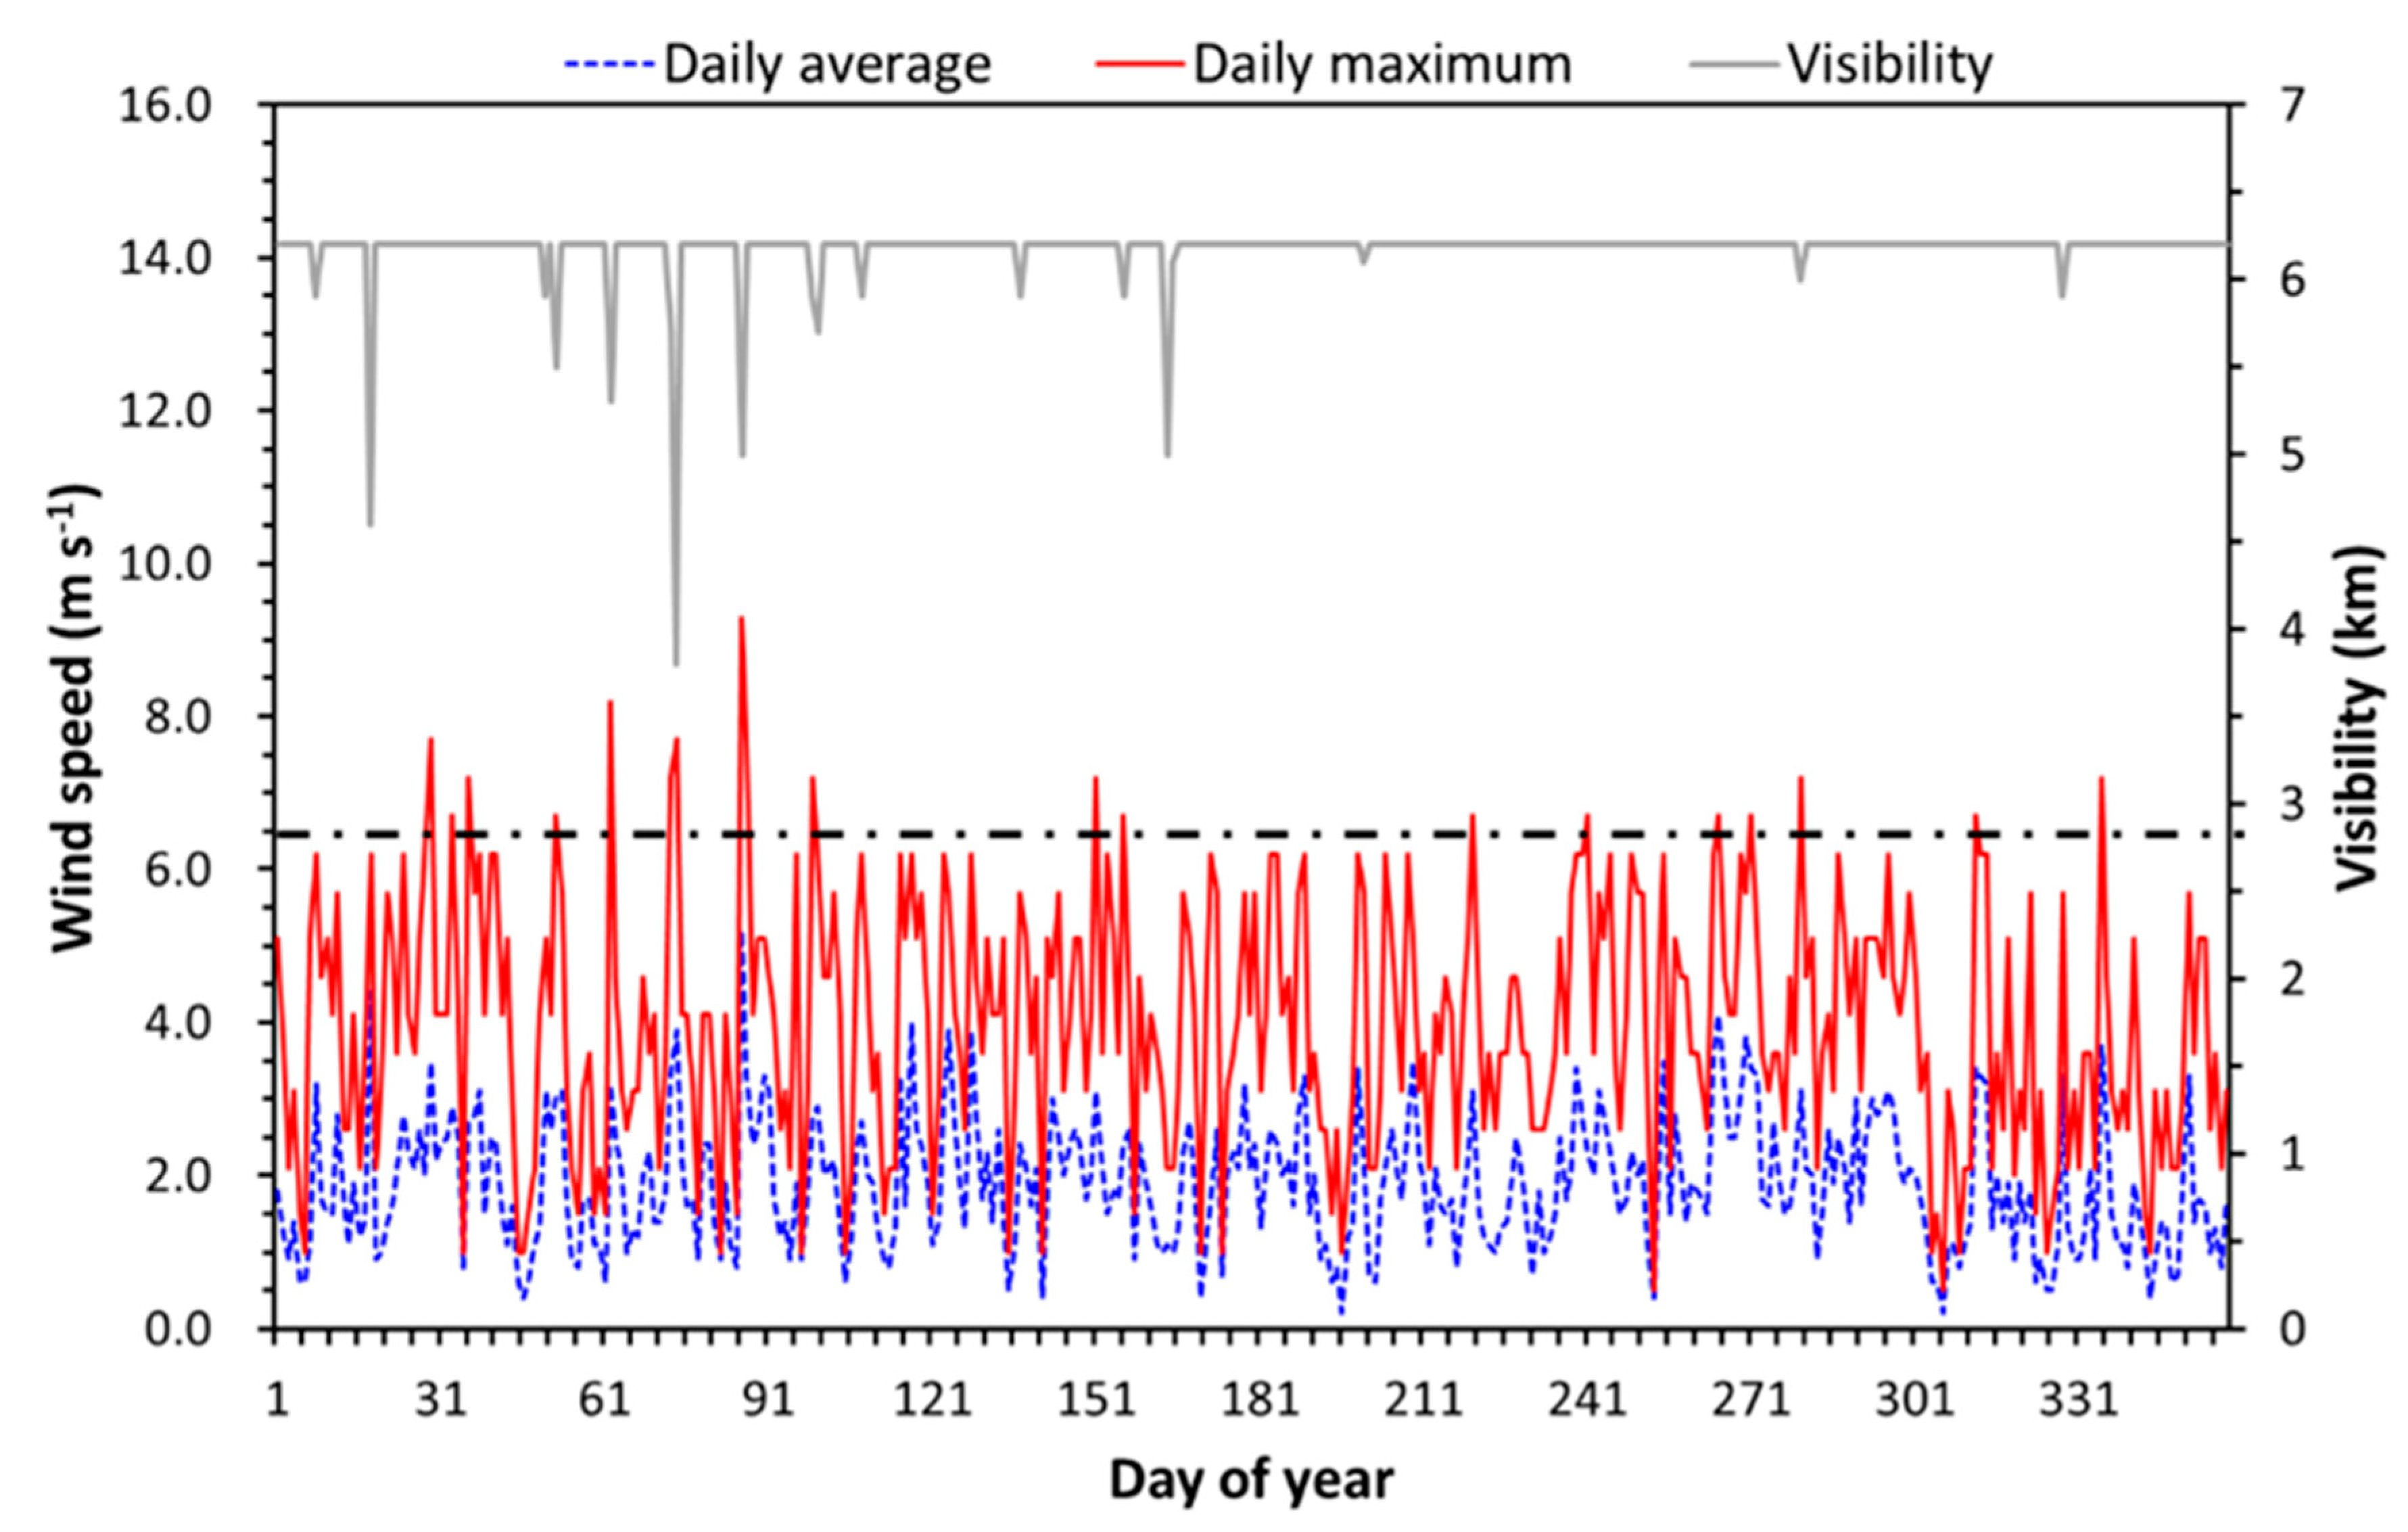
5.1. Soil Conditions and Meteorology

The particle size distribution of soil samples collected from farmland in Rashda Village was bimodal, with a peak at around 2 μm and another at 200 μm. The proportions of sand, silt, and clay were 7:2:1; thus, the soil was a sandy loam. Soil bulk density, specific gravity, and porosity were 1.3 g m−3, 2.6 g m−3, and 49.8%, respectively. The moist soil was clay-like with high cohesiveness, whereas the dry soil was hard; in the field, depositional crusts and cracks were observed when the soil was dry (Figure A5).
The authors in Ref. [18] indicated that the average annual solar radiation in the southwestern desert of Egypt is highest in the world. Recent data also showed that the relative sunshine duration (ratio of actual sunshine duration to possible sunshine duration) measured at Kharga Oasis was high throughout the year, from 79% in April to 93% in November (Figure 3). Thus, in the western desert, not only is there sufficient sunshine for crop growth throughout the year, but also satellite images are seldom obscured by clouds.
The annual average temperature at Dakhla Oasis during 2007–2016 was 24.4 °C (Figure 4). The effective accumulated temperature (the degree of dependence on the climate for plant growth using the temperature), that is, the annual total of daily averaged temperatures of more than 10 °C, was 8941 °C. From the viewpoint of seasonal temperature changes and the temperature requirements of crop plants, the climate of Dakhla Oasis is advantageous for agriculture. For example, date palms prefer a mean temperature between 12.7 and 27.5 °C, and they can endure temperatures as high as 50 °C (Figure A6). Thus, the annual mean temperature range of Dakhla Oasis is ideal for date palms from pollination to maturity. As a result, Dakhla Oasis is able to produce high-quality date palm products that are very popular in Egypt. Even though Dakhla Oasis belongs to the hyper-arid region, the climate is distinctive compared with that of typical arid regions. In particular, humidity is comparatively high; the daily averaged humidity ranged from 25% to 55%. The vapor pressure was around 10 hPa during the winter season (Figure 4), whereas, in the Loess Plateau of China (a semi-arid region), vapor pressure in the winter season was under 5 hPa [19]. Differences in the position of minimum humidity and maximum vapor pressure show the dependence of humidity on the temperature, and actual water vapor content in the air.
During much of the year, winds at Dakhla are comparatively calm under the effect of a prevailing high-pressure system in the Sahara. From 2007 to 2016, the annual average wind speed was 1.9 m s−1, and the average maximum wind speed was 3.9 m s−1. On some days, however, the maximum wind speed exceeded the threshold wind speed for a dust outbreak (Figure 5). Based on a threshold wind speed for dust emission of 6.5 m s−1 [20], dust events can potentially occur throughout the year, but they are especially likely during the Khamsin season (DOY 61 to 121). When the wind speed exceeds 6.5 m s−1, visibility is usually degraded. Strong winds also occur in the spring, when a mixing layer specific to the desert climate develops [21], as well as during the Khamsin season.
Because Dakhla Oasis is in a hyper-arid region [11], ETp is high. The average annual total ETp from 2007 to 2016 was 1783 mm (Figure 6), from May to August, monthly ETp exceeded 200 mm.
The global average temperature is predicted to increase by up to 4.8 °C by 2018–2010 (if no countermeasures to global warming are implemented) compared to the average temperature from 1986 to 2005 [22]. In particular, in arid sub-tropical regions, the temperature is expected to increase rapidly. A temperature rise of 0.9 °C was recorded in Dakhla Oasis during the 29 years from 1988 to 2016 (Figure 7), whereas the global average temperature increased by 0.74 °C from 1900 to 2000 [22]; thus, the temperature in Dakhla Oasis increased more in 29 years than the global average temperature did in 100 years. Although the climate of Dakhla Oasis is presently suitable for crop cultivation, further increases in temperature may require the cropping system to be modified.
In summary, meteorological conditions in Dakhla Oasis are currently well suited for crop growth. In the future, however, rainfall decreases and higher evapotranspiration demand (ETp) may lead to water scarcity and land degradation. On the other hand, these problems can be prevented by modifying irrigation, drainage, and plant rotation practices, as discussed below.

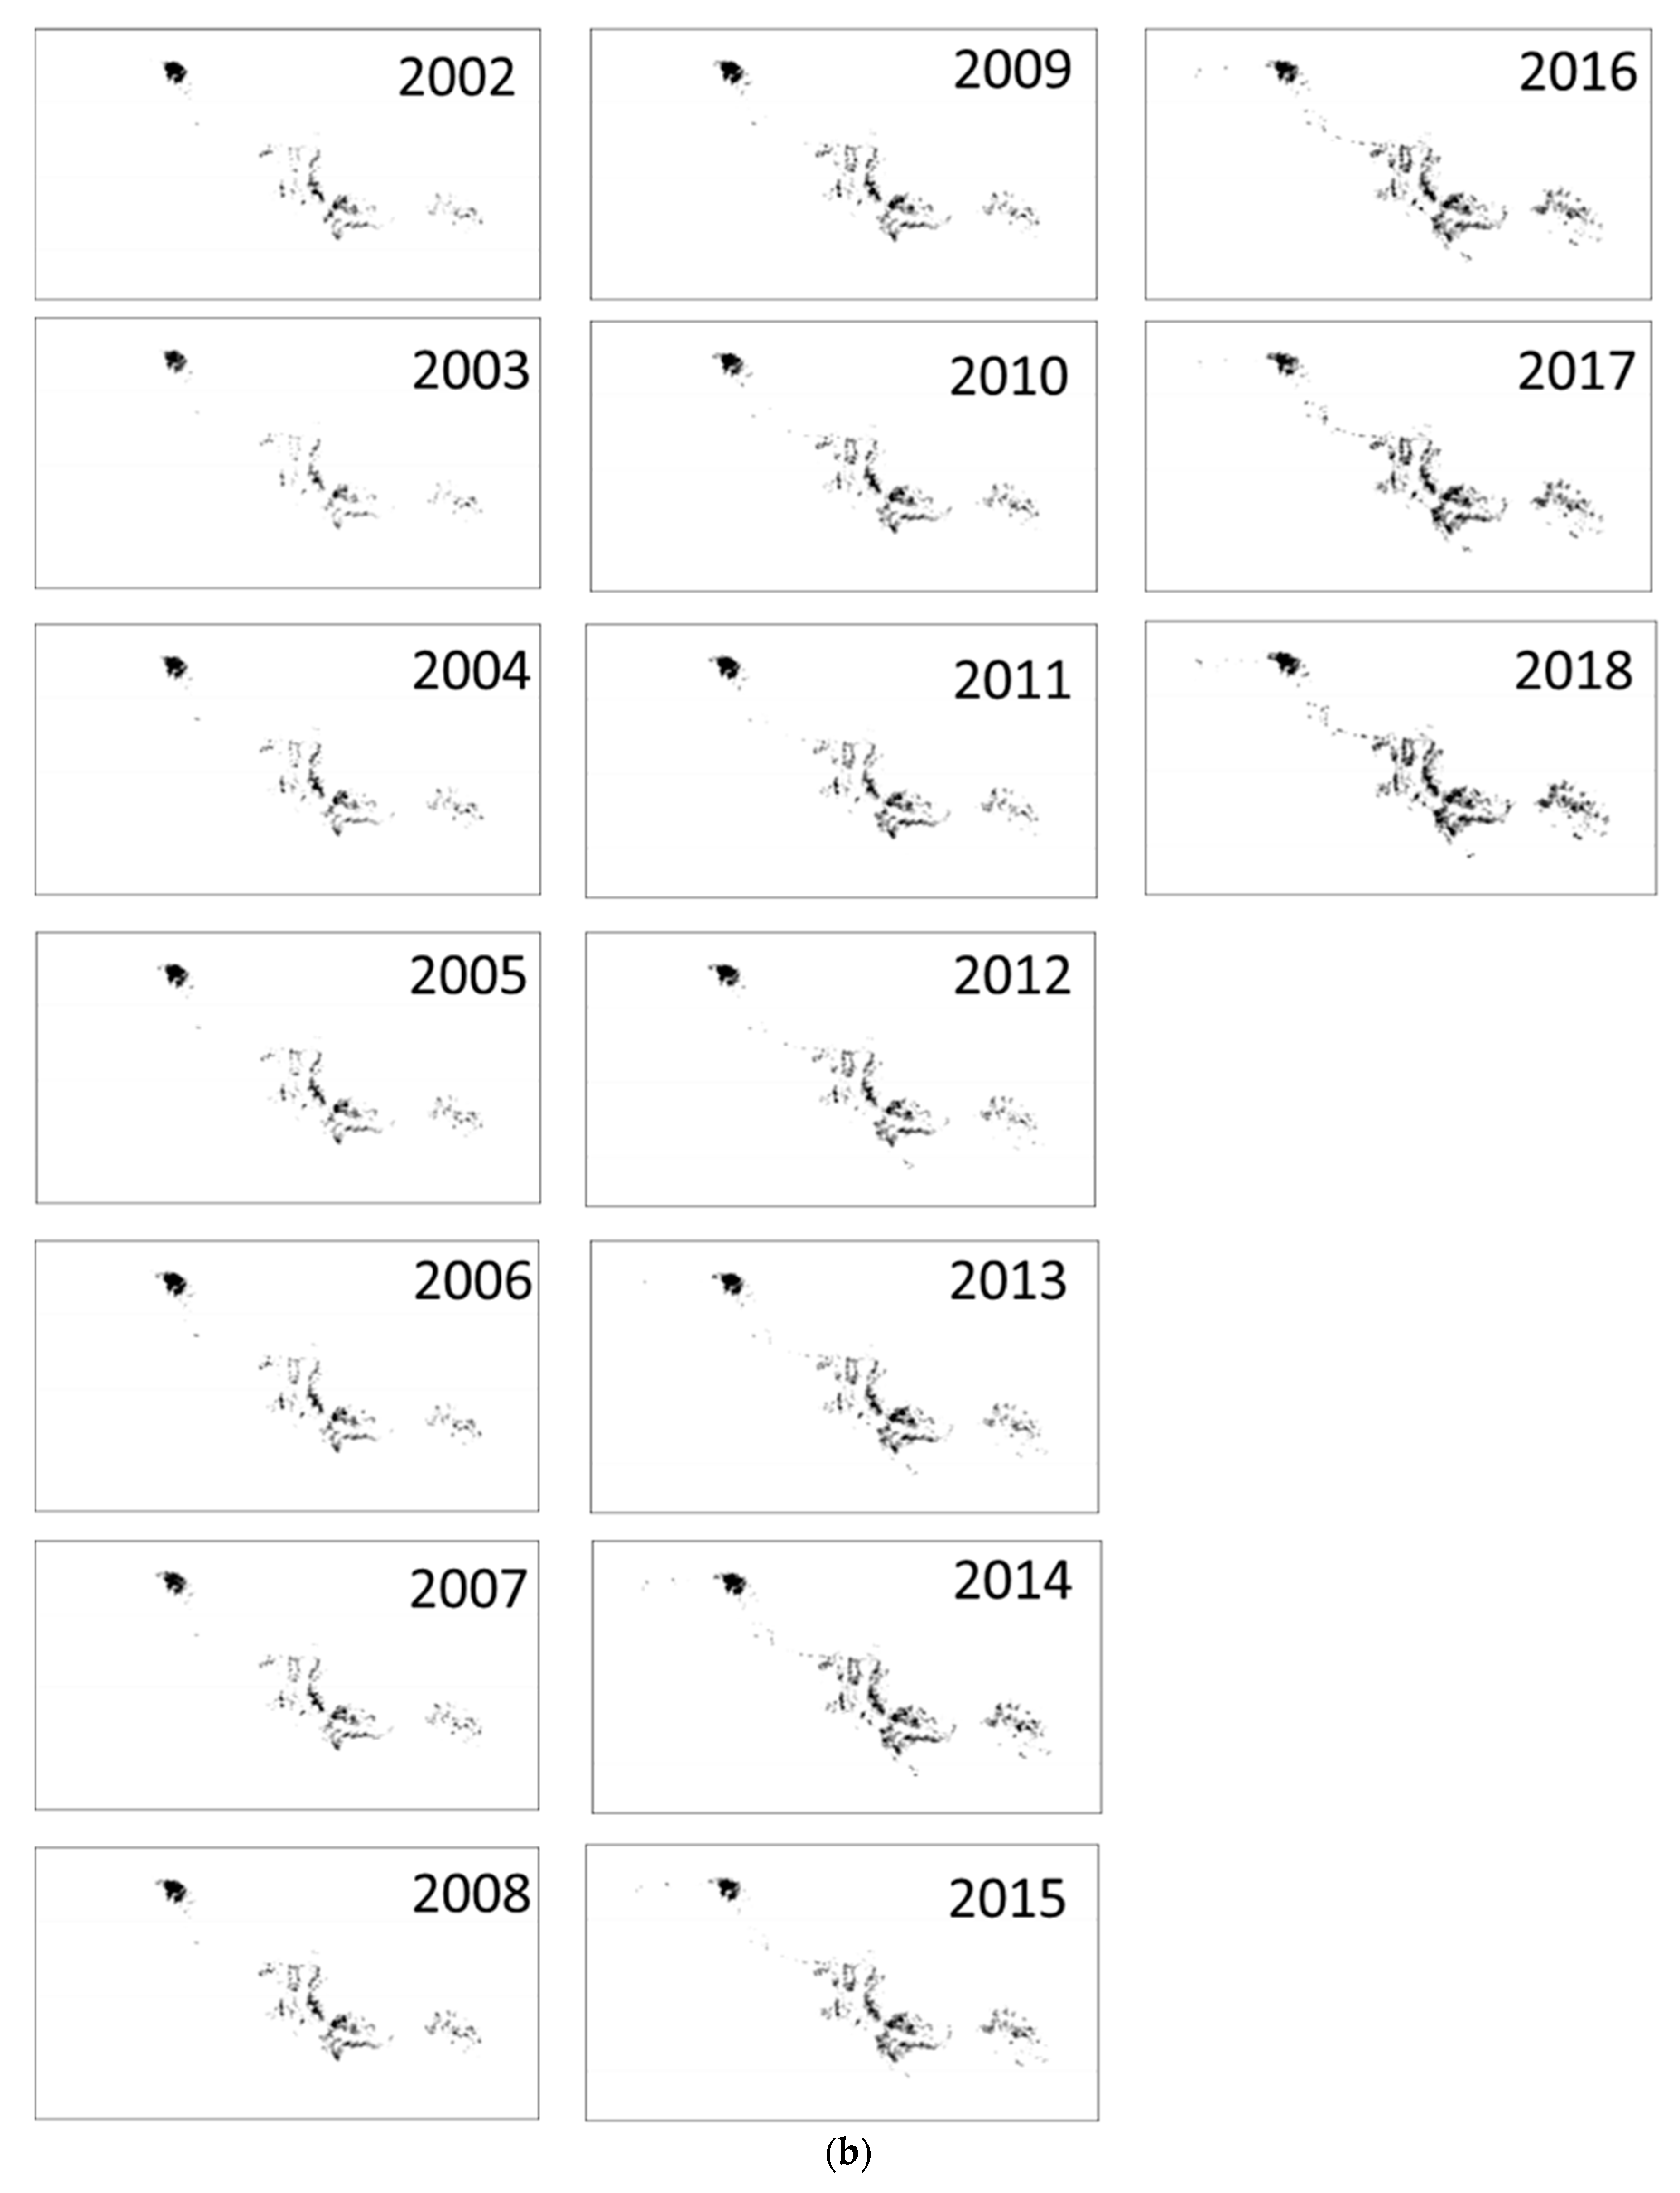
5.2. Yearly Change in the Cultivated Area of Dakhla Oasis

In 1984, the cultivated area in Dakhla Oasis was approximately 110 km2 [23]. From 2001 to 2019, the cultivated area increased at an average rate of 13.8 km2 year−1 from 200 to 460 km2 (see Figure 8; due to a change in population, as shown in the population census), although the revolution in January 2011 appears to have caused the cultivated area to decrease slightly in 2012. After 2012, however, the cultivated area again increased rapidly, by 21.2 km2 year−1, compared to 7.8 km2 year−1 before 2012. As a result, the agricultural area in 2019 was more than double that in 2001. Further, the interview results indicated that the increase in the cultivated area was due to an increase in number of shallow wells (local wells), and also to the government’s prioritization of agriculture.
As an example, the change in the distribution of the agricultural area between 2001 and 2019 is indicated in Figure 9a,b. An increased tendency can be found in all villages, especially in Balat, Mut, Qasr, Gedida, Mawhoub West (red arrows), and places along the road and desert area far away from the village (blue arrows). This means that expansion of agricultural area was based on traditional basin irrigation near the city, and modern irrigation techniques like a center pivot in the areas far away from the village.

5.3. Seasonal Variation of NDVI in Government and Local Well Districts

In the Zimam Bahri government well sub-district, NDVI varied seasonally during 2011–2019, with higher values in winter (Figure 10). The maximum NDVI of around 0.6 to 0.7 was reached in February, and then decreased until the end of May. This pattern reflects the typical growth pattern of winter wheat from anthesis to maturity [24]. For comparison, the maximum NDVI values in the Nile delta are 0.65–0.8 [25,26] and, thus, those in Dakhla are close to those in the Nile delta.
In Dakhla, according to the interview results, winter crops (winter wheat or clover hay) are harvested in June. Then, in November, paddy rice is often planted and cultivated, although the scale of rice cultivation is smaller than the scale of wheat and clover cultivation in winter and in some years the land is left fallow.
In summer, when the evapotranspiration demand is high, land is used for paddy rice once every few years, so that the accumulated salt will be leached from the soil. This rotation is not possible unless abundant irrigation water is available, but it is reasonable from the viewpoint of preventing soil degradation. However, under current irrigation laws, the government regulates paddy rice cultivation according to the groundwater table. In winter, when the evapotranspiration demand is low, farmers secure their staple food supply by cultivating winter wheat. In addition, they have recently begun to cultivate pasture grasses and engage in stock farming to ensure a stable income.
The NDVI also varied seasonally between 2001 and 2010 (the broken line in Figure 10; obtained by Kimura et al. [9]), but NDVI values were clearly larger after the revolution in 2011 (solid line) than before 2011 (broken line). NDVI values were especially high in summer after 2011, relative to those before 2011, probably because regulations on water use were loosened, allowing for crops such as paddy rice to be cultivated more often. The peak wintertime NDVI values were also larger after 2011 than before 2011, possibly because agricultural practices such as the irrigation schedule and fertilizer applications were different. In 2007, the winter wheat yield of Dakhla Oasis was 4.7 t ha−1 [1]; in comparison, in the same year, the average winter wheat yield in Egypt was 6.7 t ha−1 and the average global yield was 2.8 t ha−1 (Food and Agriculture Organization Corporate Statistical Database (FAOSTAT) [27]). The yield in Dakhla might be even larger now, considering the increase in the peak NDVI value since 2011. The authors in Ref. [28] showed that Dakhla Oasis is recognized as the region where increased yields will be expected due to the additional soil organic carbon.

6. Discussion

Here, we will discuss the water consumption by crops and total required water volume for agriculture using the results of meteorological and satellite analysis. Under the meteorological conditions in Dakhla, the reference evapotranspiration (ET) value of date palm is the highest, and that of paddy rice is second highest (Table 1). The authors in [9] found that the interviewed farmers preferred to grow wheat or clover hay rather than date palms in government well districts because of the large amount of water required for date palm cultivation. However, date palms are cultivated in local well districts. The water demand of winter wheat is comparatively low, but because most nutrients in the soil are consumed during wheat cultivation, a fallow period or clover hay cultivation must follow wheat production for soil conditions to recover.
Although the amount of irrigation water from local wells used by date palm is less than the reference evapotranspiration (Table 1), the amounts of irrigation water from government wells used by other crops are almost the same as their respective reference evapotranspiration (the irrigation amount is about 1.1 times the reference evapotranspiration). Therefore, irrigation is well managed in government well districts, such that the amount of irrigation water used for each crop approximately matches the theoretical evapotranspiration. It should be noted that the reference evapotranspiration amounts in Table 1 are ideal values calculated for non-water-stressed conditions, not observed values. Actual evapotranspiration can generally be observed by methods such as the eddy covariance method. However, Matsushima and Kimura [29] estimated the evapotranspiration of wheat or clover hay from November to May in 2018 to be 650 mm in the Zimam Bahri government well sub-district by using satellite thermal data, Surface Synoptic Observations (SYNOP) meteorological data, and a two-layer heat balance model, which is a two-source model consisting of a vegetation canopy and an underlying soil surface, using the simplex algorithm [30]. This result suggests that the actual evapotranspiration may be close to the calculated values for crops other than date palm and rice (Table 1) and that most irrigation water used for winter wheat and clover hay might be consumed by evapotranspiration.
Finally, water consumption by people living in Dakhla Oasis, both for agriculture and for their daily activities, must be considered. When land is used for wheat production in winter and left fallow in summer, the annual water consumption is 667 mm (Table 1). Because the cultivated area in 2019 was 462 km2 (including fields with vegetation other than wheat), the overall water requirement in Dakhla Oasis in that year was 308 × 106 m3. This value was comparatively small compared to the actual extraction rates for Dakhla Oasis (439 × 106 m3) [5], because summer production was not considered. Thus, for a population of 101,854 people (the 2017 population in Figure 8), the per capita amount of water required for agriculture is 3023 m3. In addition, each person in Egypt uses, on average, 58 m3 year−1 of water in their daily life (based on data for 2000 by the Ministry of the Environment [31]). Thus, the total annual amount of water required per person in Dakhla Oasis is 3081 m3, about three times the amount required by an average Egyptian (1000 m3 year−1 based on data for 2000 by AQUASTAT FAO [32]). Therefore, people in Dakhla Oasis use the abundant water there to derive an agricultural income and, as the cultivated area increases, the water demand is likely to similarly increase, putting pressure on the groundwater resource and possibly threatening its sustainability. To return the water usage in the oasis to that of the average Egyptian (1000 m3 year−1 per person), the cultivated area would need be decreased to 153 km2, the area that was cultivated between the 1980s and the 1990s. In the 1980s, the agricultural area and population were 110 km2 and 57,881 [23] and, thus, the total required water per person was 1267 m3. The balance of the agricultural area, population, and economy is important when considering the reservoir capacity of fossil water. The authors in Sefelnasr et al. [5] indicated from their numerical simulation that the best option for groundwater management in Dakhla Oasis was the implementation of an extraction rate of 532 × 106 m3 year−1, as the depths to groundwater will never exceed the 100 m limit for the coming 100 years. The amount of groundwater in the Nubian aquifer system is not known exactly, but these numbers should be considered in the context of the future development of the oasis if groundwater is going to continue to be available.

7. Conclusions

In Dakhla Oasis, the only water resource available for human activities is groundwater. Recently, this resource has been stressed by increases in the number of wells withdrawing the stored water and in the cultivated area. To extend the period in which this limited groundwater resource will be available, efficient irrigation farming is crucial. Therefore, it is important to understand the land and water use and meteorological conditions for the future development and sustainability of Dakhla Oasis. This study examined the recent meteorological conditions and cultivation practices in Dakhla Oasis and in farmland of a specific village by using SYNOP meteorological data and MODIS and LANDSAT satellite data. The study’s findings are as follows:
  • At present, meteorological conditions in Dakhla Oasis are suitable for crop growth. Although decreased rainfall and increased evapotranspiration demand can lead to water scarcity and land degradation, these problems might be prevented by modifying agricultural practices, including irrigation and drainage techniques, and plant rotation practices;
  • From 2001 to 2019, the cultivated area in the oasis increased by 13.8 km2 year−1. Following the revolution in 2011, the rate of increase was 21.2 km2 year−1, compared with 7.8 km2 year−1 before 2012;
  • The maximum NDVI value of farmland observed in the studied village during 2011–2019 was 0.6 to 0.7 in February; this then decreased until the end of May, compared with values of 0.65–0.8 in the Nile delta. NDVI values were larger after 2011 than before 2011, especially in summer, probably because regulations on water use were loosened, allowing crops such as paddy rice to be cultivated more frequently, and the peak NDVI value of 0.6 to 0.7 in winter was only observed after 2011;
  • Under the meteorological conditions in Dakhla, the reference evapotranspiration of the date palm is highest, and that of paddy rice is second highest. The amounts of irrigation water from government wells used for crops were almost the same as the crop evapotranspiration amounts. Thus, most irrigation water was consumed by evapotranspiration;
  • The amount of required water per person in Dakhla Oasis (population 101,854) was estimated to be 3081 m3, almost three times the amount required by the average Egyptian (1000 m3 year−1). Therefore, people in Dakhla Oasis use the abundant water to derive an agricultural income, thereby putting pressure on the water resource and perhaps threatening its sustainability.
At present, agricultural production has been developing under the good meteorological and abundant water conditions, leading to increased farmland. However, the excessive use of groundwater by large-scale governmental projects and the expansion of farmland will bring a drop in the reserves of fossil water. In addition, temperature changes due to global warming also have to be taken into consideration with regards to plant production.
Agroforestry is popular in oases, and the shade of date palms facilitates market gardening and cereal cultivation. Such wisdom will be needed under limited water resource conditions. Our recommendations for agricultural systems (crop types, rotation, irrigation methods, and agricultural systems) should be discussed in relation to policies that increase the expansion of cultivation areas in the oases and in view of the limited water resources. It is our hope that the results presented here will be confirmed by other agricultural experts, and that, in the near future, they will serve as a basis for improved water use in order to promote sustainable development in oasis regions.
In future studies, research from various disciplinary approaches will be required to study how the region can maintain sustainability. The results in this paper show that sustainability is the key issue of not only the Dakhla Oasis, but also the entire western desert society, in terms of securing the staple foods that are grown there. Such an awareness led us to gather research on sustainability in the western desert, taking Dakhla Oasis, which is the most populated oasis in the western desert, as a case study. Although all the oases in the western desert share a common feature, in that they depend upon the Nubian Sandstone Aquifer, each oasis has its own personality. This is the reason why the scope of this paper is restricted to Dakhla Oasis. In the near future, we hope to extend our multi-disciplinary research to other oases in the western desert to fully understand the problems and potentiality of sustainable development based on groundwater in Egypt.

Author Contributions

Conceptualization, methodology, data analysis, and writing—original draft preparation, R.K.; interview in actual field and paper editing, E.I.; observation of soil physics in actual field and paper editing, N.M.; funding acquisition, E.I. All authors have read and agreed to the published version of the manuscript.

Funding

This research was funded by a Grant-in-Aid for Scientific Research, grant number KAKENHI 17H01626.

Acknowledgments

We thank Hiroshi Kato (emeritus professor at Hitotsubashi University), Kazumasa Fukuda (Chiba University), Eiji Nagasawa (emeritus professor at the University of Tokyo), Akihiko Kondoh (Chiba University), Maki Tsujimura (Tsukuba University), and Dai Matsushima (Chiba Institute of Technology) for considerable advice and discussion during our research. I appreciate the invaluable comments from two reviewers of this paper.

Conflicts of Interest

The authors declare no conflict of interest. The funders had no role in the design of the study; in the collection, analyses, or interpretation of data; in the writing of the manuscript, or in the decision to publish the results.

Appendix A

Figure A1. White Desert in the western desert.
Remotesensing 12 01264 g0a1
Figure A2. Government well in Rashda village.
Remotesensing 12 01264 g0a2
Figure A3. Winter wheat in Rashda village.
Remotesensing 12 01264 g0a3
Figure A4. Rice paddy in Rashda village.
Remotesensing 12 01264 g0a4
Figure A5. Soil cracks observed in Rashda village.
Remotesensing 12 01264 g0a5
Figure A6. Date palm in Rashda village.
Remotesensing 12 01264 g0a6

References

  1. Kato, H.; Iwasaki, E.; Nagasawa, E.; Anyoji, H.; Matsuoka, N.; Kimura, R. Rashda: System of irrigation and cultivation in a village in Dakhla oasis. Mediterr. World 2010, 20, 1–45. [Google Scholar]
  2. Kato, H.; Iwasaki, E. Rashda: The Birth and Growth of an Egyptian Oasis Village; Brill: Leiden, The Netherlands, 2016; p. 294. [Google Scholar]
  3. Watanabe, M.; Sugimura, T.; Kamei, H. Interpretation of characteristics of the land use change based on chronological satellite imageries of Kharga oasis, western desert, Egypt. J. Remote Sens. Soc. Jpn. 2014, 5, 356–366. [Google Scholar]
  4. Ahram Online. Egypt’s Sisi to Launch 1.5 Million Feddan Project in Late December. Available online: http://english.ahram.org.eg (accessed on 17 March 2020).
  5. Sefelnasr, A.; Gossel, W.; Wycisk, P. Three-dimensional groundwater flow modeling approach for the groundwater management options for the Dakhla oasis, western desert, Egypt. Environ. Earth Sci. 2014, 72, 1227–1241. [Google Scholar] [CrossRef]
  6. Abdelmohsen, K.; Sultan, M.; Ahmed, M.; Save, H.; Elkaliouby, B.; Emil, M.; Yan, E.; Abotalib, A.Z.; Krishnamurthy, R.V.; Abdelmalik, K. Response of deep aquifers to climate variability. Sci. Total Environ. 2019, 677, 530–544. [Google Scholar] [CrossRef] [PubMed]
  7. Sefelnasr, A.; Gossel, W.; Wycisk, P. Groundwater management options in an arid environment: The Nubian sandstone aquifer system, eastern Sahara. J. Arid Environ. 2015, 122, 46–58. [Google Scholar] [CrossRef]
  8. Dabous, A.A.; Osmond, J.K. Uranium isotopic study of artesian and pluvial contributions to the Nubian aquifer, western desert, Egypt. J. Hydrol. 2001, 243, 242–253. [Google Scholar] [CrossRef]
  9. Kimura, R.; Kato, H.; Iwasaki, E. Cultivation features using meteorological and satellite data from 2001 to 2010 in Dakhla Oasis, Egypt. J. Water Resour. Prot. 2015, 7, 209–218. [Google Scholar] [CrossRef] [Green Version]
  10. Voss, I.; Soliman, S.M. The transboundary non-renewable Nubian aquifer system of Chad, Egypt, Libya and Sudan: Classical groundwater questions and parsimonious hydrogeologic analysis and modeling. Hydrogeol. J. 2014, 22, 441–468. [Google Scholar] [CrossRef]
  11. UNEP. World Atlas of Desertification; Arnold: London, UK, 1997; p. 182. [Google Scholar]
  12. Kimura, R.; Moriyama, M. Recent trends of annual aridity indices and classification of arid regions with satellite-based aridity indices. Remote Sens. Earth Syst. Sci. 2019, 2, 88–95. [Google Scholar] [CrossRef]
  13. National Center for Environmental Information. Available online: https://www.ncdc.noaa.gov/ (accessed on 16 April 2020).
  14. Allen, R.G.; Pereira, L.S.; Raes, D.; Smith, M. Crop Evapotranspiration: Guidelines for Computing Crop Water Requirements; FAO: Rome, Italy, 1998; p. 300. [Google Scholar]
  15. Earth Explorer. Available online: https://earthexplorer.usgs.gov/ (accessed on 16 April 2020).
  16. El-Gammal, M.I.; Ali, R.R.; Samra, R.M.A. NDVI threshold classification for detecting vegetation cover in Damietta governorate, Egypt. J. Am. Sci. 2014, 10, 108–113. [Google Scholar]
  17. USGS Landsat Missions. Available online: https://www.usgs.gov/land-resources/nli/landsat/using-usgs-landsat-level-1-data-product (accessed on 16 April 2020).
  18. Budyco, M.I. Heat Balance of the Earth’s Surface; Seizando: Tokyo, Japan, 1956; p. 271. [Google Scholar]
  19. Kimura, R. Combating Desertification on the Loess Plateau of China Based on Properties of Heat and Water Balances; Yatani Insatsu: Tottori, Japan, 2005; p. 147. [Google Scholar]
  20. Tegen, I.; Fung, I. Modeling of mineral dust in the atmosphere: Sources, transport, and optical thickness. J. Geophys. Res. 1994, 99, 22897–22914. [Google Scholar] [CrossRef]
  21. Yamamoto, T. Soil Degradation and Its Rehabilitation in Arid Region; Kokon Shoin: Tokyo, Japan, 2008; p. 262. [Google Scholar]
  22. IPCC. Climate Change 2013: The Physical Science Basis. Contribution of Working Group I to the Fifth Assessment Report of the Intergovernmental Panel on Climate Change; Stocker, T.F.D., Qin, G.-K., Plattner, M., Tignor, S.K., Allen, J., Boschung, A., Nauels, Y., Xia, V.B., Midgley, P.M., Eds.; Cambridge University Press: Cambridge, UK, 2013; p. 1535. [Google Scholar]
  23. Kato, H.; Elbeih, S.; Iwasaki, E.; Sefelnasr, A.; Shalaby, A.; Zaghloul, E. The relationship between groundwater, land use, and demography in Dakhla oasis, Egypt. J. Asian Netw. GIS-Based Hist. Stud. 2014, 2, 3–10. [Google Scholar]
  24. Moriondo, M.; Masello, F.; Bindi, M. A simple model of regional wheat yield based on NDVI data. Eur. J. Agron. 2007, 26, 266–274. [Google Scholar] [CrossRef]
  25. El-Shirbeny, M.A.; Ali, A.E.M.; Badr, M.A.; Bauomy, E.M. Assessment of wheat crop coefficient using remote sensing techniques. World Res. J. Agric. Sci. 2014, 1, 12–16. [Google Scholar]
  26. El-Shirbeny, M.A.; Ali, A.E.M.; Saleh, N.H. Crop water requirements in Egypt using remote sensing techniques. J. Agric. Chem. Environ. 2014, 3, 57–65. [Google Scholar] [CrossRef] [Green Version]
  27. FAOSTAT. Available online: http://www.fao.org/faostat/en/#data/QC (accessed on 16 April 2020).
  28. Iizumi, T.; Wagai, R. Leveraging drought risk reduction for sustainable food, soil and climate via soil organic carbon sequestration. Nat. Res. 2019, 9, 19744. [Google Scholar] [CrossRef]
  29. Matsushima, D.; Kimura, R. Estimating spatial distribution of the surface soil moisture over an oasis and its surrounding area located in a desert under an extreme dry condition. Proc. Joint Res. Arid Land Res. Center 2019, 73–74. [Google Scholar]
  30. Matsushima, D.; Asanuma, J.; Kaihotsu, I. Thermal inertia approach using a heat budget model to estimate the spatial distribution of surface soil moisture over a semiarid grassland in Central Mongolia. J. Hydrometeorol. 2018, 19, 245–265. [Google Scholar] [CrossRef]
  31. Ministry of the Environment. Available online: https://www.env.go.jp/earth/coop/coop/c_report/egypt_h16/japanese/ (accessed on 16 April 2020).
  32. AQUASTAT FAO. Available online: http://www.fao.org/aquastat/en/ (accessed on 16 April 2020).
Figure 1. Distribution of Moderate Resolution Imaging Spectroradiometer (MODIS) normalized difference vegetation index (NDVI) values in Egypt, based on data with a resolution of 1 km acquired over a 16-day period in early February 2019. Red dashed lines enclose the five oases in the western desert, and blue dashed lines include land reclamation project areas.
Remotesensing 12 01264 g001
Figure 2. Dakhla Oasis: (left) Google Earth satellite view and (right) topographic map, based on the SRTM-30sec Digital Elevation Model. The blue circle in the satellite view indicates the location of Rashda Village, and the red dashed line outlines the NDVI analysis area.
Remotesensing 12 01264 g002
Figure 3. Seasonal changes in monthly average relative sunshine duration and daily average solar radiation at Kharga Oasis, 2008 to 2010.
Remotesensing 12 01264 g003
Figure 4. Seasonal changes in (top) daily average, maximum, and minimum temperatures and (bottom) daily averaged humidity and vapor pressure from 2007 to 2016 in Dakhla Oasis. Dots indicate the monthly average for respective meteorological factors.
Remotesensing 12 01264 g004
Figure 5. Seasonal changes in the daily average and maximum wind speed, and in visibility during 2016 in Dakhla Oasis. The broken line is the threshold of dust emission (6.5 m s−1).
Remotesensing 12 01264 g005
Figure 6. Seasonal changes in daily and monthly ETp in Dakhla Oasis averaged over 2007 to 2016. The numbers in the figure indicate the monthly total of ETp.
Remotesensing 12 01264 g006
Figure 7. Yearly change in the annual averaged temperature in Dakhla Oasis from 1988 to 2016.
Remotesensing 12 01264 g007
Figure 8. Change in the cultivated area in Dakhla Oasis from 2001 to 2019 with population.
Remotesensing 12 01264 g008
Figure 9. (a) Change in distribution in agricultural area between 2001 and 2019; (b) Continued, excluding 2001 and 2019.
Remotesensing 12 01264 g009aRemotesensing 12 01264 g009b
Figure 10. Seasonal variation of NDVI in a government well district between 2011 and 2019 after the revolution (solid line). The broken line shows the seasonal variation from 2001 to 2010 before revolution (data from Kimura et al. [9]).
Remotesensing 12 01264 g010
Table 1. Crops grown in Dakhla Oasis: their cultivation schedule, reference evapotranspiration and irrigation amounts.
CropGrowth PeriodET (mm)Irrigation (mm)
Winter wheatNov. to May667680
Clover hay Nov. to May644680
Date palmall year16331357
Rice paddyJun. to Oct.10851161

