Article

Evaluation of LIRIC Algorithm Performance Using Independent Sun-Sky Photometer Data at Two Altitude Levels

by
María J. Granados-Muñoz
1,2,
José Antonio Benavent-Oltra
1,2,
Daniel Pérez-Ramírez
1,2,
Hassan Lyamani
1,2,
Juan Luis Guerrero-Rascado
1,2,
Juan Antonio Bravo-Aranda
1,2,
Francisco Navas-Guzmán
3,
Antonio Valenzuela
1,2,
Francisco José Olmo
1,2 and
Lucas Alados-Arboledas
1,2,*
1
Department of Applied Physics, Faculty of Sciences, University of Granada, Fuentenueva s/n, 18071 Granada, Spain
2
Andalusian Institute for Earth System Research (IISTA-CEAMA), Avda. del Mediterráneo s/n, 18006 Granada, Spain
3
Federal Office of Meteorology and Climatology, MeteoSwiss, CH-1530 Payerne, Switzerland
*
Author to whom correspondence should be addressed.
Remote Sens. 2020, 12(5), 842; https://doi.org/10.3390/rs12050842
Submission received: 23 December 2019 / Revised: 24 February 2020 / Accepted: 3 March 2020 / Published: 5 March 2020

Abstract

:
This work evaluates the Lidar-Radiometer Inversion Code (LIRIC) using sun-sky photometers located at different altitudes in the same atmospheric column. Measurements were acquired during an intensive observational period in summer 2012 at Aerosols, Clouds, and Trace gases Research InfraStructure Network (ACTRIS)/Aerosol Robotic Network (AERONET) Granada (GRA; 37.16°N, 3.61°W, 680 m above sea level (a.s.l.)) and Cerro Poyos (CP; 37.11°N, 3.49°W, 1820 m a.s.l.) sites. Both stations operated AERONET sun-photometry, with an additional lidar system operating at Granada station. The extended database of simultaneous lidar and sun-photometry measurements from this study allowed the statistical analysis of vertically resolved microphysical properties retrieved with LIRIC, with 70% of the analyzed cases corresponding to mineral dust. Consequently, volume concentration values were 46 μm3/cm3 on average, with a value of ~30 μm3/cm3 corresponding to the coarse spheroid mode and concentrations below 10 μm3/cm3 for the fine and coarse spherical modes. According to the microphysical properties’ profiles, aerosol particles reached altitudes up to 6000 m a.s.l., as observed in previous studies over the same region. Results obtained from comparing the LIRIC retrievals from GRA and from CP revealed good agreement between both stations with differences within the expected uncertainties associated with LIRIC (15%). However, larger discrepancies were found for 10% of the cases, mostly due to the incomplete overlap of the lidar signal and/or to the influence of different aerosol layers advected from the local origin located between both stations, which is particularly important in cases of low aerosol loads. Nevertheless, the results presented here demonstrate the robustness and self-consistency of LIRIC and consequently its applicability to large databases such as those derived from ACTRIS-European Aerosol Research Lidar Network (EARLINET) observations.

1. Introduction

Atmospheric aerosol particles affect the Earth’s atmosphere system directly by scattering and absorbing solar radiation and indirectly by acting as cloud condensation and ice nuclei, modifying cloud properties. Atmospheric aerosol particles present large spatio-temporal variability, which makes their accurate monitoring and characterization a challenging task. In spite of the large efforts during the last decades, aerosol radiative effects continue to be largely uncertain as indicated in the 5th Assessment Report of the Intergovernmental Panel on Climate Change (IPCC) [1]. Reducing aerosol uncertainties still requires more in-depth knowledge about their vertical distribution, with particular emphasis on their microphysical properties, i.e., their concentration, size and shape.
Improvement in aerosol characterization has been partly possible thanks to the development of operational networks with adequate global coverage and high temporal resolution data using sun-photometry measurements. Among the most successful networks is the Aerosol Robotic Network (AERONET, [2]), followed by others such as SKYradiometer network (SKYNET) [3]. However, these networks only provide column-integrated aerosol optical and microphysical properties. Aerosol lidar networks such as GALION (Global Atmospheric Watch Aerosol Lidar Observation Network) and its participant networks, i.e., EARLINET (European Aerosol Research Lidar Network, www.earlinet.org) [4], MPLNET (Micro Pulse Lidar Network) [5], LALINET (Latin American Lidar Network [6,7]) or ADNET (Asian Dust Network) [8], provide vertically resolved aerosol properties, overcoming this drawback. This potential of the lidar technique serves to advance estimations of aerosol radiative properties [9,10]. However, only aerosol backscatter and extinction coefficients are typically provided, because of the complexity of the technique. Further developments are essential because of the need to take into account aerosol microphysics in estimations of radiative properties. Inferring aerosol microphysical properties from lidar measurements alone requires complex inversion algorithms (e.g., [11,12,13]) and is only possible if the particle backscatter coefficient is measured at three wavelengths (typically 355, 532 and 1064 nm), particle extinction coefficient at two wavelengths (typically, 355 and 532), and strict constraints are applied to the inversion (e.g., [14]).
Advances in the knowledge of aerosol vertically resolved microphysics have been proposed through the synergy of different remote sensing instrumentations. Since information from sun-photometry measurements when combining sun and sky radiances is enough to provide accurate retrievals of aerosol microphysical properties (e.g., [15]), their synergy with lidar is ideal for advancing the understanding of aerosol microphysics’ vertical distribution. Several algorithms have been proposed in the framework of the European Project ACTRIS (Aerosols, Clouds, and Trace gases Research InfraStructure Network) that join EARLINET and AERONET networks. Among the most robust and feasible algorithms are LIRIC (Lidar-Radiometer Inversion Code [16,17]) and GARRLiC (Generalized Aerosol Retrieval from Radiometer and Lidar Combined [18,19,20]). Backscattered lidar signals, plus the information from AERONET inversion of aerosol microphysical properties, are the inputs in LIRIC, and it is advantageous because of its ease of use for the scientific community. Nevertheless, the additional retrieved parameters are only the vertically resolved concentrations of fine and coarse modes. On the other hand, GARRLiC is mathematically more robust after its implementation in the Generalized Retrieval of Atmosphere and Surface Properties inversion code (GRASP, [21]), but it requires previous adaptation of the signal and is more complex to use.
This works evaluates LIRIC code using a combination of lidar measurements and two AERONET sun photometers at different altitudes. Such an observational setup, established in Southeastern Spain during the summer of 2012, was quite unique and takes advantage of the complex orography of the area. This experimental setup allowed us to retrieve aerosol microphysical properties’ profiles with LIRIC from two different altitudes with independent sun-sky photometer measurements. The first AERONET instrument and lidar measurements were in the city of Granada (GRA,37.16°N, 3.61°W, 680 m a.s.l), while the second instrument was at Cerro Poyos (CP; 37.11°N, 3.49°W, 1820 m a.s.l.), at a horizontal distance from Granada of 12 km and 1140 m higher.

2. Materials and Methods

2.1. Experimental Site and Instrumentation

Measurements performed in the Andalusian Global ObseRvatory of the Atmosphere (AGORA) in Granada were used in this study. AGORA is formed of three sites located at different altitudes in the metropolitan area of Granada. Details about the experimental setup can be found in [17,22].
The main station (GRA) is located in the Andalusian Institute for Earth System Research (IISTA-CEAMA) in Granada city. Granada is a medium-sized city in Southeastern Spain with almost 500,000 inhabitants, including the metropolitan area. The city, located in a natural basin, is surrounded by mountains that can reach up to 3000 m a.s.l. at the Eastern part. It is also located 200 km from the African continent and around 50 km away from the Mediterranean Sea. The station is mostly affected by aerosol particles from the Sahara Desert, a major source of mineral dust [23,24,25,26,27]; Europe, for anthropogenic pollution; local sources, such as traffic and re-suspension material from the ground [28,29]; and biomass burning [30,31,32]. In winter, the use of domestic heating is an additional source of aerosols from anthropogenic origin [33,34].
A second AGORA station is located in CP, a remote mountain site in Sierra Nevada, 12 km away (horizontally) from Granada and 1140 m higher. Due to the short horizontal distance between GRA and CP, we can assume that the measurements are performed in the same atmospheric column. Since 2010, the CP station operates only during the summertime due to weather conditions. More details can be found in [17] and [35].
Data for the present study were collected using the multiwavelength Raman lidar (LR331D400, Raymetrics S.A.) system, included in EARLINET network since April 2005. This system is located in the GRA site and is described in detail in [25,26]. Pulses are emitted at three wavelengths, namely 355, 532 and 1064 nm. The detecting system receives the backscattered radiation and splits it into the three elastic channels (355, 532 and 1064 nm), two nitrogen Raman channels (387 and 607 nm) and a water vapor Raman channel (408 nm). The system presents well-characterized depolarization capabilities at 532 nm (532-cross and 532-parallel detection channels) [36,37], thus providing aerosol profiles of the extinction, backscatter and linear depolarization ratio.
Two sun-sky CIMEL CE-318-4 (Cimel Electronique) photometers operating in the AERONET network were also used for this study: one was located in GRA and the other one was in CP. The sun-sky photometers are used to obtain column-integrated atmospheric aerosol properties [15,38]. The automatic tracking sun and sky scanning radiometer makes direct sun measurements every 15 min at 340, 380, 440, 500, 675, 870, 940 and 1020 nm (nominal wavelengths) with a 1.2° full-field of view. Aerosol optical depth (τ) is computed from these solar extinction measurements at each wavelength, except for the 940 nm channel, used to retrieve total column water vapor (or precipitable water) [39,40]. The τ estimated uncertainty is ±0.01 in the infrared–visible and ±0.02 in the ultraviolet channels [2,40]. In this study, AERONET products from both sun-sky photometers were Version 2 Level 1.5. We note that differences between Level 1.5 and Level 2.0 data are critical for the aerosol refractive index and single scattering albedo in the framework of inversions, but not for aerosol size distribution and concentration [15]. Thus, to have a larger database we used Level 1.5, applying the same restrictions in scattering angle as that for Level 2.0.

2.2. Methodology

LIRIC is based on the synergetic use of lidar and sun-sky photometer data in order to retrieve volume concentration profiles of the fine and coarse modes. Lidar elastic signals at three different wavelengths (355, 532 and 1064 nm) and sun-sky photometer-retrieved optical and microphysical properties using AERONET code [15] were used as input. More specifically, the aerosol optical depth (τ), the sphericity and the column-integrated volume concentration of the fine and coarse modes were used. The lidar depolarization information can be additionally used in order to obtain volume concentrations of the fine, coarse spherical and coarse spheroid modes. The uncertainty of LIRIC-retrieved volume concentration profiles due to the user-defined input parameters of the algorithm is below 20% [17]. More details about LIRIC can be found in [16,41,42].
Measurements were acquired during the summer of 2012. Routine measurements were performed weekly from GRA following the EARLINET strategy. Supplementary lidar measurements were performed coinciding with CALIPSO (Cloud-Aerosol Lidar and Infrared Pathfinder Satellite Observations) overpasses and under special conditions, such as biomass burning, pollution and dust events. In order to establish a more extensive climatology, additional measurements were also performed in the afternoon during weekdays.
A total of 112 profiles were retrieved simultaneously from GRA and CP stations using LIRIC. The final number of profiles was limited by the number of AERONET inversion retrievals, which are typically lower in CP. The CP station is partly covered by clouds more frequently than GRA, and measurements are also limited by the surrounding mountains that obstruct the visualization of certain scattering angles. The statistical analysis presented here included the months of July (35 retrievals during 7 days) and August (77 retrievals during 10 days). The number of retrievals varied each day depending on the number of AERONET inversions and the availability of lidar data. In the case of GRA, lidar data were used from 8000 m a.s.l. down to the surface, assuming constant values of the signal in the incomplete overlap region [43,44], which ranged between the surface and 800 m a.s.l. In the case of CP, data from 8000 m a.s.l. down to 1820 m a.s.l. were used for the retrieval, which avoided the lidar incomplete overlap region and improved the accuracy of the retrievals.

3. Results

3.1. Column-Integrated Properties and Aerosol Type Classification

Figure 1 shows the temporal evolution of the aerosol optical depth at 440 nm (τ440 nm), Angström Exponent (AE(440–870 nm)) and sphericity daily means, both for GRA and CP, for the study period. As expected, τ440 nm presented larger values above GRA, since a larger atmospheric column was measured, and it was affected by the local aerosol sources from the city, whereas the CP site is a remote site usually above the atmospheric boundary layer (ABL) of the city of Granada. However, in most of the cases, values were very close, indicating that most of the aerosol load was located above the CP altitude and typically associated with the presence of advected aerosol layers above 1820 m a.s.l. Nonetheless, similar values of the Angstrom Exponent between 440 and 870 nm (AE (440–870 nm)) were obtained for both stations, suggesting a good mixture of the different aerosol types along the atmospheric column.
For the classification of the aerosol at GRA according to their type, similar criteria to those suggested by [45] were used. Namely, cases corresponding to dust were those with an AE (440–870 nm) < 0.75 and sphericity below 30%. Mixed dust presented values of AE (440–870 nm) in the range 0.75–1 and sphericity between 30% and 60%. Finally, for the cases labelled as mixtures of different aerosol types, the AE (440–870 nm) varied between 1 and 1.5 and the sphericity was larger than 60%.
A great majority of the cases (70%) corresponded to mineral dust, which agrees with the statistical analysis of backward trajectories at Granada station [46]. The vertical distribution of dust was observed at Granada station using lidar measurements in previous studies [19,26,47]. Mixed dust was observed for 24% of the cases, and only 6% corresponded to a mixture of different aerosol types.

3.2. Microphysical Properties Profiles

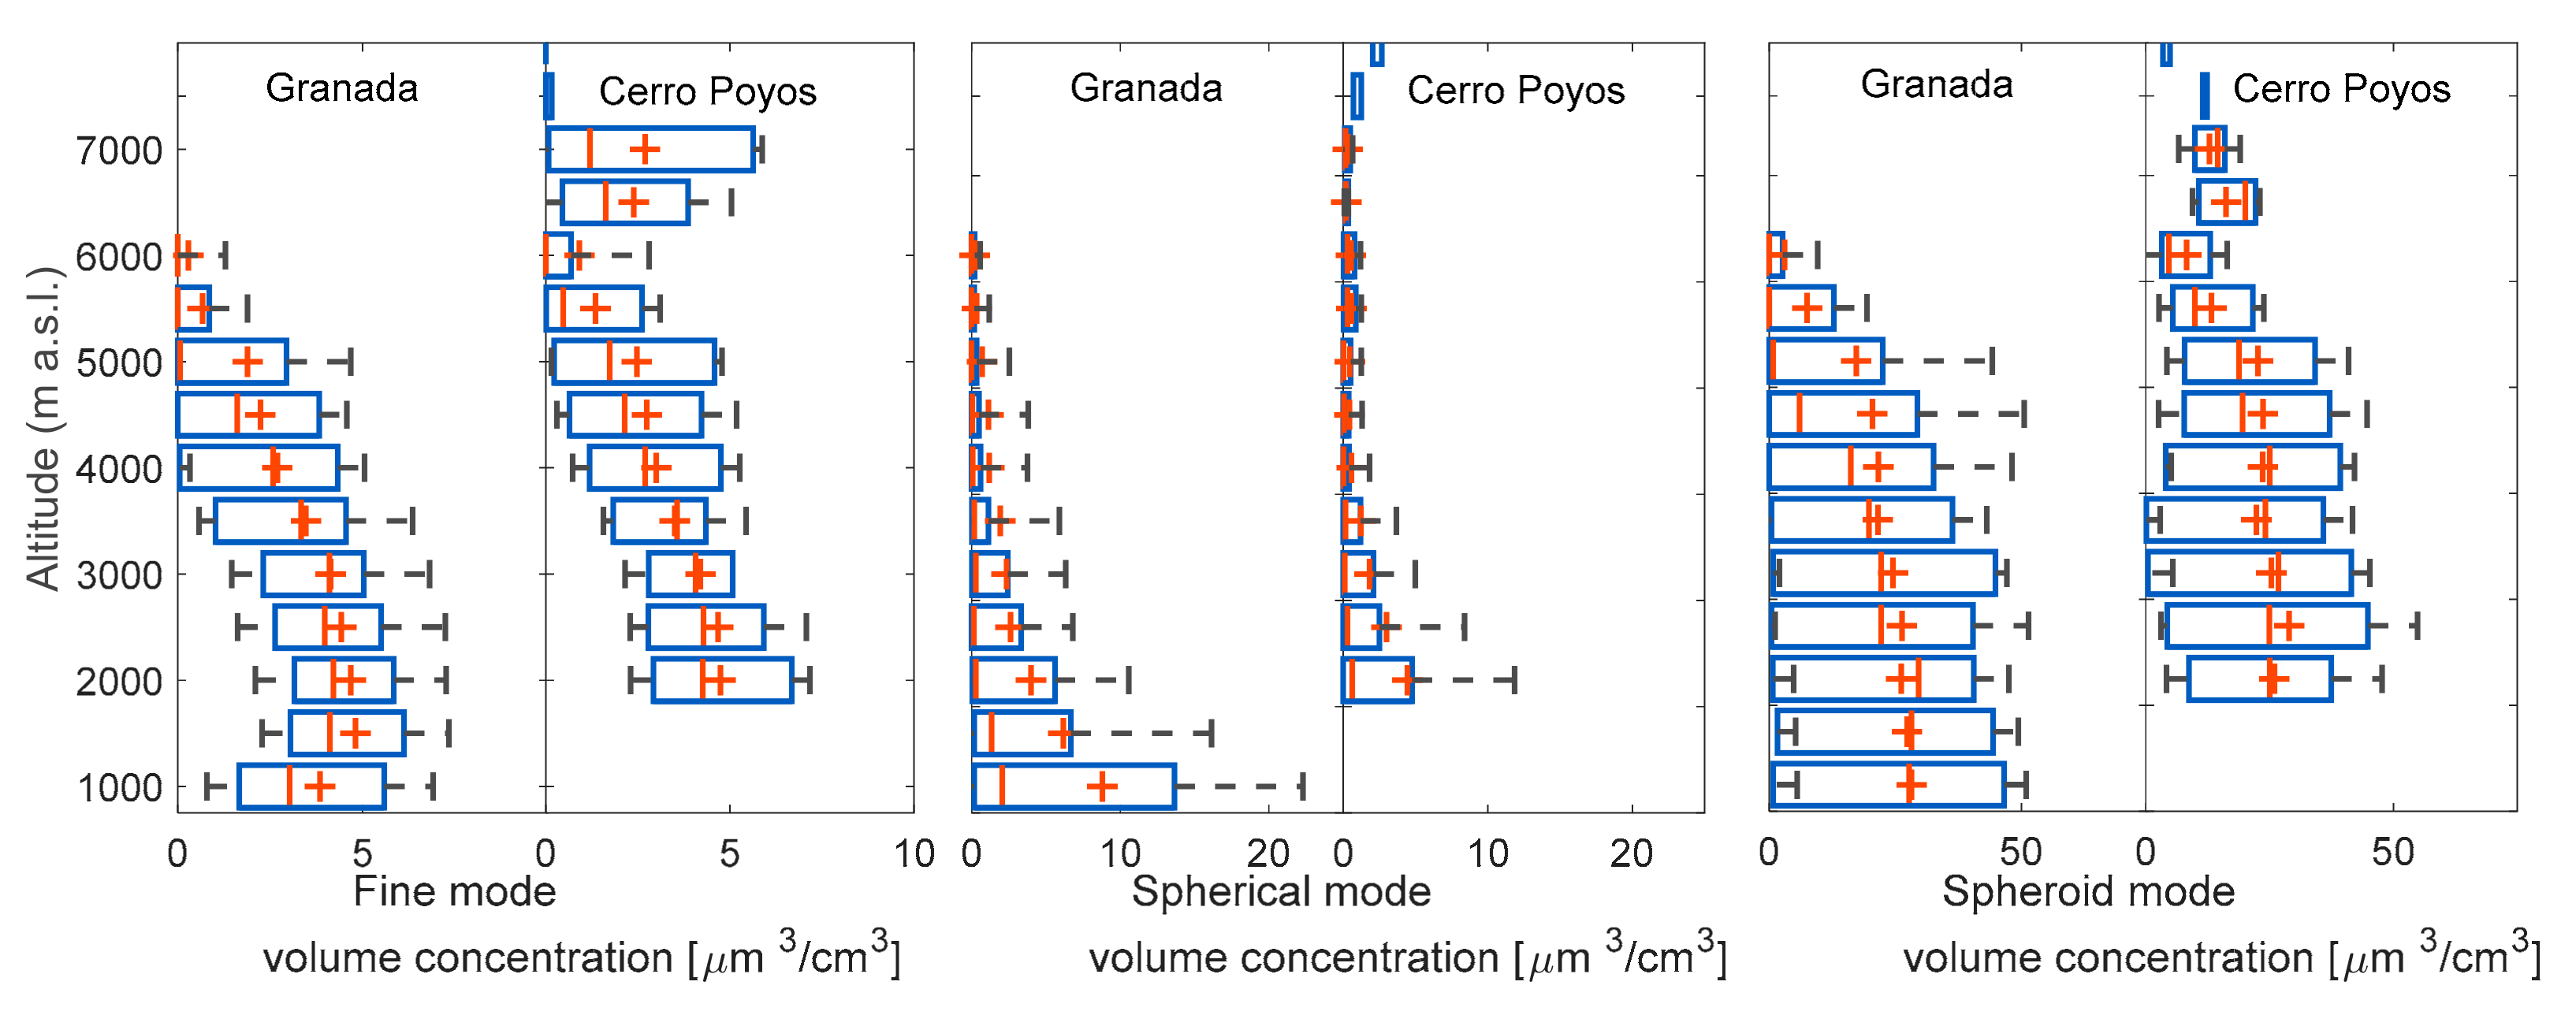
The volume concentration profiles (fine, spherical and spheroid modes) obtained by the LIRIC algorithm using GRA and CP data are presented in Figure 2. Figure 2 shows a box-and-whiskers diagram with the main statistical parameters for the 112 retrievals obtained from each AERONET station considering 500-m layers. As observed, there was a clear predominance of the coarse spheroid mode. This result agrees well with the aerosol type classification, since 70% of the cases corresponded to mineral dust and the sphericity was below 30% according to our classification. The fine and coarse spherical modes presented very low concentrations, with both median and mean values below 10 μm3/cm3. Maximum values up to 20 μm3/cm3 for the fine mode and 60 μm3/cm3 for the coarse spherical mode were observed. These maximum values were found only in the lowermost layers in the retrieval from GRA, below the altitude of CP. Considering the retrieval from CP, maximum values for the fine and the spherical mode were 15 and 40 μm3/cm3, respectively. The slightly larger values of the fine and especially the coarse spherical mode observed below 2000 m a.s.l. at GRA station may be related to the contribution from local sources located at the surface, such as traffic emissions or local fires. Since the mixing layer remains usually below the altitude of CP station [48], these particles hardly reached the second station, and their contribution was not detected by the sun-sky photometer at a higher level. Nonetheless, it is worthy to also consider the effects of the incomplete overlap and the larger uncertainties affecting LIRIC retrievals in this height range. The lidar signal was affected by incomplete overlap up to 800 m above the GRA station [43,44], and LIRIC retrievals presented larger uncertainties in this region, as demonstrated in [17]. In both stations, the predominant coarse spheroid mode presented mean values ~30 μm3/cm3. Slightly larger values were obtained in the lowermost height ranges. An important decrease was observed above 5500 m a.s.l., where the volume concentration dropped towards zero. Maximum values were 120 and 130 μm3/cm3 in the retrievals from GRA and CP, respectively. The large standard deviation (from 5 to 25 μm3/cm3 depending on the height range), interquartile range (up to 48 μm3/cm3) and extreme values indicated a strong variability. This resulted from the variability in the frequency of dust events as indicated by [49]. As discussed in [49], aerosol particles reach quite high altitudes (up to 6000 m a.s.l.) during summer, mainly due to two factors: the larger values of the atmospheric boundary layer height [50] and the frequent long-range transport of aerosol particles in the free troposphere [e.g., 27,28,31,53]. Comparing the mean values of the retrievals from both stations, high agreement was found, with differences below 5 μm3/cm3. Volume concentrations equal to 0 μm3/cm3 were observed above 6000 m a.s.l from GRA, whereas from CP some scattered data were observed above this altitude. The number of data available over 6000 m a.s.l. was quite reduced (11 data points); therefore, the statistic is not significant and no significant conclusions can be inferred from these few points. Actually, these points are outliers mostly associated with situations with low aerosol load and noisy lidar signals, in which LIRIC retrieval is not reliable at high altitudes.
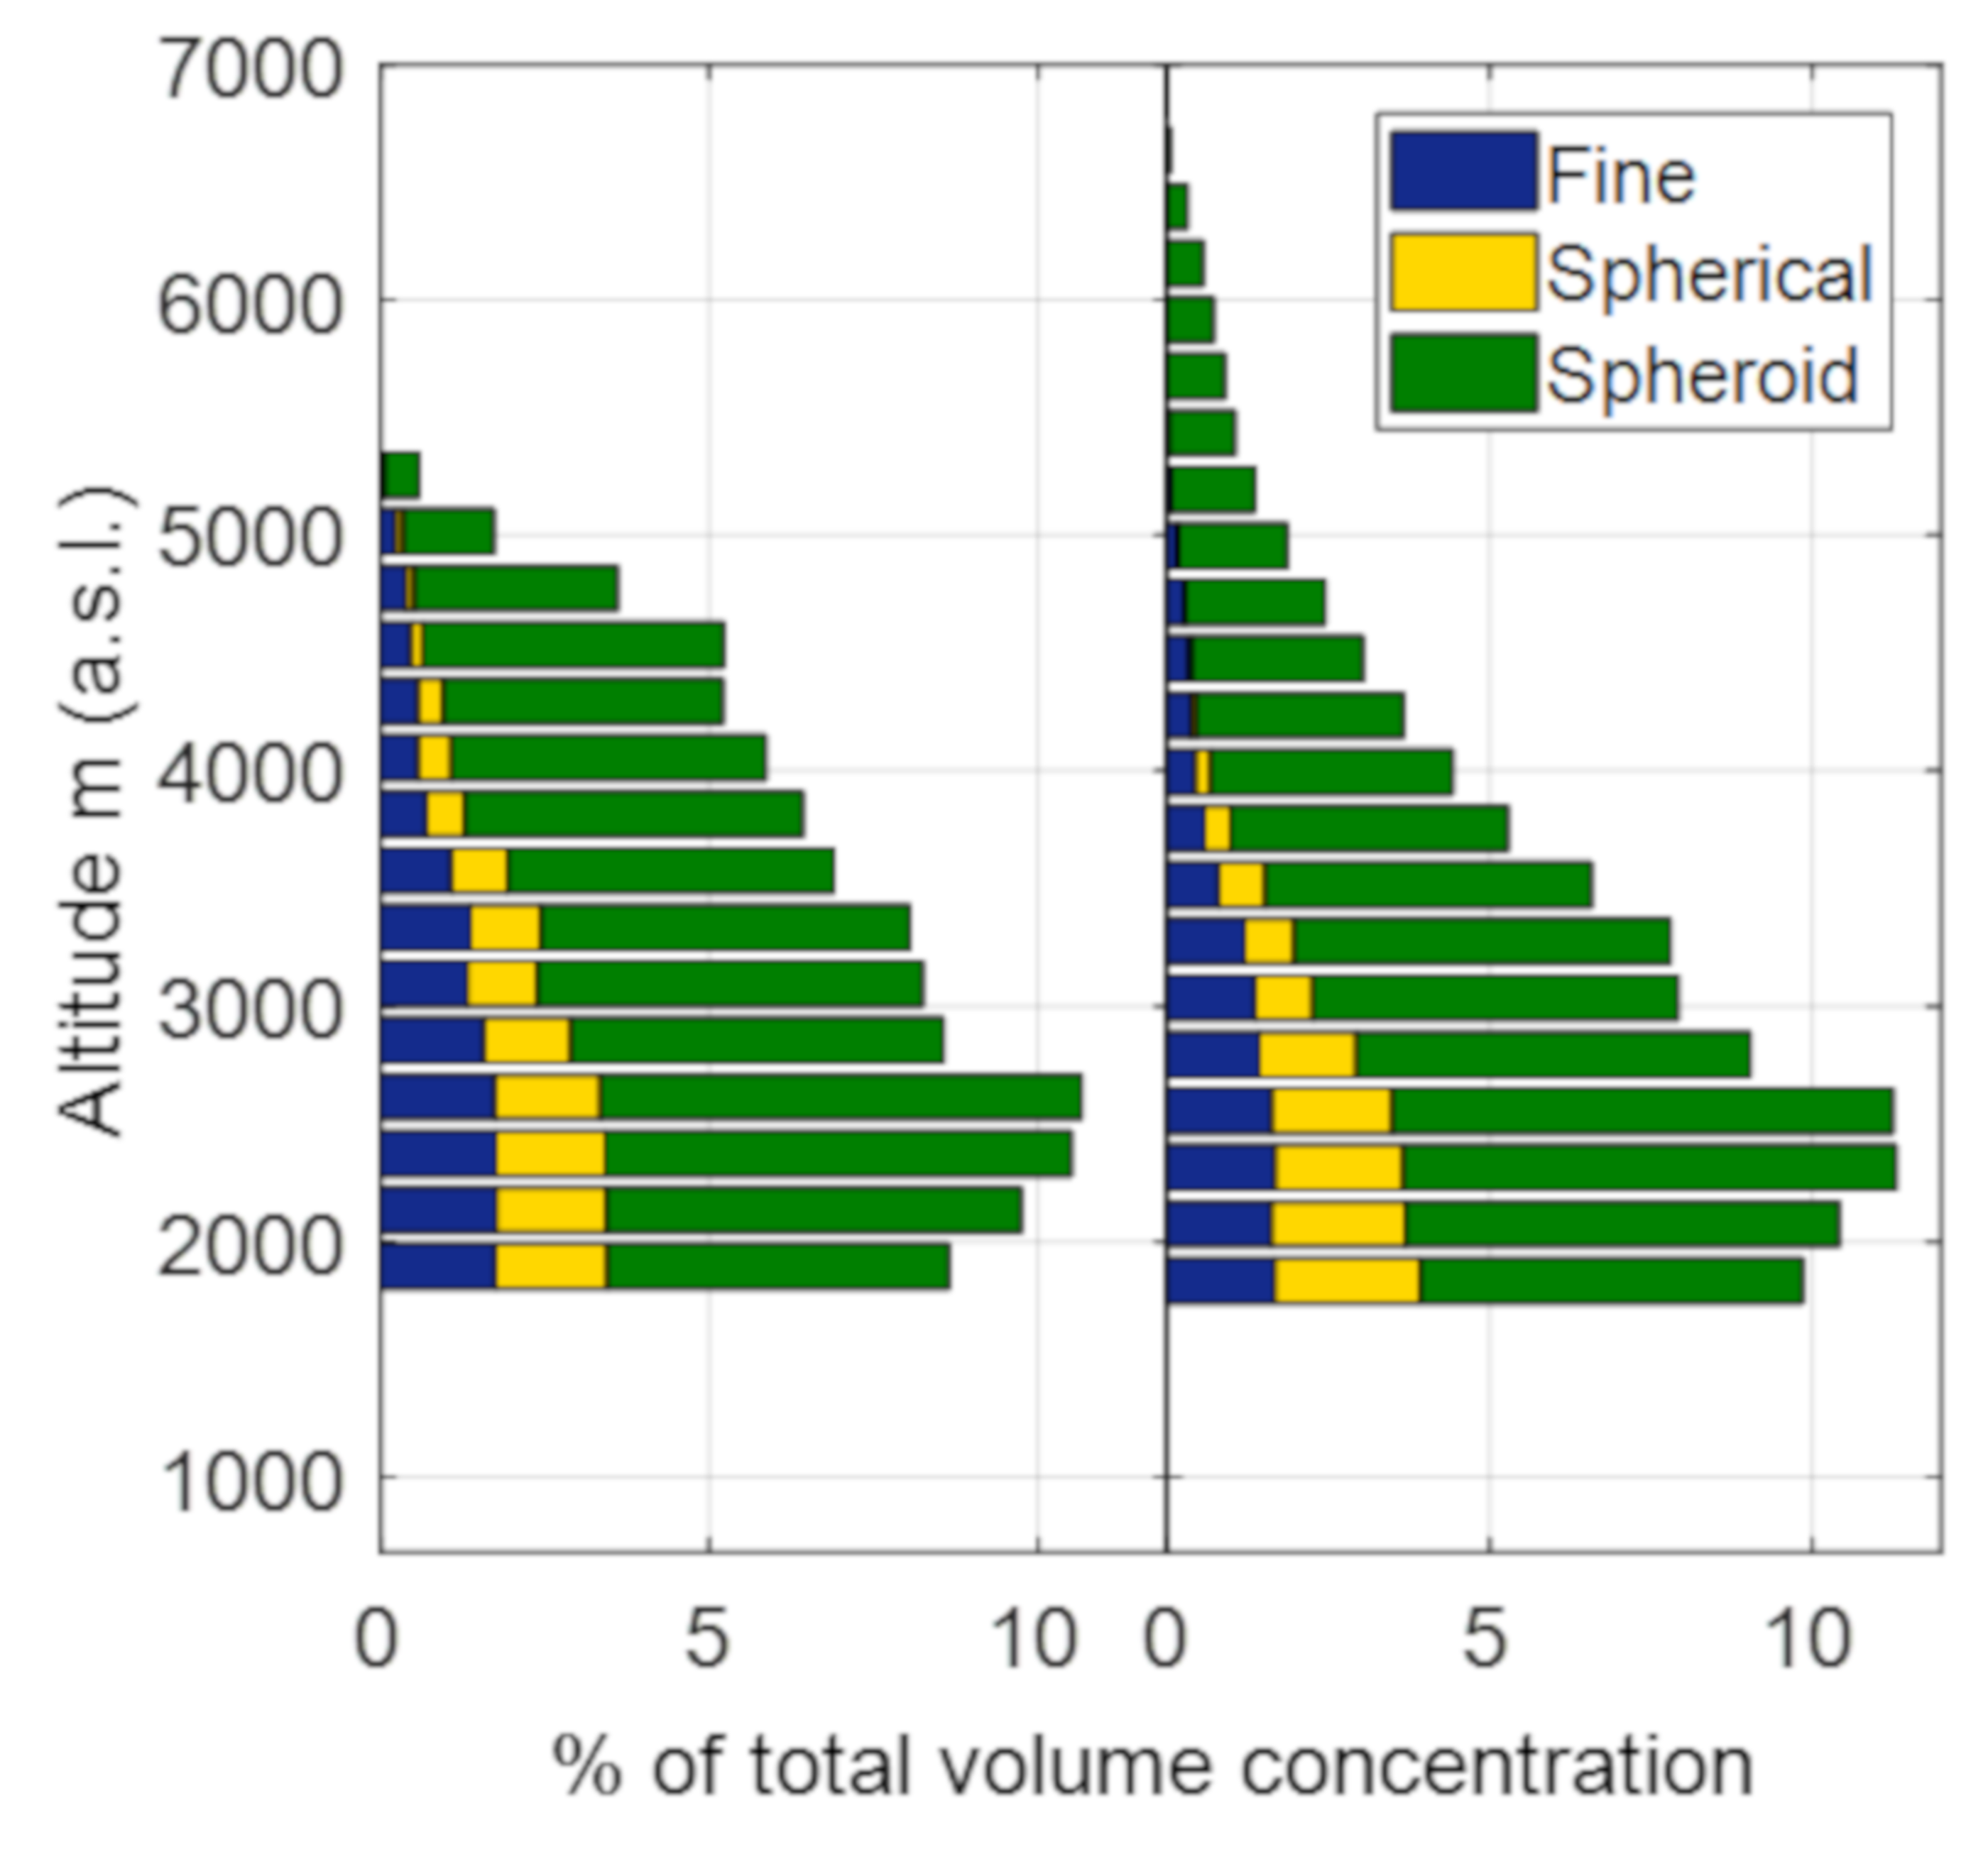
In order to compare the retrievals from GRA and CP, only the height range corresponding to altitudes above 1820 m a.s.l. of the profiles retrieved from GRA were considered. Figure 3 shows the distribution of the volume concentrations by height levels in percentages. The length of the bars indicates the contribution of every layer to the total volume concentration for the whole period. Inside each bar, the different colors indicate the apportionment to the total volume concentration in the corresponding height range by the fine, coarse spherical and coarse spheroid modes. As we can see, the largest aerosol loads were located between 2000 and 3000 m a.s.l., and a very low portion was observed above 5000 m a.s.l. Actually, retrieval from CP tended to distribute above 5000 m some of the aerosol load that retrieval from Granada located in the layers between 4000 and 5000 m a.s.l.
The apportionment of the fine mode to each layer was very similar at both stations. However, larger differences were observed for the coarse spherical mode. For GRA, the contribution was almost constant up to 3500 m a.s.l., and some values were observed up to 5000 m a.s.l. On the other hand, for CP, a larger apportionment of the spherical mode was observed for the lower layers up to 2750 m, and no contribution was observed above 4500 m a.s.l. The spheroid mode was clearly predominant in every layer, always representing more than 60% of the total volume concentration.
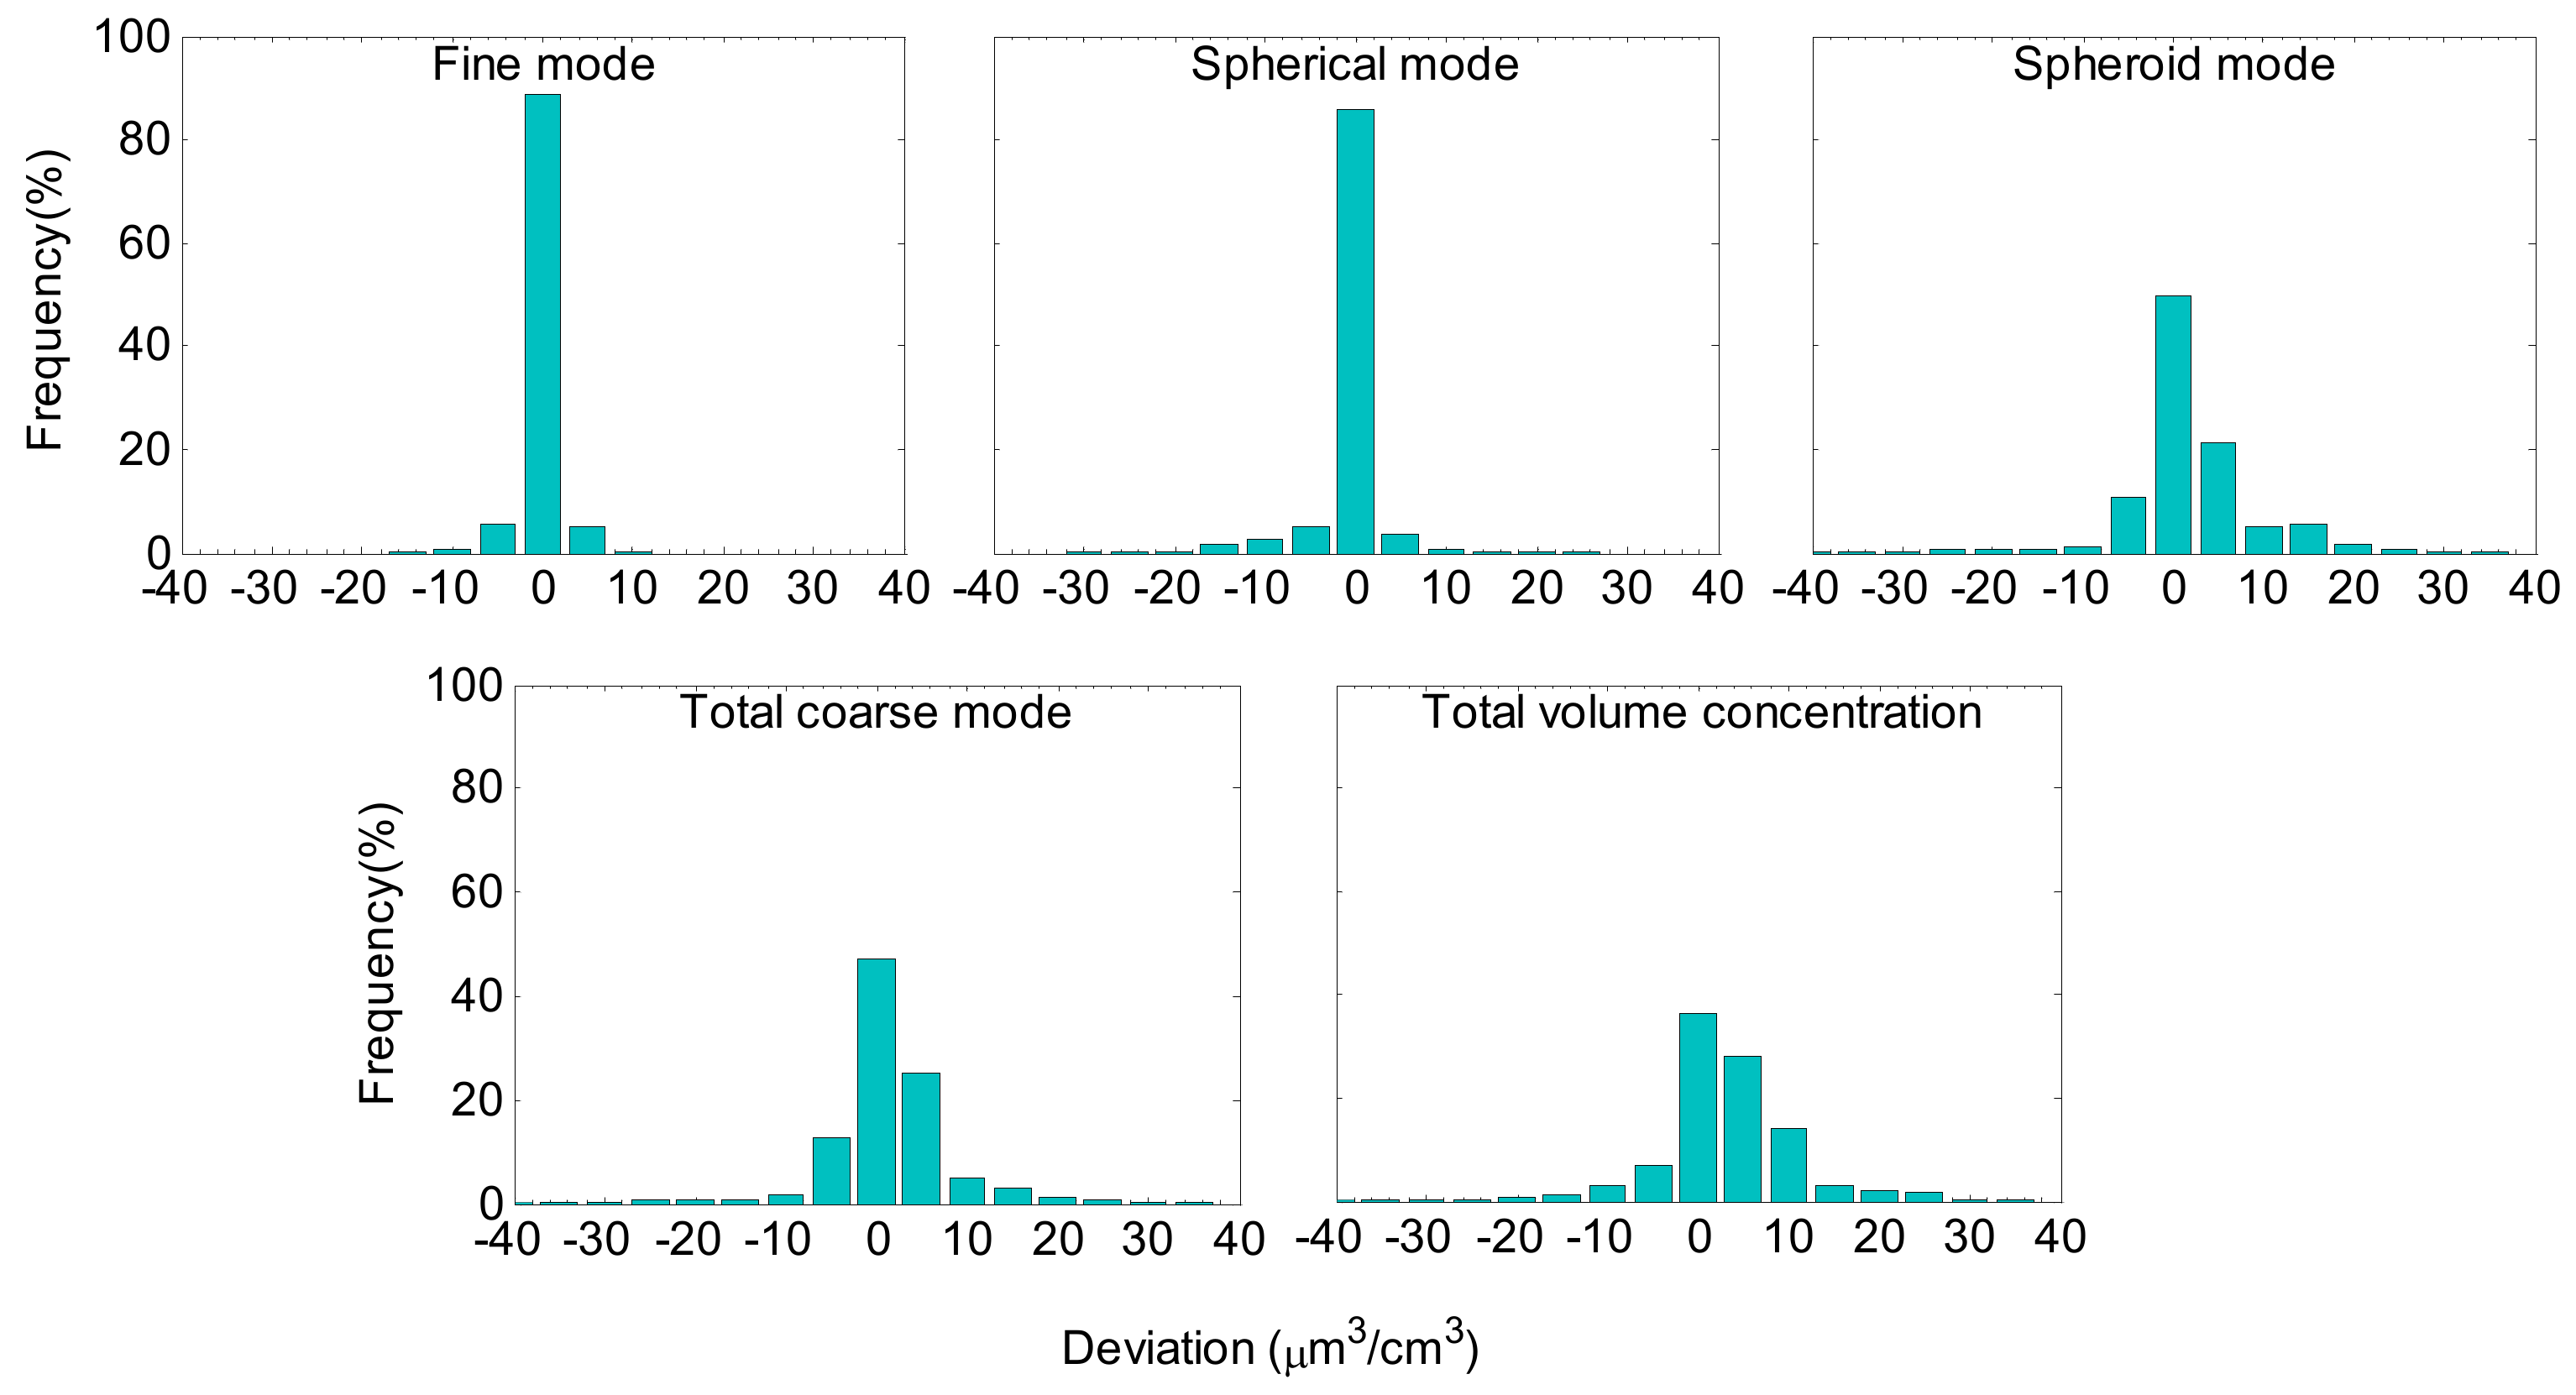
Figure 4 shows the frequency distributions of the volume concentration values obtained, with LIRIC retrievals from both stations. For the retrievals from GRA station, only points above 1820 a.s.l. were considered (altitude of CP stations). According to the frequency distribution of the fine mode, 90% of the data corresponded to volume concentrations below 10 μm3/cm3. For the coarse spherical mode, a small fraction of the data reached values up to 40 μm3/cm3, but 90% of the values were below 5 μm3/cm3. The coarse spheroid mode presented a much more homogeneous distribution, with 95% of the data in the range 0–60 μm3/cm3. The total coarse mode and the total volume concentration presented distributions similar to the one of the coarse spheroid mode, although the fraction of data corresponding to the bin 0–5 μm3/cm3 was much lower. The frequency distributions were very similar for every mode at both stations, as it could be expected from the comparison of the mean profiles. Some small discrepancies were observed, i.e., the frequency of total volume concentration values below 25 μm3/cm3 was larger in the retrieval from GRA than from CP.
In order to better explain the slight differences observed in Figure 3 and Figure 4 between the retrievals from GRA and CP, the deviations between the profiles retrieved from both stations are presented in Figure 5. These deviations were calculated by subtracting the vertically resolved volume concentration profiles from GRA above 1820 m a.s.l. to those retrieved from CP for each mode. Besides the fine, coarse spherical and coarse spheroid modes, calculations were also performed for the total coarse mode (spherical plus spheroid) and the total volume concentration (sum of the three modes). For the fine mode, the deviations were always below 5 μm3/cm3, since the volume concentrations for this mode were very low. In the case of the spherical mode, 95% of the values presented an absolute deviation lower than 5 μm3/cm3. However, deviations as large as −15 μm3/cm3 were also obtained. The deviations for the spheroid mode exhibited a larger range of variation, with 90% of the data distributed between −5 and 15 μm3/cm3. Nonetheless, 50% of the data presented deviations close to 0, indicating very good agreement between both retrievals. For the total coarse mode, the histogram was basically the same as the one obtained for the coarse spheroid mode, since it was the predominant mode, as observed in Figure 2. The total volume concentration presented deviations lower than 5 μm3/cm3 (in absolute value) for 70% of the data and below 10 μm3/cm3 for 90% of the data, which is indicative of the good agreement between both retrievals. Seventy percent of the data points exhibited positive deviations, indicating that the total volume concentration retrieved from CP was larger than that retrieved from GRA. This was observed also in the results presented in Figure 2 and may be related to the effect of the incomplete overlap in the lowermost height region of the profiles retrieved from GRA. Underestimation of the volume concentration above 1820 m a.s.l. could be associated to an overestimation in the lower height range of the retrievals from GRA, which are affected by a larger uncertainty because of the incomplete overlap of the lidar signals in this region [17].
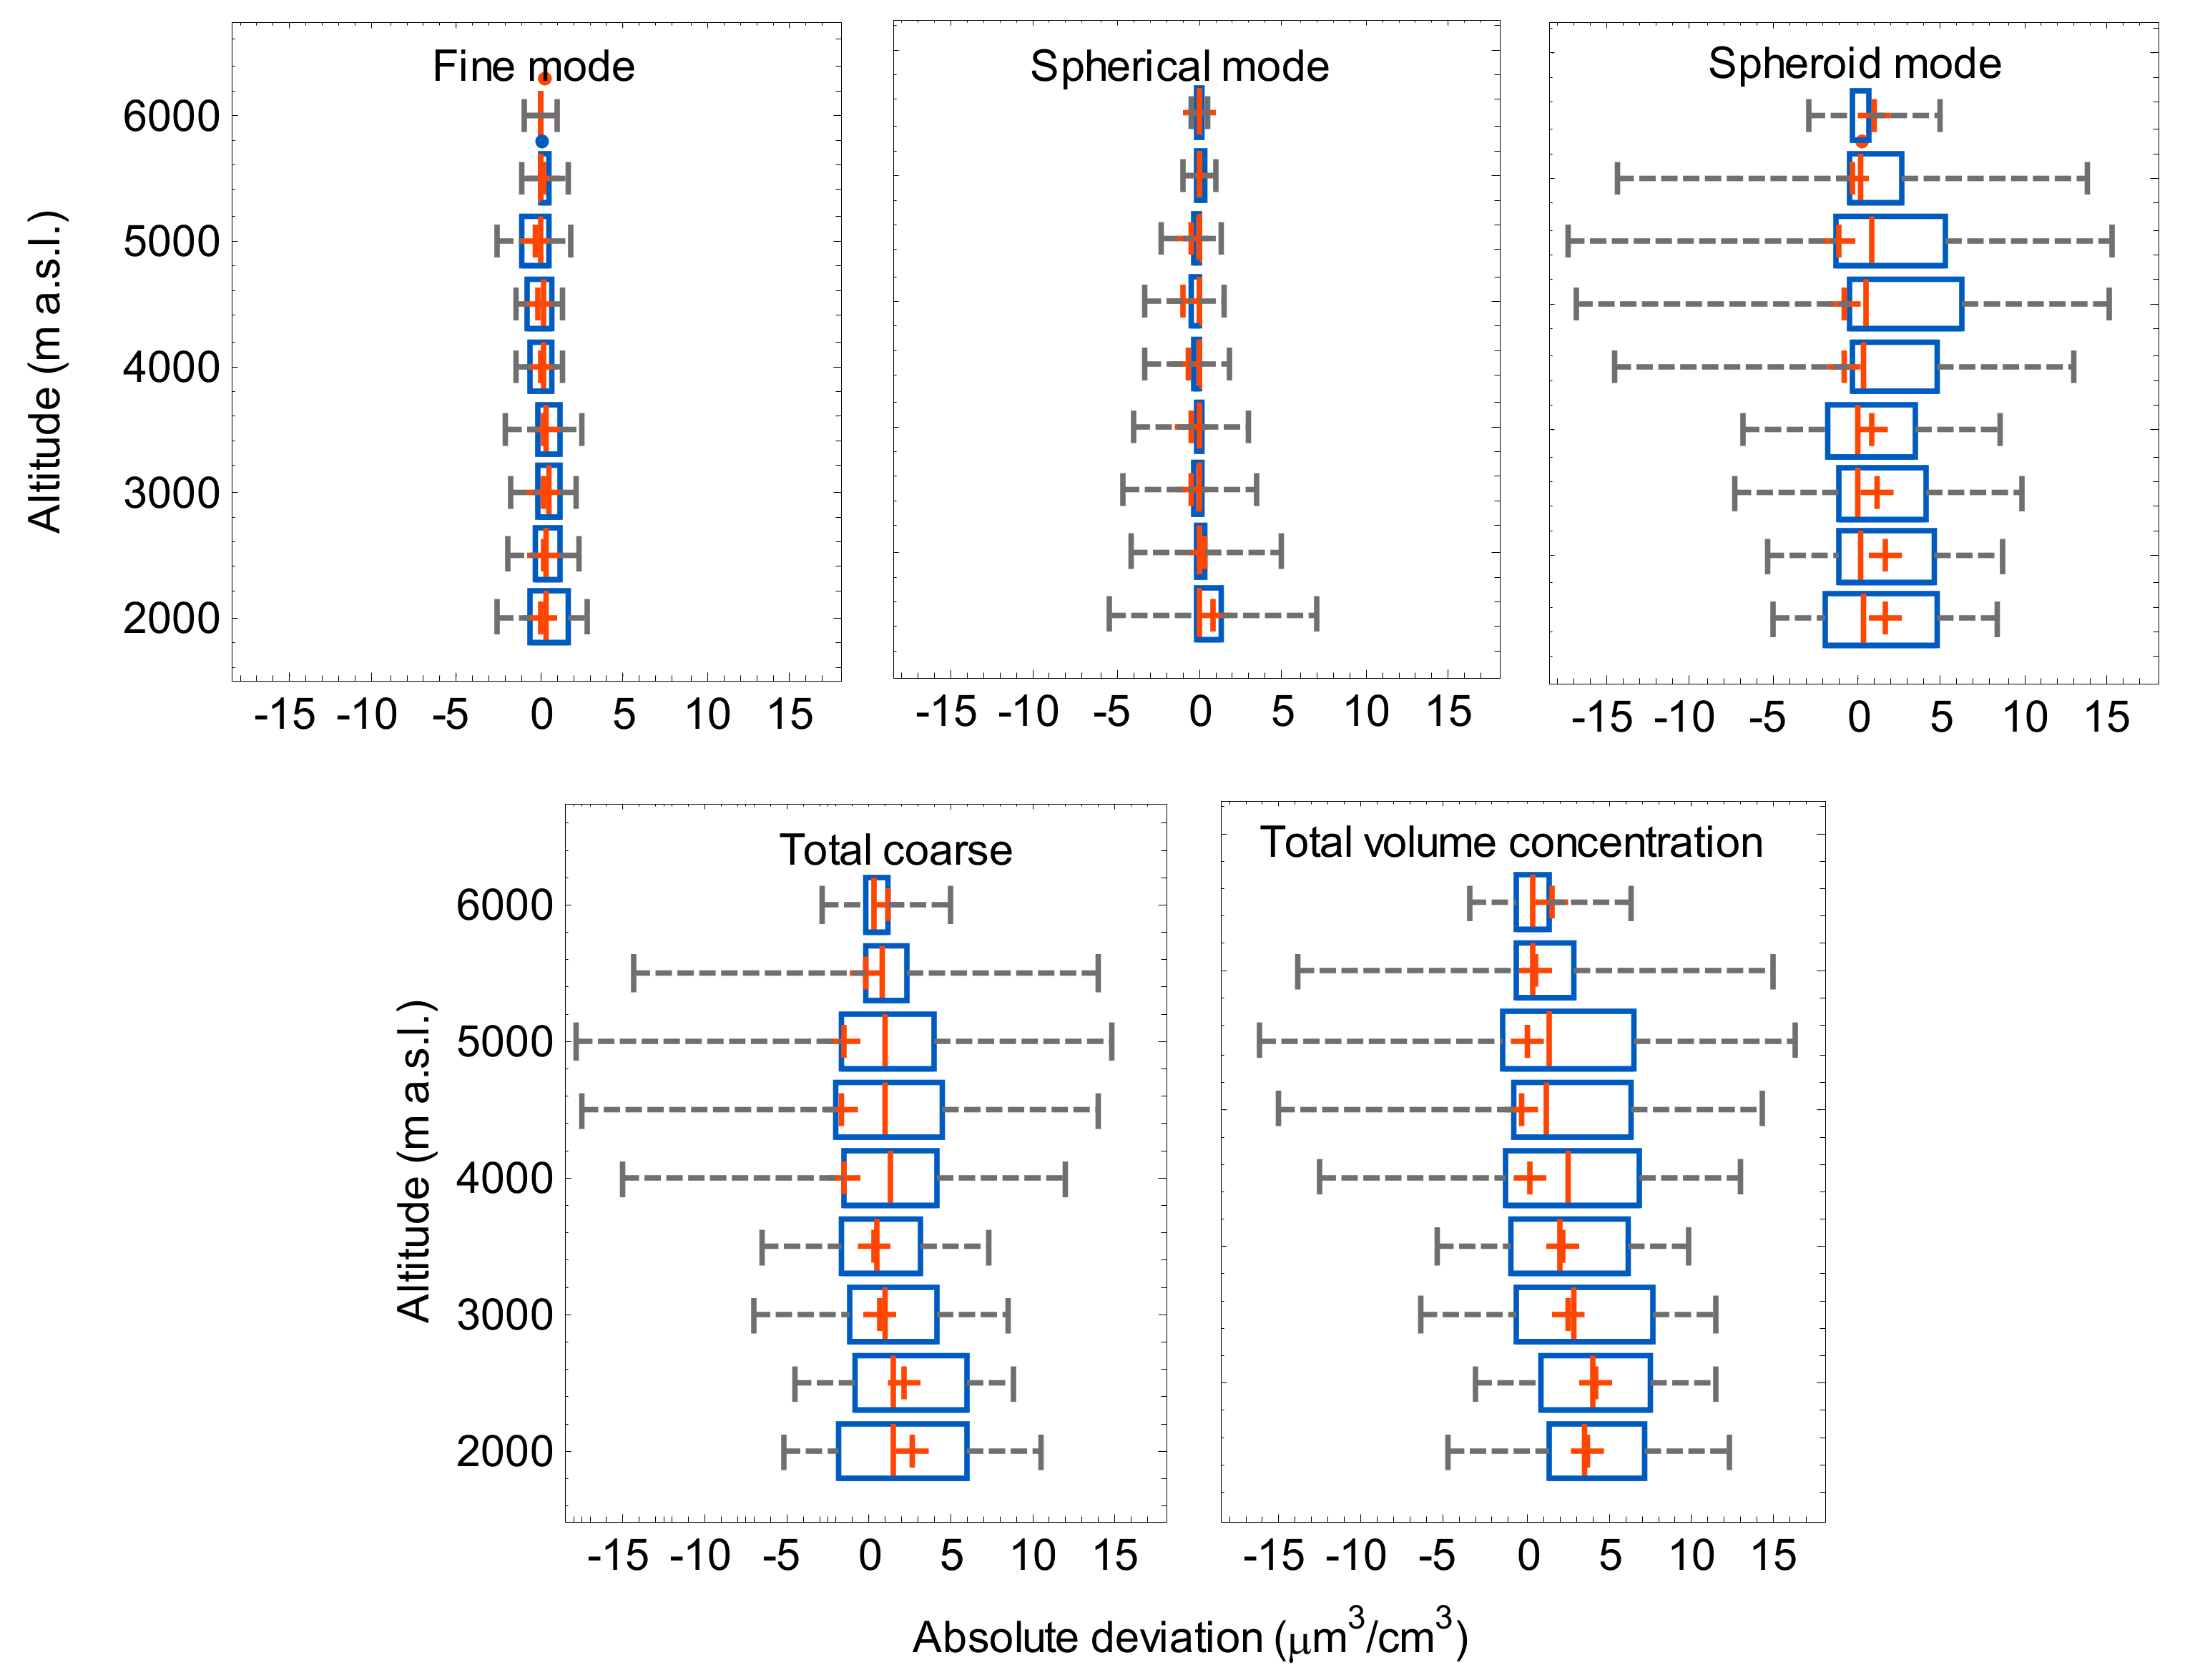
To further investigate the variation of the deviations with height, box-and-whiskers plots corresponding to the absolute deviations in layers of 500 m are represented in Figure 6. For the fine and spherical modes, the mean values of the deviation were always close to zero, and the standard deviations were mainly in the range ±5 μm3/cm3, since the profiles corresponding to these modes presented usually very low values. However, for the coarse spheroid mode, the deviations were larger, with mean values between −2 and 4 μm3/cm3 and standard deviations ranging from −17 to 16 μm3/cm3. The interquartile range also exhibited larger values than in the fine and spherical modes, indicating larger variability of the spheroid mode during the analysed period. This larger variability may be related to the differences in the sphericity parameter retrieved by AERONET at both stations. This parameter is affected by large uncertainties, especially in those cases when the aerosol load is not very high. The deviation values were mainly positive, indicating that for the spheroid mode, the volume concentration values retrieved were usually larger in the retrieval from CP, as observed also in Figure 4. The largest variability in the absolute deviations was observed between 4 and 6 km a.s.l., as already noticed in Figure 2, where larger standard deviations were observed in the retrieval from GRA than in that from CP. The total coarse mode and the total volume concentration profile plots were very similar to the plot of the coarse spheroid mode, since it was clearly predominant, as inferred from the previous results. The limits of the boxes corresponding to the total volume concentration always presented positive values, confirming that the volume concentration retrieved from the CP station was slightly larger. This again may be an indicator that, in the retrieval from GRA, the aerosol volume concentration in the layer between the surface and 1820 m a.s.l. (below CP) is being slightly overestimated, as it was previously indicated. It is worth noting that this region is affected by incomplete overlap of the lidar system and more affected by the uncertainties as discussed in [17]. This overestimation of the volume concentration profiles retrieved from GRA in the lowermost height level and the consequent underestimation above 1820 m a.s.l. was also confirmed by the height-integrated volume concentration values. The volume concentration profiles retrieved from GRA were integrated in the height range between 1820 m a.s.l. and the top of the profiles. When compared to the integrated volume concentration profiles retrieved using CP AERONET data, 85% of the values were lower in the case of GRA retrieval.
Scatter plots of the vertically resolved profiles retrieved simultaneously above GRA and CP were also obtained for the 112 retrievals (not shown). As previosly indicated, in the retrieval from GRA, only those data above 1820 m a.s.l. were considered. Linerar fits were calculated, and 112 correlation coefficients (R) corresponding to these linear fits between both retrievals were obtained. R values greater than 0.6 were obtained for 80% of the 112 retrievals for all the modes. For the coarse spheroid mode and the total volume concentration profiles, correlation values of 1 were obtained in 73% and 77% of the profiles, respectively. Negative values of R were also observed, although only for 12% of the cases for the fine and the spherical modes. These cases were reviewed in detail, and it was observed that this occurred mainly in those profiles where the volume concentration was below 7 μm3/cm3. For these profiles, the variations with height were more related to noise than to real aerosol vertical distribution. For the different analysed modes, most of the data presented values of the slope around one, i.e., at least 65% of the profiles for all the modes, except for the spherical one with 50%.
It is also remarkable that as much as 40% of the data for this mode were grouped around zero. After reviewing 40% of the cases in detail, it was observed that there were three possible scenarios. Around 85% of them corresponded to situations where the volume concentration of the spherical mode was very low (usually close to zero) in comparison to the total volume concentration. A small fraction (~4 %) corresponded to situations where different aerosol types were observed above and below CP (as in [17]). These situations were not very often during summer 2012, and it seems that even though the methodology presents some weakness in these special cases that should be excluded, they did not introduce much uncertainty in the statistical analysis. Finally, the third scenario corresponds to those cases when the aerosol load was very low above CP (~10% of the cases). For these cases, retrieval of the sphericity parameter was affected by high uncertainties (especially if it has extreme values), and there were enormous differences between the sphericity assumed at GRA and that assumed at CP. Consequently, for these cases the spheroid mode also presented slope values close to zero. However, for the total coarse mode, the agreement and the slope were quite good. The sphericity parameter needs to be carefully reviewed when making this kind of statistical comparison. The distinction between spherical and spheroid particles within the coarse mode is not reliable in cases with extreme sphericity values, precisely due to the large uncertainties in the sphericity parameter. Therefore, for further statistical analysis, these cases should be either rejected or depolarization should not be considered, retrieving only the total coarse mode.

4. Conclusions

The analysis presented in this work has been used to evaluate LIRIC algorithm retrievals with a unique setup of AERONET sun-photometers at two different altitudes collocated approximately in the same atmospheric column. Lidar measurements were collocated with the sun photometer operating at the lowest altitude. This setup operated continuously during summer 2012 in the surroundings of the city of Granada, Southeastern region of the Iberian Peninsula, and was frequently affected by Saharan dust intrusions.
Sun-sky photometer measurements of the aerosol optical depth at 440 nm at both Granada (GRA) and Cerro Poyos (CP) stations presented similar results, suggesting that most aerosol particles were located above both stations and were explained by the strong presence of advected aerosol layers at high altitudes. Classification of the aerosol types indicated that a large number of long-range transport dust events (presence larger than 60%) affected the experimental site, which was reflected by the predominance of the coarse spheroid mode in the retrievals by LIRIC. The volume concentration had a mean value of 46 μm3/cm3, with the mean value of the coarse spheroid mode equal to 60 μm3/cm3. Values up to 20, 60 and 130 μm3/cm3 were obtained for the fine, coarse spherical and coarse spheroid modes, respectively, and, in general, a large variability was observed due to the variations in the frequency of the dust events above the Southeastern Iberian Peninsula, as observed in previous studies over the same region. Aerosol layers reached up to 6000 m a.s.l., which is also in agreement with previous studies performed over the Southeast of Spain.
Besides the statistical analysis, use of the sun-sky photometer measurements at the two stations allowed us to compare LIRIC retrievals from two different height levels using independent sun-sky photometer data. For 90% of the intercomparisons, differences between both profiles were minimum and were, generally, within the uncertainties associated with LIRIC, especially for fine and coarse spheroid modes. The spherical mode also agreed quite well, but larger discrepancies than for the other two modes were observed in the height range close to CP station. Nevertheless, some differences were expected because of the effects of the incomplete overlap in the retrieval from GRA and the very low aerosol load above CP in some cases.
A more detailed analysis considering the variations in the different layers also revealed quite a good agreement with height, except in the upper part of the profiles. In this uppermost part, the retrievals from CP tended to distribute some of the aerosol load up to higher altitudes than the retrievals from UGR in some cases.
Cases with significant differences observed when comparing the spherical and spheroid modes between Granada and Cerro Poyos profiles were found. For these cases, we found three possible explanations: (i) situations with very low volume concentration values; (ii) situations with different aerosol types above and below CP station height (~2% of the total cases) and (iii) situations with very low aerosol load above Cerro Poyos, which led to large uncertainties in the retrieval of the sphericity parameter. For the three exposed situations, very different values of the sphericity parameter were obtained from the two sun photometers. Thus, some assumptions need to be carefully reviewed, that is, the height independency of the size distribution or the sphericity, and the performance of the LIRIC algorithm under very low aerosol load conditions, associated with larger uncertainties of the aerosol-retrieved properties. All these situations are inherent with limitations in the hypothesis used in LIRIC, and the use of depolarization information is not recommended for these cases.
In spite of the general good agreement, larger values of the total volume concentration were obtained above 1820 m a.s.l. in the retrieval from CP than in the retrieval from GRA. Underestimation of the volume concentration values above 1820 m a.s.l. in the retrieval from GRA may be associated with an overestimation of the profiles in the lowermost part. According to these results, the way the incomplete overlap effects were considered in this region by LIRIC and the assumption of constant volume concentration values below the incomplete overlap height should be reviewed in order to improve the algorithm results. Therefore, considerations about the impact of incomplete overlap must be taken into account when systematically applying LIRIC to the different EARLINET lidar systems.

Author Contributions

Conceptualization, M.J.G.-M. and L.A.-A.; Formal analysis, M.J.G-.M. and J.A.B.-O.; Funding acquisition, L.A.-A.; Investigation, M.J.G.-M., D.P.-R., H.L. and A.V.; Methodology, J.A.B.-O.; Project administration, F.J.O.; Resources, J.A.B.-A. and F.N.-G.; Supervision, J.L.G.-R.; Visualization, M.J.G.-M.; Writing—original draft, M.J.G.-M.; Writing—review and editing, J.A.B.-O., D.P.-R., H.L., J.L.G.-R., J.A.B.-A., F.N.-G., A.V., F.J.O. and L.A.-A. All authors have read and agreed to the published version of the manuscript.

Funding

This work was supported by the Spanish Ministry of Economy and Competitiveness through projects CGL2016-81092-R, and CGL2017-83538-C3-1-R; the Excellence network CGL2017-90884-REDT; by the European Union’s Horizon 2020 research and innovation program through ACTRIS project (grant agreement n. 654169).

Acknowledgments

The authors thank the FEDER program for the instrumentation used in this work and the University of Granada for supporting this study through the Excellence Units Program “Plan Propio. Programa23 Convocatoria 2017”. CIMEL Calibration was performed at the AERONET-EUROPE calibration center, supported by ACTRIS. We also express our gratitude to the developers of the LIRIC algorithm and software. The authors thank Sierra Nevada National Park for support in the maintenance of the Sun-sky photometer station at Cerro Poyos. Maria J. Granados-Muñoz is funded by a Maria Sklodowska-Curie IF under grant agreement no. 796539. Juan Antonio Bravo-Aranda and Antonio Valenzuela received funding from the Marie Sklodowska-Curie Action Cofund 2016 EU project Athenea3i under grant agreement no. 754446. Jose Antonio Benavent-Oltra is funded by the University of Granada through “Plan Propio. Programa 7, Convocatoria 2019”. This work was also supported by the Ambizione program of the Swiss National Science Foundation (project no. PZ00P2 168114).

Conflicts of Interest

The authors declare no conflict of interest

References

  1. IPCC. Climate Change 2013: The Physical Science Basis, Contribution of Working Group I to the Fifth Assessment Report of the Intergovernmental Panel on Climate Change; IPCC: Geneva, Switzerland, 2013. [Google Scholar]
  2. Holben, B.N.; Eck, T.F.; Slutsker, I.; Tanré, D.; Buis, J.P.; Setzer, A.; Vermote, E.; Reagan, J.A.; Kaufman, Y.J.; Nakajima, T.; et al. AERONET—A federated instrument network and data archive for aerosol characterization. Remote Sens. Environ. 1998, 66, 1–16. [Google Scholar] [CrossRef]
  3. Nakajima, T.; Yoon, S.C.; Ramanathan, V.; Shi, G.Y.; Takemura, T.; Higurashi, A.; Takamura, T.; Aoki, K.; Sohn, B.J.; Kim, S.W.; et al. Overview of the Atmospheric Brown Cloud East Asian Regional Experiment 2005 and a study of the aerosol direct radiative forcing in east Asia. J. Geophys. Res. Atmos. 2007, 112, D24S91. [Google Scholar] [CrossRef]
  4. Pappalardo, G.; Amodeo, A.; Apituley, A.; Comeron, A.; Freudenthaler, V.; Linné, H.; Ansmann, A.; Bösenberg, J.; D’Amico, G.; Mattis, I.; et al. EARLINET: Towards an advanced sustainable European aerosol lidar network. Atmos. Meas. Tech. 2014, 7, 2389–2409. [Google Scholar] [CrossRef] [Green Version]
  5. Welton, E.J.; Campbell, J.R.; Spinhirne, J.D.; Berkoff, T.A.; Holben, B.; Tsay, S.; Bucholtz, A.; Reid, E.; Welton, E.J.; Campbell, J.R.; et al. An Aerosol Extinction-to-Backscatter Ratio Database Derived from the NASA Micro-Pulse Lidar Network: Applications for Space-based Lidar Observations. AGUFM 2004, 2004, A11C-0081. [Google Scholar]
  6. Guerrero-Rascado, J.L.; Landulfo, E.; Antuña, J.C.; de Melo Jorge Barbosa, H.; Barja, B.; Bastidas, Á.E.; Bedoya, A.E.; da Costa, R.F.; Estevan, R.; Forno, R.; et al. Latin American Lidar Network (LALINET) for aerosol research: Diagnosis on network instrumentation. J. Atmos. Sol. Terr. Phys. 2016, 138–139, 112–120. [Google Scholar] [CrossRef]
  7. Antuña-Marrero, J.C.; Landulfo, E.; Estevan, R.; Barja, B.; Robock, A.; Wolfram, E.; Ristori, P.; Clemesha, B.; Zaratti, F.; Forno, R.; et al. LALINET: The First Latin American–Born Regional Atmospheric Observational Network. Bull. Am. Meteorol. Soc. 2017, 98, 1255–1275. [Google Scholar] [CrossRef]
  8. Shimizu, A.; Sugimoto, N.; Matsui, I.; Arao, K.; Uno, I.; Murayama, T.; Kagawa, N.; Aoki, K.; Uchiyama, A.; Yamazaki, A.A. Continuous observations of Asian dust and other aerosols by polarization lidars in China and Japan during ACE-Asia. J. Geophys. Res. D Atmos. 2004, 109, D19S17. [Google Scholar] [CrossRef]
  9. Granados-Muñoz, M.J.; Sicard, M.; Román, R.; Benavent-Oltra, J.A.; Barragán, R.; Brogniez, G.; Denjean, C.; Mallet, M.; Formenti, P.; Torres, B.; et al. Impact of mineral dust on shortwave and longwave radiation: Evaluation of different vertically resolved parameterizations in 1-D radiative transfer computations. Atmos. Chem. Phys. 2019, 19, 523–542. [Google Scholar] [CrossRef] [Green Version]
  10. Valenzuela, A.; Costa, M.J.; Guerrero-Rascado, J.L.; Bortoli, D.; Olmo, F.J. Solar and thermal radiative effects during the 2011 extreme desert dust episode over Portugal. Atmos. Environ. 2017, 148, 16–29. [Google Scholar] [CrossRef] [Green Version]
  11. Müller, D.; Wandinger, U.; Althausen, D.; Mattis, I.; Ansmann, A. Retrieval of physical particle properties from lidar observations of extinction and backscatter at multiple wavelengths. Appl. Opt. 1998, 37, 2260–2263. [Google Scholar]
  12. Veselovskii, I.; Kolgotin, A.; Griaznov, V.; Müller, D.; Wandinger, U.; Whitemann, D.N. Inversion with regularization for the retrieval of tropospheric aerosol parameters from multiwavelength lidar sounding. Appl. Opt. 2002, 41, 3685–3699. [Google Scholar] [CrossRef] [PubMed] [Green Version]
  13. Böckmann, C.; Osterloh, L. Runge-Kutta type regularization method for inversion of spheroidal particle distribution from limited optical data. Inverse Probl. Sci. Eng. 2014, 22, 150–165. [Google Scholar] [CrossRef]
  14. Pérez-Ramírez, D.; Whiteman, D.N.; Veselovskii, I.; Colarco, P.; Korenski, M.; da Silva, A. Retrievals of aerosol single scattering albedo by multiwavelength lidar measurements: Evaluations with NASA Langley HSRL-2 during discover-AQ field campaigns. Remote Sens. Environ. 2019, 222, 144–164. [Google Scholar] [CrossRef] [Green Version]
  15. Dubovik, O.; King, M.D. A flexible inversion algorithm for retrieval of aerosol optical properties from Sun and sky radiance measurements. J. Geophys. Res. Atmos. 2000, 105, 20673–20696. [Google Scholar] [CrossRef] [Green Version]
  16. Chaikovsky, A.; Dubovik, O.; Holben, B.; Bril, A.; Goloub, P.; Tanré, D.; Pappalardo, G.; Wandinger, U.; Chaikovskaya, L.; Denisov, S.; et al. Lidar-Radiometer Inversion Code (LIRIC) for the retrieval of vertical aerosol properties from combined lidar/radiometer data: Development and distribution in EARLINET. Atmos. Meas. Tech. 2016, 9, 1181–1205. [Google Scholar] [CrossRef] [Green Version]
  17. Granados-Muñoz, M.J.; Guerrero-Rascado, J.L.; Bravo-Aranda, J.A.; Navas-Guzmán, F.; Valenzuela, A.; Lyamani, H.; Chaikovsky, A.; Wandinger, U.; Ansmann, A.; Dubovik, O.; et al. Retrieving aerosol microphysical properties by Lidar-Radiometer Inversion Code (LIRIC) for different aerosol types. J. Geophys. Res. Atmos. 2014, 119, 4836–4858. [Google Scholar] [CrossRef] [Green Version]
  18. Lopatin, A.; Dubovik, O.; Chaikovsky, A.; Goloub, P.; Lapyonok, T.; Tanré, D.; Litvinov, P. Enhancement of aerosol characterization using synergy of lidar and sun-photometer coincident observations: The GARRLiC algorithm. Atmos. Meas. Tech. 2013, 6, 2065–2088. [Google Scholar] [CrossRef] [Green Version]
  19. Benavent-Oltra, J.A.; Román, R.; Granados-Munõz, M.J.; Pérez-Ramírez, D.; Ortiz-Amezcua, P.; Denjean, C.; Lopatin, A.; Lyamani, H.; Torres, B.; Guerrero-Rascado, J.L.; et al. Comparative assessment of GRASP algorithm for a dust event over Granada (Spain) during ChArMEx-ADRIMED 2013 campaign. Atmos. Meas. Tech. 2017, 10, 4439–4457. [Google Scholar] [CrossRef] [Green Version]
  20. Benavent-Oltra, J.A.; Román, R.; Casquero-Vera, J.A.; Pérez-Ramírez, D.; Lyamani, H.; Ortiz-Amezcua, P.; Bedoya-Velásquez, A.E.; de Arruda Moreira, G.; Barreto, Á.; Lopatin, A.; et al. Different strategies to retrieve aerosol properties at night-time with the GRASP algorithm. Atmos. Chem. Phys. 2019, 19, 14149–14171. [Google Scholar] [CrossRef] [Green Version]
  21. Dubovik, O.; Lapyonok, T.; Litvinov, P.; Herman, M.; Fuertes, D.; Ducos, F.; Torres, B.; Derimian, Y.; Huang, X.; Lopatin, A.; et al. GRASP: A versatile algorithm for characterizing the atmosphere. SPIE Newsroom 2014. [Google Scholar] [CrossRef]
  22. Herreras, M.; Román, R.; Cazorla, A.; Toledano, C.; Lyamani, H.; Torres, B.; Cachorro, V.E.; Olmo, F.J.; Alados-Arboledas, L.; de Frutos, A.M. Evaluation of retrieved aerosol extinction profiles using as reference the aerosol optical depth differences between various heights. Atmos. Res. 2019, 230. [Google Scholar] [CrossRef] [Green Version]
  23. Lyamani, H.; Olmo, F.J.; Alados-Arboledas, L. Saharan dust outbreak over southeastern Spain as detected by sun photometer. Atmos. Environ. 2005, 39, 7276–7284. [Google Scholar] [CrossRef]
  24. Valenzuela, A.; Olmo, F.J.; Lyamani, H.; Antón, M.; Quirantes, A.; Alados-Arboledas, L. Classification of aerosol radiative properties during African desert dust intrusions over southeastern Spain by sector origins and cluster analysis. J. Geophys. Res. Atmos. 2012, 117. [Google Scholar] [CrossRef]
  25. Guerrero-Rascado, J.L.; Ruiz, B.; Alados-Arboledas, L. Multi-spectral Lidar characterization of the vertical structure of Saharan dust aerosol over southern Spain. Atmos. Environ. 2008, 42, 2668–2681. [Google Scholar] [CrossRef]
  26. Guerrero-Rascado, J.L.; Olmo, F.J.; Avilés-Rodríguez, I.; Navas-Guzmán, F.; Pérez-Ramírez, D.; Lyamani, H.; Arboledas, L.A. Extreme saharan dust event over the southern iberian peninsula in september 2007: Active and passive remote sensing from surface and satellite. Atmos. Chem. Phys. 2009, 9, 8453–8469. [Google Scholar] [CrossRef] [Green Version]
  27. Cazorla, A.; Casquero-Vera, J.A.; Román, R.; Guerrero-Rascado, J.L.; Toledano, C.; Cachorro, V.E.; Orza, J.A.G.; Cancillo, M.L.; Serrano, A.; Titos, G.; et al. Near-real-time processing of a ceilometer network assisted with sun-photometer data: Monitoring a dust outbreak over the Iberian Peninsula. Atmos. Chem. Phys. 2017, 17, 11861–11876. [Google Scholar] [CrossRef] [Green Version]
  28. Lyamani, H.; Olmo, F.J.; Alados-Arboledas, L. Physical and optical properties of aerosols over an urban location in Spain: Seasonal and diurnal variability. Atmos. Chem. Phys. 2010, 10, 239–254. [Google Scholar] [CrossRef] [Green Version]
  29. Lyamani, H.; Fernández-Gálvez, J.; Pérez-Ramírez, D.; Valenzuela, A.; Antón, M.; Alados, I.; Titos, G.; Olmo, F.J.; Alados-Arboledas, L. Aerosol properties over two urban sites in South Spain during an extended stagnation episode in winter season. Atmos. Environ. 2012, 62, 424–432. [Google Scholar] [CrossRef]
  30. Alados-Arboledas, L.; Müller, D.; Guerrero-Rascado, J.L.; Navas-Guzmán, F.; Pérez-Ramírez, D.; Olmo, F.J. Optical and microphysical properties of fresh biomass burning aerosol retrieved by Raman lidar, and star-and sun-photometry. Geophys. Res. Lett. 2011, 38. [Google Scholar] [CrossRef]
  31. Ortiz-Amezcua, P.; Luis Guerrero-Rascado, J.; Granados-Munõz, M.J.; Benavent-Oltra, J.A.; Böckmann, C.; Samaras, S.; Stachlewska, I.S.; Janicka, L.; Baars, H.; Bohlmann, S.; et al. Microphysical characterization of long-range transported biomass burning particles from North America at three EARLINET stations. Atmos. Chem. Phys. 2017, 17, 5931–5946. [Google Scholar] [CrossRef] [Green Version]
  32. Sicard, M.; Granados-Muñoz, M.J.; Alados-Arboledas, L.; Barragán, R.; Bedoya-Velásquez, A.E.; Benavent-Oltra, J.A.; Bortoli, D.; Comerón, A.; Córdoba-Jabonero, C.; Costa, M.J.; et al. Ground/space, passive/active remote sensing observations coupled with particle dispersion modelling to understand the inter-continental transport of wildfire smoke plumes. Remote Sens. Environ. 2019, 232. [Google Scholar] [CrossRef] [Green Version]
  33. Titos, G.; del Águila, A.; Cazorla, A.; Lyamani, H.; Casquero-Vera, J.A.; Colombi, C.; Cuccia, E.; Gianelle, V.; Močnik, G.; Alastuey, A.; et al. Spatial and temporal variability of carbonaceous aerosols: Assessing the impact of biomass burning in the urban environment. Sci. Total Environ. 2017, 578, 613–625. [Google Scholar] [CrossRef] [PubMed] [Green Version]
  34. Lyamani, H.; Olmo, F.J.; Foyo, I.; Alados-Arboledas, L. Black carbon aerosols over an urban area in south-eastern Spain: Changes detected after the 2008 economic crisis. Atmos. Environ. 2011, 45, 6423–6432. [Google Scholar] [CrossRef]
  35. Alados-Arboledas, L.; Alcántara, A.; Olmo, F.J.; Martínez-Lozano, J.A.; Estellés, V.; Cachorro, V.; Silva, A.M.; Horvath, H.; Gangl, M.; Díaz, A.; et al. Aerosol columnar properties retrieved from CIMEL radiometers during VELETA 2002. Atmos. Environ. 2008, 42, 2654–2667. [Google Scholar] [CrossRef]
  36. Bravo-Aranda, J.A.; Navas-Guzmán, F.; Guerrero-Rascado, J.L.; Pérez-Ramírez, D.; Granados-Muñoz, M.J.; Alados-Arboledas, L. Analysis of lidar depolarization calibration procedure and application to the atmospheric aerosol characterization. Int. J. Remote Sens. 2013, 34, 3543–3560. [Google Scholar] [CrossRef]
  37. Bravo-Aranda, J.A.; Belegante, L.; Freudenthaler, V.; Alados-Arboledas, L.; Nicolae, D.; Granados-Muñoz, M.J.; Guerrero-Rascado, J.L.; Amodeo, A.; D’Amico, G.; Engelmann, R.; et al. Assessment of lidar depolarization uncertainty by means of a polarimetric lidar simulator. Atmos. Meas. Tech. 2016, 9, 4935–4953. [Google Scholar] [CrossRef]
  38. Dubovik, O.; Sinyuk, A.; Lapyonok, T.; Holben, B.N.; Mishchenko, M.; Yang, P.; Eck, T.F.; Volten, H.; Muñoz, O.; Veihelmann, B.; et al. Application of spheroid models to account for aerosol particle nonsphericity in remote sensing of desert dust. J. Geophys. Res. Atmos. 2006, 111. [Google Scholar] [CrossRef] [Green Version]
  39. Pérez-Ramírez, D.; Navas-Guzmán, F.; Lyamani, H.; Fernández-Gálvez, J.; Olmo, F.J.; Alados-Arboledas, L. Retrievals of precipitable water vapor using star photometry: Assessment with Raman lidar and link to sun photometry. J. Geophys. Res. Atmos. 2012, 117. [Google Scholar] [CrossRef] [Green Version]
  40. Estellés, V.; Utrillas, M.P.; Gómez-Amo, J.L.; Pedrós, R.; Martínez-Lozano, J.A. Aerosol size distributions and air mass back trajectories over a Mediterranean coastal site. Int. J. Remote Sens. 2004, 25, 39–50. [Google Scholar] [CrossRef]
  41. Wagner, J.; Ansmann, A.; Wandinger, U.; Seifert, P.; Schwarz, A.; Tesche, M.; Chaikovsky, A.; Dubovik, O. Evaluation of the Lidar/Radiometer Inversion Code (LIRIC) to determine microphysical properties of volcanic and desert dust. Atmos. Meas. Tech. 2013, 6, 1707–1724. [Google Scholar] [CrossRef] [Green Version]
  42. Granados-Muñoz, M.J.; Navas-Guzmán, F.; Luis Guerrero-Rascado, J.; Antonio Bravo-Aranda, J.; Binietoglou, I.; Nepomuceno Pereira, S.; Basart, S.; Baldasano, J.M.; Belegante, L.; Chaikovsky, A.; et al. Profiling of aerosol microphysical properties at several EARLINET/AERONET sites during the July 2012 ChArMEx/EMEP campaign. Atmos. Chem. Phys. 2016, 16, 7043–7066. [Google Scholar] [CrossRef] [Green Version]
  43. Guerrero-Rascado, J.L.; Costa, M.J.; Bortoli, D.; Silva, A.M.; Lyamani, H.; Alados-Arboledas, L. Infrared lidar overlap function: An experimental determination. Opt. Express 2010, 18, 20350. [Google Scholar] [CrossRef] [PubMed]
  44. Navas-Guzmán, F.; Rascado, J.L.G.; Arboledas, L.A. Retrieval of the lidar overlap function using Raman signals. Opt. Pura Apl. 2011, 44, 71–75. [Google Scholar]
  45. Basart, S.; Pérez, C.; Nickovic, S.; Cuevas, E.; Baldasano, J. Development and evaluation of the BSC-DREAM8b dust regional model over Northern Africa, the Mediterranean and the Middle East. Tellus B Chem. Phys. Meteorol. 2012, 64, 18539. [Google Scholar] [CrossRef] [Green Version]
  46. Pérez-Ramírez, D.; Lyamani, H.; Smirnov, A.; O´Neill, N.T.; Veselovskii, I.; Whiteman, D.N.; Olmo, F.J.; Alados-Arboledas, L. Statistical study of day and night hourly patterns of columnar aerosol properties using sun and star photometry. SPIE Remote Sens. 2016, 100010K. [Google Scholar] [CrossRef]
  47. Granados-Muñoz, M.J.; Bravo-Aranda, J.A.; Baumgardner, D.; Guerrero-Rascado, J.L.; Pérez-Ramírez, D.; Navas-Guzmán, F.; Veselovskii, I.; Lyamani, H.; Valenzuela, A.; Olmo, F.J.; et al. A comparative study of aerosol microphysical properties retrieved from ground-based remote sensing and aircraft in situ measurements during a Saharan dust event. Atmos. Meas. Tech. 2016, 9, 1113–1133. [Google Scholar] [CrossRef] [Green Version]
  48. Granados-Munoz, M.J.; Navas-Guzmán, F.; Bravo-Aranda, J.A.; Guerrero-Rascado, J.L.; Lyamani, H.; Fernández-Gálvez, J.; Alados-Arboledas, L. Automatic determination of the planetary boundary layer height using lidar: One-year analysis over southeastern Spain. J. Geophys. Res. Atmos. 2012, 117, 1–10. [Google Scholar] [CrossRef] [Green Version]
  49. Navas-Guzmán, F.; Bravo-Aranda, J.A.; Guerrero-Rascado, J.L.; Granados-Muñoz, M.J.; Alados-Arboledas, L. Statistical analysis of aerosol optical properties retrieved by Raman lidar over Southeastern Spain. Tellus Ser. B Chem. Phys. Meteorol. 2013, 65, 21234. [Google Scholar] [CrossRef] [Green Version]
  50. Sicard, M.; D’Amico, G.; Comerón, A.; Mona, L.; Alados-Arboledas, L.; Amodeo, A.; Baars, H.; Baldasano, J.M.; Belegante, L.; Binietoglou, I.; et al. EARLINET: Potential operationality of a research network. Atmos. Meas. Tech. 2015, 8, 4587–4613. [Google Scholar] [CrossRef] [Green Version]
Figure 1. Aerosol Robotic Network (AERONET) retrieved τ440 nm, AE (440–870 nm) and sphericity corresponding to the analysed days during summer 2012.
Remotesensing 12 00842 g001
Figure 2. Box-and-whisker plots of the volume concentration of every mode in layers of 500 m. The red cross indicates the mean value, and the central line in the box is the median. The extremes of the box correspond to the first and third quartile, and the bars indicate the standard deviation.
Remotesensing 12 00842 g002
Figure 3. Percentage of the total volume concentration distributed by layers of 250 m. The lengths of the bars indicate the contribution of every 250-m layer to the total volume concentration. The total volume concentration is calculated as the sum of the 112 profiles during the whole analysed period and the sum of the values for the entire vertical profiles. Inside each bar, the different colors (blue, red, green) indicate the apportionment to the total volume concentration in the corresponding height range by fine, coarse spherical and coarse spheroid modes, respectively.
Remotesensing 12 00842 g003
Figure 4. Frequency distribution of the volume concentration for every mode, the total coarse mode and the total volume concentration for summer 2012. Each point of the 15-m vertically resolved profiles was considered as independet to retrieve the frequency distributions. In the retrievals from Granada station, only those data corresponding to heights above 1820 m a.s.l. were considered for comparison with the retrievals from Cerro Poyos.
Remotesensing 12 00842 g004
Figure 5. Histogram of the frequency distribution of the deviations for the whole dataset corresponding to summer 2012. Deviations were obtained by subsctracting the profiles from Granada above 1820 m a.s.l., to the profiles retrieved from Cerro Poyos at every height level (15 m vertical resolution).
Remotesensing 12 00842 g005
Figure 6. Box-and-whisker plots of the deviation profiles distributed in 500-m layers for fine, coarse spherical, coarse spheroid, total coarse mode and the total volume concentration. Deviations are obtained by subtracting the retrieved volume concentration profiles from Granada above 1820 m a.s.l. to those retrieved from Cerro Poyos at every height level (15 m vertical resolution).
Remotesensing 12 00842 g006