Technical Note

Estimation of the Particulate Organic Carbon to Chlorophyll-a Ratio Using MODIS-Aqua in the East/Japan Sea, South Korea

1
Department of Oceanography, Pusan National University, Geumjeong-gu, Busan 46241, Korea
2
CIRA, Colorado State University, Fort Collins, CO 80523, USA
3
Oceanic Climate and Ecology Research Division, National Institute of Fisheries Science, Busan 46083, Korea
4
College of Marine and Environmental Sciences, Tianjin University of Science and Technology, Tianjin 300457, China
5
School of Earth Sciences & Environmental Engineering, Gwangju Institute of Science and Technology, Gwangju 61005, Korea
*
Author to whom correspondence should be addressed.
Remote Sens. 2020, 12(5), 840; https://doi.org/10.3390/rs12050840
Submission received: 30 December 2019 / Revised: 2 March 2020 / Accepted: 3 March 2020 / Published: 5 March 2020
(This article belongs to the Special Issue Satellite Derived Global Ocean Product Validation/Evaluation)

Abstract

:
In recent years, the change of marine environment due to climate change and declining primary productivity have been big concerns in the East/Japan Sea, Korea. However, the main causes for the recent changes are still not revealed clearly. The particulate organic carbon (POC) to chlorophyll-a (chl-a) ratio (POC:chl-a) could be a useful indicator for ecological and physiological conditions of phytoplankton communities and thus help us to understand the recent reduction of primary productivity in the East/Japan Sea. To derive the POC in the East/Japan Sea from a satellite dataset, the new regional POC algorithm was empirically derived with in-situ measured POC concentrations. A strong positive linear relationship (R2 = 0.6579) was observed between the estimated and in-situ measured POC concentrations. Our new POC algorithm proved a better performance in the East/Japan Sea compared to the previous one for the global ocean. Based on the new algorithm, long-term POC:chl-a ratios were obtained in the entire East/Japan Sea from 2003 to 2018. The POC:chl-a showed a strong seasonal variability in the East/Japan Sea. The spring and fall blooms of phytoplankton mainly driven by the growth of large diatoms seem to be a major factor for the seasonal variability in the POC:chl-a. Our new regional POC algorithm modified for the East/Japan Sea could potentially contribute to long-term monitoring for the climate-associated ecosystem changes in the East/Japan Sea. Although the new regional POC algorithm shows a good correspondence with in-situ observed POC concentrations, the algorithm should be further improved with continuous field surveys.

Graphical Abstract

1. Introduction

The East/Japan Sea is a semi-marginal sea located in the northwestern Pacific, and it is bordered by Korea, Japan, and Russia. Many previous studies reported that the East/Japan Sea is a productive region, especially the Ulleung Basin located in the southwestern East/Japan Sea [1,2,3,4,5,6,7]. Recently, not only the changes in environmental conditions but also alterations in biological characteristics were reported in many previous studies [4,5,6,8]. Especially, Joo et al. [5] addressed a significant declining trend of the annual primary production in the Ulleung Basin which is the biological hotspot in the East/Japan Sea. However, although many other studies have observed the changes in the East/Japan Sea, the main causes driving the recent changes remain unclear.
The particulate organic carbon (POC) to chlorophyll-a (chl-a) ratio (POC:chl-a) has been used as an important indicator for ecological and physiological state of phytoplankton. Generally, the concentrations of photosynthetic pigments in phytoplankton cells depend on the environmental factors and the physiological conditions of phytoplankton [9,10,11,12,13,14]. For instance, the POC:chl-a can be increased under high light intensity and low nitrogen supply conditions [1,5,6]. Moreover, the POC:chl-a varies according to the size structure of the phytoplankton community [15,16,17]. Therefore, understanding of spatial and temporal variations in the POC:chl-a can help us to determine the ecological and physiological conditions of a phytoplankton community. However, the existing POC-deriving algorithm using satellite ocean color data [18] is not validated in the East/Japan Sea. Although the algorithm is fully validated in global ocean, it is hard to directly apply to this small regional sea. Thus, the algorithm needs to be calibrated and the accuracy should be evaluated before applying to our study area.
Therefore, this study aims to (1) develop a new regional POC algorithm using an ocean color satellite and (2) investigate spatiotemporal variability of the POC:chl-a in the East/Japan Sea.

2. Materials and Methods

2.1. Study Area and Sampling

Total chl-a and POC concentrations were measured at 41 stations in the East/Japan Sea (16 stations in 2012, 11 stations in 2013, six stations in 2014, and eight stations in 2015, respectively; Figure 1). Northern and southern regions of the East/Japan Sea were defined as shown in Figure 1 to investigate spatial variations of POC:chl-a.
Sampling and analysis of total chl-a and POC concentrations were conducted based on Lee et al. [19]. Water samples for the total chl-a and POC concentrations of phytoplankton were collected from the surface layer using a rosette sampler with Niskin bottles. The collected water samples were immediately filtered on Whatman® glass microfiber filters (precombusted; Grade GF/F, diameter = 24 mm) using a vacuum pressure lower than 5 in. Hg. The filtered samples were frozen immediately and preserved until analysis at the laboratory. The chl-a concentrations were measured with a precalibrated fluorometer (10-AU, Turner Designs) after extraction in 90% acetone in a freezer for 24 h based on Parsons et al. [20]. The filters for POC concentrations were frozen immediately and preserved for mass spectrometric analysis at the Alaska Stable Isotope Facility of the University of Alaska Fairbanks, USA.

2.2. Satellite Datasets

We obtained the chl-a and remote sensing reflectance (Rrs) data from the MODIS (Moderate Resolution Imaging Spectroradiometer) onboard the satellite Aqua provided by the OBPG (Ocean Biology Processing Group at NASA Goddard Space Flight Center; https://oceandata.sci.gsfc.nasa.gov/MODIS-Aqua/). We used the Level-3 daily composite datasets covering the East/Japan Sea from July 2002 to December 2018 at 4-km of spatial resolution [21,22].
The POC derivation algorithm for the East/Japan Sea was empirically derived with our in-situ observation data. Based on the Stramski et al. [18], a power–law relationship between a blue-to-green band ratio of Rrs and POC were used to estimate POC concentrations. The equation for the algorithm is expressed below:
P O C = a × ( R r s ( 443 ) R r s   b e t w e e n   547   a n d   565   n m ) b
where a and b are constants. Constants were determined empirically by regression analysis with our in-situ dataset. The input wavelength for the green band can be replaced with available band between 547 and 565 nm. In this study, Rrs(443) and Rrs(547) which are available bands of MODIS were used as input wavelengths for blue-to-green band ratio for the POC algorithm.
POC:chl-a ratios were calculated by dividing our estimated POC concentrations by remotely sensed chl-a concentrations. Monthly composited data for POC and POC:chl-a were obtained by averaging daily data for each month.

3. Results

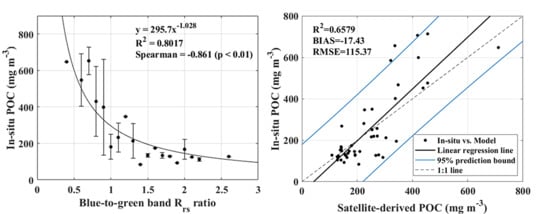
3.1. POC Algorithm Derivation

In-situ measured POC concentrations ranged from 84.07 to 713.69 mg m−3, and the average was 262.93 ± 205.82 mg m−3. The blue-to-green band Rrs ratio were extracted from MODIS-Aqua monthly composite datasets. To determine two constants in the POC algorithm, a and b, the curve fitting using nonlinear regression between Rrs ratio and in-situ POC concentration was conducted (Figure 2a).
From this result, the constants a and b were determined as 295.7 and −1.028, respectively. Based on these two constants, the POC algorithm was derived as follows:
P O C = 295.7 × ( R r s ( 443 ) R r s ( 547 ) ) 1.028
The determination coefficient (R2) and Spearman’s correlation coefficient for the relationship between Rrs ratio and in-situ POC concentrations were 0.8017 and −0.861, respectively (Figure 2a). The POC concentrations derived from the regional model also showed a strong linear relationship with in-situ measured POC concentrations (R2 = 0.6579), and most of the satellite-derived POC were plotted within 95% prediction bounds (Figure 2b).
The new POC algorithm showed lower RMSE and bias in comparison to the existing algorithm [18] in the East/Japan Sea (Figure 3). The RMSE and bias of the new algorithm were 115.37 and −17.43, respectively, and those of Stramski et al. [18] were 161.47 and −97.29, respectively.
The POC concentrations were derived for the East/Japan Sea from our new regional algorithm (Figure 4). The climatological monthly mean POC (January 2003–December 2018) showed a seasonal variation of the POC concentration in the East/Japan Sea (Figure 4). Generally, the POC concentrations were relatively higher during spring season, and the lowest POC concentrations were observed during summer season.

3.2. POC:chl-a

The climatological monthly distribution of the POC:chl-a (January 2003–December 2018) in the East/Japan Sea showed strong seasonal variations (Figure 5). In contrast to the seasonal pattern of POC, relatively lower POC:chl-a ratios were observed during spring and autumn compared to those during winter and summer.
The ranges of the mean POC:chl-a in the northern and southern East/Japan Sea were 169.6–528.4 and 172.4–549.3, respectively (Figure 6). Domains for the two regions are shown in Figure 1. The average of POC:chl-a in the northern and southern regions of the East/Japan Sea were 377.6 ± 80.4 and 388.1 ± 69.7, respectively. No statistically significant difference in POC:chl-a was observed between the northern and southern regions (t-test, p > 0.05).
The POC:chl-a showed a strong seasonal variation (Figure 7). Climatological monthly mean POC:chl-a showed the lowest values during April (270.3 ± 74.7 and 261.9 ± 60.9 for the northern and southern East/Japan Sea, respectively), and the highest values were observed during August (461.0 ± 18.1) and July (451.5 ± 23.6) for the northern and southern East/Japan Sea, respectively (Figure 7). The POC:chl-a during spring and autumn were significantly lower than summer and winter (t-test, p < 0.01).

4. Discussion

4.1. New Regional POC Algorithm

Since the POC algorithm reported by Stramski et al. [18] was developed for the eastern South Pacific and eastern Atlantic Oceans, we validated and modified the algorithm to derive a suitable POC model for the East/Japan Sea. The previously reported POC algorithm by Stramski et al. [18] tends to underestimate the POC concentrations in the East/Japan Sea (Figure 3). However, our modified regional POC algorithm showed significantly improved accuracy in the East/Japan Sea, and the POC concentrations estimated from the regional algorithm derived in this study showed a strong linear relationship with in-situ measured POC concentrations and its linear regression line located near the 1:1 line (Figure 3).
However, only 41 data points were used to derive the POC model in this study, and in fact, the number of data points could not be considered sufficient. Nevertheless, the modified POC model showed a good correspondence with field measured POC concentrations. If continuous field observations and the calibration and validation of the algorithm are conducted, the POC algorithm with a better performance would be derived.

4.2. Spatial and Temporal Variability of the POC:chl-a

The seasonal variation of the POC:chl-a in the East/Japan Sea would be closely related with the physiological conditions of phytoplankton communities. Generally, phytoplankton tend to accumulate more carbon in their cells under the high light intensity and nutrient depleted conditions [9,13,14,23,24]. Phytoplankton increase their chl-a contents to maximize light absorption under the low light condition [11,25,26]. Moreover, many previous studies reported that the carbon to chl-a ratio of phytoplankton decreases with increased growth rate [14,27,28,29,30]. The size structure of the phytoplankton community also can affect the carbon to chl-a ratio [15,16,17]. Small cell-sized phytoplankton such as flagellates usually show higher carbon to chl-a ratio than large cell-sized phytoplankton such as diatoms [15,16,17]. However, the daily carbon uptake rate by phytoplankton tends to be lowered when the productivity contribution of picoplankton to the total primary production is high [31,32]. It suggests that the investigation of POC:chl-a in the East/Japan Sea can provide some potential clues on the recent changes of primary productivity in the East/Japan Sea.
In general, there are two phytoplankton blooms per year in the East/Japan Sea; spring bloom and fall bloom [4,5,33,34,35]. Signals of the blooms were also observed in the climatological monthly mean distribution of the POC (Figure 3). The strongest bloom occurs during spring season while the weaker blooms appears in fall. Both spring and fall blooms are mainly caused by the massive growth of diatoms [3,4,33,35,36]. During spring and fall blooms, the size distribution of phytoplankton cells would shift from smaller to larger size due to the rapid growth of diatoms. Consequently, lower POC:chl-a during spring and fall might be caused by the bloom mainly driven by the growth of diatoms. However, these suggestions are only our hypothesis based on several previous studies. To understand the temporal variation of the POC:chl-a in the East/Japan Sea, further research with field observations is needed.
On the other hand, the timing of spring bloom showed a difference in the northern and southern regions of the East/Japan Sea (Figure 3 and Figure 4). POC concentrations were highest in April in the southern region and highest in May in the northern region. Additionally, the distribution of POC:chl-a during April and May appeared to be the opposite of POC concentrations. Other previous studies have also observed a similar spatial distribution of chl-a in the East/Japan Sea with satellite datasets [37,38]. Those spatiotemporal distributions of POC concentrations and POC:chl-a suggest that the spring bloom occurs earlier in the southern regions of the East/Japan Sea.

5. Summary and Conclusions

In this study, the regional POC algorithm for the East/Japan Sea was derived empirically using in-situ measured POC and MODIS-Aqua satellite datasets. In-situ measured POC concentrations at the 41 stations in the East/Japan Sea were used to calibrate and validate our new regional POC algorithm. The power–law relationship between POC concentration and blue-to-green band of remote sensing reflectance, Rrs(443)/Rrs(547), was used to derive the algorithm based on Stramski et al. [18] (Figure 2a).
The algorithm showed a good correspondence with in-situ measured POC concentrations in the East/Japan Sea (Figure 2b). Based on the result, the monthly mean POC concentration and POC:chl-a were derived in the East/Japan Sea.
Both POC concentration and POC:chl-a showed strong seasonality in the East/Japan Sea. POC concentrations were relatively higher and POC:chl-a ratios were lower in spring and fall seasons which are typical blooming periods in the East/Japan Sea. The seasonal variation of POC:chl-a in the East/Japan Sea might be closely related with the community structure of phytoplankton. Many previous studies previously reported that the POC:chl-a of large-sized phytoplankton tends to be relatively lower than that of small cell-sized phytoplankton [15,16,17]. Spring and fall blooms in the East/Japan Sea are generally triggered by the intense growth of diatoms [3,4,33,35,36]. The size structure of phytoplankton communities can shift from small to large due to the massive growth of diatoms during the bloom periods, resulting in relatively lower POC:chl-a.
Although the POC algorithm derived in this study showed good agreement with field observation results, the number of in-situ data is not sufficient. The regional POC algorithm suggested in this study should be considered as a pilot version, and continuous field observations must be conducted to improve the regional POC algorithm.

Author Contributions

Conceptualization, D.L. and S.H.L.; Data curation, D.L. and H.J.; Funding acquisition, C.-K.K. and S.H.L.; Methodology, D.L.; Investigation, D.L., H.J., K.K., M.J.K., H.K.J., and M.S.Y.; Project administration, C.-K.K. and S.H.L.; Supervision, S.S. and S.H.L.; Validation, D.L.; Visualization, D.L.; Writing―original draft, D.L.; Writing―review and editing, S.S. and S.H.L. All authors have read and agreed to the published version of the manuscript.

Funding

This research was supported by “Long-term change of structure and function in marine ecosystems of Korea”, “Improvements of ocean prediction accuracy using numerical modeling and artificial intelligence technology” and “Technology development for Practical Applications of Multi-Satellite data to maritime issues” funded by the Ministry of Ocean and Fisheries, Korea.

Acknowledgments

The authors would like to thank the anonymous reviewers and the handling editors who dedicated their time to providing the authors with constructive and valuable recommendations.

Conflicts of Interest

The authors declare no conflict of interest.

References

  1. Yamada, K.; Ishizaka, J.; Nagata, H. Spatial and temporal variability of satellite primary production in the Japan Sea from 1998 to 2002. J. Oceanogr. 2005, 61, 857–869. [Google Scholar] [CrossRef]
  2. Yoo, S.; Park, J. Why is the southwest the most productive region of the East Sea/Sea of Japan? J. Mar. Syst. 2009, 78, 301–315. [Google Scholar] [CrossRef]
  3. Kwak, J.H.; Lee, S.H.; Park, H.J.; Choy, E.J.; Jeong, H.D.; Kim, K.R.; Kang, C.K. Monthly measured primary and new productivities in the Ulleung Basin as a biological “hot spot” in the East/Japan Sea. Biogeosciences 2013, 10, 4405–4417. [Google Scholar] [CrossRef] [Green Version]
  4. Lee, S.H.; Son, S.; Dahms, H.U.; Park, J.W.; Lim, J.H.; Noh, J.H.; Kwon, J.I.; Joo, H.T.; Jeong, J.Y.; Kang, C.K. Decadal changes of phytoplankton chlorophyll-a in the East Sea/Sea of Japan. Oceanology 2014, 54, 771–779. [Google Scholar] [CrossRef]
  5. Joo, H.; Park, J.W.; Son, S.; Noh, J.H.; Jeong, J.Y.; Kwak, J.H.; Saux-Picart, S.; Choi, J.H.; Kang, C.K.; Lee, S.H. Long-term annual primary production in the Ulleung Basin as a biological hot spot in the East/Japan Sea. J. Geophys. Res. Oceans 2014, 119, 3002–3011. [Google Scholar] [CrossRef] [Green Version]
  6. Kim, K.; Kim, K.R.; Min, D.H.; Volkov, Y.; Yoon, J.H.; Takematsu, M. Warming and structural changes in the east (Japan) sea: A clue to future changes in global oceans? Geophys. Res. Lett. 2001, 28, 3293–3296. [Google Scholar] [CrossRef]
  7. Jo, N.; Kang, J.J.; Park, W.G.; Lee, B.R.; Yun, M.S.; Lee, J.H.; Kim, S.M.; Lee, D.; Joo, H.T.; Lee, J.H.; et al. Seasonal variation in the biochemical compositions of phytoplankton and zooplankton communities in the southwestern East/Japan Sea. Deep. Res. Part II Top. Stud. Oceanogr. 2017, 143, 82–90. [Google Scholar] [CrossRef]
  8. Kang, D.J.; Park, S.; Kim, Y.G.; Kim, K.; Kim, K.R. A moving-boundary box model (MBBM) for oceans in change: An application to the East/Japan Sea. Geophys. Res. Lett. 2003, 30. [Google Scholar] [CrossRef]
  9. Geider, R.J. Light and temperature dependence of the carbon to chlorophyll a ratio in microalgae and cyanobacteria: Implications for physiology and growth of phytoplankton. New Phytol. 1987, 106, 1–34. [Google Scholar] [CrossRef]
  10. Riemann, B.; Simonsen, P.; Stensgaard, L. The carbon and chlorophyll content of phytoplankton from various nutrient regimes. J. Plankton Res. 1989, 11, 1037–1045. [Google Scholar] [CrossRef] [Green Version]
  11. Jakobsen, H.H.; Markager, S. Carbon-to-chlorophyll ratio for phytoplankton in temperate coastal waters: Seasonal patterns and relationship to nutrients. Limnol. Oceanogr. 2016, 61, 1853–1868. [Google Scholar] [CrossRef]
  12. Lee, D.; Jeong, J.-Y.; Jang, H.K.; Min, J.-O.; Kim, M.J.; Youn, S.H.; Lee, T.; Lee, S.H. Comparison of Particulate Organic Carbon to Chlorophyll-a Ratio Based on the Ocean Color Satellite Data at the Ieodo and Socheongcho Ocean Research Stations. J. Coast. Res. 2019, 90, 267. [Google Scholar] [CrossRef]
  13. Thompson, P.A.; Guo, M.-x.; Harrison, P.J. Effects of variation in temperature. I. on the biochemical composition of eight species of marine phytoplankton. J. Phycol. 1992, 28, 481–488. [Google Scholar] [CrossRef]
  14. Wang, X.J.; Behrenfeld, M.; Le Borgne, R.; Murtugudde, R.; Boss, E. Regulation of phytoplankton carbon to chlorophyll ratio by light, nutrients and temperature in the equatorial pacific ocean: A basin-scale model. Biogeosciences 2009, 6, 391–404. [Google Scholar] [CrossRef] [Green Version]
  15. Stramski, D. Refractive index of planktonic cells as a measure of cellular carbon and chlorophyll a content. Deep. Res. Part I Oceanogr. Res. Pap. 1999, 46, 335–351. [Google Scholar] [CrossRef]
  16. Sathyendranath, S.; Stuart, V.; Nair, A.; Oka, K.; Nakane, T.; Bouman, H.; Forget, M.H.; Maass, H.; Platt, T. Carbon-to-chlorophyll ratio and growth rate of phytoplankton in the sea. Mar. Ecol. Prog. Ser. 2009, 383, 73–84. [Google Scholar] [CrossRef]
  17. Roy, S.; Sathyendranath, S.; Platt, T. Size-partitioned phytoplankton carbon and carbon-to-chlorophyll ratio from ocean colour by an absorption-based bio-optical algorithm. Remote Sens. Environ. 2017, 194, 177–189. [Google Scholar] [CrossRef] [Green Version]
  18. Stramski, D.; Reynolds, R.A.; Babin, M.; Kaczmarek, S.; Lewis, M.R.; Röttgers, R.; Sciandra, A.; Stramska, M.; Twardowski, M.S.; Franz, B.A.; et al. Relationships between the surface concentration of particulate organic carbon and optical properties in the eastern South Pacific and eastern Atlantic Oceans. Biogeosciences 2008, 5, 171–201. [Google Scholar] [CrossRef] [Green Version]
  19. Lee, S.H.; Joo, H.T.; Lee, J.H.; Lee, J.H.; Kang, J.J.; Lee, H.W.; Lee, D.; Kang, C.K. Seasonal carbon uptake rates of phytoplankton in the northern East/Japan Sea. Deep. Res. Part II Top. Stud. Oceanogr. 2017, 143, 45–53. [Google Scholar] [CrossRef]
  20. Parsons, T.R.; Maita, C.M.; Lalli, C.M. A Manual of Chemical & Biological Methods for Seawater Analysis; Pergamon Press: New York, NY, USA, 1984. [Google Scholar]
  21. NASA Goddard Space Flight Center, Ocean Ecology Laboratory, Ocean Biology Processing Group. Moderate-Resolution Imaging Spectroradiometer (MODIS) Aqua Chlorophyll Data; NASA OB.DAAC: Greenbelt, MD, USA, 2018. [Google Scholar]
  22. NASA Goddard Space Flight Center, Ocean Ecology Laboratory, Ocean Biology Processing Group. Moderate-Resolution Imaging Spectroradiometer (MODIS) Aqua Remote-Sensing Reflectance Data; NASA OB.DAAC: Greenbelt, MD, USA, 2018. [Google Scholar]
  23. Morgan, K.C.; Kalff, J. Effect of light and temperature interactions on growth of cryptomonas erosa (cryptophyceae) 1. J. Phycol. 1979, 15, 127–134. [Google Scholar] [CrossRef]
  24. Terry, K.L.; Hirata, J.; Laws, E.A. Light-limited growth of two strains of the marine diatom Phaeodactylum tricornutum Bohlin: Chemical composition, carbon partitioning and the diel periodicity of physiological processes. J. Exp. Mar. Biol. Ecol. 1983, 68, 209–227. [Google Scholar] [CrossRef]
  25. Beardall, J.; Morris, I. The concept of light intensity adaptation in marine phytoplankton: Some experiments with Phaeodactylum tricornutum. Mar. Biol. 1976, 37, 377–387. [Google Scholar] [CrossRef]
  26. Markager, S. Light absorption and quantum yield for growth in five species of marine macroalga. J. Phycol. 1993, 29, 54–63. [Google Scholar] [CrossRef]
  27. Geider, R.J.; MacIntyre, H.L.; Kana, T.M. A dynamic regulatory model of phytoplanktonic acclimation to light, nutrients, and temperature. Limnol. Oceanogr. 1998, 43, 679–694. [Google Scholar] [CrossRef]
  28. Le Bouteiller, A.; Leynaert, A.; Landry, M.R.; Le Borgne, R.; Neveux, J.; Rodier, M.; Blanchot, J.; Brown, S.L. Primary production, new production, and growth rate in the equatorial Pacific: Changes from mesotrophic to oligotrophic regime. J. Geophys. Res. C Oceans 2003, 108, 8141. [Google Scholar] [CrossRef]
  29. Behrenfeld, M.J.; Boss, E.; Siegel, D.A.; Shea, D.M. Carbon-based ocean productivity and phytoplankton physiology from space. Glob. Biogeochem. Cycles 2005, 19, 1–14. [Google Scholar] [CrossRef]
  30. Armstrong, R.A. Optimality-based modeling of nitrogen allocation and photoacclimation in photosynthesis. Deep. Res. Part II Top. Stud. Oceanogr. 2006, 53, 513–531. [Google Scholar] [CrossRef]
  31. Agawin, N.S.R.; Duarte, C.M.; Agustí, S. Nutrient and temperature control of the contribution of picoplankton to phytoplankton biomass and production. Limnol. Oceanogr. 2000, 45, 591–600. [Google Scholar] [CrossRef]
  32. Lee, S.H.; Kim, B.K.; Lim, Y.J.; Joo, H.T.; Kang, J.J.; Lee, D.; Park, J.; Ha, S.Y.; Lee, S.H. Small phytoplankton contribution to the standing stocks and the total primary production in the Amundsen Sea. Biogeosciences 2017, 14, 3705–3713. [Google Scholar] [CrossRef] [Green Version]
  33. Lee, J.-Y.; Kang, D.-J.; Kim, I.-N.; Rho, T.; Lee, T.; Kang, C.-K.; Kim, K.-R. Spatial and temporal variability in the pelagic ecosystem of the East Sea (Sea of Japan): A review. J. Mar. Syst. 2009, 78, 288–300. [Google Scholar] [CrossRef]
  34. Joo, H.T.; Son, S.H.; Park, J.W.; Kang, J.J.; Jeong, J.Y.; Lee, C.; Kang, C.K.; Lee, S.H. Long-term pattern of primary productivity in the East/Japan sea based on ocean color data derived from MODIS-Aqua. Remote Sens. 2016, 8, 25. [Google Scholar] [CrossRef] [Green Version]
  35. Chang, K.I.; Zhang, C.I.; Park, C.; Kang, D.J.; Ju, S.J.; Lee, S.H.; Wimbush, M. Oceanography of the East Sea (Japan Sea); Chang, K.-I., Zhang, C.-I., Park, C., Kang, D.-J., Ju, S.-J., Lee, S.-H., Wimbush, M., Eds.; Springer International Publishing: Cham, Switzerland, 2016; ISBN 978-3-319-22719-1. [Google Scholar]
  36. Zuenko, Y.; Selina, M.; Stonik, I. On Conditions of Phytoplankton Blooms in the Coastal Waters of the North-Western East/Japan Sea. Ocean Sci. J. 2006, 41, 31–41. [Google Scholar] [CrossRef]
  37. Yamada, K.; Ishizaka, J.; Yoo, S.; Kim, H.C.; Chiba, S. Seasonal and interannual variability of sea surface chlorophyll a concentration in the Japan/East Sea (JES). Prog. Oceanogr. 2004, 61, 193–211. [Google Scholar] [CrossRef]
  38. Jo, C.O.; Park, S.; Kim, Y.H.; Park, K.A.; Park, J.J.; Park, M.K.; Li, S.; Kim, J.Y.; Park, J.E.; Kim, J.Y.; et al. Spatial distribution of seasonality of SeaWiFS chlorophyll-a concentrations in the East/Japan Sea. J. Mar. Syst. 2014, 139, 288–298. [Google Scholar] [CrossRef]
Figure 1. In-situ measurement stations in the East/Japan Sea from 2012 to 2015. Black triangles, blue diamonds, red circles, and orange squares indicate the stations measured in 2012, 2013, 2014, and 2015, respectively. Black lines indicate domains for northern and southern regions of the East/Japan Sea.
Remotesensing 12 00840 g001
Figure 2. (a) Power–law relationship between blue-to-green band ratio and in-situ measured particulate organic carbon (POC) concentrations and (b) linear relationship between POC derived by the algorithm and in-situ measured POC concentrations.
Remotesensing 12 00840 g002
Figure 3. Validation results for the new POC algorithm (blue circles) and Stramski et al. [18] (orange crosses). Black dashed line represents 1:1 line. Blue and orange solid lines represent the linear regression lines between in-situ POC and the modeled POC derived from the new algorithm and Stramski et al. [18], respectively.
Remotesensing 12 00840 g003
Figure 4. Climatological monthly mean distribution of the POC in the East/Japan Sea (2003 January–2018 December).
Remotesensing 12 00840 g004
Figure 5. Climatological monthly mean distribution of the POC:chl-a in the East/Japan Sea (January 2003–December 2018).
Remotesensing 12 00840 g005
Figure 6. Time-series of monthly mean POC:chl-a in the northern (blue) and southern (orange) East/Japan Sea (January 2003–December 2018).
Remotesensing 12 00840 g006
Figure 7. Time-series of climatological monthly mean POC:chl-a in the northern (blue) and southern (orange) East/Japan Sea (January 2003–December 2018). Vertical lines indicate standard deviations of the climatological monthly mean POC:chl-a.
Remotesensing 12 00840 g007

